Embed Size (px)
Citation preview

UNIVERSIDADE TÉCNICA DE LISBOA
INSTITUTO SUPERIOR TÉCNICO
Traffic Analysis at the Radio Interface in Converging Mobile and Wireless
Communication Systems
Jorge Manuel Tavares Aguiar
(Licenciado)
Dissertation submitted for obtaining the degree of Master
in Electrical and Computer Engineering
Supervisor: Doctor Luís Manuel de Jesus Sousa Correia
President: Doctor Luís Manuel de Jesus Sousa Correia
Members: Doctor Henrique José Almeida da Silva
Doctor Rui Manuel Rodrigues Rocha
December 2003


To Gabriela and my parents


Acknowledgements
Acknowledgements First of all, I would like to thank Prof. Luís Correia for having supervised this work and for
providing all the means for its development. His discipline, with weekly support, and constant
work directives/guidelines, were a key factor for the completion of an ambitious and
comprehensive project within the timeframe of a Masters thesis.
To Instituto de Telecomunicações, I would like to add a special recognition for providing the working
space where the development of this work took place.
I would also like to emphasize the important contributions of Ericsson, by means of a one year
Master scholarship, and of the European IST framework, which also partially funded this work,
produced within the scope of the FLOWS project.
The contact with my WP1 and WP6 “FLOWS colleagues” was also very important for routing
the path in the development of the concept underlying this work. From the IST FLOWS team, I
would like to thank in particular João Gil, Filipe Cardoso and António Serrador, for the fruitful
technical discussions and for their friendship.
A special thanks to the Image Group of Instituto de Telecomunicações, in particular to my
colleague and patient friend João Ascenso, for the many long discussions and the support in
respect to the video aspects covered in this thesis.
To the colleagues with whom I shared the working place throughout these last two years, Lúcio
Ferreira, Carla Oliveira, José Nascimento, André Lourenço, Paulo Marques, Gonçalo Carpinteiro,
David Xavier, Jorge Venes, Silvia Taccori, Manuele Bicego and Jacek Olejniczak, I would like to
thank for providing an excellent friendly and cheerful working environment.
From Gabriela, I received constant encouragement, motivation and support, in first place for
starting a Master Thesis, and then throughout the whole development of this work.
I would also like to thank my parents, my brother and my sister for their unconditional and
constant support throughout this journey.


Abstract
vii
Abstract
Abstract This work analyses the overall performance at the radio interface of a converged multi-
technology network, with the aid of a newly developed simulation platform. Three technologies
are considered: GSM/GPRS, UMTS and HIPERLAN/2. Three major performance indicators
are used for the analysis: CS calls blocking rate, % of PS discarded packets/frames and mean
bitrate obtained per PS application.
A key and novel concept adopted in this work is the Convergence Manager. This new element,
which is present at both terminal and network sides, is responsible for the implementation of all
convergence functionalities in the overall network.
Six different applications were considered and characterised for user traffic generation: Voice
Call, Video Call, Video on Demand, Web Browsing, Email and FTP. Traffic source models, as
well as call/session generation and duration processes, have been implemented for each of these
applications, based on an extensive literature survey.
From the statistical analysis of user traffic variations performed in this work, it has been verified
that results obtained from single simulation runs allow a reasonable degree of confidence,
reducing the number of needed simulation runs per scenario.
As expected, the performance indicators degrade with the increase of the number of users for a
specific technology scenario, and better overall performances are achieved when more
technologies are available for a specific user scenario (specially if HIPERLAN/2 is available).
It has been verified that, for instance, a single cell scenario with all three technologies available
supports up to 700 users with acceptable performance margins.
Keywords Traffic, Radio Interface, Convergence, GSM/GPRS, UMTS, HIPERLAN/2, Simulation.

Traffic Analysis at the Radio Interface in Converging Mobile and Wireless Communication Systems
viii
Resumo
ix
Resumo
Resumo Este trabalho analisa o desempenho global da interface rádio de uma rede multi-tecnológica com
convergência, com o auxílio de um novo simulador desenvolvido para tal. São consideradas três
tecnologias: GSM/GPRS, UMTS e HIPERLAN/2. Na análise são utilizados três indicadores
principais de desempenho: taxa de bloqueio de chamadas, % de pacotes/tramas descartados e
débito binário médio.
Um conceito chave e novo utilizado neste trabalho é o Gestor de Convergência. Este novo
elemento, que se localiza tanto do lado do terminal como do lado da rede, é responsável por
todas as funcionalidades de convergência.
Para geração de tráfego dos utilizadores, foram consideradas e caracterizadas seis aplicações:
Chamada de Voz, Chamada de Video, Video on Demand, Web Browsing, Email e FTP. Para cada
uma destas aplicações foram implementados modelos de fonte, assim como processos de geração
e duração de chamadas/sessões, baseado numa extensa pesquisa bibliográfica.
Da análise estatística de variações do tráfego de utilizador efectuada neste trabalho, foi verificado
que os resultados obtidos de simulações únicas fornecem um grau de confiança razoável,
permitindo a redução do número de simulações necessárias por cenário.
Como esperado, os indicadores de desempenho degradam-se com o aumento do número de
utilizadores para cada cenário tecnológico, e melhores desempenhos globais são obtidos à medida
que maior número de tecnologias são disponibilizadas para um determinado cenário de
utilizadores (especialmente quando HIPERLAN/2 está disponível).
Foi verificado que, por exemplo, um cenário unicelular com todas as três tecnologias disponíveis
suporta até 700 utilizadores com margens de desempenho aceitáveis.
Palavras-chave Tráfego, Interface Rádio, Convergência, GSM/GPRS, UMTS, HIPERLAN/2, Simulação.

Traffic Analysis at the Radio Interface in Converging Mobile and Wireless Communication Systems
x

Table of Contents
xi
Table of Contents
Table of Contents Acknowledgements........................................................................................... v
Abstract ...........................................................................................................vii
Resumo ............................................................................................................ix
Table of Contents.............................................................................................xi
List of Figures ................................................................................................. xv
List of Tables .................................................................................................xix
List of Abbreviations......................................................................................xxi
List of Symbols.............................................................................................xxix
1 Introduction ............................................................................................ 1
1.1 Overview......................................................................................................... 2
1.2 Motivation and Contents .............................................................................. 7
2 Technologies Overview ........................................................................ 13
2.1 The GSM/GPRS system ............................................................................14
2.1.1 Introduction .................................................................................................................... 14 2.1.2 System architecture ........................................................................................................ 15 2.1.3 Radio interface capacity aspects ................................................................................... 17
2.2 The UMTS system (FDD mode)...............................................................24
2.2.1 Introduction .................................................................................................................... 24 2.2.2 System architecture ........................................................................................................ 25

Traffic Analysis at the Radio Interface in Converging Mobile and Wireless Communication Systems
xii
2.2.3 Radio interface capacity aspects ................................................................................... 27
2.3 The HIPERLAN/2 system........................................................................36
2.3.1 Introduction .................................................................................................................... 36 2.3.2 System architecture ........................................................................................................ 37 2.3.3 Radio interface capacity aspects ................................................................................... 38
3 Services Characterisation and Traffic Source Models ......................... 45
3.1 Services characterisation .............................................................................46
3.1.1 Definitions....................................................................................................................... 46 3.1.2 Service capabilities.......................................................................................................... 47 3.1.3 Service classes ................................................................................................................. 49 3.1.4 Selected services and applications description and characterisation....................... 53
3.2 Traffic source models..................................................................................58
3.2.1 Initial Considerations ..................................................................................................... 58 3.2.2 Conversational type traffic models .............................................................................. 59 3.2.3 Streaming type traffic models ....................................................................................... 69 3.2.4 Interactive type traffic models...................................................................................... 72 3.2.5 Background type traffic models ................................................................................... 75 3.2.6 Summary table of traffic source models ..................................................................... 77 3.2.7 Call/session generation and duration processes ........................................................ 80
3.3 Mapping of technologies versus services and traffic source models.....81
4 Simulator Description........................................................................... 85
4.1 Simulator Overview.....................................................................................86
4.2 User Traffic Generation..............................................................................88
4.3 Traffic Processing Engine ..........................................................................95
4.4 Output Parameters ....................................................................................106
5 Analysis of Results ...............................................................................121
5.1 Scenarios Description ...............................................................................122
5.2 Statistical Analysis......................................................................................128

Table of Contents
xiii
5.3 User Scenarios Variation...........................................................................133
5.4 Access Technology Scenarios Variation .................................................142
6 Conclusions..........................................................................................147
Annex 1 - Validation of Random Number Generators .................................155
Annex 2 - User Scenarios Variation Results..................................................163
Annex 3 - Access Technology Scenarios Variation Results..........................171
References ......................................................................................................181

Traffic Analysis at the Radio Interface in Converging Mobile and Wireless Communication Systems
xiv

List of Figures
xv
List of Figures
List of Figures Figure 1.1. The multi-technology access network (extracted from [VLLX02]). ...........................3 Figure 1.2. Support for user data rate versus mobility as provided by the GSM/GPRS,
UMTS and HIPERLAN/2 (adapted from [ACGN02]). .............................................8 Figure 1.3. Network structure under consideration. .........................................................................9 Figure 2.1. Functional architecture of the GSM/GPRS mobile radio network (based on
[Walk00]). ..........................................................................................................................16 Figure 2.2. Physical channels using FDMA and TDMA (extracted from [Walk00]). ................19 Figure 2.3. Structure of a TDMA frame (extracted from [Walk00]).............................................19 Figure 2.4. Structure of the GSM TDMA frames, multiframes, superframes and
hyperframes (extracted from [Walk00])........................................................................21 Figure 2.5. Network Elements in an UMTS PLMN (extracted from [HoTo00]).......................26 Figure 2.6. UTRAN architecture (extracted from [HoTo00]). ......................................................26 Figure 2.7. IMT-2000 spectrum allocation in Europe, Japan, Korea and USA (based on
[HoTo00]). ........................................................................................................................27 Figure 2.8. UTRA transmission: spreading and modulation..........................................................30 Figure 2.9. HIPERLAN/2 network structure (extracted from [KrSa01]). ..................................37 Figure 2.10. HIPERLAN/2 protocol reference model (extracted from [John99]). ...................39 Figure 2.11. MAC frame structure in HIPERLAN/2 (extracted from [KrSa01]). .....................40 Figure 3.1. Voice activity and silence periods in a circuit switched voice call (extracted
from [Vlah01]). .................................................................................................................59 Figure 3.2. Voice activity model (ON-OFF model) (extracted from [NaGT91]).......................60 Figure 3.3. Voice source model (extracted from [VaRF99]). .........................................................61 Figure 3.4. IP telephony transmission session..................................................................................62 Figure 3.5. Typical WWW session (adapted from [ETSI98]).........................................................73 Figure 3.6. Classification of non-real time IP traffic streams (extracted from [KlLL01]). ......76 Figure 4.1. General structure of the simulator. ................................................................................86 Figure 4.2. UTGM’s functional process. ...........................................................................................88 Figure 4.3. Voice Call TSMIMs’ Outputs. ........................................................................................91 Figure 4.4. Video Call TSMIMs’ Outputs. ........................................................................................91

Traffic Analysis at the Radio Interface in Converging Mobile and Wireless Communication Systems
xvi
Figure 4.5. Video on Demand TSMIMs’ Outputs...........................................................................93 Figure 4.6. Web Browsing (WWW) TSMIMs’ Outputs..................................................................93 Figure 4.7. Email TSMIMs’ Outputs. ................................................................................................94 Figure 4.8. FTP TSMIMs’ Outputs....................................................................................................94 Figure 4.9. Traffic Processing Engine. ..............................................................................................95 Figure 4.10. Convergence Manager Module.....................................................................................97 Figure 4.11. Traffic Processing Algorithm – Circuit Switched Applications............................ 104 Figure 4.12. Traffic Processing Algorithm – Packet Switched Applications. ........................... 105 Figure 4.13. Active Sessions and Ratio Active Sessions/Active MTs. ...................................... 110 Figure 4.14. Active Sessions per Application (Voice Call, Video Call and Video on
Demand). ....................................................................................................................... 111 Figure 4.15. Active Sessions per Application (WWW, FTP and Email). .................................. 111 Figure 4.16. Active Sessions per Access Technology................................................................... 112 Figure 4.17. Number of CS Calls and CS Blocked Calls. ............................................................ 113 Figure 4.18. Blocking Rate per CS Application............................................................................. 113 Figure 4.19. CS Calls Blocking Rate per Access Technology...................................................... 114 Figure 4.20. Average Call/Session Duration per Application..................................................... 114 Figure 4.21. Generated Traffic per CS Application...................................................................... 115 Figure 4.22. Number of Transmitted Packets/Frames and Discarded Packets/Frames
per PS Application........................................................................................................ 115 Figure 4.23. Percentage of Discarded Packets/Frames per PS Application............................. 117 Figure 4.24. WWW Application Discarded Packets per Access Technology........................... 117 Figure 4.25. Mean Bitrate per PS Application............................................................................... 118 Figure 4.26. CMM Technology Decision Percentage – WWW and FTP applications. .......... 118 Figure 4.27. CMM Bitrate/Quality Decision Percentage - Email Application......................... 119 Figure 4.28. Normalised Capacity Usage per Access Technology. ............................................ 119 Figure 5.1. Main components for the characterisation of a Convergence Scenario. ............... 123 Figure 5.2. Network Configuration of Simulated Scenarios........................................................ 123 Figure 5.3. BR Statistical Analysis per Access Technology Scenario (700 users, 10
simulation runs)............................................................................................................. 129 Figure 5.4. Discarded Packets/Frames Statistical Analysis per Access Technology
Scenario (700 users, 10 simulation runs). .................................................................. 130 Figure 5.5. Mean Bitrate Statistical Analysis per Access Technology Scenario (700 users,
10 simulation runs). ...................................................................................................... 130 Figure 5.6. BR Statistical Analysis for 10 and 100 simulation runs (700 users, G+H)............ 131 Figure 5.7. Discarded Packets/Frames Statistical Analysis for 10 and 100 simulation

List of Figures
xvii
runs (700 users, G+H). ................................................................................................ 132 Figure 5.8. Mean Bitrate Statistical Analysis for 10 and 100 simulations (700 users,
G+H).............................................................................................................................. 132 Figure 5.9. BR versus User Scenario (G+U). ................................................................................ 135 Figure 5.10. Discarded Packets/Frames versus User Scenario (G+U). .................................... 135 Figure 5.11. Mean Bitrate versus User Scenario (G+U). ............................................................. 136 Figure 5.12. Overall Performance Degradation versus User Scenario (G+U)......................... 137 Figure 5.13. Percentage of CMM 1st Priority Decisions versus User Scenario (G+U). .......... 138 Figure 5.14. Discarded Packets/Frames versus User Scenario (G+U+H)............................... 140 Figure 5.15. Mean Bitrate versus User Scenario (G+U+H). ...................................................... 140 Figure 5.16. Overall Performance Degradation versus User Scenario (G+U+H). ................. 141 Figure 5.17. Percentage of CMM 1st Priority Decisions versus User Scenario (G+U+H)..... 141 Figure 5.18. BR versus Access Technology Scenario (700 users)............................................... 143 Figure 5.19. Discarded Packets/Frames versus Access Technology Scenario (700 users)..... 143 Figure 5.20. Mean Bitrate versus Access Technology Scenario (700 users). ............................ 144 Figure 5.21. Overall Performance Degradation versus Access Technology Scenario (700
users). .............................................................................................................................. 145 Figure 5.22. Percentage of CMM 1st Priority Decisions versus Access Technology
Scenario (700 users). ..................................................................................................... 145
Figure A1.1. Comparison between the Uniform PDF and the PDF equivalent modified histogram obtained from the Uniform RNG (min=0, max=1). ........................... 158
Figure A1.2. Comparison between the Gamma PDF and the PDF equivalent modified histogram obtained from the Gamma RNG (β=9, λ=100)................................... 158
Figure A1.3. Comparison between the Beta PDF and the PDF equivalent modified histogram obtained from the Beta RNG (p=1, q=8). ............................................. 159
Figure A1.4. Comparison between the Exponential PDF and the PDF equivalent modified histogram obtained from the Exponential RNG (1/µCD =3). .............. 159
Figure A1.5. Comparison between the Geometric PF and the PF equivalent modified histogram obtained from the Geometrical RNG (PPC=0.2). .................................. 160
Figure A1.6. Comparison between the Normal PF and the PF equivalent modified histogram obtained from the Normal RNG (µN=0, σN=1). .................................. 160
Figure A1.7. Comparison between the Lognormal PDF and the PDF equivalent modified histogram obtained from the Lognormal RNG (µLN=0.97, σLN
2=4.38)...................................................................................................................... 161 Figure A1.8. Comparison between the Pareto PDF and the PDF equivalent modified
histogram obtained from the Pareto RNG (αp=1.1, k=81.5). ............................... 161 Figure A1.9. Comparison between the Poisson PF and the PF equivalent modified
histogram obtained from the Poisson RNG (λc=60). ............................................. 162

Traffic Analysis at the Radio Interface in Converging Mobile and Wireless Communication Systems
xviii
Figure A1.10. Comparison between the Weibul PDF and the PDF equivalent modified histogram obtained from the Weibul RNG (λk=0.45, βk=0.80). .......................... 162
Figure A2.1. BR versus User Scenario (G). .................................................................................... 164 Figure A2.2. Discarded Packets/Frames versus User Scenario (G). .......................................... 164 Figure A2.3. Mean Bitrate versus User Scenario (G). ................................................................... 165 Figure A2.4. BR versus User Scenario (U)....................................................................................... 165 Figure A2.5. Discarded Packets/Frames versus User Scenario (U)............................................ 166 Figure A2.6. Mean Bitrate versus User Scenario (U)..................................................................... 166 Figure A2.7. Discarded Packets/Frames versus User Scenario (H). .......................................... 167 Figure A2.8. Mean Bitrate versus User Scenario (H). ................................................................... 167 Figure A2.9. BR versus User Scenario (G+H)............................................................................... 168 Figure A2.10. Discarded Packets/Frames versus User Scenario (G+H)..................................... 168 Figure A2.11. Mean Bitrate versus User Scenario (G+H).............................................................. 169 Figure A2.12. BR versus User Scenario (U+H). .............................................................................. 169 Figure A2.13. Discarded Packets/Frames versus User Scenario (U+H). .................................... 170 Figure A2.14. Mean Bitrate versus User Scenario (U+H). ............................................................. 170
Figure A3.1. BR versus Access Technology Scenario (500 users)............................................... 172 Figure A3.2. Discarded Packets/Frames versus Access Technology Scenario (500 users)..... 172 Figure A3.3. Mean Bitrate versus Access Technology Scenario (500 users). ............................ 173 Figure A3.4. BR versus Access Technology Scenario (600 users)............................................... 173 Figure A3.5. Discarded Packets/Frames versus Access Technology Scenario (600 users)..... 174 Figure A3.6. Mean Bitrate versus Access Technology Scenario (600 users). ............................ 174 Figure A3.7. BR versus Access Technology Scenario (800 users)............................................... 175 Figure A3.8. Discarded Packets/Frames versus Access Technology Scenario (800 users)..... 175 Figure A3.9. Mean Bitrate versus Access Technology Scenario (800 users). ............................ 176 Figure A3.10. BR versus Access Technology Scenario (900 users)............................................... 176 Figure A3.11. Discarded Packets/Frames versus Access Technology Scenario (900 users)..... 177 Figure A3.12. Mean Bitrate versus Access Technology Scenario (900 users). ............................ 177 Figure A3.13. BR versus Access Technology Scenario (1 000 users). .......................................... 178 Figure A3.14. Discarded Packets/Frames versus Access Technology Scenario (1 000
users). .............................................................................................................................. 178 Figure A3.15. Mean Bitrate versus Access Technology Scenario (1 000 users). ......................... 179

List of Tables
xix
List of Tables
List of Tables Table 2.1. GSM frequency bands (based on [3GPP02b]). ............................................................18 Table 2.2. GSM traffic channels (based on [Walk00] and [3GPP01a]). ......................................20 Table 2.3. Channel coding schemes in GPRS (extracted from [BeVE99]).................................23 Table 2.4. Main WCDMA parameters (extracted from [HoTo00]).............................................28 Table 2.5. Transport channels in UMTS (based on [HoTo00]). ..................................................29 Table 2.6. Functionalities of the channelisation and scrambling codes (adapted from
[HoTo00]). ........................................................................................................................30 Table 2.7. Uplink DPDCH data rates (extracted from [HoTo00])..............................................32 Table 2.8. Downlink dedicated channel bitrates (based on [HoTo00]).......................................33 Table 2.9. Channel coding options for different channels (extracted from [HoTo00]). ..........34 Table 2.10. Parameters used in UL LF and DL LF calculation (based on [HoTo00]). ..............35 Table 2.11. Spectrum allocation and rules for HIPERLAN/2 in Europe (based on
[ETSI00a] and [KrSa01]). ...............................................................................................38 Table 2.12. HIPERLAN/2 transport and logical channels (based on [ETSI00b]). ....................41 Table 2.13. Transmission modes and requirements for HIPERLAN/2 (based on
[ETSI01] and [KrSa01]). .................................................................................................42 Table 3.1. Main characteristics of the different service classes.....................................................52 Table 3.2. Selected services and applications. .................................................................................53 Table 3.3. Conversational services description. ..............................................................................54 Table 3.4. Streaming services description. .......................................................................................54 Table 3.5. Interactive services description.......................................................................................54 Table 3.6. Background services description. ...................................................................................54 Table 3.7. Applications description. .................................................................................................55 Table 3.8. Conversational services and applications characterisation..........................................56 Table 3.9. Streaming services and applications characterisation. .................................................56 Table 3.10. Interactive services and applications characterisation. ................................................56 Table 3.11. Background services and applications characterisation...............................................57 Table 3.12. Voice source model parameters (extracted from [VaRF99])......................................61 Table 3.13. Parameters of the VoIP traffic model (extracted from [Mand01])............................63

Traffic Analysis at the Radio Interface in Converging Mobile and Wireless Communication Systems
xx
Table 3.14. Parameter values for the GBAR source model. ...........................................................65 Table 3.15. Basic parameters, 32 kbps video model (extracted from [NyJO01]). .......................68 Table 3.16. State dependent parameters, 32 kbps video model (extracted from
[NyJO01])..........................................................................................................................68 Table 3.17. State transition probability matrix (extracted from [NyJO01]). .................................68 Table 3.18. Parameter values for the GOP GBAR model. .............................................................72 Table 3.19. Parameter values for web browsing model (extracted from [ETSI98]). ...................75 Table 3.20. Distribution of session interarrival times (extracted from [KlLL01]). ......................76 Table 3.21. Distribution of session volume (extracted from [KlLL01]). ......................................76 Table 3.22. Statistical properties at connection level (extracted from [KlLL01]). .......................77 Table 3.23. Parameters of packet interarrival times (extracted from [KlLL01]). .........................77 Table 3.24. Fractions of different packet sizes in overall traffic (extracted from
[KlLL01])...........................................................................................................................77 Table 3.25. List of traffic source models. ..........................................................................................78 Table 3.26. Session/call generation and duration processes. ..........................................................81 Table 3.27. Mapping of technologies versus services and traffic source models.........................82 Table 4.1. Applications supported by the simulator. .....................................................................89 Table 4.2. Classification of Applications (CS and PS) per Access Technology. ........................90 Table 4.3. Convergence Manager Module - Priority Table. ..........................................................98 Table 4.4. Mean session bitrates..................................................................................................... 100 Table 4.5. Mean Capacity Occupation per Session. .................................................................... 102 Table 4.6. Access Technologies Capacity Models’ Parameters.................................................. 103 Table 4.7. Maximum Peak Bitrate for Packet Transmission...................................................... 105 Table 4.8. MAC Frame Durations in the Simulator.................................................................... 105 Table 4.9. Application Processing Priorities................................................................................. 106 Table 4.10. Simulator Output Parameters. ..................................................................................... 107 Table 5.1. Parameterisation of the Access Technology Scenarios. ........................................... 124 Table 5.2. DL Target Eb/No values adopted for the UMTS ATTPM. .................................. 125 Table 5.3. Access Technology Scenarios. ..................................................................................... 126 Table 5.4. User Scenarios. ............................................................................................................... 126 Table 5.5. User Scenario: User Type Penetration Values. .......................................................... 126 Table 5.6. Applications Scenario Characterisation. ..................................................................... 127 Table 5.7. Maximum Target Mean Bitrate per PS Application (G+U).................................... 136 Table 5.8. Maximum Target Mean Bitrate per PS Application (G+U+H). ............................ 139

List of Abbreviations
xxi
List of Abbreviations
List of Abbreviations 2G 2nd Generation
3G 3rd Generation
3GPP 3rd Generation Partnership Project
4G 4th Generation
AAA Authentication, Authorisation and Accounting
AAC Advanced Audio Coding
ACF Association Control Function
ACH Access feedback CHannel
AI Air Interface
AMR Adaptive Multi-Rate
AP Access Point
ARQ Automatic Repeat reQuest
ASCH Association Control CHannel
ATM Asynchronous Transfer Mode
ATTPM Access Technology Traffic Processing Modules
AuC Authentication Centre
BCCH Broadcast Control Channel
BCH Broadcast CHannel
BER Bit Error Rate
BHCA Busy Hour Call Attempts
Bid Bi-directional
BLER BLock Error Rate
BN Backbone Network
BoD Bandwidth-on-Demand
BPSK Binary Phase Shift Keying
BRAN Broadband Radio Access Networks
BS Base Station
BSC Base Station Controller

Traffic Analysis at the Radio Interface in Converging Mobile and Wireless Communication Systems
xxii
BSS Base Station Subsystem
BTS Base Transceiver Station
CBCH Cell Broadcast traffic CHannel
CBR Constant BitRate
CCCH Common Control CHannel
CCH Control CHannel
CDF Cumulative Distribution Function
CDMA Code Division Multiple Access
CEPT European Conference of Postal and Telecommunications Administrations
CL Convergence Layer
CM Convergence Manager
CMM Convergence Manager Module
CN Core Network
CPCH Uplink Common Packet CHannel
C-PDU Control PDU
CRC Cyclic Redundancy Check
CS Circuit Switched
CS-i Coding Scheme i DAB Digital Audio Broadcasting
DCC DLC Connection Control
DCCH Dedicated Control CHannel
DCH Dedicated CHannel
DFS Dynamic Frequency Selection
DL DownLink
DLC Data Link Control layer
DS-CDMA Direct Sequence CDMA
DSCH Downlink Shared CHannel
DTX Discontinuous Transmission
DVBP Digital Video Broadcasting Project
DVB-T Digital Video Broadcast – Terrestrial
EC Error Control
EDGE Enhanced Data Rate for GSM Evolution
E-GSM Extended GSM 900 band

List of Abbreviations
xxiii
EIR Equipment Identity Register
ETSI European Telecommunications Standards Institute
FACH Forward Access CHannel
FCCH Frame Control CHannel
FCH Frame CHannel
FDM Frequency-Division Multiplexing
FDMA Frequency Division Multiple Access
FER Frame Erasure Rate
FTP File Transfer Protocol
GBAR Gamma Beta Auto-Regressive
GERAN GSM/EDGE Radio Access Network
GGSN Gateway GPRS Support Node
GMSC Gateway MSC
GOP Group Of Pictures
GPRS General Packet Radio Service
GPS Global Positioning System
GSM Global System for Mobile Communications
HDTV High Definition TeleVision
HIPERLAN/1 HIgh PErformance Radio Local Area Network Type 1
HIPERLAN/2 HIgh PErformance Radio Local Area Network Type 2
HLR Home Location Register
HSCSD High Speed Circuit Switched Data
HTTP Hyper Text Transfer Protocol
IEEE Institute of Electrical and Electronics Engineers
IETF Internet Engineering Task Force
IMT-2000 International Mobile Telecommunications-2000
IP Internet Protocol
ISDN Integrated Services Digital Network
IST Information Society Technologies
ITU International Telecommunications Union
ITU-T ITU – Telecommunication standardisation sector
LA Link Adaptation
LAN Local Area Network
LCCH Link Control CHannel

Traffic Analysis at the Radio Interface in Converging Mobile and Wireless Communication Systems
xxiv
LCH Long CHannel
LF Load Factor
LRD Long-Range Dependence
MAC Medium Access Control
ME Mobile Equipment
M-M Many-to-Many
M-O Many-to-One
MoU Memorandum of Understanding
MP3 Moving Picture Experts Group Layer-3 Audio
MPEG Moving Picture Expert Group
MS Mobile Station
MSC Mobile Services Switching Centre
MSE Mean Square Error
MT Mobile Terminal
NG Next Generation
NRT Non-Real-Time
NSS Network and Switching Subsystem
NTB Non Time Based
OFDM Orthogonal Frequency Division Multiplex
O-M One-to-Many
OMC Operation and Maintenance Centre
O-O One-to-One
OSS Operation SubSystem
OVSF Orthogonal Variable Spreading Factor
PC Power Control
PCH Paging Channel
PCMCIA Personal Computer Memory Card International Association
PDA Personal Digital Assistant
PDCH Packet Data Channel
PDER PDU Error Rate
PDF Probability Density Function
PDTCH/F Full rate Packet Data TCH
PDTCH/H Half rate Packet Data TCH
PDU Packet Data Unit

List of Abbreviations
xxv
PER Packet Error Rate
PF Probability Function
P-GSM Primary GSM 900 band
PHY PHYsical layer
PLMN Public Land Mobile Network
PS Packet Switched
PSTN Public Switched Telephone Network
PT Priority Table
QCIF Quarter Common Intermediate Format
QoS Quality of Service
QPSK Quaternary Phase Shift Keying
RACH Random Access CHannel
RBCH RLC Broadcast CHannel
RF Radio Frequency
RFCH Random access Feedback CHannel
R-GSM Railways GSM 900 band
RLC Radio Link Control
RNC Radio Network Controller
RNG Random Number Generator
RNS Radio Network Subsystem
RR Resource Request
RRC Radio Resource Control
RRM Radio Resource Management
RSS Radio Subsystem
RT Real-Time
SCH Short CHannel
SDU Service Data Unit
SF Spreading Factor
SGSN Serving GPRS Support Node
SIM Subscriber Identity Module
SIP Session Initiated Protocol
SIR Signal to Interference Ratio
SIRT Target SIR
SMG Special Mobile Group

Traffic Analysis at the Radio Interface in Converging Mobile and Wireless Communication Systems
xxvi
SMS Short-Message Service
SRD Short-Range Dependence
TB Time Based
TBR Target BitRate
TCH Traffic CHannel
TCH/F Full-rate TCH
TCH/F2.4 2.4 kbps Full-rate TCH for data
TCH/F4.8 4.8 kbps Full-rate TCH for data
TCH/F9.6 9.6 kbps Full-rate TCH for data
TCH/FS Full-rate TCH for Speech
TCH/H Half-rate TCH
TCH/H2.4 ≤2.4 kbps Half-rate TCH for data
TCH/H4.8 4.8 kbps Half-rate TCH for data
TCH/HS Half-rate TCH for Speech
TDD Time Division Duplex
TDM Time-Division Multiplexing
TDMA Time Division Multiple Access
TFCI Transport Format Combination Indicator
TPE Traffic Processing Engine
TR Technology Router
TRX Transceiver
TSM Traffic Source Model
TSMIM Traffic Source Model Implementation Modules
TTI Transmission Time Interval
UBCH User Broadcast CHannel
UDCH User Data CHannel
UDD Unconstrained Delayed Data
UE User Equipment
UL UpLink
UMCH User Multicast CHannel
UMTS Universal Mobile Telecommunication System
Uni Unidirectional
U-PDU User PDU
U-SAP User Service Access Point

List of Abbreviations
xxvii
USIM UMTS SIM
UTGM User Traffic Generation Module
UTRA Universal Terrestrial Radio Access
UTRAN UMTS Terrestrial Radio Access Network
UTV User Traffic Vector
VAD Voice Activity Detector
VBR Variable BitRate
VLR Visitor Location Register
VO Video Object
VoIP Voice over IP
VOL Video Object Layer
VOP Video Object Plane
WCDMA Wideband CDMA
Wi-Fi Wireless Fidelity
WLAN Wireless Local Area Network
WSI Wireless Strategic Initiative
WWW World Wide Web

Traffic Analysis at the Radio Interface in Converging Mobile and Wireless Communication Systems
xxviii

List of Symbols
xxix
List of Symbols
List of Symbols α
Parameter for GBAR model
α Average orthogonality factor in the cell
αI Parameter of the GOP GBAR model
αp Parameter of Pareto distribution
β Shape parameter of Ga(β,λ)
βk Weibul CDF shape parameter
γ
Probability of transition from “OFF” state to “ON” state
Γ(x) Gamma function
η1PD
CMM 1st Priority Decisions Percentage
η1PD-T CMM 1st Priority Decisions Percentage on Technology
η1PD-B CMM 1st Priority Decisions Percentage on Bitrate/Quality
ηBD
CMM Bitrate/Quality Decision Percentage
ηD
Percentage of Discarded Packets/Frames
ηDL Downlink load factor
ηDL’ Downlink power based load estimation
ηDLmax Maximum allowed value for ηDL
ηTD
CMM Technology Decision Percentage
ηU
Normalised Capacity Usage
ηUL Uplink load factor
ηUL’ Uplink power based load estimation
λ Scale parameter of Ga(β,λ)
λc Mean arrival rate of calls
λi Parameter of the GOP GBAR model
λk Inverse of Weibul CDF scale parameter
µ Mean of the sample data

Traffic Analysis at the Radio Interface in Converging Mobile and Wireless Communication Systems
xxx
µB Mean of the B-frame sample sequence
µCD Inverse of the mean call duration time
µDd Mean value of Dd
µDpc Mean value of Dpc
µI Mean of the I-frame sample sequence
µj Expected frame size in state j
µk Mean burst duration in state k
µLN Natural log of the mean of the Lognormal PDF
µN
Mean of the Normal PDF
µNd Mean value of Nd
µNpc Mean value of NPC
µP Mean of the P-frame sample sequence
µSd Mean packet size
ρ
Lag 1 autocorrelation coefficient of the sample data
ρB Lag 1 autocorrelation coefficient of B-frame sizes
ρI Lag 1 autocorrelation coefficient of I-frame sizes
ρi Parameter of the GOP GBAR model
ρP Lag 1 autocorrelation coefficient of P-frame sizes
σ
Probability of transition from “ON” state to “OFF” state
σB Standard deviation of B-frame sample sequence
σI Standard deviation of I-frame sample sequence
σLN Natural log of the standard deviation of the Lognormal PDF
σN
Standard deviation of the Normal PDF
σP Standard deviation of P-frame sample sequence
σwj Standard deviation of white noise in state j
τ
Time slot duration
Cτ Average Call Duration
τk Burst duration in state k
A Generated Traffic
An Random variable associated to a stochastic process {Xn} with marginal Ga(β,λ) distribution
Be(p,q) Beta distributed random variable

List of Symbols
xxxi
bj Feedback parameter in state j Bn Random variable associated to a stochastic process {Xn} with
marginal Ga(β,λ) distribution
DDη Overall Discarded Packets/Frames Degradation
Dd Interarrival time between packets within a packet call
bRD Overall Mean Bitrate Degradation
CBRD Overall Call Blocking Rate Degradation
Dpc Reading time between packet calls
Eb Signal energy per bit
E[x] Expected value of x
f0 Initial frame size
fmax,j Upper bound to adjust frame sizes in state j fmin,j Lower bound to adjust frame sizes in state j
Ga(β,λ) Gamma distributed random variable
GBAR(β,λ) GBAR process
I Width of interval
i Other cell to own cell interference ratio seen by the BS receiver
i Average ratio of other cell to own cell base station power received by user
Ioth Received wideband interference power from inter-cell users
Iown Received wideband interference power from intra-cell users
Itotal Received wideband interference power
J(k) State at time step k
K Parameter of Pareto distribution
M Spacing between successive anchor VOPs
M(k) Sum of the expected frame sizes up to frame k
Mps Maximum allowed packet size
N Spacing between successive I VOPs
N0 Noise spectral density
N1SB Total number of sessions using the 1st priority bitrate/quality
N1ST Total number of sessions routed through the 1st priority access technology
NAM Number of active MTs
NAS Number of Active Sessions

Traffic Analysis at the Radio Interface in Converging Mobile and Wireless Communication Systems
xxxii
NBC Number of Blocked Calls
NC Total number of CS calls
UCoN Equivalent number of used codes assuming SF=512
NCo Equivalent total number of available codes assuming SF=512
NCoSH Number of codes reserved for soft handover
Nd Number of packets within a packet call
NDL Number of connections per cell
NDP Number of Discarded Packets/Frames
NI Number of intervals
ninit Number of initial frames
NLCH Total number of available LCHs
ULCHN Number of used LCHs
Noc Total number of occurrences
noc[n] Number of occurrences within interval n
NP Total number of packets/frames
NPC Number of packet calls per session
NS Total number of sessions
Ns Number of states
jSBN Total number of sessions using bitrate/quality j
iSTN
Total number of sessions routed through a given access technology i (GSM/GPRS, UMTS or HIPERLAN/2)
NTS Total number of available TSs
UTSN Number of used TSs
NUL Number of users per cell
P State transition probability matrix
p Parameter of Be(p,q)
P(i,j) Transition probability from state i to state j p(x) PDF of x
p[x] PF of x
Pa Pareto distributed random variable
pB(x) Beta PDF
PE(t) Exponential CDF
pE(t) Exponential PDF

List of Symbols
xxxiii
pG(x) Gamma PDF
pGe[n] Geometric PF for the generation of n packet calls during a session
Pk Probability that a packet is of size sk
pLN(x) Lognormal PDF
Pmax Maximum BS transmission power
PN Background and receiver noise
pN(x) Normal PDF
pP(x) Pareto PDF
PPC Probability of generating one packet call
pPo[n,t] Poisson PF for generating n calls/sessions in a certain time interval t Ptotal Total downlink transmission power
pU(x) Uniform PDF
PW(x) Weibul CDF
px[n] PDF/PF equivalent modified histogram
px[xn] Discretised theoretical PDF / Theoretical PF
q Parameter of Be(p,q)
Qk Probability of selecting a new state sk
bR Mean Bitrate
maxbR Maximum target mean bitrate for a specific application
RCB Call Blocking Rate
Rj Bitrate of user j RSM Ratio of Active Sessions per Active MTs
S0 Initial state
Sd Size of a packet
S(k) Sum of the previous frame sizes up to frame k
sk Packet size generated in state k
tOFF Mean duration of silence period (“OFF” state)
tON Mean duration of voice activity period (“ON” state)
v Variance of the sample data
vj Activity factor of user j at physical layer
W WCDMA chip rate
W(k) Innovations for frame k size calculation
Xk Size of the kth frame

Traffic Analysis at the Radio Interface in Converging Mobile and Wireless Communication Systems
xxxiv
X(k) Preliminary size of frame k
X’(k) Adjusted size of frame k
xmax Upper limit of the observation window
xmin Lower limit of the observation window
Xn Sample function from {Xn}
{Xn} Stationary stochastic process
Zik Sample function of a GBAR(αi,ρi) process

Introduction
1
Chapter 1
Introduction 1 Introduction
This chapter gives a brief overview of the work. Before establishing work targets and original
contributions, the scope and motivations are brought up. The current State-of-the-Art in relation
to the scope of the work is also presented. At the end of the chapter, the work structure is
provided.

Traffic Analysis at the Radio Interface in Converging Mobile and Wireless Communication Systems
2
1.1 Overview
During May 2003, the total number of mobile users has broken the 1.3 billion mark [CELL03].
This revolution has been implemented through a continuous evolution of standards and
products, accommodating people’s basic needs for communication and mobility. It started in the
early ’90s with the replacement of the analogue mobile network by the digital one, with the
introduction of second generation (2G) mobile systems, and is continuing today with the
deployment of the third generation (3G). From circuit-driven networks, we now enter the packet
world through intermediate overlay networks, followed in years to come by all-IP networks.
3G mobile networks promise to support, besides the existing mobile telephony service, data
services with higher bitrates and efficiency than 2G ones. However, driven by the enormous
success of the Internet within the last ten years, with increasing data rates made available to the
(wired) subscribers and the inherent deployment of new services, certain expectations emerged.
Not only businessmen, who used to be the first customers in the beginning of mobile
communications, but also private people demand for a wired-service like connection while on the
move. This challenge will obviously not be coped with by sole 3G deployments.
An auspicious solution to this problem is seen in Wireless Local Area Networks (WLANs) and
other wireless technologies arriving in the market, featuring higher data rates and different service
offerings compared to 2G and 3G mobile networks. Due to the high bitrates and the free
frequency licensing, WLAN technology is partly seen as a competitive technology to the 3G
mobile network one. However, due to the rather small cell area, it seems utopian to implement a
nationwide coverage based solely on WLAN deployment. This is why currently WLAN and 3G
mobile networks are seen as complementary technologies. In fact, WLAN volunteers to be used
in indoor environments or hot-spots, and 3G (and existing 2G) systems in broad outdoor
environments. Convergence between these technologies will ensure the continuity of the service
to the mobile users following the “anywhere, anytime” dogma.
Therefore, the convergence of mobile and wireless systems, combining the advantages of each
specific access network technology, is foreseen as the solution for providing the expected (and
new) services to users, e.g., [FLOW03]. The aspired convergence of systems is currently referred

Introduction
3
to as systems ‘beyond 3G’ or ‘4G’ (4th Generation), e.g., [SB3G01], [4GMF03]. 4G systems intend
to provide an interconnection and interoperability between different technologies in order to
ensure (seamless) handovers from one technology to another, thus, enabling a continuous service
to the users. This can be, for example, based on choices made by the applications taking into
account both application and user requirements, together with the capability of the different
networks. It will require higher intelligence in the terminals to make best use of the different
applications locally available. At the price of this complexity, the vision brought out by the
Wireless Strategic Initiative (WSI) [WSI03] may become real, bridging all access technologies
from fixed to satellite and from person to person to customised broadcast, Figure 1.1.
Figure 1.1. The multi-technology access network (extracted from [VLLX02]).
The convergence of systems will therefore provide mobile users with easy access to
communications of any sort anywhere. This will have direct benefits in terms of greater
accessibility and reduced location dependence to radio communications. In doing so, it will also
provide the possibility for service providers to move beyond their traditional areas of operation.
As well as greater choice, this will result in a higher quality of service and the integration of
services around user needs.
The following two illustrative usage scenarios show possible examples of how the convergence of
wireless systems can present clear benefits to the end users:

Traffic Analysis at the Radio Interface in Converging Mobile and Wireless Communication Systems
4
• Two teenagers are watching video clips on their mobiles while walking into and
then through a very crowded airport with UMTS (Universal Mobile
Telecommunication System) coverage. They sit down and carry on watching their
video clips, but are now in a HIPERLAN/2 (HIgh PErformance Radio Local Area
Network Type 2) hotspot, and because of traffic congestion, their devices switch
automatically and seamlessly to HIPERLAN/2. One of the teenagers wants to
compare prices for a skateboard, so he starts web browsing.
• A PDA (Personal Digital Assistant) user is uploading a report onto the company’s
Intranet, while walking slowly through a busy city centre which has UMTS
coverage. Simultaneously, the user needs to make an important call on the PDA,
but to make optimal use of the bearer services available, the call is made seamlessly
over a GSM (Global System for Mobile Communications) network as he enters a
museum.
Besides end users, operators will also benefit from the convergence of wireless systems (although
in most cases a benefit to an operator will also ultimately be a benefit to a user and vice versa).
Benefits primarily to the operator include:
• Increased capacity - the use of multiple standards removes the constraint that an
operator must provide ubiquitous coverage using a single standard. For instance,
introducing extra base stations into a network in order to provide full coverage may
excessively increase interference levels, thereby reducing capacity. Additionally, in
hot-spot areas, it may not be practical to increase the capacity, because there are
insufficient spectrum or infrastructure sites. Convergence will allow the most
appropriate standards to be used in the most appropriate locations.
• Increased coverage - the ability to offer the same service over different standards
means that in an area where one standard could not normally be effectively
deployed, coverage can still be achieved by use of an alternative standard.
• Reduced infrastructure costs – convergence will allow for a reduction in the
number of different standards that “must” be served in a particular location.
• New services – the use of converged standards may offer totally new services,
which can be used to provide new applications. Technological developments in
recent years have already provided more flexibility for operators to offer services
outside their traditional business, as a result of the convergence of different types of

Introduction
5
communications media. Recent examples include: Internet services delivered to TV
sets via digital TV decoders; Email and World Wide Web (WWW) access via
mobile phones; Webcasting of radio and TV programs on the Internet; using the
Internet for voice telephony via Voice over IP (VoIP).
• Increased numbers of users/usage - because the increased capacity and coverage
mean services are more widely available, users are more likely to try to use them,
leading to increased numbers of users and increased usage per user (increased
profits).
Several research groups and projects are (or have been recently) focussed on system convergence
aspects (at different levels), namely:
• ETSI (European Telecommunications Standards Institute) BRAN (Broadband
Radio Access Networks) [BRAN03] and 3GPP (3rd Generation Partnership
Project) [3GPP03], on HIPERLAN/2 and UMTS inter-working.
• Digital Video Broadcasting Project (DVBP) [DVBP03], on a "multiplatform"
approach that effectively combines digital TV with UMTS and GPRS (General
Packet Radio Service) cellular technologies.
• IST (Information Society Technologies)- WINE GLASS project [WINE03]
(concluded 02/2002), on IP-based wireless mobile multimedia networking with
UMTS and WLANs.
• IST-SUITED project [SUIT03] (concluded 06/2002), on the development of an
integrated/converged system consisting of both satellite and terrestrial (UMTS,
GPRS, WLAN) technologies.
• IST-BRAIN project [BRAI03] (concluded 04/2001), followed up by the IST-
MIND project [MIND03] (concluded 11/2002), on broadband wireless multimedia
services for IP over heterogeneous access networks, with a common IP core.
• IST-FLOWS project [FLOW03], on the convergence and simultaneous use of a
variety of wireless systems/standards (e.g., GSM, UMTS, HIPERLAN/2), based on
the connection of different wireless access points (from different standards) to a
common access network based on IP.
• IST-TRUST project [TRUS03] (concluded 03/2002), followed up by the IST-
SCOUT project [SCOU03], on reconfigurability in radio systems and networks,
with particular attention on the terminal (users’ requirements), and considering IP

Traffic Analysis at the Radio Interface in Converging Mobile and Wireless Communication Systems
6
based radio access and core networks.
• IST-MOBIVAS project [MOBI03] (concluded 06/2002), on the development of a
middleware architecture that enables the creation of an open, dynamic market
environment for mobile services, provided over reconfigurable networks and
systems.
• IST-DRIVE project [DRIV03] (concluded 03/2003), followed up by the IST-
OVERDRIVE project [OVER03], addressing the convergence of cellular and
broadcast networks (GSM, GPRS, UMTS, DAB (Digital Audio Broadcasting),
DVB-T (Digital Video Broadcast – Terrestrial)) to lay the foundations for
innovative IP-based multimedia services. The convergence between radio access
networks is made possible by the application of an intelligent backbone network, a
novel dynamic spectrum allocation mechanism, and flexible and adaptive
applications.
• IST-MobyDICK project [MOBY03], defining an architecture for wireless Internet
access by developing new mechanisms for seamless handover, QoS (Quality of
Service) support after and during handover, AAA (Authentication, Authorisation
and Accounting), and charging, over a heterogeneous network infrastructure.
• IST-CISMUNDUS project [CISM03], on the convergence of IP-based services for
mobile users and networks in DVB-T and UMTS systems.
• IST-ANWIRE project [ANWI03], a thematic network that organises and
coordinates parallel actions in key research areas of Wireless Internet and
Reconfigurability, in order to encompass research activities towards the design of a
fully integrated system.
There are already a few initial developments (by telecom and terminal manufacturers) of systems
following a convergence approach. For example, Nomadix [NOMA03] and ipUnplugged
[IPUN03] have announced recently complete interoperability between their solutions for
operators to enable secure seamless roaming across Wi-Fi (Wireless Fidelity - IEEE 802.11b or
802.11a WLAN networks), GPRS, and UMTS while maintaining a single billing solution; Cisco
Systems [CISC03] has recently presented a wireless phone that operates on Wi-Fi (802.11b)
networks; Nokia [NOKI03] has launched multimode radio card for laptop computers that
enables network access through GPRS, HSCSD (High Speed Circuit Switched Data), and WLAN
networks; Texas Instruments [TEXA03] has developed a device that offers simultaneous

Introduction
7
networking over 802.11b and Bluetooth wireless protocols and voice and data calls over a GPRS-
enhanced GSM radio. Besides these examples, several terminal manufacturers have recently
presented multi-band and multi-mode terminal devices (e.g., PCMCIA cards), including for
example GPRS, UMTS and WLAN capabilities. In these terminals, the system typically operates
using only one standard at a time, with the objective of offering the consumer access to existing
mobile services, but having an improved roaming capability.
1.2 Motivation and Contents
To date, convergence is mainly considered at the core network level, with the use of IP in this
context. However, not much attention has been given to how the various wireless standards can
be converged at the consumer terminal, if multiple standards are available to the user from a
common core network. Under this context, important issues arise, like determining how services
map onto certain standards (or even split between standards), and how can this be made to be
seamless and appear as a simultaneous connection to the user. Another important issue, still to be
analysed, is the impact of convergence on the several access networks performances (and vice-
versa).
The current thesis is precisely motivated by this vision of future wireless communication systems
where there will be a convergence of wireless standards and an enhancement of services. In
particular, the objective is to focus on the capacity of the radio interface of such converged multi-
standard systems, and study (by means of a simulation platform developed for this purpose) the
overall performance obtained for different scenarios (convergence benefits), using different
approaches, namely:
• Analysis of the impact of users traffic variations;
• Analysis of the impact of the number of users in specific scenarios corresponding
to different available access technologies;
• Analysis of the impact of the availability of different access technologies for a
particular number of users.
A key concept adopted in the present work is a common core network based on IP, to which a
variety of wireless access points/technologies will be connected. The selected access technologies

Traffic Analysis at the Radio Interface in Converging Mobile and Wireless Communication Systems
8
that will be considered throughout this thesis are GSM/GPRS, UMTS or HIPERLAN/2. The
combination of these three access technologies provides a broad data rate support, a wide range
of mobility, and from the application point of view, voice, data and multimedia support, Figure
1.2. Through convergence at the air interface of these wireless standards, a user with a single
Mobile Terminal (MT) can be connected simultaneously (and efficiently) to the three kinds of
access points. The overall network structure under consideration for the development of the
present work is depicted in Figure 1.3.
HIPERLAN/2 (& 802.11a)
User Bit Rates (Mbps)
1 10 1000.1
Mobility
High SpeedVehicular
Vehicular
Pedestrian
Indoor
Portable
0.01
DAB
802.11b DVB
DECT
BLUETOOTH
GSM UMTSGPRS
Figure 1.2. Support for user data rate versus mobility as provided by the GSM/GPRS, UMTS and HIPERLAN/2
(adapted from [ACGN02]).
A very important step towards the development of the present work is the selection of a
representative and diversified (in characteristics) set of services and applications, which can be
supported by the considered systems (alone or combined), and their detailed characterisation. For
simulation purposes, traffic source models, as well as the definition of the associated generation
and duration processes, will be necessary for each of the considered applications. Another crucial
task is to establish a mapping of the considered services and applications onto the available
access technologies (GSM/GPRS, UMTS and HIPERLAN/2).
In the development of the present work, a new entity has been introduced – the Convergence
Manager (CM) (Figure 1.3). This element is basically responsible for the implementation of all
convergence functionalities in the overall system. The CM is represented by a functional entity in
the Access (or Core) Network and a corresponding one in each associated MT. The placement of
the CM is a crucial issue for the architectural design of a converged multi-technology network. By
locating the CM functionality in different places of the network, different functions and different
layers of optimisation may be achieved. Each possibility presents advantages and disadvantages,

Introduction
9
when different aspects are taken into consideration, e.g., architecture, complexity of
implementation, end users and network operator’s points of view.
IP Backbone
CONVERGENCEMANAGER
GSM/GPRS
UMTS
HIPERLAN/2
RFSYSTEM
GSM/GPRS
UMTS
HIPERLAN/2
CONVERGENCEMANAGER
ACCESSTECHNOLOGIES
BSsRADIOCHANNEL
Figure 1.3. Network structure under consideration.
For instance, an apparently optimum solution from a radio access technology performance point
of view, would be to locate the network CM functionality on a multi mode BS. This would allow
the MTs to access different technologies simultaneously while optimising the radio access
technology choice, the network route (BS used) and the radio interface physical layer parameters
(i.a., modulation schemes and power control). However one can easily identify serious limitations
in this solution: it places some significant new requirements on the network architecture, since
the different systems/technologies have different cell sizes (e.g., in the case of a simultaneous
usage of UMTS and WLAN, either the UMTS cell areas have to overlap dramatically to provide
full WLAN coverage or the WLAN areas can not be designed continuously); another drawback is
that in cases of handovers from one BS to another the state of the convergence manager has also
to be transferred, and therefore, standardisation effort for the interworking protocol would have
to be considered. Besides these technical limitations, another limiting factor for this approach is
that only one operator can be involved, thus, a cooperation of different business entities is
implicitly impossible in this approach.
On the other hand, locating the CM functionality deeper into the network, for instance behind
the gateways of each access technology, would require minor changes or enhancements at the
network nodes. In this case, the CM would split the sessions into media streams or direct
sessions of specific characteristics onto the best-suited access network. For example, for a file

Traffic Analysis at the Radio Interface in Converging Mobile and Wireless Communication Systems
10
download the CM could select a WLAN access network, while for a speech call the CM could
direct it to a 2G network. In all cases the network entities of the various access networks will not
need extra functionalities. However, in this case a lower level of convergence benefits would be
achieved.
Another possible solution could include, for example, a hierarchical convergence manager
functionality, i.e., the CM functionality could be split and located in several places of the network.
For instance, there could be a CM in the core network splitting streams onto different standards,
in addition to a CM outside the core network splitting sessions onto the networks from different
operators. This combination may be possible, and in some cases it may be business profitable and
beneficial for the users. However, this type of approach would demand more upgrade work than
in a single CM location scenario.
The CM concept adopted in the development of the present work considers a session based
access technology decision process, which goes in line with the second CM location possibility
previously discussed (i.e., behind the gateways of each access technology). Another important
issue to consider is the intrinsic architectural design of such an element as the CM, strongly
dependent of its location in the network and MT. Although this is a serious factor to take into
account for the implementation of such converged networks, it falls outside the scope of the
current Thesis, which focuses mainly on the radio interface capacity performance.
The idea of the CM is to obtain the maximum flexibility among users and networks. The CM
allocates the packets coming from different users using various services to different
networks/access technologies. The CM may use different perspectives/strategies by considering
parameters such as traffic loads on different networks, channel status between the BS and MTs,
different user’s priorities and service requirements, etc.. By applying different
perspectives/strategies, the different parameters are weighted differently and different benefits
are obtained. Examples of different perspectives/strategies of the CM can be:
• QoS oriented - the user can achieve better quality of service because the
communications link will always operate with the most appropriate standards or
combinations between different standards. Parameters regarding different QoS can
include data rate, PER (Packet Error Rate) or FER (Frame Erasure Rate), and
system delay when setting up connections.
• Capacity oriented - this perspective/strategy may be important for operators since

Introduction
11
it minimises the amount of network infrastructure that needs to be deployed.
Further, the use of multiple standards, removes the constraint that an operator
must provide ubiquitous coverage using a single standard. The parameters affecting
the capacity oriented policy can be the average session capacity occupation per
standard, available capacity per standard per unit of time, outage probability, etc..
• Price/cost oriented - there will be different standards or combinations of standards
offered to the user. Since different standards have different prices when carrying
data packets, the user will consider the price when choosing standards. This may
then be implemented in the CM based on users’ preferences.
• Fairness/Priority oriented - in most cases, all users are served fairly. Nevertheless, it
is possible to implement priority schemes in the CM to serve special users with
higher priority.
In the present work, one will consider a unique CM perspective/strategy based on a highest
throughput / best system approach. This approach can be seen as a combination of the above-
mentioned ones (excluding the price/cost oriented strategy). The highest throughput concept
means that for data and video applications, the highest available/possible transmission bitrate is
selected based on the current networks’ loads. In respect to the best system approach, priority is
given to the most appropriate application-oriented access technology (e.g., data applications first
priority – WLAN; Voice Calls first priority – GSM).
This new functionality, the CM, which allows the convergence of wireless standards and an
enhancement of the service offering performance, is the main original contribution of the present
work. This concept has been implemented in a newly developed simulation platform, together
with specific traffic source models for several applications and radio interface (capacity) models
for GSM/GPRS, UMTS and HIPERLAN/2. The developed simulator, which presents high
flexibility and ease of upgrade, will enable the evaluation of the benefits of convergence of
mobile and wireless communication systems from a capacity/traffic point of view, taking into
account the possibility of analysing different convergence perspectives/strategies.
Of course, some approximations were introduced in the development of the simulator, in order
to enable to perform this analysis in the context of a Master Thesis. Nevertheless, there was
always the concern that the taken approximations keep the essential characteristics of each
standard under consideration. These approximations will be identified along the text.

Traffic Analysis at the Radio Interface in Converging Mobile and Wireless Communication Systems
12
This document is composed of five chapters, besides the current one, and three annexes. The
following chapter is dedicated to the overview of the GSM/GPRS, UMTS and HIPERLAN/2
systems, mainly focussing on the capacity aspects of the radio interfaces. Chapter 3 provides a
description of the services and applications that are considered in the present work. A detailed
characterisation and parameterisation of traffic source models, as well as of generation and
duration processes, for each considered application is also presented. At the end of the chapter, a
mapping of the access technologies (GSM/GPRS, UMTS and HIPERLAN/2) versus the
services/applications and traffic source models is performed. Chapter 4 presents a functional
description of the simulator platform developed within the work scope of this thesis, with the
main objective of allowing the evaluation of the benefits of convergence of mobile and wireless
systems from a capacity/traffic point of view. In Chapter 5, the results of simulations for several
different scenarios are analysed following three different approaches; the simulated scenarios are
characterised according to three main components: technologies, users and applications.
Conclusions and further suggestions of work to be done are drawn in the final chapter. Annex 1
includes a statistical validation of the random number generators used in the simulator platform,
while Annex 2 and Annex 3 present, as a complement to Chapter 5, some additional results from
simulations.

Technologies Overview
13
Chapter 2
Technologies Overview 2 Technologies Overview
This chapter provides an overview of the GSM/GPRS, UMTS and HIPERLAN/2 systems,
mainly focussing on the capacity aspects of the radio interfaces.

Traffic Analysis at the Radio Interface in Converging Mobile and Wireless Communication Systems
14
2.1 The GSM/GPRS system
2.1.1 Introduction
In June 1982, CEPT (European Conference of Postal and Telecommunications Administrations)
decided to develop and standardise a Pan-European cellular mobile radio network [Walk00]. The
aim was for the new system to operate in the 900 MHz frequency band allocated to land mobile
radio. A working group, called Group Spéciale Mobile (GSM), was set up under the direction of
CEPT, to develop and standardise the so-called GSM mobile radio system. The GSM objectives
for its Public Land Mobile Network (PLMN) included offering [Walk00]: a broad set of speech
and data services, cross-border system access for all mobile phone users, automatic roaming and
handover, highly efficient use of frequency spectrum, supplier-independence, etc..
By 1987, comprehensive guidelines for the new digital mobile radio system had already been
established by the GSM group. By signing the Memorandum of Understanding (MoU) on the
Introduction of the Pan-European Digital Mobile Communication Service on 7 September 1987, the 13
participating countries confirmed their commitment to introducing mobile radio based on the
recommendations of the GSM. Later, in March 1989, the GSM working party was taken over by
ETSI, and since 1991 it has been called the Special Mobile Group (SMG). Today the abbreviation
GSM stands for Global System for Mobile Communications, thereby underlining its claim as a
worldwide standard. In the meantime, all the European countries, as well as a large number of
other countries in the world, have signed the GSM-MoU and have developed or will be
developing mobile radio systems in their countries based on the GSM recommendations.
GSM is regarded as an important advance compared with predecessor systems, and is considered
to be representative of so-called 2nd Generation (2G) systems. Along with important
technological advances (particularly the introduction of digital transmission technology), the
standardisation of the interfaces between subsystems in GSM has provided manufacturers and
network operators flexibility in their development work and configurations.

Technologies Overview
15
In GSM, besides the normal voice service, data transfer is made possible using Circuit-Switched
Data (CSD), which offers throughput up to 14.4 kbps. This limitation led to the standardisation
of the High Speed Circuit Switched Data (HSCSD) and General Packet Radio Service (GPRS).
HSCSD enables higher rates (up to 57.6 kbps), but like CSD is circuit-based; therefore, it is
inherently inefficient for bursty traffic, continuously using several radio channels (up to four).
Only around 30 operators have introduced HSCSD so far [VLLX02]; most operators use GPRS
instead. This technology increases the data rates of existing GSM networks, allowing transport of
packet-based data. New GPRS handsets are able to transfer data at rates much higher than the
9.6 or 14.4 kbps currently available to mobile-phone users, and under ideal circumstances, GPRS
will support rates of 171.2 kbps, surpassing ISDN (Integrated Services Digital Network) access
rates. However, a more realistic data rate for early network deployments is probably around
40 kbps using one Uplink (UL) and three Downlink (DL) timeslots. Unlike Circuit-Switched (CS)
2G technologies, GPRS is an “always-on” service. It will allow GSM operators (and others) to
provide high speed Internet access at a reasonable cost, by billing mobile-phone users for the
amount of data they transfer, rather than for the length of time they are connected to the
network.
In GPRS, the connection to the PLMN is based on IP, and on the air interface, the resources
being assigned to the terminal are on a per-IP packet basis [Yaco02]. GPRS supports PS (Packet
Switched) services and allows services based on QoS requirements, such as priority, reliability and
bitrate.
GSM networks, either in the original GSM conception or as an evolution of it, are currently
spread worldwide and are unanimously considered a very successful project.
2.1.2 System architecture
The GSM/GPRS system can be divided into the following three subsystems [Walk00]: Radio
SubSystem (RSS), Network and Switching SubSystem (NSS) and Operation SubSystem (OSS).
These subsystems and their components are represented in the simplified version of the
functional architecture in Figure 2.1.

Traffic Analysis at the Radio Interface in Converging Mobile and Wireless Communication Systems
16
VLR
BTS
BTS
BTS
MS
MS
MS
BSC
BSC
HLR
MSC
AuC
OMC
EIR
OperationSubsystem
(OSS)
Network andSwitching
Subsystem(NSS)
Base Station Subsystem(BSS)
Radio Subsystem
Points of reference: Um Abis O (see below)
O
Interface toother Networks
Transition toISDN, PDN,PSTN, otherPLMN
BTS-BSCInterface
RadioInterface
GGSN
SGSN
A
Gb
Gb (see below)A (see below)
Figure 2.1. Functional architecture of the GSM/GPRS mobile radio network (based on [Walk00]).
The RSS is constituted by Mobile Stations (MS) and the Base Station Subsystem (BSS). The term
MS refers to all the physical equipment of a PLMN user. Both CS and PS facilities may be
provided within the MS.
The BSS comprises all the radio-related functions of the GSM network. The BSS is functionally
and physically separated into two components: the Base Transceiver Station (BTS) and the Base
Station Controller (BSC). The BTS comprises the transmitting and receiving facilities, including
antennas and all the signalling related to the radio interface. The BSC is responsible for the
management of the radio interface trough the BTS, namely for the reservation and the release of
radio channels (radio resource management), as well as handover management and frequency
hopping control.
The NSS carries out the switching procedures, packet routing and transfer within the PLMN, and

Technologies Overview
17
the manipulation of the databases for mobility management of the subscribers. Its functions
include coordination of call setup, paging, resource allocation, location registration, encryption,
interfacing with other networks, handover control, billing, synchronisation, and others [Yaco02].
The NSS components include the Mobile Services Switching Centre (MSC), the Gateway GPRS
Support Node (GGSN), the Serving GPRS Support Node (SGSN), the Home Location Register
(HLR) and the Visitor Location Register (VLR).
The OSS performs operation and maintenance functions, namely: subscription management,
network operation and maintenance, and mobile equipment management [Walk00]. The
following network elements are part of the OSS: Operation and Maintenance Centre (OMC),
Authentication Centre (AuC) and Equipment Identity Register (EIR).
2.1.3 Radio interface capacity aspects
The radio interface is located between the MS and the rest of the GSM/GPRS network.
Physically, the information flow takes place between the MS and the BTS. But, viewed logically,
the MSs are communicating with the BSC, MSC and the SGSN. The gross transmission rate over
the radio interface is 270.833 kbps.
Currently there are several frequency bands defined for the operation of GSM, Table 2.1.
Operators may implement networks that operate on a combination of these frequency bands to
support multi band MSs.
GSM 900 is the original GSM cellular network initially conceived to serve large areas (macro
cells) and to operate with high power terminals. GSM 1800 and GSM 1900 incorporate the
personal communication service concept. GSM 1800 is designed to operate in Europe and GSM
1900 is designed to operate in America, and both comprise low power terminals and serve small
areas (micro cells) [Yaco02]. Other operating bands have also been specified, like E-GSM and R-
GSM. In E-GSM, the original GSM 900 operating band is extended and lower power terminals
and smaller serving areas (micro cells) are specified [Yaco02].

Traffic Analysis at the Radio Interface in Converging Mobile and Wireless Communication Systems
18
Band Uplink [MHz]
Downlink [MHz]
Duplex interval [MHz]
GSM 450 450.4-457.6 460.4-467.6 10
GSM 480 478.8-486 488.8-496 10
GSM 850 824-849 869-894 45
Primary GSM 900 or P-GSM 890-915 935-960 45
Extended GSM 900 or E-GSM 880-915 925-960 45
Railways GSM 900 or R-GSM 876-915 921-960 45
GSM 1800 1710-1785 1805-1880 95
GSM 1900 1850-1910 1930-1990 80
Table 2.1. GSM frequency bands (based on [3GPP02b]).
The GSM frequency bands are divided into 200 kHz bandwidth channels, providing a certain
amount of radio channels, each for transmitting and receiving operations. Refer to [3GPP02b]
for a detailed overview of the GSM channel arrangements in each frequency band.
In the GSM recommendations, a combination of Frequency-Division Multiplexing (FDM) and
Time-Division Multiplexing (TDM) has been standardised, providing multiple access by MSs to
theses systems, i.e., Frequency Division Multiple Access (FDMA) and Time Division Multiple
Access (TDMA).
Figure 2.2 shows how a physical channel is produced through a combination of FDMA and
TDMA (see channel 0 on frequency F(n+1)). With the TDMA method, a carrier frequency is
divided into eight physical channels, i.e., Time Slots (TSs), Figure 2.3.
A physical channel is therefore characterised by its carrier frequency and the TS available to it,
which recurs every frame with a duration of 4.615 ms. Each TS has a length corresponding to the
duration of 156.25 bit or 0.577 ms. A slot is used by a burst with a length of 148 bit, which,
corresponding to the guard time, is 8.25 bit shorter in duration than the slots to avoid
overlapping with other bursts. Data is transmitted in bursts, and if messages are longer than a
burst, they are split up among several bursts and then transmitted.

Technologies Overview
19
Physical channel, characterised through thefrequency F(n+1) and the time slot 0
Time (ms)
Frequency
F(n+1)
F(n)
F(n-1)
7 0 1 2 3 4 5 6 7 0 1 2 3 4 5 6 7
7 0 1 2 3 4 5 6 7 0 1 2 3 4 5 6 7
7 0 1 2 3 4 5 6 7 0 1 2 3 4 5 6 7
4.615
0.577 0.5770.577 0.577 0.577 0.5770.577 0.577 0.577 0.5770.577 0.577 0.577 0.5770.577
Figure 2.2. Physical channels using FDMA and TDMA (extracted from [Walk00]).
0 1 2 3 4 5 6 7
4.615 ms
trainingdata bits data bits
3 tail bits
time slot 156.25 bit
0.577 ms
57 26
burst 148 bit
57
3 tail bits1 toggle bit 1 toggle bit
time slot:
Figure 2.3. Structure of a TDMA frame (extracted from [Walk00]).
In order for the MSs not to transmit and receive at the same time, the UL TDMA frames are
transmitted with a delay of 3 time slots in relation to the DL ones.
The tasks performed in a GSM/GPRS platform are supported by a number of functional
channels, the logical channels. Logical channels occur through the allocation of TSs to physical
channels. Consequently the data of a logical channel is transmitted in the corresponding TSs of

Traffic Analysis at the Radio Interface in Converging Mobile and Wireless Communication Systems
20
the physical channel. During this process, logical channels can occupy a part of the physical
channel or even the entire channel.
GSM recommendations [3GPP01a] define several logical channels, dividing them into two main
groups: Traffic Channels (TCHs), which convey payload information (speech, data), and Control
Channels (CCHs), which carry overhead (control) information.
The TCHs are intended to carry two types of user information streams: encoded speech and data,
therefore, TCHs can be assigned either to CS calls or to PS data. Different transmission
capacities are required depending on the type of service used (e.g., voice transmission, Short-
Message Service (SMS), data transfer, facsimile). In Table 2.2, a list of GSM traffic channels is
presented.
Traffic Channel Abbreviation Full-rate TCH for speech TCH/FS
Half-rate TCH for speech TCH/HS
9.6 kbps full-rate TCH for data TCH/F9.6
4.8 kbps full-rate TCH for data TCH/F4.8
4.8 kbps half-rate TCH for data TCH/H4.8
≤2.4 kbps full-rate TCH for data TCH/F2.4
≤2.4 kbps half-rate TCH for data TCH/H2.4
Full rate packet data TCH PDTCH/F
Half rate packet data TCH PDTCH/H
Table 2.2. GSM traffic channels (based on [Walk00] and [3GPP01a]).
Other traffic channels, such as Cell Broadcast Traffic CHannels (CBCH) have also been recently
specified [3GPP01a].
Control information, which is used for signalling and for system control (not passed to the
subscribers), is transmitted over CCHs. The CCHs offer the MSs a packet-oriented continuous
signalling service enabling them within the PLMN to receive messages from the BSs and to send
messages to the BSs at any time.
The logical channels are mapped onto physical channels using the technique of “multiframing”.
A multiframe is a set of some fixed number of TDMA frames that are together assigned a
functionality. A distinction can be made between multiframes of three different lengths

Technologies Overview
21
[3GPP01a]: 26-frame, 51-frame and 52-frame multiframes.
Fifty-one of the 26-frame multiframes and 26 of the 51-frame multiframes are combined into a
superframe, and 2048 superframes produce a hyperframe (see Figure 2.4). It takes almost 3.5
hours to transmit a hyperframe.
1 Hyperframe=2 048 Superframes=2 715 648 TDMA Frames (3h, 28min, 53s, 750ms)
0 1 2 3 4 5 6 7
Burst (15/26 ms)
TCH, SACCH/T, FACCH
TDMA Frame (120/26 ms)
0 1 2 3 4 5 6 7
Burst (15/26 ms)
FCCH, SCH, BCCH, RACH,AGCH, PCH, SDCCH, CBCH,SACCH/C
TDMA Frame (120/26 ms)
0 1 2 3 22 23 24 25
26-frame Multiframe (120ms)
0 1 2 3 47 48 49 50
51-frame Multiframe (3060/13ms)
504948470 1 2 3
0 1 2524
20460 1 2 3 4 5 2047204520442043
1 Superframe=1326 TDMA Frames (6.12 s)
Figure 2.4. Structure of the GSM TDMA frames, multiframes, superframes and hyperframes (extracted from
[Walk00]).
The BSS provides a cell with a set of logical channels occupying several physical channels. On the
basis of the anticipated traffic load of a cell, the network operator establishes a particular channel
configuration. Each individual transceiver (TRX) can offer different channel combinations in
each TS. The TS is identified by a Time slot Number (TN). Three common combinations for
conventional GSM are [Walk00]:
• Low-capacity cell with one TRX:
− TN 0: FCCH + SCH + BCCH + CCCH + SDCCH/4(0,1,2,3) +
SACCH/C4(0,1,2,3)
− TN 1 to 7: TCH/F + FACCH/F + SACCH/TF
• Medium-capacity cell with four TRXs:
− Once on TN 0: FCCH + SCH + BCCH + CCCH
− Twice (on TN 2 and TN 4): SDCCH/8 + SACCH/8

Traffic Analysis at the Radio Interface in Converging Mobile and Wireless Communication Systems
22
− 29 times: TCH/f + FACCH/F + SACCH/TF
• High-capacity cell with 12 TRXs:
− Once on TN 0: FCCH + SCH + BCCH + CCCH
− Once on TN 2: BCCH + CCCH
− Once on TN 4: BCCH + CCCH
− Once on TN 6: BCCH + CCCH
− 5 times: SDCCCH/8 + SACCH/8
− 87 times: TCH/F + FACCH/F + SACCH/TF
As for conventional GSM, GPRS must allocate resources for signalling and traffic control. Some
of the GPRS specific control channels can be multiplexed with the conventional GSM channels
by using different possible channel configurations.
After successful synchronisation, the MS is informed through the system information of the
BCCH (Broadcast Control Channel), which channel combinations on which physical channels
are being offered to it by the BSS. Depending on its current operating state (idle state or
dedicated state), it uses a particular subset from this offering of channels.
In conventional GSM, a channel is permanently allocated for a particular user during the entire
call period (whether data is transmitted or not). In contrast to this, in GPRS channels are only
allocated when data packets are sent or received, and they are released after the transmission. For
bursty traffic this results in a much more efficient usage of the scarce radio resources. With this
principle, multiple users can share one physical channel.
The channel allocation in GPRS is different from the original GSM. GPRS allows a single MS to
transmit on multiple time slots of the same TDMA frame (multislot operation)1. This results in a
very flexible channel allocation: one to eight time slots per TDMA frame can be allocated to one
MS. Moreover, UL and DL are allocated separately, which efficiently supports asymmetric data
traffic (e.g., Web browsing).
A cell supporting GPRS may allocate physical channels for GPRS traffic, such a physical channel
being denoted as Packet Data CHannel (PDCH). PDCHs are taken from the common pool of all
1 Multislot operation is also supported in GSM for circuit switched data – HSCSD service.

Technologies Overview
23
channels available in the cell, thus, the radio resources of a cell are shared by all GPRS and non-
GPRS MSs located in this cell. The mapping of physical channels onto either PS (GPRS) or CS
(conventional GSM) services can be performed dynamically (capacity on demand principle
[3GPP02a]), depending on the current traffic load, the priority of the service, and the multislot
class. A network operator can decide to dedicate permanently or temporarily some physical
resources (i.e., PDCHs) for GPRS traffic. A load supervision procedure monitors the load of the
PDCHs in the cell and, according to the current demand, the number of channels allocated for
GPRS (i.e., the number of PDCHs) can be changed. Physical channels not currently in use by
conventional GSM can be allocated as PDCHs to increase the QoS for GPRS. When there is a
resource demand for services with higher priority, PDCHs can be de-allocated.
Various radio channel coding schemes are specified for GPRS, depending on the quality of the
channel, allowing bitrates from 9 to more than 150 kbps per user, Table 2.3. Under very bad
channel conditions, CS-1 may be used, obtaining a data rate of only 9.05 kbps per time slot, but
with a very reliable coding. Under good channel conditions, transmission is made without
convolutional coding and a data rate of 21.4 kbps per time slot is achieved. With eight time slots,
a maximum data rate of 171.2 kbps can be achieved; in practice, multiple users share the time
slots, thus, a much lower bitrate is available to the individual user. For example, approximately
40 kbps per user will be achieved, if three users share eight time slots and CS-3 is employed
[BeVE99]. CS-1 is used for the coding of the signalling channels. Nevertheless, if the overhead of
all protocols and the phenomena involved in the transmission are accounted for, then the actual
throughputs will be substantially smaller than those presented in Table 2.3 (less than 70 %
[Yaco02]).
Coding scheme Code rate Data rate per TS [kbps] CS-1 ½ 9.05
CS-2 ~2/3 13.4
CS-3 ~3/4 15.6
CS-4 1 21.4
Table 2.3. Channel coding schemes in GPRS (extracted from [BeVE99]).

Traffic Analysis at the Radio Interface in Converging Mobile and Wireless Communication Systems
24
2.2 The UMTS system (FDD mode)
2.2.1 Introduction
The conception of 3G wireless systems has been embodied by the International Mobile
Telecommunications-2000 (IMT-2000). IMT-2000 standards and specifications have been
developed by various standards organisations worldwide under the auspices of the International
Telecommunications Union (ITU). 3G telecommunication services target both mobile and fixed
users, with the access provided via a wireless link. A wide and ambitious range of user sectors,
radio technology, radio coverage, and user equipment is covered by IMT-2000 [Yaco02].
IMT-2000 provides access to a wide range of telecommunications services via several radio
interfaces, including both terrestrial and satellite component radio interfaces. The IMT-2000
CDMA Direct Spread and IMT-2000 CDMA TDD (Time Division Duplex) radio interfaces,
both using Direct-Sequence Code Division Multiple Access (DS-CDMA), have been developed
with the aim of interconnecting with the evolved GSM core network.
The IMT-2000 radio interface for DS-CDMA is referred to as Universal Terrestrial Radio Access
(UTRA) or Wideband CDMA (WCDMA). Within the IMT-2000 framework, the original target
of the 3G process was a single common global air interface. 3G systems are closer to this target
than were 2G systems: the same air interface – WCDMA – is to be used in Europe and Asia,
including Japan and Korea, using frequency bands around 2 GHz.
WCDMA supports two basic modes of operation: FDD and TDD. In the FDD mode, separate
5 MHz carrier frequencies are used for the UL and DL respectively, whereas in TDD only one
5 MHz is time-shared between UL and DL. The FDD mode is the main mode to be used in
UTRA, while the TDD one was added in order to leverage the basic WCDMA system also for
the unpaired spectrum allocations of the ITU for the IMT-2000 systems.
In UTRA, the radio interfaces are defined in such a way that a wide range of services including

Technologies Overview
25
speech, data, and multimedia can be simultaneously used by a subscriber and multiplexed on a
single carrier. Therefore, CS and PS services are efficiently supported, and real-time and non-real-
time operations employing transparent or non transparent data transport are specified. The QoS
is an important feature in UTRA, and it is specified to be adjusted in terms of parameters such as
delay, bit error rate, frame error rate, and others.
The integration of user equipment, UTRA and a core network results in a 3G system known as
the Universal Mobile Telecommunications System (UMTS).
In the next sections, an overview of the UMTS system and respective air interface is provided,
focusing mainly on UTRA FDD mode.
2.2.2 System architecture
UMTS consists of a number of logical network elements, each having a defined functionality. In
the standards, network elements are defined at the logical level, but this quite often results in a
similar physical implementation, especially since there are a number of standardised open
interfaces [HoTo00]. Functionally, the network elements are grouped into UMTS Terrestrial
Radio Access Network (UTRAN), which handles all radio-related functionalities, and the Core
Network (CN), which is responsible for switching and routing calls and data connections to
external networks. To complete the system, the User Equipment (UE) that interfaces with the
user and the radio interface is defined. Figure 2.5 shows elements in an UMTS PLMN and, in
order to illustrate the connections, also external networks.
From a specification and standardisation point of view, both the UE and the UTRAN consist of
completely new protocols, the design of which is based on the needs of the new WCDMA radio
technology. On the contrary, the definition of CN is adopted from GSM/GPRS. This gives the
system with new radio technology a global base of known CN technology that accelerates and
facilitates its introduction, and enables such competitive advantages as global roaming.
The UE consists of the Mobile Equipment (ME) and the UMTS Subscriber Identity Module
(USIM).

Traffic Analysis at the Radio Interface in Converging Mobile and Wireless Communication Systems
26
USIM
ME
Cu
Node B
Node B
RNC
Node B
Node B
RNC
IurIub
UE UTRAN
MSC/VLR
SGSN
GMSC
GGSN
HLR
CN
Uu Iu
PLMN, PSTN,ISDN, etc.
Internet
External Networks Figure 2.5. Network Elements in an UMTS PLMN (extracted from [HoTo00]).
The UTRAN architecture is shown in more detail in Figure 2.6. UTRAN consists of one or more
Radio Network Subsystems (RNS). An RNS is a sub-network within UTRAN and consists of
one Radio Network Controller (RNC) and one or more Node Bs. RNCs may be connected to
each other via an Iur interface. RNCs and Node Bs are connected with an Iub interface. The Iu,
Iur and Iub are logical interfaces, which may be provided via any suitable transport network.
RNSUSIM
ME
Cu
Node B
Node B
RNC
Node B
Node B
RNC
IurIub
UEUTRAN
MSC/VLR
SGSN
CN
UuIu CS
Iu PSRNS
Figure 2.6. UTRAN architecture (extracted from [HoTo00]).
The RNC is the network element responsible for the control of the radio resources of the
UTRAN. It interfaces the CN (normally to one MSC and one SGSN) and also terminates the
RRC (Radio Resource Control) protocol that defines the messages and procedures between the
mobile and UTRAN.
The main function of the Node B is to perform the air interface Layer 1 processing (channel
coding and interleaving, rate adaptation, spreading, etc.). It also performs some basic Radio
Resource Management (RRM) operations, such as the inner loop power control.
The main elements of CN, whose definition was adopted from GSM/GPRS, are HLR,
MSC/VLR, GMSC (Gateway MSC), SGSN, and GGSN.

Technologies Overview
27
2.2.3 Radio interface capacity aspects
The IMT-2000 spectrum allocation in Europe, Japan, Korea and the USA is shown in Figure 2.7.
In Europe and in most of Asia the IMT-2000 bands of 2×60 MHz (1920-1980 MHz plus 2110-
2170 MHz) will be available for UMTS FDD. The availability of the TDD spectrum varies: in
Europe it is expected that 25 MHz will be available for licensed TDD use in the 1900-1920 MHz
and 2020-2025 MHz bands. The rest of the unpaired spectrum is expected to be used by
unlicensed TDD applications in the 2010-2020 MHz band.
1800 1850 1900 1950 2000 2050 2100 2150 2200
EUROPE
JAPAN
KOREA
USA
UMTS FDD
UMTS TDD
PHS
IS - 95
GSM 1800
MSS
DECT
PCS
[MHz]
Figure 2.7. IMT-2000 spectrum allocation in Europe, Japan, Korea and USA (based on [HoTo00]).
WCDMA refers to a wideband DS-CDMA system, meaning that user information bits are spread
over a wide bandwidth by multiplying the user data with quasi-random bits (called chips) derived
from CDMA spreading codes. In order to support very high bitrates (up to 2 Mbps), the use of a
variable spreading factor and multicode connections is supported.
The chip rate of 3.84 Mchip/s used leads to a carrier bandwidth of approximately 5 MHz.
Subject to his operating licence, the network operator can deploy multiple 5 MHz carriers to
increase capacity, possibly in the form of hierarchical cell layers.
As already referred, WCDMA supports highly variable user data rates, in other words the concept
of obtaining Bandwidth-on-Demand (BoD). A frame of 10 ms duration is allocated to each user,

Traffic Analysis at the Radio Interface in Converging Mobile and Wireless Communication Systems
28
during which the user data rate is kept constant. However, the data capacity among users can
change from frame to frame.
There is no need for a global time reference, such as Global Positioning System (GPS), since
WCDMA supports the operation of asynchronous BSs.
The WCDMA air interface has been crafted in such a way that advanced CDMA receiver
concepts, such as multiuser detection and smart adaptive antennas, can be deployed by the
network operator as system options to increase capacity and/or coverage. Table 2.4 summarises
the main parameters related to the WCDMA air interface.
Multiple access method DS-CDMA
Duplexing method FDD / TDD
Base station synchronisation Asynchronous operation
Chip rate 3.84 Mcps
Carrier spacing 5 MHz
Frame length 10 ms
Service multiplexing Multiple services with different QoS requirements multiplexed on one connection
Multirate concept Variable spreading factor and multicode
Detection Coherent using pilot symbols or common pilot
Multiuser detection, smart antennas Supported by the standard, optional in the implementation
Table 2.4. Main WCDMA parameters (extracted from [HoTo00]).
In UTRA, the data generated at higher layers is carried over the air interface in transport
channels, which are mapped onto the physical layer to different physical channels. The physical
layer is required to support variable bitrate transport channels to offer BoD services, and to be
able to multiplex several services on one connection.
There are two types of transport channels: dedicated and common ones. The main difference
between them is that a common channel is a resource divided between all or a group of users in a
cell, whereas a dedicated channel resource, identified by a certain code on a certain frequency, is
reserved for a single user only. A list of the transport channels defined for UTRA is presented in
Table 2.5. In the “direction” column, the possible transmission links are indicated for each
channel (UL, DL or both).

Technologies Overview
29
Channel Type Links Channel identification
DCH Dedicated MS↔BS Dedicated Channel
BCH Common MS←BS Broadcast Channel
FACH Common MS←BS Forward Access Channel
PCH Common MS←BS Paging Channel
RACH Common MS→BS Random Access Channel
CPCH Common MS→BS Uplink Common Packet Channel
DSCH Common MS←BS Downlink Shared Channel
Table 2.5. Transport channels in UMTS (based on [HoTo00]).
The only dedicated transport channel is the dedicated channel, for which the term DCH is used.
The dedicated transport channel carries all the information intended for the given user coming
from layers above the physical layer, including data for the actual service as well as higher layer
control information.
The common transport channels needed for the basic network operation are RACH, FACH and
PCH, while the use of DSCH and CPCH is optional and can be decided by the network operator.
The different transport channels are mapped onto different physical channels, though some of
the transport channels are carried by identical (or even the same) physical channel.
The DCH is mapped onto two physical channels. The Dedicated Physical Data Channel
(DPDCH) carries higher layer information, including user data, while the Dedicated Physical
Control Channel (DPCCH) carries the necessary physical layer control information. These two
dedicated physical channels are needed to support efficiently the variable bitrate of DPDCH,
which can change from frame to frame.
Once the physical channels are formatted, they are ready for transmission. The transmission of
the physical channels consists of two processes: spreading and modulation, Figure 2.8. Spreading
consists of the following two operations: channelisation and scrambling. The channelisation
operation transforms each symbol into a number of chips, given by the Spreading Factor (SF),
thus, increasing the signal bandwidth. In the scrambling operation, the resulting spread signal is
further multiplied by a scrambling code, not changing the signal bandwidth and allowing the
signals from different sources to be separable. Finally, the chip sequence generated by the
spreading process is modulated (QPSK in DL and BPSK in UL) and transmitted over the radio
interface.

Traffic Analysis at the Radio Interface in Converging Mobile and Wireless Communication Systems
30
DATA
Channelisation code Scrambling code
Bit rate Chip rate Chip rate
Modulation
Figure 2.8. UTRA transmission: spreading and modulation.
Transmissions from a single source are separated by channelisation codes, i.e., DL connections
within one sector and the dedicated physical channel in the uplink from one terminal. The
channelisation codes of UTRA are based on the Orthogonal Variable Spreading Factor (OVSF)
technique [HoTo00]. The use of OVSF codes allows the spreading factor to be changed and
orthogonality between different spreading codes of different lengths to be maintained.
The transmission from different sources are separated by the scrambling codes. The
functionalities and characteristics of the spreading and channelisation codes are summarised in
Table 2.6.
Channelisation code Scrambling code
Usage UL: Separation of physical data (DPDCH) and control channels (DPCCH) from same terminal
DL: Separation of downlink connections to different users within one cell
UL: separation of terminal
DL: Separation of sectors (cells)
Length 4-256 chips (1.0-66.7µs)
DL additionally 512 chips
UL: 10ms = 38400 chips or 66.7 µs = 256 chips
DL: 10ms = 38400 chips
Number of codes
Number of codes under one channelisation code = spreading factor
UL: several millions
DL: 512
Code family Orthogonal Variable Spreading Factor Long code: Gold code
Short code: Extended S(2) code family
Spreading Increases transmission bandwidth Does not affect transmission bandwidth
Table 2.6. Functionalities of the channelisation and scrambling codes (adapted from [HoTo00]).
Managing power is of essential importance in WCDMA. In WCDMA based radio networks,
users are sharing the same bandwidth at the same time, thus, interfering with each other. Power
Control (PC) is applied in order to set the SIR (Signal to Interference Ratio) for each connection
to its target level, SIRT, providing the desired link quality while at the same time maximally

Technologies Overview
31
reducing the interference. PC not only decreases interference, and consequently improves system
capacity, but it is also crucial in order to overcome effects like the near-far effect.
In the UTRA FDD mode, open- and closed-loop PC can be distinguished. Open loop PC is used
if no direct feedback loop between UE and Node B is available, e.g., during connection set-up
phase on the random access channel. Thus, the transmit power has to be adjusted autonomously
by the respective transmitting network element. Open-loop PC is mainly applied with common
channels (e.g., random access channels). With closed-loop PC a feedback loop exists between UE
and Node B.
Closed-loop power control is used to adapt the transmit power on dedicated as well as shared
channels to the time varying radio link conditions, i.e., due to fading. Feedback from the receiving
station is directly used to set the power levels at the transmitting station for both, the data
channel and the corresponding control channel, which have a fixed relative power offset. The
closed-loop PC can be characterised by a two-staged process, comprising two feedback loops:
• The inner loop control loop, also referred to as fast power control, is performed
between UE and Node B. Its aim is to adapt the transmit power to the fast varying
radio link conditions mainly caused by fast fading. The SIR value is estimated at the
receiving station and a power up or down command is sent at a rate of 1500 Hz
depending on the fact if the value is lower or greater than SIRT.
• The outer loop aims to control the target level SIRT of the inner loop. For this
purpose the RNC measures the BLock Error Rate (BLER) of the received data, and
sets SIRT in order to match the desired BLER.
In the UL, the physical layer control information is carried by the DPCCH with a fixed spreading
factor of 256. The higher layer information, including user data, is carried on one or more
DPDCHs, with a possible spreading factor ranging from 256 down to 4. The UL transmission
may consist of one or more DPDCHs with a variable spreading factor, and a single DPCCH with
a fixed spreading factor.
The DPDCH data rate may vary on a frame-by-frame basis. Typically with a variable rate service
the DPDCH data rate is informed on the DPCCH. The DPCCH is transmitted continuously and
rate information is sent via the Transport Format Combination Indicator (TFCI).
The maximum user data rate on a single code is derived from the maximum channel bitrate,

Traffic Analysis at the Radio Interface in Converging Mobile and Wireless Communication Systems
32
which is 960 kbps without channel coding and a spreading factor of 4. With channel coding, the
practical maximum user data rate for the single code case is in the order of 400-500 kbps. When
higher data rates are needed, parallel code channels are used. Up to six parallel codes can be used,
raising the channel bitrate for data transmission up to 5740 kbps, which can accommodate
2 Mbps user data or an even higher data rate if the coding rate is ½. The achievable data rates
with different spreading factors are presented in Table 2.7. The rates given assume ½-rate coding
and do not include bits taken for coder tail bits or the Cyclic Redundancy Check (CRC). The
relative overhead due to tail bits and CRC bits has significance only with low data rates
[HoTo00].
DPDCH spreading factor
DPDCH channel bitrate
[kbps]
Maximum user data rate with ½-rate coding (approx.) [kbps]
256 15 7.5
128 30 15
64 60 30
32 120 60
16 240 120
8 480 240
4 960 480
4, with 6 parallel codes
5740 2300
Table 2.7. Uplink DPDCH data rates (extracted from [HoTo00]).
In addition to the UL dedicated channel, user data (low rate) can be sent on both the RACH and
CPCH. In the UL, services are multiplexed dynamically so that the data stream is continuous with
the exception of zero rate.
In DL, the spreading factor for the highest transmission rate determines the channelisation code
to be reserved from the given code tree. As the spreading factor is also always fixed in the DL
DPCH, the lower rates are implemented with Discontinuous Transmission (DTX), by gating the
transmission on/off or with repetition of the bits.
In the DL the spreading factors range from 4 to 512, with some restrictions on the use of
spreading factor 512 in the case of soft handover.

Technologies Overview
33
Modulation causes some differences between the UL and DL data rates. While the UL DPDCH
consists of BPSK symbols, the DL DPDCH consists of QPSK symbols. The DL data rates are
given in Table 2.8 with raw bitrates calculated from the QPSK-valued symbols.
When higher data rates are needed, parallel code channels are used as in the case of UL
transmission. Up to three parallel codes can be used, raising the channel bitrate for data
transmission up to 5760 kbps, which can accommodate 2 Mbps user data or an even higher data
rate if the coding rate is ½.
Spreading factor Channel bitrate [kbps]
DPDCH channel bitrate range
[kbps]
Maximum user data rate with ½-rate coding(approx.)
[kbps] 512 15 3-6 1-3
256 30 12-24 6-12
128 60 42-51 20-24
64 120 90 45
32 240 210 105
16 480 432 215
8 960 912 456
4 1920 1872 936
4, with 3 parallel codes
5760 5616 2300
Table 2.8. Downlink dedicated channel bitrates (based on [HoTo00]).
In addition to the DL dedicated channel, user data (low rate) can be sent on both the DSCH and
FACH. In the DL, services are multiplexed dynamically in a similar way than in UL.
In UTRA, two channel coding methods have been defined. Half-rate and 1/3-rate convolutional
coding are intended to be used with relatively low data rates, equivalent to the data rates provided
by 2G cellular networks today, though an upper limit has not been specified [HoTo00]. For
higher data rates 1/3-rate turbo coding can be applied, which typically brings performance
benefits when large enough block sizes are achieved.
The coding methods usable by different channels are summarised in Table 2.9. Although the
FACH has two options, the cell access use of FACH is based on convolutional coding, as not all
terminals support turbo coding.

Traffic Analysis at the Radio Interface in Converging Mobile and Wireless Communication Systems
34
DCH Turbo coding or convolutional coding
CPCH Turbo coding or convolutional coding
DSCH Turbo coding or convolutional coding
FACH Turbo coding or convolutional coding
Other common channels ½-rate convolutional coding
Table 2.9. Channel coding options for different channels (extracted from [HoTo00]).
When dimensioning an UMTS network (or more generally, a WCDMA network), it is very
important to estimate the air interface load. For this purpose, two load measures can be
considered [HoTo00]: load estimation based on throughput and based on power.
For the throughput based load estimation, the following two load parameters are considered: UL
Load Factor (LF), ηUL, and DL LF, ηDL. These two parameters are commonly used for the
purpose of predicting cell capacity and planning noise rise in the dimensioning process of
WCDMA networks, and are given by the following two equations [HoTo00]:
( )1
0
1(1 )1
ULN
ULj
bj j
j
i WE R vN
η=
= + ⋅+
⋅ ⋅
∑ ; (2.1)
( )( )0
1
1DL
bN
jDL j
jj
EN
v iWR
η α=
= ⋅ ⋅ − + ∑ . (2.2)
The parameters of these equations are explained in Table 2.10. These load equations allow for the
prediction of the amount of noise rise over thermal noise due to interference. The noise rise in
the UL is equal to -10⋅log10(1-ηUL). Similarly, the noise rise in the DL is given by -10⋅log10(1-ηDL).
When the load factors become close to 1, the corresponding noise rise approaches to infinity and
the system has reached its pole capacity.
The load estimation based on power for UL, ηUL’, and DL, ηDL’, are given by the following two
equations [HoTo00]:
' 1 NUL
total
PI
η = − (2.3)
max
' totalDL
PP
η = (2.4)

Technologies Overview
35
where PN is the background and receiver noise, Itotal is the received wideband interference power
(at the BS), Ptotal is the total DL transmission power and Pmax is the maximum BS transmission
power. Itotal can be divided into the powers of own-cell (= intra-cell) users, Iown, other-cell (=inter-
cell) users, Ioth, and PN:
owntotal oth NI I I P= + + . (2.5)
Parameter Definition NUL Number of users per cell
NDL Number of connections per cell=number of users per cell⋅(1+soft handover overhead)
vj Activity factor of user j at physical layer
Eb/N0 Signal energy per bit divided by noise spectral density that is required to meet a predefined QoS (e.g., bit error rate). Noise includes both thermal noise and interference
W WCDMA chip rate (3.84 Mcps)
Rj Bitrate of user j (dependent on service)
i Other cell to own cell interference ratio seen by the BS receiver
α Average orthogonality factor in the cell
i Average ratio of other cell to own cell base station power received by user
Table 2.10. Parameters used in UL LF and DL LF calculation (based on [HoTo00]).
The two load estimation methods (throughput and power) provide different tools for load
measuring. For instance:
• In the power based approach for DL, the total base station transmission power Ptotal
does not provide accurate information concerning how close to the downlink air
interface pole capacity the system is operating, in opposition to the throughput
based one. For example, in a small cell the same Ptotal corresponds to a higher air
interface loading than in a large cell.
• In the power based approach for UL, interference from adjacent cells is directly
included in the load estimation, meaning that if the loading in adjacent cells is low,
this can be seen in the power based load measurement, and a higher load can be
allowed in this cell, i.e., soft capacity can be obtained. In opposition, UL throughput
based load estimation does not take interference from adjacent cells or adjacent
carriers directly into account.

Traffic Analysis at the Radio Interface in Converging Mobile and Wireless Communication Systems
36
2.3 The HIPERLAN/2 system
2.3.1 Introduction
The increasing demand for "anywhere, anytime" communications and the merging of voice,
video and data communications has created a demand for broadband wireless networks. Under
this scope, ETSI created the BRAN [ETSI00a] project to develop standards and specifications
for broadband radio access networks that cover a wide range of applications and are intended for
different frequency bands (licensed and license exempt use). The BRAN project covers the
following systems: HIPERLAN/1, HIPERLAN/2, HIPERACCESS and HIPERLINK
[ETSI00a]. In the present report, one will concentrate on the HIPERLAN/2 system, which
basically acts as a WLAN system offering high bitrates.
HIPERLAN/2 is a standard for a high speed radio communication system with typical data rates
from 6 Mps to 54 Mbps. It connects portable devices with broadband networks that are based on
IP, ATM (Asynchronous Transfer Mode) and other technologies. Centralised mode is used to
operate HIPERLAN/2 as an access network via a fixed access point. In addition, a capability for
direct link communication is provided. This mode is used to operate HIPERLAN/2 as an ad-hoc
network without relying on a cellular network infrastructure.
HIPERLAN/2 is capable of supporting multimedia applications by providing mechanisms to
handle QoS. Restricted user mobility is supported within the local service area; wide area mobility
(e.g., roaming) may be supported by standards outside the scope of the BRAN project.
HIPERLAN/2 systems are intended to be operated in the 5 GHz band.

Technologies Overview
37
2.3.2 System architecture
A HIPERLAN/2 network typically has a topology as depicted in Figure 2.9. MTs communicate
with the Access Points (AP) over a radio interface as defined by the HIPERLAN/2 standards.
There is also a direct mode of communication between two MTs (as previously referred), which
is still in its early phase of development and is not further considered in this report. The user of
the MT may move around freely in the HIPERLAN/2 network, which will ensure that the user
gets the best possible transmission performance. An MT, after association has been performed
(can be viewed as a login), only communicates with one AP in each point in time. APs see to that
the radio network is automatically configured, taking into account changes in the radio network
topology, i.e., there is no need for manual frequency planning.
Backbone Network
AP cell MT
AP
AP cell
MT
MT
MT
AP
Figure 2.9. HIPERLAN/2 network structure (extracted from [KrSa01]).
The geographical area covered by an AP cell depends on the environment; a radio range of about
30 m in an indoor environment and about 100 to 150 m in an outdoor environment is expected
[KrSa01]. The AP cell is connected to a Backbone Network (BN) through the AP. The BN can
for example be a wired Ethernet LAN (Local Area Network). Through the BN, different AP cells
are interconnected and an increased coverage is accomplished. The BN also provides specific
services for MTs, e.g., access to Internet. Different AP cells may partially overlap and an MT,
which is dynamically associated to an AP cell, can therefore with a handover or a reassociation
mechanism move between two different cells.
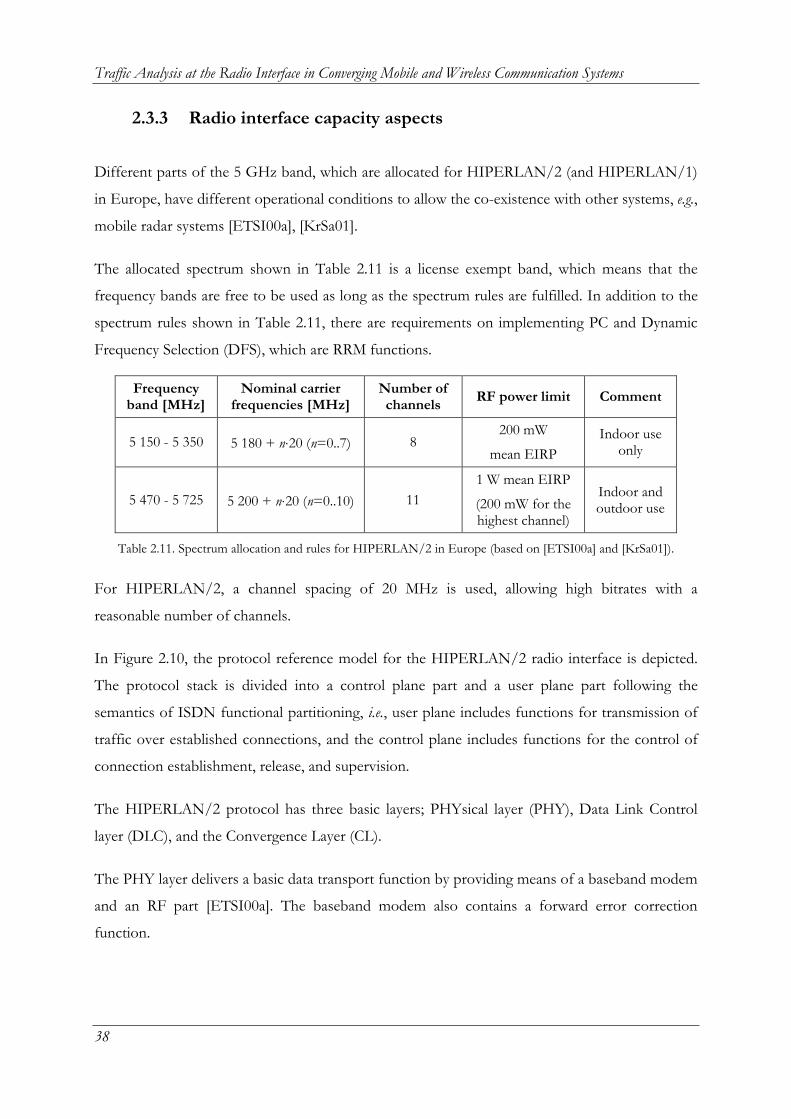
Traffic Analysis at the Radio Interface in Converging Mobile and Wireless Communication Systems
38
2.3.3 Radio interface capacity aspects
Different parts of the 5 GHz band, which are allocated for HIPERLAN/2 (and HIPERLAN/1)
in Europe, have different operational conditions to allow the co-existence with other systems, e.g.,
mobile radar systems [ETSI00a], [KrSa01].
The allocated spectrum shown in Table 2.11 is a license exempt band, which means that the
frequency bands are free to be used as long as the spectrum rules are fulfilled. In addition to the
spectrum rules shown in Table 2.11, there are requirements on implementing PC and Dynamic
Frequency Selection (DFS), which are RRM functions.
Frequency band [MHz]
Nominal carrier frequencies [MHz]
Number of channels RF power limit Comment
5 150 - 5 350 5 180 + n⋅20 (n=0..7) 8 200 mW
mean EIRP Indoor use
only
5 470 - 5 725 5 200 + n⋅20 (n=0..10) 11 1 W mean EIRP
(200 mW for the highest channel)
Indoor and outdoor use
Table 2.11. Spectrum allocation and rules for HIPERLAN/2 in Europe (based on [ETSI00a] and [KrSa01]).
For HIPERLAN/2, a channel spacing of 20 MHz is used, allowing high bitrates with a
reasonable number of channels.
In Figure 2.10, the protocol reference model for the HIPERLAN/2 radio interface is depicted.
The protocol stack is divided into a control plane part and a user plane part following the
semantics of ISDN functional partitioning, i.e., user plane includes functions for transmission of
traffic over established connections, and the control plane includes functions for the control of
connection establishment, release, and supervision.
The HIPERLAN/2 protocol has three basic layers; PHYsical layer (PHY), Data Link Control
layer (DLC), and the Convergence Layer (CL).
The PHY layer delivers a basic data transport function by providing means of a baseband modem
and an RF part [ETSI00a]. The baseband modem also contains a forward error correction
function.

Technologies Overview
39
Figure 2.10. HIPERLAN/2 protocol reference model (extracted from [John99]).
The DLC layer consists of the Error Control (EC) function, the Medium Access Control (MAC)
function and the Radio Link Control (RLC) function. It is divided into the user data transport
functions and the control functions. The user data transport function is fed with user data
packets from higher layers via the User Service Access Point (U-SAP). This part contains the EC,
which performs an ARQ (Automatic Repeat Request) protocol. The RLC Sublayer delivers a
transport service to the DLC Connection Control (DCC), the RRC and the Association Control
Function (ACF).
The CL has two main functions: it adapts service requests from higher layers to the service
offered by the DLC, and it converts higher-layer packets of fixed or variable length into a fixed
length Service Data Unit (SDU) that is used within the DLC [KMST00].
The air interface is based on TDD and TDMA, i.e., the time-slotted structure of the medium
allows for simultaneous communication in both DL and UL within the same time frame, called
MAC frame in HIPERLAN/2. Time slots for DL and UL communication are allocated
dynamically depending on the need for transmission resources. The basic MAC frame structure
on the air interface has a fixed duration of 2 ms and comprises transport channels for broadcast
control, frame control, access control, DL and UL data transmission and random access (see
Figure 2.11). All data from both AP and MTs is transmitted in dedicated time slots, except for
the random access channel (RCH) where contention for the same time slot is allowed. The
duration of broadcast control is fixed, whereas the duration of other fields is dynamically adapted

Traffic Analysis at the Radio Interface in Converging Mobile and Wireless Communication Systems
40
to the current traffic situation. The MAC frame and the transport channels form the interface
between DLC and the PHY layer.
Frame type 2 bits
SN 10 bits
CL 12 bits
CRC 3 bytes
Data 48 bytes
LCH 54 bytes
SCH SCH LCH LCH BCH 15 bytes
FCH ACH 9 bytes
Broadcast phase Uplink phase RCH phase
Downlink phase BurstBurst
Frame type 4 bits
Info 52 bits
CRC 2 bytes
SCH 9 bytes
MAC frame MAC frame 2 ms
MAC frame
Figure 2.11. MAC frame structure in HIPERLAN/2 (extracted from [KrSa01]).
A MAC frame comprises a broadcast phase, downlink phase, uplink phase and a random access
phase. The broadcast phase comprises fields for broadcast control (BCH), frame control (FCH)
and access feedback control (ACH). The uplink and downlink phases carry traffic from/to an
MT in bursts of packets called Long CHannels (LCH) and Short CHannels (SCH). A LCH
contains control or user data and a SCH contains only control data (e.g., acknowledgements and
Resource Requests – RR - in the uplink) and is always generated by the DLC layer.
Both logical and transport channels were introduced in the HIPERLAN/2 standards, in order to
improve readability and to define exact terms for the structures that are used to construct MAC
frames [ETSI00b]. The logical channels are mapped onto different transport channels. The
transport channels are the basic elements to construct PDU (Packet Data Unit) trains. The PDU
trains (that consist of a sequence of transport channels) represent the interface between the DLC
protocol and the PHY layer [ETSI01]. Transport channels describe the basic message format.
The message contents and their interpretation, however, are subject to the logical channels.
Table 2.12 contains a list of the HIPERLAN/2 transport and logical channels (according to
[ETSI00b]), and in the “direction” column indicates the possible transmission links on each
channel (UL, DL or both).

Technologies Overview
41
Type Links Channel Channel identification
MS←BS BCH Broadcast Channel
MS←BS FCH Frame Channel
MS←BS ACH Access Feedback Channel
MS↔BS SCH Short Transport Channel
MS↔BS LCH Long Transport Channel
Transport
Channels
MS→BS RCH Random Access Channel
MS←BS BCCH Broadcast Control Channel
MS←BS FCCH Frame Control Channel
MS←BS RFCH Random Access Feedback Channel
MS↔BS RBCH RLC Broadcast Channel
MS↔BS DCCH Dedicated Control Channel
MS↔BS UBCH User Broadcast Channel
MS↔BS UMCH User Multicast Channel
MS↔BS UDCH User Data Channel
MS↔BS LCCH Link Control Channel
Logical
Channels
MS→BS ASCH Association Control Channel
Table 2.12. HIPERLAN/2 transport and logical channels (based on [ETSI00b]).
Downlink or uplink traffic (DL- and UL-phase, bidirectional) consists of PDU trains to and from
MTs. A PDU train comprises DLC user PDUs (U-PDUs of 54 bytes with 48 bytes of payload)
and DLC control PDUs (C-PDUs of 9 bytes) to be transmitted or received by one MT. There is
one PDU train per MT (if resources have been granted in the FCH). The C-PDUs are referred to
as the SCH, and the U-PDUs are referred to as the LCH.
The PHY layer breaks down the packets from the MAC layer into Orthogonal Frequency
Division Multiplex (OFDM) symbols and transmits them [KrSa01]. In OFDM, the available
bandwidth is divided into several sub channels where each sub channel is modulated and
transmitted in parallel. The sub-carrier frequencies are chosen so that the different signals carried
by these frequencies are orthogonal in time, thereby the name. Four of the 52 sub-carriers are
pilots, which facilitate phase tracking for coherent demodulation.
The PHY layer provides several transmission modes with different coding rates and modulation
schemes. The benefit of using different schemes is that a scheme supporting a high transmission

Traffic Analysis at the Radio Interface in Converging Mobile and Wireless Communication Systems
42
rate can be used when transmission conditions are favourable. The function of choosing
modulation schemes depending on transmission conditions is called Link Adaptation (LA). LA
can be based on estimated C/I values at the receiver and this of course requires protocols for
initiating and sending measurements. Another technique is more simple and selects the mode
depending on PDER (PDU Error Rate). In Table 2.13 the different transmission modes are
presented together with requirements on receiver sensitivity. The data rate ranging from 6 to
54 Mbps can be varied by using the several transmission modes for each OFDM sub-carrier.
Mode Modulation and coding rate Code rate
PHY layer transmission rate
[Mbps]
Receiver sensitivity
[dBm] 1 BPSK ½ 6 -85
2 BPSK ¾ 9 -83
3 QPSK ½ 12 -81
4 QPSK ¾ 18 -79
5 16-QAM 9/16 27 -75
6 16-QAM ¾ 36 -73
7 64-QAM ¾ 54 -68
Table 2.13. Transmission modes and requirements for HIPERLAN/2 (based on [ETSI01] and [KrSa01]).
The PHY layer supports other RRM functionalities, besides LA, such as DFS, PC and handover.
The main purpose of these functions is to increase the overall performance of the system
HIPERLAN/2 uses a centralised control mechanism, and the AP is responsible for assigning
radio resources within the MAC frame.
Any MT that wants initial access to the radio network uses the RCH for sending a RR to the AP.
If a collision occurs during a resource request, the AP will inform the requesting MT in the
following ACH and a backoff procedure in the RCH will take place. After a successful RR, which
is indicated in the ACH, the MT goes into a contention free mode where the AP schedules the
MTs transmissions. A RR contains the number of pending LCHs in the MT and the AP uses this
information when assigning radio resources. The FCH sent by the AP contains an exact
description of the resource allocation within a MAC frame, i.e., the time slots during which an
MT shall transmit or receive. The length of the FCH depends on the number of scheduled
sessions. The BCH is used by the AP to broadcast cell information such as the identity of the AP,
the AP transmission power and the expected received power level at the AP. The transmission

Technologies Overview
43
mode used in the broadcast phase and the RCH phase is the most robust (mode 1) since this
information is supposed to be received by all MTs in the AP cell.
HIPERLAN/2 supports QoS by allowing the access point to set up and manage different radio
bearers during transmission [KMST00]. The AP selects the appropriate error control mode
(acknowledged, unacknowledged and repetition) including detailed protocol settings (e.g., ARQ
window size, number of retransmissions, discarding). Scheduling is performed at the MAC level,
where the AP determines how much data and control signalling will be sent in the current MAC
frame. For example, by regularly polling a mobile terminal for its traffic status (pending data to be
transmitted), the AP provides the terminal’s radio bearer with short access delay. The polling
mechanism provides rapid access for real-time services. Additional QoS support includes LA and
internal functions (admission, congestion, and dropping mechanisms) for avoiding overload
situations.

Traffic Analysis at the Radio Interface in Converging Mobile and Wireless Communication Systems
44

Services Characterisation and Traffic Source Models
45
Chapter 3
Services Characterisation and Traffic Source Models
3 Services Characterisation and Traffic Source Models
In this chapter, the services and applications that are considered in the present work are
described. A detailed characterisation and parameterisation of traffic source models, as well as of
generation and duration processes, for each considered application is also presented. At the end
of the chapter, a mapping of the technologies (GSM/GPRS, UMTS and HIPERLAN/2) versus
the services/applications and traffic source models is performed.

Traffic Analysis at the Radio Interface in Converging Mobile and Wireless Communication Systems
46
3.1 Services characterisation
In order to start the characterisation of the services and applications that will be considered in the
present work, a definition of the terms services, applications, and service capabilities will be
initially presented, followed by a detailed definition of each service capability and service class. At
the end of this section, a description, classification, and characterisation of each service and
application that will be used in the current work is presented.
3.1.1 Definitions
This section provides an overview of the definitions of service, application, and service
capabilities, in order to have a clear understanding of these terms throughout the present report.
The definition of services given by standardisation (ITU-T) [EURE00] is:
• This term represents telecommunication capabilities that the customer buys or
leases from a service provider. Service is an abstraction of the network-element-
oriented or equipment-oriented view. Identical services can be provided by
different network elements, and different services can be provided by the same
network elements.
• A set of functions and facilities offered to a user by a provider.
Services are not directly accessible by users; they have to be utilised by other services and/or
applications. Services can contain rather complex program logic (potentially implemented by
modules), or they can be simple wrappers to other services and/or modules. One service can
serve several service consumers at the same time. The execution environment of a service is a
server.
The definition of applications given by standardisation (ITU-T) [EURE00] is:
• The word application is used as the generic term to represent the set of features,

Services Characterisation and Traffic Source Models
47
combining communication and document processing, on which end users may
perform operations. Applications may depend on working methods, and on
allowed processing of documents. Examples of "Applications" are: open
interchange of processable documents, co-operative working, etc.
• A set of activities performed to respond to the needs of users in a given situation,
for purposes such as business, education, personal communication or
entertainment. It implies software and hardware utilisation, which could be
performed in a fully or partially automatic way, and could be accessed locally or
remotely. In the last case, it requests use of telecommunication services.
Regarding service capabilities, the following definition is adopted:
• Service capabilities are the characteristic parameters of a service.
Examples of Service Capabilities include information type, intrinsic time dependency,
directionality of connection, transfer delay and bit error rate.
3.1.2 Service capabilities
The following are the service capabilities that will be considered for service characterisation
within the present work [Kwok95]:
• Information type: Information to be communicated can be classified as one of the
following type (or combination of types): sound, video and sound, text, data, still
image, graphics. Multimedia representation designates a mixture of text, data,
graphics, sound, still image or video information types.
• Intrinsic time dependency: Information can be classified as Time-Based (TB) or
Non-Time-Based (NTB). Time-based information is user data that has an intrinsic
time component. Video, audio and animation are time-based information, because
they generate a continuous sequence of data blocks that must be displayed or
played back consecutively at predetermined time instants. For example, video can
be displayed at 15 or 30 video frames/s. On the other hand, text and images are
non-time-based information.
• Delivery requirements: An application can be classified according to its

Traffic Analysis at the Radio Interface in Converging Mobile and Wireless Communication Systems
48
information delivery requirements as a Real-Time (RT) or a Non-Real-Time (NRT)
one. Real-time is one that requires information delivery for immediate
consumption. In contrast, non-real-time application information is stored (perhaps
temporarily) at the receiving points for later consumption.
Users who communicate via a real-time application must be present at the same
time, whereas those who communicate via a non-real-time application can
participate at different times. The former requires sufficient bandwidth, while the
latter requires sufficient storage (and potentially bandwidth as well if delivered at
high speed). For example a telephone conversation is considered real-time, while
sending Email is non-real-time.
• Directionality of connection: Communications can be Unidirectional (Uni) or Bi-
directional (Bid). For example, an usual telephone call is a bi-directional application,
while radio broadcasting is an unidirectional one.
• Symmetry of connection: In general, a communication is bi-directional, and bi-
directional applications can be classified as either symmetric or asymmetric. A
broadcast application is an extreme example of an asymmetric application that is
one-way only, while telephony is a symmetric application.
• Number of parties: Depending on whether there are two or more parties
involved, an application can be classified as either point-to-point (two parties) or
multipoint (more than two), respectively. Obviously, point-to-point (One-to-One,
O-O) applications require only point-to-point connections, while multipoint
applications require multiparty connection types, such as point-to-multipoint (One-
to-Many, O-M), multipoint-to-point (Many-to-One, M-O), or multipoint-to-
multipoint (Many-to-Many, M-M) connections.
• Switching mode: There are two possible transmission modes: PS or CS. In the CS
type of connection, a dedicated path is established between the transmitting and
receiving devices before transmission is begun. PS is a mode of data transmission in
which messages are broken into packets, each of which can be routed separately
from a source, then reassembled in the proper order at the destination.
• Average duration: Average duration quantifies the average duration of a
connection/session.
• Transfer delay: This is the time used to transmit information through the air

Services Characterisation and Traffic Source Models
49
interface and the network. It includes channel coding/decoding, interleaving,
propagation delay, etc. Delay variation within a call may also occur due to changes
in the channel delay, compared to the average delay. In CS type of connections, the
jitter can be thought to be insignificant; consequently, the delay is a constant.
• Bitrate range: Bitrate range designates the foreseen range of bitrate values a certain
application can support.
• Burstiness: Burstiness is the ratio between peak and average bitrates. A
communication with low burstiness is for example a streaming application (e.g.,
audio on-demand), where a continuous stream of information is transferred during
the connection/session. Interactive applications (e.g., web browsing) are typically
applications with high burstiness, because in short periods of time high amounts of
data are transferred (when a certain web page is downloaded), while
communication does not exist during long periods of time (the user is reading the
page).
• Bit Error Rate and Frame Erasure Rate: Bit Error Rate (BER) is the ratio of lost
or erroneous bits to total transferred information bits. Frame Erasure Rate (FER) is
the ratio of erased frames to total frames2. These parameters refer to the end user /
application QoS requirements.
3.1.3 Service classes
Different types of applications have different characteristics and performance requirements. The
large set of possible applications has been grouped into four main categories of service classes, by
3GPP [3GPP02d], according to different QoS requirements. Although this classification is
envisaged for UMTS, it can also be adopted for other wireless systems, since these classes are
general enough to cover most of the foreseen services for NG (Next Generation) wireless
networks. The four services classes are [3GPP02d]:
2 Care should be used to distinguish between frame erasure rate (FER) and frame error rate. They are similar, but not
identical. Erased frames usually are counted as errored frames, but not all errored frames are erased, that is, some
may be undetected by the receiver.

Traffic Analysis at the Radio Interface in Converging Mobile and Wireless Communication Systems
50
• Conversational class
• Streaming class
• Interactive class
• Background class.
In the next paragraphs each of these service classes is described in detail, as presented in
[3GPP02d]. As it will be seen in this description, some of the parameters (service capabilities)
presented in the previous section are key attributes for the distinction among classes.
• Conversational class
The most well known use of conversational class is telephony speech (e.g., GSM). But with
Internet and multimedia, a number of new applications will require this scheme, for example
VoIP and video conferencing tools. Real-time conversation is always performed between peers
(or groups) of live (human) end-users. This is the only scheme where the required characteristics
are strictly given by human perception.
The real-time conversation scheme is characterised by a low transfer time, because of the
conversational nature of the scheme, and at the same time the time relation (variation) among
information entities of the stream must be preserved in the same way as for real-time streams.
The maximum transfer delay is given by the human perception of video and audio conversation.
Therefore, the limit for acceptable transfer delay is very strict (less than 200 ms), as failure to
provide low enough transfer delay will result in unacceptable lack of quality. The transfer delay
requirement is both significantly lower and more stringent than the round trip delay of the
interactive traffic case. Traffic is nearly symmetric in this service class.
• Streaming class
When the user is looking at (listening to) real-time video (audio) the scheme of real-time streams
applies. Multimedia streaming is a technique for transferring data such that it can be processed as
a steady continuous stream (e.g., a client browser can start displaying data before the entire file has
been received). The real-time data flow is always aiming at a live (human) destination. Streaming
services are mostly unidirectional (applications are very asymmetric.). At the receiver, streaming
data is played by a suitable independent media player application (downloadable from the Web or
readily bundled to a browser) or a browser plug-in.
This scheme is one of the newcomers in data communication, raising a number of new

Services Characterisation and Traffic Source Models
51
requirements in both telecommunication and data communication systems.
Another characteristic of this service class is that time relations (variation) among information
entities (i.e., samples, packets) within a flow must be preserved, although it does not have strict
requirements on low transfer delay.
The delay variation of the end-to-end flow must be limited, to preserve the time relation
(variation) between information entities of the stream. But as the stream normally is time aligned
at the receiving end (in the user equipment), the highest acceptable delay variation over the
transmission media is given by the capability of the time alignment function of the application.
Thus, acceptable delay variation is much greater than the delay variation given by the limits of
human perception.
• Interactive class
When the end-user, that is either a machine or a human, is on line requesting data from remote
equipment (e.g., a server), the interactive scheme applies. Examples of human interaction with the
remote equipment are: web browsing, data base retrieval, and server access. Examples of
machines interaction with remote equipment are: polling for measurement records, and
automatic data base enquiries (tele-machines).
Interactive traffic is a classical data communication scheme that on an overall level is
characterised by the request response pattern of the end-user. At the message destination there is
an entity expecting the message (response) within a certain time. Round trip delay time is
therefore one of the key attributes. Another characteristic is that the content of the packets must
be transparently transferred (with low bit error rate).
• Background class
When the end-user, which is typically a computer, sends and receives data-files in the
background, this scheme applies. Examples are background delivery of Emails, SMS, download
of databases and reception of measurement records.
Background traffic is one of the classical data communication schemes that on an overall level is
characterised by that the destination is not expecting the data within a certain time (they do not
require immediate action). Thus, the scheme is more or less delivery time insensitive. Delay may
vary from seconds to minutes or even hours. Another characteristic is that the content of the

Traffic Analysis at the Radio Interface in Converging Mobile and Wireless Communication Systems
52
packets must be transparently transferred (with low bit error rate).
Table 3.1 resumes and compares the main characteristics of the different service classes described
previously.
Class Conversational Streaming Interactive Background
Fundamental characteristics/ requirements
Preserve time relation (variation) among information entities of the stream.
Conversational pattern (stringent and low delay).
Preserve time relation (variation) among information entities of the stream.
Request response pattern within a certain time; round-trip delay time is therefore a key attribute.
Preserve payload content: packets must be transparently transferred with low bit error rate.
Destination is not expecting the data within a certain time.
Preserve payload content: packets must be transparently transferred with low bit error rate.
Transfer delay Minimum
Fixed
Minimum
Variable
Moderate
Variable
Large
Variable
Buffering No Allowed Allowed Allowed
Nature of traffic Symmetric Asymmetric Asymmetric Asymmetric
Bandwidth Guaranteed bitrate
Guaranteed bitrate
No guaranteed bitrate
No guaranteed bitrate
Table 3.1. Main characteristics of the different service classes.
The main distinguishing factor among these classes is how delay sensitive traffic is.
Conversational is meant for traffic that is very delay sensitive, while Background is the most delay
insensitive traffic class.
Conversational and Streaming classes are mainly intended to be used to carry real-time traffic
flows. The main divider between them is how delay sensitive traffic is. Conversational real-time
services, like video telephony, are the most delay sensitive applications and those data streams
should be carried in Conversational class.
Interactive and Background classes are mainly meant to be used by traditional Internet
applications, like WWW, Email, Telnet, FTP (File Transfer Protocol) and News. Due to less
stringent delay requirements, compared to Conversational and Streaming classes, both provide
better error rate by means of channel coding and retransmission.

Services Characterisation and Traffic Source Models
53
Traffic in the Interactive class has higher priority in scheduling than Background class traffic, so
background applications use transmission resources only when interactive applications do not
need them. This is very important in a wireless environment, where the bandwidth is low
compared to fixed networks.
3.1.4 Selected services and applications description and characterisation
Within the present work, a limited and representative set of services and applications will be
considered for the activities developed in the following chapters. This set should be
heterogeneous enough, in order to translate the multiplicity of services, applications and traffic
patterns that the systems under consideration in the present work will bear.
The selected set of services and applications is presented in Table 3.2. As it can be seen in the
table, services and applications covering all four service classes, as well as all the main
information types, are considered.
Service Class Information Type
Selected Services Selected Applications
Sound Speech-telephony Voice Call Conversational
Video, Sound Video-telephony Video Call
Streaming Video, Sound Video Streaming Video on Demand
Interactive Multimedia Multimedia Communication Service Web Browsing (WWW)
Data, Sound Messaging Email Background
Multimedia Unrestricted Data Retrieval Service FTP
Table 3.2. Selected services and applications.
In the following paragraphs, a description, classification and characterisation of the selected
services and applications (Table 3.2) is presented.
In the following tables, services are grouped into the 3GPP service classes, described in section
3.1.3. In each class, services are also grouped according to the type of information.

Traffic Analysis at the Radio Interface in Converging Mobile and Wireless Communication Systems
54
Type of Information
Services Description Reference
Sound Speech telephony
Provides a traditional speech quality two-way conversational service between one or many user devices. In the near future, as IPv6 based networks evolve, speech telephony will tend to become VoIP.
[UMTS01]
Video and Sound
Video-telephony
Communication for the transfer of voice (sound) and video between two or more locations (person-to-person). There is a wide range of quality of service levels for video telephony.
[ITUT93]
Table 3.3. Conversational services description.
Type of
Information Services Description Reference
Video and Sound Video streaming
One-way video (and sound) streaming. Represents a pull model of content delivery on a one-to-one or one-to-many multicast basis.
[HoTo00]
Table 3.4. Streaming services description.
Type of
Information Services Description Reference
Multimedia Multimedia
Communication Service
Exchange between users and workstations or user-to-user transfer of a range of multimedia documents with minimal delay.
[ITUT93]
Table 3.5. Interactive services description.
Type of
Information Services Description Reference
Data, Sound Messaging Point-to-point one-way connectionless transmission of data or sound or multimedia messages between users or machine and users.
[ITUT93]
Data Unrestricted
Data Retrieval Service
Transfer of unrestricted data, without stringent constraints on delay or transfer times. [ITUT93]
Table 3.6. Background services description.
In Table 3.7, the selected applications are presented and described.

Services Characterisation and Traffic Source Models
55
Application Description Reference
Voice Call One to one voice communication with at least GSM voice quality, and connection expectations (at all mobility levels).
[SPWW02]
Video Call One to one voice and video communication. This application can be used in a conversational way, but also to transmit video of the users’ surroundings in a wide variety of activities, from shopping to telemedicine to police work. Face to face calls will usually be made while the user is stationary, but moving in vehicles at any speed.
[SPWW02]
Video on Demand
Browsing for a short video clip (e.g., news, advertisement or sports) of an event, and then watching it, stationary or moving. This application can be for entertainment, business, educational or training purposes.
[SPWW02]
Web Browsing Downloading of mixed media. It is one of the nowadays most popular multimedia applications, also with large future foreseen acceptance (e.g., Mobile Internet). This information contains text, extensive graphics, video and audio sequences.
It gives access to a wide number of areas: Communications and community (Email, calendar and chat), information (news, weather, directories), lifestyle (events, restaurants, movies, games), travel (hotel listings, direction assistance, timetables), transaction (banking, stock trading, purchasing and auctions), other (information about personalisation, location-based services, device type, advertising).
[UMTS01]
Email A process of sending messages in electronic form. These messages are usually in text form. However, they can also include images and video clips.
[UMTS01]
FTP Application with FTP functionalities, allowing interactive browsing of directories and transfer of files. It allows the transfer of any type of data file between different types of computers or networks.
[UMTS01]
Table 3.7. Applications description.
A detailed characterisation of the services and applications previously described, using the
parameters (service capabilities) identified in section 3.1.2, is presented in what follows.
In Table 3.8 to Table 3.11, Conversational, Streaming, Interactive and Background services and
applications are characterised, mainly based on [FCXV03] (which is focussed on UMTS oriented
services and applications).

Traffic Analysis at the Radio Interface in Converging M
obile and Wireless Communication Systems
56
Service Capabilities T
ype of
Info. Service
Applications T
B/ N
TB
RT
/ N
RT
Uni/
BidSym
/ Asy
Part. CS/ PS
Average D
uration [s]
Transfer D
elay [s]
Bitrate R
ange [kbps]
BurstinessBE
R/
FER
Sound Speech-
telephony V
oice Call TB
RT Bid
Sym
O-O
CS/PS
120 <
0.15 4-25
1-5
<10
-4 BER
[HoTo00]
< 3 %
FER
[3GPP01c]
Video,
Sound V
ideo-telephony V
ideo Call TB
RT Bid
Sym
O-O
CS/PS
120 <
0.15 32-384
1-5 <
1 % FE
R [3G
PP01c]
Table 3.8. Conversational services and applications characterisation.
Service Capabilities T
ype of
Info. Service
Applications T
B/ N
TB
RT
/ N
RT
Uni/
BidSym
/ Asy
Part. CS/ PS
Average D
uration [s]
Transfer D
elay [s]
Bitrate R
ange [kbps]
BurstinessBE
R/
FER
Video,
Sound V
ideo streaming
Video on
Dem
and TB
RT Bid
Asy.
O-O
O-M
CS/PS
300 <
10 32-384
1 <
10-6 BE
R <
1 % FE
R [3G
PP01c]
Table 3.9. Streaming services and applications characterisation.
Service Capabilities T
ype of
Info. Service
Applications T
B/ N
TB
RT
/ N
RT
Uni/
Bid
Sym/
Asy Part.
CS/ PS
Average D
uration [s]
Transfer D
elay [s]
Bitrate R
ange [kbps]
BurstinessBE
R
Multi-
media
Multim
edia Com
munication
Service W
eb Browsing
TB/ N
TB RT
Bid A
sy O
-O
PS 300
<4/pag
< 2000
1-20 <
10-6 BE
R [PCM
F99]
Table 3.10. Interactive services and applications characterisation.

Services Characterisation and Traffic Source Models
57
Service Capabilities T
ype of
Info. Service
Applications T
B/ N
TB
RT
/ N
RT
Uni/
BidSym
/ Asy
Part. CS/ PS
Average D
uration [s]
Transfer D
elay [s]
Bitrate R
ange [kbps]
BurstinessBE
R
Messaging
Em
ail N
TB N
RT U
ni A
sy O
-O
PS 2.4
<4
<128
1 <
10-6 BE
R [H
oTo00] D
ata U
nrestricted D
ata Retrieval Service
FTP N
TB N
RT Bid
Asy
O-M
PS
132 <
0.5 64-400
1-50 <
10-6 BE
R [H
oTo00]
Table 3.11. Background services and applications characterisation.

Traffic Analysis at the Radio Interface in Converging Mobile and Wireless Communication Systems
58
3.2 Traffic source models
3.2.1 Initial Considerations
Traffic density differs among services, and therefore must be modelled separately for each
service. The central idea of traffic modelling lies in constructing models that capture the
important statistical properties of the underlying measured trace data. The more accurate traffic is
estimated, the more realistic results are achieved. A review of generic modelling techniques is
presented in [FrMe94].
Many traffic source models are proposed in the literature for different types of services.
However, traffic source models for advanced NG mobile wireless networks services are vary
scarce and little information (mainly on parameterisation settings) can be found. In the particular
case of data services, nearly all existing traffic models are presented for wireline data networks
such as ATM or LANs. Another particular case of scarce literature is for video source models
(e.g., video telephony and video streaming) for NG mobile wireless networks. Again, in this case,
the existing models are usually made for broadband wireline networks (e.g., ATM) and using
coding schemes (e.g., MPEG-1, MPEG-2) different than the ones foreseen for NG mobile
wireless networks (e.g., MPEG-4, ITU-T H.263). In the present work, and in the particular case
of video source models, very recent MPEG-4 and ITU-T H.263 trace data [FiRe01] will be
processed and used to parameterise some existing traffic models.
The following subsections will provide an overview of some selected traffic source models (from
the literature) for the applications described in 3.1.4. The selection criteria was based on the
source models that presented analytical tractability and suitable example parameters (for the
considered mobile wireless systems). Other source models than the ones presented are referenced
during the following sections.
The traffic source models are divided into the four service classes. A description and
parameterisation of the generation and duration processes for each application is also presented.

Services Characterisation and Traffic Source Models
59
3.2.2 Conversational type traffic models
Conversational type services typically present a symmetric or quasi-symmetric nature and require
small end-to-end transmission delays. Examples of this type of traffic are: voice, VoIP and video
telephony.
3.2.2.1 Classical ON-OFF voice model
A voice source generates a pattern of voice activity and silence periods, which can be classified by
a Voice Activity Detector (VAD), usually used in mobile terminals supporting voice (e.g., GSM).
These periods correspond mainly to talking, pausing and listening patterns of a conversation
[NaGT91]. Figure 3.1 illustrates these periods for the example of a circuit switched voice call.
t
Session
Circuit Call
Voice VoiceSilence
Session
Circuit Call
Voice VoiceSilence
Figure 3.1. Voice activity and silence periods in a circuit switched voice call (extracted from [Vlah01]).
The voice activity detector is usually modelled by the classical ON-OFF voice model [RaMe01],
[MWIF01], [ETSI98], [KoPP01a], [KoPP01b], [NaGT91], which is a two-state Markov model,
Figure 3.2. The probability that a voice activity period (“ON” state) with mean duration tON ends
in a time slot of duration τ follows an exponential distribution, given by:
/1 ONte τγ −= − . (3.1)
This is the probability of a transition from the “ON” state, to the silence state (“OFF” state).
Correspondingly, the probability that a silence period, of mean duration tOFF ends in a time slot of
duration τ also follows an exponential distribution, given by
/1 OFFte τσ −= − . (3.2)

Traffic Analysis at the Radio Interface in Converging Mobile and Wireless Communication Systems
60
Silence"OFF"
Voice"ON"
σ1−σ
γ
1−γ
Figure 3.2. Voice activity model (ON-OFF model) (extracted from [NaGT91]).
In these models, the two directions of communication (UL and DL) are modelled independently.
Typical values for the mean durations of the “ON” and “OFF” state, tON and tOFF respectively, are
3 s for both [RaMe01], [ETSI98].
3.2.2.2 CDMA mobile systems voice model
In [VaRF99], a measurement-based voice traffic model is described, which captures not only the
ON-OFF behaviour, previously described, but also the effect of voice encoder, compression
device and air interface (AI) characteristics in CDMA mobile communication systems. Most
encoders used in CDMA systems produce voice packets periodically, with a specific packet size
distribution in a range between 20-40 octets. The model described in [VaRF99] is a four-state
Markov model: when the source is in state k it generates packets of size sk each 10 ms, for a burst
duration of τk, k=1,…,4. In the long time average, the probabilities that a packet is of size sk are
measured to be Pk. The burst duration τk is modelled as a random variable with mean value µk
with the Weibul CDF (Cumulative Distribution Function):
( ) ( )1 , 0kk x
WP x e xβλ− ⋅= − ≥ , (3.3)
where 1/λk and βk are the scale and shape parameters, respectively. In [VaRF99] (and references
therein) it is observed that with the proper selection of these parameters, this distribution
function is a more accurate model of packetised encoded voice than exponential burst length
approximations.
After the burst of state k, a new state is selected with probability Qk given by:
4
1
/ , 1,..., 4./
k kk
j jj
PQ kP
µ
µ=
= =∑
(3.4)

Services Characterisation and Traffic Source Models
61
The parameters for this model are taken from [VaRF99] and are summarised in Table 3.12.
State Packet size [octet]
Measured probability
Measured mean burst duration
[packet] Weibul
parameters
k sk Pk µk λk βk
1 2 0.5978 29.8 0.03 0.75
2 5 0.0723 2.5 0.45 0.80
3 10 0.0388 1.8 0.80 0.70
4 22 0.2911 38.8 0.05 0.90
Table 3.12. Voice source model parameters (extracted from [VaRF99]).
Figure 3.3 summarises the voice source model, and also illustrates that all voice sources have the
same repetition rate but, depending on AI settings, they might have different phase offsets. In the
figure, the first and second sources are of equal phase, the nth source has offset.
1
2
3
41
2
3
41
2
3
4
source 1
source n
time
phase offset int. arr. time
state1 state2 state3 state4 Figure 3.3. Voice source model (extracted from [VaRF99]).
3.2.2.3 IP telephony (VoIP) model
For IP based voice communications, [DiLS01], [Mand01], and [VaRF99] describe possible traffic
models. As for the previous voice models, these models describe voice as a birth-death process,
with a Poisson distributed arrival process and an exponential distributed call duration.
Both [DiLS01] and [Mand01] present a similar traffic model for VoIP, based on the fact that
speech can be characterised with a sequence of talkspurts (service times, messages) separated by
silent spurts (idle times), Figure 3.4. In speech, each party is usually silent for more that 60 % of

Traffic Analysis at the Radio Interface in Converging Mobile and Wireless Communication Systems
62
the time [Mand01]. Therefore, a PS voice transmission can be modelled as a Markov model with
two states of “silence” and “talkspurt”. When in “silence” no packets are generated, and when in
“talkspurt” packets at a constant rate are generated [Mand01]. During the activity phase, IP
packets carrying the speech information are transmitted. This type of traffic can therefore be
simulated as an ON-OFF model with activity and silent periods generated by an exponential
distributed random variable with mean values tON and tOFF respectively, as for the classical ON-
OFF model presented in Section 3.2.2.1.
t
Session
Talkspurt Silence
Session
Talkspurt Talkspurt Silence Talkspurt
IP Packet
Figure 3.4. IP telephony transmission session.
The payload size depends on the considered speech codec and the packet rate. A typical speech
codec used in second and third generation mobile communications is the adaptive multi-rate
speech codec (AMR), which is a multi-mode codec with bitrates between 4.75 and 12.2 kbps. In
the AMR, processing is done on 20 ms frames taking 160 samples per frame. It offers high
speech quality under a wide range of transmission conditions. With a packet rate of 12.2 kbps,
the packet size has a payload of 32 bytes. Furthermore, the header comprising of RTP, UDP and
IP has 40 bytes using IPv4 and up to even 60 bytes using IPv6. This shows the problem of the
header overhead typical for VoIP. However, header size can be reduced considering that there is
significant redundancy between header fields, both within the same packet header, but in
particular between consecutive packets belonging to the same packet stream.
One can assume that header bytes can be compressed to 8 bytes [Mand01] and that the
Transmission Time Interval (TTI) of these (32+8) byte packets is 20 ms. For instance within an
active period of 3 s 150 IP packets have to be transmitted.
Table 3.13 summarises the parameters for the above described traffic model, based on [Mand01].

Services Characterisation and Traffic Source Models
63
Activity 50 %
Mean active phase, tON 3 s
Mean silent phase, tOFF 3 s
Payload of IP packet 32 bytes
IP framing overhead 8 bytes
Transmission time interval
0.02 s
Voice packet generation 0.02 s
IP packet rate 0.02 packet/s (50 Hz)
Table 3.13. Parameters of the VoIP traffic model (extracted from [Mand01]).
3.2.2.4 Video telephony/conference models
3GPP has specified that the transmission of video telephony in third generation mobile systems,
using CS connections, shall follow ITU-T H.324M while for PS connections, ITU-T H.323 and
IETF (Internet Engineering Task Force) SIP (Session Initiated Protocol) are two main candidates
[HoTo00]. In the case of ITU-T H.323 the video signal is generated according to the
recommendation ITU-T H.261 or optionally according to ITU-T H.263. However, 3GPP has
specified that the use of the video codec ITU-T H.263 is mandatory for mobile terminals
supporting packet switched conversational multimedia applications (MPEG-4 is considered as an
option) [3GPP01b]. In fact, ITU-T H.263 supports efficient compression that enables low-bitrate
video. 3GPP has specified that for associated audio signals the packet switched multimedia
terminals shall support (mandatory) AMR narrowband speech codec [3GPP01b]. 3GPP also
predicts the possibility of transmitting real time text, according to ITU-T T.140 [3GPP01b].
In [Heym97] a video source model based on observed video traffic statistical features for video
conference services has been proposed, represented as the Gamma Beta Auto-Regressive
(GBAR) Model. The GBAR model [Heym97] is a first order auto-regressive process that relies
on two statistical features observed in H.261 and H.263 [LaGD00] Variable BitRate (VBR) video
conferencing traffic:
• the marginal distribution follows a Gamma distribution
• the auto-correlation function is geometric.
Towards defining the GBAR model, let Ga(β,λ) denote a random variable with a Gamma
distribution with shape parameter β and scale parameter λ; its PDF (Probability Density

Traffic Analysis at the Radio Interface in Converging Mobile and Wireless Communication Systems
64
Function) is given by:
( ) ( )( )
, 01
xG
xp x e x
βλλ λ
β−= >
Γ +, (3.5)
where Γ(⋅) is the Gamma function. Similarly, let Be(p,q) denote a random variable with a Beta
distribution with parameters p and q, then its PDF is given by:
( ) ( )( ) ( ) ( ) 11 1 , 0 1
1 1qp
B
p qp x x x x
p q−−Γ +
= − < <Γ + Γ +
, (3.6)
where p and q are both larger than –1. The GBAR model is based on two well known results: the
sum of independent Ga(α,λ) and Ga(β,λ) random variables is a Ga(α+β,λ) random variable, and
the product of independent Be(α,β-α) and Ga(β,λ) random variables is a Ga(α,λ) random
variable. Thus, if Xn-1 is a Ga(β,λ), An is Be(α,β-α), and Bn is Ga(β-α,λ), and these three are
mutually independent, then
1n n n nX A X B−= + (3.7)
defines a stationary stochastic process {Xn} with a marginal Ga(β,λ) distribution.
Simulating the GBAR process (GBAR(β,λ)) only requires the ability to simulate independent and
identically distributed Gamma and Beta random variables. Parameters β and λ can be estimated
from the mean and variance of marginal distribution of sample data as follows. The mean and
variance of a Ga(β,λ) distribution are β /λ and β /λ2, respectively. Let µ and v be the mean and
variance of the sample data, then parameters β and λ are given by:
2
and v vµ µλ β= = . (3.8)
The parameter α can be calculated by [Heym97]:
α ρ β= ⋅ , (3.9)
where ρ is the lag 1 autocorrelation coefficient of the sample data (estimated directly from the
data statistics).
The GBAR process is used as a source model by generating non-integer values from (3.7), and

Services Characterisation and Traffic Source Models
65
then rounded to the nearest integer.
Being an autoregressive model that only requires a previous sample for generating the next one,
the GBAR model does not consider the co-existence of LRD (Long-Range Dependence) and
SRD (Short-Range Dependence) [LaGD00]. However, it accounts for observed Gamma PDF
and the geometric decay in the auto-correlation function at large lags (i.e., autocorrelation
function intervals) when applied to video conferencing traffic.
In order to obtain possible realistic values for the parameters of the GBAR model (for simulation
purposes), statistical parameters where calculated based on a real trace from a VBR video
sequence (Office Cam: office camera observing person in front of a terminal) of 45 min encoded
in H.263 format. The video sequence data that was used is described in [FiRe01] and the
corresponding trace library is available at http://www.eas.asu.edu/trace. The digital frame format
image adopted in the trace is QCIF (Quarter Common Intermediate Format) with 176×144
pixels, since it is expected that handheld wireless devices of next-generation wireless systems will
typically have a screen size that corresponds to the QCIF video format [FrNg00]. A fixed
reference frame rate of 25 frames/s was used. No target bitrate was specified for the encoding
resulting in a VBR sequence. This VBR sequence can be used, for example, for simulation of
videoconferences for HIPERLAN/2 type terminals.
The calculated values for the parameters of the GBAR source model from the analysed VBR
video sequence are presented in Table 3.14.
VBR Video Sequence µµµµ [byte]
v [byte]
ρρρρ
Office Cam 903.8 327.3 0.943
Table 3.14. Parameter values for the GBAR source model.
In [NyJO01], a video traffic model that mimics an H.263 codec with constant frame rate and
specified target bitrate is proposed. The considered target bitrates are assumed to be suitable for
mobile access (e.g., 32 kbps) in, e.g., the GSM/EDGE Radio Access Network (GERAN) and the
UTRAN. The proposed model is based on a simple linear model with just a few parameters. The
parameters are state dependent and the states are controlled by a Markov chain.
The traffic model generates video frames at a certain specified rate. The size of the video frame
after coding is dependent on the target bitrate of the data connection.

Traffic Analysis at the Radio Interface in Converging Mobile and Wireless Communication Systems
66
Frames are generated at equidistant time steps given by the codec frame rate. The first video
frame is large (standalone picture or I-frame) and its size is given by the parameter f0. It might be
followed by one or more time steps without any frames (“empty frames”). The remaining
sequence of frames (predicted inter-frames or P-frames), denoted k=1,2,…, is essentially given by
a linear time series with state dependent parameters. States of the frames are governed by a
Markov chain, specified by the number of states Ns and the state transition probabilities in the
transition probability matrix
( ) , 1( , ) sNi jP p i j == (3.10)
that governs transitions from frame to frame. The state at time step k is denoted by J(k). The
initial state J(1) is fixed and represented by the parameter s0.
The frame sizes after the initial frames are generated by a state dependent time series model with
three components: the expected frame size; a feedback term taking cumulative deviations from
expected frame sizes into account; a white noise term that induces random variation. The
feedback term, which probably captures the impact of target bitrate control during encoding, will
force the sequence of cumulative frame sizes not to deviate too much from the expected
cumulative sum. Correspondingly, the time series model has three state dependent parameters:
• µj: the expected frame size in state j
• bj: feedback parameter
• σwj: standard deviation of white noise (“innovations”).
Given that the state for frame k, J(k), equals j, the preliminary (to be adjusted below) frame size is
given by
( )( ) ( 1) ( 1) ( ), 1, 2,...j j w jX k b S k M k W k kµ σ= − ⋅ − − − + ⋅ = . (3.11)
The quantity S(k) is the sum of the previous frame sizes (including the initial frame) and M(k) is
the sum of the expected frame sizes up to frame k. W(k) is white noise that induces random
deviations. The distribution of the innovations W(k) is chosen to be the Normal one with mean
zero and variance one. The Normal PDF is given by [Ross87]:
( )2
121
2
N
N
x
NN
p x eµ
σ
πσ
−−
= (3.12)

Services Characterisation and Traffic Source Models
67
where σN is the standard deviation, and µN is the mean.
Initial values are determined by the initial state J(1)=s0, the first frame size f0 and the number of
initial frames ninit (the first large frame and empty frames), i.e.,
0(0)S f= (3.13)
and
0(0) init sM n µ= ⋅ . (3.14)
In order to keep frame sizes within certain bounds, two state dependent variables are introduced:
fmin,j and fmax,j which are used as the lower and upper bound respectively to adjust frame sizes when
they are generated using (3.11). The adjusted frame size X’(k) is then given by
( )( )min, max,'( ) min max , ( ) ,j jX k f X k f= . (3.15)
Equation (3.15) is applied after (3.11) for every time step before calculating the next frame size.
Note that S(k) should be calculated using the adjusted frame sizes, i.e.,
( ) ( 1) '( ).S k S k X k= − + (3.16)
Correspondingly
( )( ) ( 1) J kM k M k m= − + . (3.17)
The following tables provide an example of parameter settings for the described model
[NyJO01]. The parameters are fitted to an H.263 encoded video with target bitrate of 32 kbps.
Parameter values correspond to frame sizes and packet sizes in bytes. Table 3.15 gives basic
parameters while Table 3.16 gives the state dependent parameters. The first column of Table 3.16
shows the states and the corresponding steady-state probabilities to be in these states. The two
last columns show lower and upper bounds of frame sizes. The state transition probability matrix
P, is given in Table 3.17.
Although the model proposed in [NyJO01] is aimed for low bitrate streaming video applications,
one can (as an approximation) consider it also applicable for video telephony applications in
mobile wireless systems, by using the model for both transmission ways (uplink and downlink).

Traffic Analysis at the Radio Interface in Converging Mobile and Wireless Communication Systems
68
Frame rate, rframe 7.5 frames/s
Target bitrate 32 kbps
Duration 120 s
Initial frame size, f0 2433 bytes
Number of initial frames (first and empty), ninit
3
Initial state, s0 5
Number of states, Ns 10
Innovation distribution Normal (0,1)
Table 3.15. Basic parameters, 32 kbps video model (extracted from [NyJO01]).
State Prob. µµµµj (σσσσwj)2 bj fmin fmax
1 1.1 % 104 179.40 1.06 24 745
2 0.3 % 198 91.53 1.67 24 545
3 1.1 % 550 21.57 1.67 461 634
4 13.9 % 566 66.71 1.67 220 1424
5 9.7 % 533 132.60 1.07 105 1097
6 3.3 % 548 212.90 1.02 84 1213
7 7.5 % 574 20.19 1.02 468 696
8 44.8 % 576 63.99 1.14 264 854
9 17.2 % 576 115.40 1.19 115 1075
10 1.1 % 534 283.50 0.94 176 1576
Table 3.16. State dependent parameters, 32 kbps video model (extracted from [NyJO01]).
0.90 0.10 0 0 0 0 0 0 0 00 0.67 0 0 0.33 0 0 0 0 00 0 0.90 0 0.10 0 0 0 0 00 0 0 0.915 0 0 0.023 0.054 0.008 00 0 0 0.011 0.901 0.011 0.011 0.033 0.0033 00 0 0 0 0 0.900 0 0.033 0.067 00 0 0 0.014 0 0 0.914 0.043 0.029 00 0 0 0.019 0.007 0 0 0.955 0.017 0.0020.006 0 0.006 0.006 0.025 0.013 0.013 0.025 0.906 00 0 0 0 0 0 0 0.10 0 0.90
Table 3.17. State transition probability matrix (extracted from [NyJO01]).
In [RaMe01] and [LaOR98], a general traffic model for the video signal in a packet switched
videoconference is described, which is also applicable to digital video signals generated according
to ITU-T H.261.

Services Characterisation and Traffic Source Models
69
3.2.3 Streaming type traffic models
Streaming type services are characterised by a continuous flow of data capable of supporting
substantially higher end-to-end transmission delays and fluctuation (jitter) than for conversational
type services. The nature of the traffic in streaming services is clearly non-symmetric, since it
refers to the download and simultaneous processing of huge data files, such as video.
Furthermore, a larger fluctuation of packet arrival time is allowed although the use of
intermediate buffers at the reception allows a nearly full cancellation of this fluctuation, assuring a
constant data rate to the applications. Examples of this type of traffic are: Video on Demand and
MP3 streaming.
Video traffic can be transported either with a Constant BitRate (CBR) or with a VBR. In fact,
video traffic, in compressed form, is expected to be the prime example of VBR traffic type. VBR
video has several potential advantages over traditional CBR video: improved image quality and
shorter delay [ChRe99]. In addition, through statistical multiplexing, improved channel allocation
may be obtained compared to CBR transport.
MPEG-4 and H.263 encoded video is expected to account for large portions of traffic in future
wireline and wireless networks [FiRe01]. In particular, 3GPP has specified the use of MPEG-4
and H.263 codecs for video streaming services in UMTS [3GPP02c]. For the associated speech
and/or audio signals, 3GPP has specified the mandatory use of AMR narrowband speech codecs
and/or MPEG-4 AAC (Advanced Audio Coding) Low Complexity codecs, respectively
[3GPP02c]. In the present work a model for MPEG-4 VBR video streaming will be considered,
as described below.
Numerous traffic models incorporating the characteristics of VBR (compressed) video have been
proposed, like those described in [RaMe01], [ChRe99], [KoPP01b], [MASK88], [LaOR98],
[Mand01], [FrNg00], [ILDK96], [HaCS01] and [KrTr97]. A survey of statistical source models
for VBR video can be found in [IzRe99].
In the present work, one will describe the source model presented in [FrNg00] – the GOP
GBAR Model – for characterisation of VBR MPEG video sources. Firstly a brief overview of
MPEG-4 coding will be presented, followed by the source model description. At the end of this
section, estimated parameters for the GOP GBAR model will be provided based on real MPEG-
4 trace statistics.

Traffic Analysis at the Radio Interface in Converging Mobile and Wireless Communication Systems
70
MPEG-4 provides very efficient video coding covering the range from the very low bitrates of
wireless communications to bitrates and quality levels beyond High-Definition TeleVision
(HDTV). In contrast to the frame-based video coding of H.263 (and MPEG-1), MPEG-4 is
object based. Each scene is composed of Video Objects (VOs) that are coded individually (in
particular, the entire scene can be composed by only one VO). Each VO may have several
scalability layers, which are referred to as Video Object Layers (VOLs). Each VOL in turn
consists of an ordered sequence of snapshots in time, referred to as Video Object Planes (VOPs).
For each VOP the encoder processes the shape, motion, and texture characteristics. There are 3
types of VOPs: intracoded (I), forward predicted (P), and bidirectionally predicted (B). The I and
P VOPs are also referred to as anchor VOPs. The I, P, and B VOPs are arranged in a periodic
pattern referred to as a Group Of Pictures (GOP). This periodic pattern is usually described as a
(N,M) cyclic GOP, where N is the spacing between successive I VOPs, and M is the spacing
between successive anchor VOPs. For example, a typical GOP structure, for a 25 Hz frame rate
video on-demand, is IBBPBBPBBPBB ((12,3) cyclic GOP). When considering a single VOP per
snapshot, one can use the traditional concept of frame instead of VOP (e.g., I-, P-, and B-frames)
– this approach will be used in the description of the GOP GBAR model. To combat the
frequent transmission errors typical in wireless communications, MPEG-4 provides a number of
error resilience and error concealment features.
The GOP GBAR model [FrNg00], is a generalisation of the GBAR model for video
conferencing presented in Section 3.2.2.4. The GBAR model is only intended to apply to video
conferencing and is not suited to more general MPEG video sources, since it does not account
for the GOP cyclicity present in typical MPEG video. The GOP GBAR model constitutes a
MPEG video source model with the features of the GBAR model, while explicitly accounting for
the presence of GOP cyclicity.
According to the GOP GBAR model [FrNg00], the size Xk of the kth frame in an MPEG-
encoded video sequence starting with an I-frame and using a (N,M) cyclic GOP is given by
1 1 2 2 3 3
1 1 2 2
1 1 ,
, if 1mod ,, if 1mod but 1mod ,
otherwise
k k k
k k k
k
Z Z Z k NX Z Z k N k M
Z
λ λ λλ λλ
+ + == + ≠ =
(3.18)
where { } ( )1 0,1,... GBAR 1, 1kZ α ρ= ∼ , { } ( )2 0,1,... GBAR 2, 2kZ α ρ= ∼ , and
{ } ( )3 0,1,... GBAR 3, 3kZ α ρ= ∼ are independent stationary GBAR processes. The GOP GBAR

Services Characterisation and Traffic Source Models
71
model (3.18) has a composite geometric correlation structure made up of the geometric
autocorrelations of the three component GBAR processes {Z1k}, {Z2k}, and {Z3k}. The GOP
GBAR model (3.18) has therefore nine parameters, easily estimated from sample statistics, given
by:
( ) ( )
( )
2 2 2 2 2
1 2 3
2 22
1 2 32 2 2 2 2
1/2 2
1 2 2 2
1/2 2 2 22
3 2 2
, ,
, ,
,
B P B I P
B P B I P
P B I PB
B P B I PMM M
P P B BB
P B
MN N NI I P B B B
I P
σ σ σ σ σλ λ λµ µ µ µ µ
µ µ µ µµα α ασ σ σ σ σ
σ ρ σ ρρ ρ ρσ σ
σ ρ σ σ ρ σ ρρ
σ σ
− −= = =− −
− −= = =
− −
−= = −
− − = −
(3.19)
where µB, µP, and µI are the sample means of the B-, P-, and I-frame sequences, respectively, and
σB2, σP
2, and σI2 are the corresponding sample variances. Bρ , Pρ , and Iρ are the estimated lag 1
autocorrelation coefficients of the B-, P-, and I- frame sizes, respectively.
The GOP GBAR model presents several advantages: it is analytically tractable, it has a small
number of easily estimated parameters, and it is implemented through simple algebraic
expressions involving independent standard Gamma variables.
In order to obtain possible realistic parameters for simulation purposes, statistic parameters
where calculated based on real traces from two video sequences (the well known “Jurassic Park
I” and “Silence of the Lambs”) of 60 min encoded in MPEG-4 format. The video sequences data
that was used is described in [FiRe01] and the corresponding trace library is available at
http://www.eas.asu.edu/trace. The digital frame format image adopted in the traces is QCIF
with 176×144 pixels, for the same reasons presented in 3.2.2.4. For the MPEG-4 encoding, the
number of video objects was set to one (i.e., the entire scene is one video object). The single
video object was encoded into a single video object layer, and the object layer frame rate (i.e., the
rate at which video object planes are generated) was set to 25 frames/s. The GOP pattern was set
to IBBPBBPBBPBB. For the present work purposes, two different encoding quality levels of each
video sequence are considered: low quality, corresponding to quantisation parameters of 10 for I
frames (VOPs), 14 for P frames, and 18 for B frames; and high quality, corresponding to
quantisation parameters of 4 for all three frame types. As an example, the low quality can be

Traffic Analysis at the Radio Interface in Converging Mobile and Wireless Communication Systems
72
foreseen for UMTS type terminals and the high quality for HIPERLAN/2 type terminals.
The calculated values for the parameters of the GOP GBAR model for the four analysed
sequences are presented in Table 3.18.
Film Quality µµµµB [byte]
µµµµP [byte]
µµµµI [byte]
σσσσB [byte]
σσσσP [byte]
σσσσI [byte] Bρ Pρ Iρ
Low 334.6 966.8 3645.8 297.1 666.1 1311.7 0.936 0.825 0.940Jurassic Park I High 3176.7 4461.3 7179.9 1793.4 2240.6 2147.9 0.955 0.891 0.935
Low 246.9 641.6 2435.5 338.5 709.9 1573.7 0.960 0.888 0.943Silence of the Lambs High 2429.4 3203.2 5471.3 1929.7 2406.4 2678.2 0.979 0.937 0.942
Table 3.18. Parameter values for the GOP GBAR model.
3.2.4 Interactive type traffic models
Interactive type traffic is generated when a user performs an information request to a remote
equipment, typically a server. A typical example of this type of traffic is the access to a web server
(Web Browsing).
Several models have been proposed for Web browsing traffic, like those described in [RaMe01],
[DiLS01], [MWIF01], [JeJe01], [ShRJ02], [ETSI98], [KlLL01], [FäBC98], [Vica97] and [ZSMH00],
usually based on measured trace data. In the present report, one will describe the model adopted
by 3GPP for UMTS systems as presented in [RaMe01] and [ETSI98].
The model described in [RaMe01] and [ETSI98] considers a sequence of packet calls during a
WWW browsing session, Figure 3.5. The user initiates a packet call when requesting an
information entity. During a packet call, several packets may be generated, constituting a bursty
sequence of packets.
WWW browsing sessions are basically unidirectional (DL). In these types of sessions, a packet
call corresponds to the downloading of a WWW document (e.g., web page with images, text,
applets, etc.). After the document is downloaded, a reading time interval (by the user) is
experienced.

Services Characterisation and Traffic Source Models
73
t
W W W browsing session
packet call
1st packetarrival
reading time
last packetarrival
Figure 3.5. Typical WWW session (adapted from [ETSI98]).
The following parameters must be modelled in order to catch the typical behaviour described in
Figure 3.5:
• Session arrival process
• Number of packet calls per session, Npc
• Reading time between packet calls, Dpc
• Number of packets within a packet call, Nd
• Interarrival time between packets (within a packet call), Dd
• Size of a packet, Sd.
Note that the number of events during the session models the session length implicitly.
These six different events are modelled in [ETSI98] and described in the following paragraphs.
The geometrical distribution is used (discrete representation of the exponential distribution), for
discrete time scale simulation purposes.
• Session arrival process: The arrival of session set-ups to the network is modelled
as a Poisson process (refer to Section 3.2.7). For each service there is a separate
process. It is important to note that this process for each service only generates the
time instants when service calls begin, and is not related in any way to call
termination.
• Number of packet call requests per session, Npc: This is a geometrically
distributed random variable, with mean µNpc, where the probability of generating
one packet call, PPC is given by:

Traffic Analysis at the Radio Interface in Converging Mobile and Wireless Communication Systems
74
1PC
Npc
Pµ
= . (3.20)
The probability, pGe[n], of generating n packet call requests during a session is
therefore given by the following Probability Function (PF):
1[ ] (1 )nGe PC PCp n P P −= ⋅ − . (3.21)
• Reading time between two consecutive packet call requests in a session, Dpc:
This is a geometrically distributed random variable, with mean µDpc. Note that the
reading time starts when the last packet of the packet call is completely received by
the user. The reading time ends when the user makes a request for the next packet
call.
• Number of packets in a packet call, Nd: Different statistical distributions can be
used to generate the number of packets. For example, Nd can be a geometrically
distributed random variable, with mean µNd. It must be possible to select the
statistical distributions that describe best the traffic case under study. An extreme
case would be that the packet call contains a single large packet.
• Time interval between two consecutive packets inside a packet call, Dd: This
is a geometrically distributed random variable, with mean µDd. Naturally, if there is
only one packet in a packet call, this variable is not needed.
• Packet size, Sd: The packet size is defined as ( )min ,d a psS P M= , where Pa is a Pareto
distributed random variable (based on Table 3.19), and Mps is the maximum allowed
packet size (66 666 bytes). The packet size distribution model is therefore based on
a Pareto distribution with cut-off. The normal Pareto PDF (without cut-off) is
given by [ETSI98] (k corresponds to the minimum packet size):
( )1
0,
,p
p
P p
x kp x k
x kx
α
α
α+
<= ⋅
≥
. (3.22)
Table 3.19 gives default mean values for the distributions of typical WWW browsing services
[ETSI98]. According to the values for αp and k in the Pareto distribution, the average packet size
µSd is 480 bytes. Therefore, the average requested file size is µNd ⋅ µSd = 25×480 bytes =12 kbytes.
The interarrival time is adjusted in order to get different average bitrates at the source level.

Services Characterisation and Traffic Source Models
75
Packet based information types (WWW browsing)
µµµµNpcµµµµDpc [s] µµµµNd
µµµµDd [s]
Parameters for Sd
distribution UDD 8 kbps 0.5
UDD 32 kbps 0.125
UDD 64 kbps 0.0625
UDD 144 kbps 0.0277
UDD 384 kbps 0.0104
UDD 2048 kbps
5 4-12 25
0.00195
k = 81.5
αp = 1.1
Table 3.19. Parameter values for web browsing model (extracted from [ETSI98]).
3.2.5 Background type traffic models
Background type traffic corresponds typically to data transfer applications that do not demand an
immediate response/reaction from the user. Typical examples of applications that generate this
type of traffic are: Email, FTP, music download (e.g., Napster) and Telnet.
Several traffic models for this type of traffic have been proposed [RaMe01], [KoPP01a],
[KlLL01], [KoPP01b]. In the present report, the models proposed in [KlLL01], which are
synthetic traffic models for UMTS based on measured trace data from the University of
Dortmund ISP, will be described.
The traffic model proposed in [KlLL01] utilizes the notion that a user who runs non real-time
applications (e.g., HTTP, Napster, Email), follows a characteristic usage pattern and that a single
user may run different applications that may be concurrently active, e.g., WWW browsing while
downloading Napster music files.
Each application is completely described by its statistical properties, which comprise of an
alternating process of ON and OFF periods with some application specific length or data volume
distribution, respectively, Figure 3.6. Moreover, within each ON-period the packet arrival process
is completely captured by the packet interarrival times and the corresponding packet sizes.

Traffic Analysis at the Radio Interface in Converging Mobile and Wireless Communication Systems
76
t
t
t
t
t
HTTP
Napster
UDP
FTP
HTTP-ON HTTP-OFF
Napster-OFF Napster-ON
Email-ONEmail-OFF
FTP-ON FTP-OFF
Figure 3.6. Classification of non-real time IP traffic streams (extracted from [KlLL01]).
In this model, the single user traffic model is employed on three different levels:
• Session-level: it describes the dial-in behaviour of the individual users,
characterised by the session interarrival time distribution and the session data-
volume distribution.
• Connection-level: it describes for each individual application the corresponding
distribution of connection interarrival times and connection data volume,
respectively.
• Packet-level: it characterises the packet interarrival time distribution and the
packet size distribution within the application specific connections.
The following tables, Table 3.20 to Table 3.24, summarise the results presented in [KlLL01], for
Email and FTP services.
The Lognormal PDF is given by [Ross87]:
( )2
ln( )121 , 0
2
LN
LN
x
LNLN
p x e xx
µσ
πσ
−−
= > , (3.23)
where σLN is the natural log of the standard deviation and µLN is the natural log of the mean.
Distribution Lognormal (µLN; σLN2) (0.9681; 4.3846)
Table 3.20. Distribution of session interarrival times (extracted from [KlLL01]).
Distribution 64 kbps 144 kbps 384 kbps Lognormal (µLN; σLN2) (11.1170;1.9095) (11.4107;1.9509) (11.6795;14.4979)
Table 3.21. Distribution of session volume (extracted from [KlLL01]).

Services Characterisation and Traffic Source Models
77
Distribution 64 kbps 144 kbps 384 kbps Interarrival
time Pareto (k; αp) (14.4360;2.1345) (15.1334;2.1254) (16.0229;2.1223) Email
Data Volume
Lognormal (µLN; σLN2) (8.1934;3.3852) (8.2944;3.5288) (8.4124;3.6439)
Interarrival time single connection within a session
FTP Data
Volume Lognormal (µLN; σLN2) (8.4944;3.6674) (8.6403;4.1059) (8.8409;4.3343)
Table 3.22. Statistical properties at connection level (extracted from [KlLL01]).
Distribution 64 kbps 144 kbps 384 kbps
Email Lognormal (µLN; σLN2) (-4.4052;4.4970) (-4.8790;4.9687) (-5.4096;5.4978)
FTP Lognormal (µLN; σLN2) (-3.2770;5.2887) (-3.7830;5.6710) (-4.3020;6.0997)
Table 3.23. Parameters of packet interarrival times (extracted from [KlLL01]).
Fractions of packets in overall traffic [%] Packet size
40 byte Packet size
576 byte Packet size 1500 byte
Other packet sizes3
Email 38.25 25.98 9.51 26.26
FTP 40.43 18.08 9.33 32.16
Table 3.24. Fractions of different packet sizes in overall traffic (extracted from [KlLL01]).
3.2.6 Summary table of traffic source models
Table 3.25 presents a summary of the traffic source models described in the previous sections.
Input and output parameters are outlined and a short name, for referencing in the following
sections/chapters, is provided. Another parameter included in the table is the connection link
applicability within a session, i.e., the link to which the source model can be applied within each
session (DL or UL). In this parameters’ column, some approximations that will be assumed for
the following chapters are also presented, regarding the neglecting of traffic in a particular
connection direction for some applications (e.g., UL traffic during a WWW session).
3 The remaining packet sizes are distributed uniformly between 40 bytes and 1500 bytes.

Traffic Analysis at the Radio Interface in Converging M
obile and Wireless Communication Systems
78 Service Class T
raffic Source M
odels Short N
ame
Input Parameters
Output Param
eters Connection Link
Applicability within a
Session D
escription
Classical ON
-O
FF Voice
Model
Classical ON
-O
FF M
ean “ON
” and “OFF” durations.
“ON
” and “OFF” states duration.
UL and D
L (sim
ultaneously) Section 3.2.2.1
CDM
A
Mobile
Systems
Voice M
odel
CDM
A
MSV
M
Packet sizes, probability and mean burst
duration for each state. W
eibul parameters for each state.
(All values based on real data).
Voice packet sizes at constant
packet rate. U
L and DL
(simultaneously)
Section 3.2.2.2
IP Telephony (V
oIP) Model
VoIP
Mean “O
N” and “O
FF” durations. IP packet payload and overhead. Transm
ission time interval.
Voice packet generation.
IP packet rate.
“ON
” and “OFF” states duration.
During “O
N” state, voice packets
are generated according to input param
eters.
UL and D
L (sim
ultaneously) Section 3.2.2.3
VBR H
.263 V
ideo Telephony
GBA
R Model
GBA
R H.263
VBR
Sample m
ean, variance and lag 1 autocorrelation coefficient of fram
e sizes. Fram
e sizes at constant frame rate.
UL and D
L (sim
ultaneously) Section 3.2.2.4
Conversational
H.263 V
ideo Telephony w
ith target bitrate
H.263 TBR n
kbps (n=
32kbps)
Target bitrate. Fram
e rate. Initial fram
e size. N
umber of initial fram
es. Initial state. N
umber of states.
Innovation distribution. State dependent param
eters. State transition probabilities m
atrix.
Frame sizes at constant fram
e rate.U
L and DL
(simultaneously)
Section 3.2.2.4
Table 3.25. List of traffic source models.

Services Characterisation and Traffic Source Models
79
Service Class T
raffic Source M
odels Short N
ame
Input Parameters
Output Param
eters Connection Link
Applicability within a
Session D
escription
Streaming
VBR M
PEG
-4 V
ideo GO
P G
BAR V
ideo Stream
ing M
odel
GO
P GBA
R M
PEG
-4 n Q
uality ( n=
LOW
, H
IGH
)
Sample m
eans, variances and lag 1 autocorrelation coefficients of B-, P-, and I-fram
e sizes. Fram
e sizes at constant frame rate.
Only D
L (no UL traffic
considered) Section 3.2.3
Interactive W
eb Brow
sing M
odel
WW
W n kbps
(n=8, 32, 64,
144, 384, 2048)
Target bitrate and statistical parameters
from real trace data.
Num
ber of packet calls per session. Reading tim
e between packet calls.
Num
ber of packets within a
packet call. Interarrival tim
e between packets
within a packet call.
Size of packets.
Only D
L (no UL traffic
considered) Section 3.2.4
Em
ail Model
Em
ail n kbps (n=
64, 144, 384)
Target bitrate and statistical parameters
from real trace data.
Session interarrival times.
Session data volume.
Connection interarrival times.
Connection data volume.
Packet Interarrival times.
Packet sizes.
UL or D
L (depending on connection
direction) Section 3.2.5
Background
FTP Model
FTP n kbps ( n=
64, 144, 384)
Target bitrate and statistical parameters
from real trace data.
Session interarrival times.
Session data volume.
Connection interarrival times.
Connection data volume.
Packet Interarrival times.
Packet sizes.
UL or D
L (depending on file transfer
direction. Only one file
transfer direction considered per session. N
o traffic considered in opposite direction.)
Section 3.2.5
Table 3.25 (continued). List of traffic source models.

Traffic Analysis at the Radio Interface in Converging Mobile and Wireless Communication Systems
80
3.2.7 Call/session generation and duration processes
For a complete modelling of traffic sources, one must also characterise call/session arrivals and
durations.
Generally, voice calls and data sessions, are considered to be generated according to a Poisson
process [ETSI98], [Yaco93], [JeJe01], [ZSMH00], where the probability, pPo[n,t], of generating n
calls/session in a certain time interval t is given by:
[ ] ( ), !
c
ntc
Potp n t e
nλλ − ⋅⋅= , (3.24)
where λc is the mean arrival rate of calls (e.g., calls per second). pPo[n,t] represents the Poisson PF.
In general, it is also assumed that durations for voice calls and data sessions follow an exponential
distribution [Yaco93], [MWIF01], [ETSI98]. The corresponding PDF and CDF are given by
(3.25) and (3.26), respectively:
( ) 1 CD tEP t e µ− ⋅= − , (3.25)
( ) CD tE CDp t e µµ − ⋅= ⋅ , (3.26)
where 1/µCD is the mean call duration time [Yaco93]. Equation (3.26) is usually referred to as the
negative exponential distribution [Yaco93].
In Table 3.26, the generation and duration processes that will be used in the current work for
each application are presented. Again, as with the traffic source models, scarce information can
be found in the literature for parameterisation of these processes, mainly for advanced services
and applications. Therefore, in this work some of these values will be arbitrated, with a
reasonable practical sense.

Services Characterisation and Traffic Source Models
81
Service Class Services Applications Arrival Rate in Busy Hour
Session/Call duration
Speech telephony Voice Call Poisson Exponential
ConversationalVideo telephony Video Call Poisson Exponential
Streaming Streaming Video Video on Demand Poisson Exponential
Interactive Multimedia
Communication Service
Web Browsing Poisson Given by
source model
Messaging Service Email Poisson Given by
source model Background Unrestricted
Data Retrieval Service
FTP Poisson Given by source model
Table 3.26. Session/call generation and duration processes.
3.3 Mapping of technologies versus services and traffic source models
In the previous sections, a complete description and characterisation of services/applications and
traffic source models has been presented. In order to complete this study, a full mapping of
services/applications, traffic source models and supporting technologies (GSM/GPRS, UMTS,
and HIPERLAN/2) must be performed. For this purpose, Table 3.27 has been built, where
traffic source models and supporting technologies are selected based on the information type of
each service/application.
As it can be seen in Table 3.27, in the present work, the speech and audio components of the
Video on Demand applications are not considered. The main reason for using this approach is
that no literature was found on source models of audio for these types of applications. Moreover,
the amount of data generated by these components can somehow be considered negligible
compared to the video one.

Traffic Analysis at the Radio Interface in Converging M
obile and Wireless Communication Systems
82
Technology
Service Class Services
Applications Inform
ation T
ype T
raffic Source Model
GSM
/GPR
S U
MT
S H
IPER
LAN/2
Classical ON
-OFF
�
�
�
CDM
A M
SVM
�
�
�
Speech
telephony V
oice Call Sound
VoIP
�
�
�
Classical ON
-OFF
�
�
�
CDM
A M
SVM
�
�
�
Sound
VoIP
�
�
�
H.263 TBR 32 kbps
�
�
�
Conversational
Video telephony
Video Call
Video
GBA
R H.263 V
BR �
�
�
H.263 TBR 64 kbps
�
�
�
GO
P GBA
R MPE
G-4
(Low Q
uality) �
�
�
Stream
ing V
ideo Streaming
Video on-
demand
Video
GO
P GBA
R MPE
G-4
(High Q
uality) �
�
�
Table 3.27. Mapping of technologies versus services and traffic source m
odels.

Services Characterisation and Traffic Source Models
83
Technology
Service Class Services
Applications Inform
ation T
ype T
raffic Source Model
GSM
/GPR
S U
MT
S H
IPER
LAN/2
WW
W 8 kbps
�
�
�
WW
W 32 kbps
�
�
�
WW
W 64 kbps
�
�
�
WW
W 144 kbps
�
�
�
WW
W 384 kbps
�
�
�
Interactive M
ultimedia
Comm
unication Service
Web brow
sing M
ultimedia
WW
W 2048 kbps
�
�
�
Em
ail 64 kbps �
�
�
Em
ail 144 kbps �
�
�
M
essaging Service
Em
ail D
ata/
Multim
edia E
mail 384 kbps
�
�
�
FTP 64 kbps �
�
�
FTP 144 kbps �
�
�
Background U
nrestricted D
ata Retrieval Service
File Transfer –FTP
Data
FTP 384 kbps �
�
�
Table 3.27 (continued). Mapping of technologies versus services and traffic source m
odels.

Traffic Analysis at the Radio Interface in Converging Mobile and Wireless Communication Systems
84

Simulator Description
85
Chapter 4
Simulator Description 4 Simulator Description
The present chapter provides a functional description of the simulator platform developed within
the scope of this thesis, with the main objective of allowing the evaluation of the benefits of
convergence of mobile and wireless systems from a capacity/traffic point of view.

Traffic Analysis at the Radio Interface in Converging Mobile and Wireless Communication Systems
86
4.1 Simulator Overview
For the purpose of evaluating the benefits of convergence of wireless systems, mainly from a
capacity/traffic point of view, a complete simulator was implemented. The main goal underlying
the development of the simulator was to build a platform enabling the following three main
tasks:
• Analysis of the impact of convergence on the radio network’s overall performance;
• Evaluation of different convergence perspectives/strategies;
• Analysis of the impact of different traffic distributions in a convergence scenario.
The selected programming language was Visual C++, using object-oriented programming (e.g.,
each MT is considered as an object). The overall program has approximately 12 000 code lines,
and constitutes a flexible and easily upgradeable platform for the simulation of different
convergence scenarios.
The simulator is constituted by the following two main functional blocks, Figure 4.1:
• User Traffic Generation Module (UTGM),
• Traffic Processing Engine (TPE).
Traffic ProcessingEngine
User TrafficGeneration Module
User and Trafficrelated Inputs
Network andConvergencerelated Inputs
PerformanceOutputs
Figure 4.1. General structure of the simulator.
The UTGM is responsible for generating the user traffic for all active users and applications. For
each user (or MT), the traffic is generated in the form of vectors, User Traffic Vectors (UTVs),
including the following information:

Simulator Description
87
• For CS applications – the beginning instant (in ms) and duration of each session;
• For PS applications – the beginning instant (in ms) of each session, and the
beginning instant (in ms) and size (in bytes) of each packet (or frame, for video
applications) within a session.
The TPE is the “brain” of the simulator, receiving and processing the UTVs, according to
different convergence perspectives/strategies. For this purpose, Access Technology Traffic
Processing Modules (ATTPMs) are implemented inside it, for simulating several different access
technologies available to the users. The TPE’s outputs, corresponding to the simulator outputs,
include the overall performance indicators that allow the evaluation of convergence benefits.
Both the UTGM and TPE receive several input parameters from the simulator’s user,
represented in Figure 4.1 as yellow boxes, allowing the simulation of different user, applications
and technological scenarios.
For simplicity reasons, the simulator only considers downlink user traffic processing, disregarding
the uplink components. From a capacity/traffic analysis point of view, this approach is quite
realistic since:
• nearly all of the considered applications are asymmetric, with a higher capacity
demand on the downlink direction,
• in general, the downlink component is capacity limited, in opposition to the uplink
components which are usually interference/power limited.
Also for simplicity reasons (and feasibility reasons within a Masters Thesis timeframe), the
developed simulation tool does not currently take into account propagation issues, although the
simulator already considers the geometry of the simulated scenarios (exact locations and distances
between MTs and BSs). This is however an important issue that should be taken into account for
the analysis of convergence of systems, since, based on the channel conditions between the MTs
and the different access technology BSs, different technology routing decisions can be taken.
Therefore, a further improvement of the simulator should address this issue.
Each simulation run corresponds to a complete Busy Hour (BH) simulation, and uses an internal
clock with a period of 1ms. The choice of the internal clock period is based on the MAC frame
durations of each access technology, presented in Section 4.3.
In the following sections, the UTGM and TPE are described in more detail.

Traffic Analysis at the Radio Interface in Converging Mobile and Wireless Communication Systems
88
4.2 User Traffic Generation
As mentioned in the previous section, users and their traffic are generated by the UTGM. The
UTGM’s functional process is depicted in Figure 4.2, and described in the following paragraphs.
The UTGM initially generates a user-defined (simulator input) number of users (MTs). Each user
is then given a user type classification. A user type corresponds to a particular user profile
(simulator input), with specific traffic usage characteristics, namely: Busy Hour Call/session
Attempts (BHCA) and average call/session durations per application. In the present simulator
implementation, three different user types were considered (User Type 1, 2 and 3), although
other user types can easily be added. The allocation of a specific user type to each user is
randomly performed, and depends on the penetration of each user type (simulator input).
UsersGeneration
Applic. 2User 1
Type: 1/2/3
User 2
Applic. 1Active ?
Traffic SourceModel
ImplementationModule
Y
. . .
Applic. 6
. . .
User N
Numberof Users
Penetrationand
Traffic Profilesper User Type
ActiveApplications
Source Models'Parameters
t
Ps
GeneratedTraffic(UTVs)
Inpu
tsU
ser T
raffi
c G
ener
atio
n M
odul
e
Figure 4.2. UTGM’s functional process.
Six different applications (listed in Table 4.1) are supported by the simulator, corresponding to
those presented and described in Chapter 3, which can be individually enabled or disabled for
analysis of the impact of different traffic mixtures. This is a global setting for all generated users,

Simulator Description
89
and therefore, the corresponding UTVs of a given application (per user) will only be generated if
that application is enabled.
Applications Services Service Class Voice Call Speech Telephony Conversational
Video Call Video Telephony Conversational
Video on Demand Video Streaming Streaming
Web Browsing Multimedia Communication Service Interactive
Email Messaging Service Background
FTP Unrestricted Data Transfer Service Background
Table 4.1. Applications supported by the simulator.
The last and most elaborate task of the UTGM is to generate the UTVs for each active
application of each user. This task is performed by the Traffic Source Model Implementation
Modules (TSMIMs). As previously mentioned, each UTV includes the following information:
• For CS applications – the beginning (in ms) and duration of each session;
• For PS applications – the beginning (in ms) of each session, and the beginning (in
ms) and size (in bytes) of each packet (or frame, for video applications) within a
session.
The mapping of the supported applications onto the CS and PS types (as a function of the access
technologies) that was adopted in the simulator implementation is presented in Table 4.2. As one
can observe, only the Voice Call and Video Call (voice component), when transmitted over GSM
or UMTS, were considered to be of the CS type, requiring a constant capacity usage during the
complete call transmission. In the remaining cases, the applications traffic is processed as of a PS
type.
It should be noted that the resulting UTVs generated by the UTGM (for each active application
of each user) depend on the users’ type, since, as previously mentioned, the user type defines the
corresponding BHCA and average call/session durations per application.
TSMIMs have been implemented for each Traffic Source Model (TSM) presented and described
in Chapter 3. As a basis for the implementation of the TSMIMs, the following 10 different
Random Number Generators (RNGs) had to be initially programmed: Uniform, Beta, Gamma,
Exponential, Geometric, Normal, LogNormal, Pareto, Poisson and Weibul. A validation of each

Traffic Analysis at the Radio Interface in Converging Mobile and Wireless Communication Systems
90
of these RNGs is presented in ANNEX I.
Access Technology Application
GSM/GPRS UMTS HIPERLAN/2 Voice Call CS CS PS
Voice component CS CS PS
Video Call Video
component PS PS PS
Video on Demand Video component PS PS PS
Web Browsing PS PS PS
Email PS PS PS
FTP PS PS PS
Table 4.2. Classification of Applications (CS and PS) per Access Technology.
In the following paragraphs, example outputs for each of the implemented TSMIMs are
presented.
In Figure 4.3, example outputs for two different voice call TSMIMs are presented: CDMA
MSVM and VoIP TSMIMs. The CDMA MSVM TSMIM generates 4 different packet sizes (2, 5,
10 and 22 bytes) every 10 ms, while the VoIP TSMIM generates constant sized packets (40 bytes)
every 20 ms during ON periods and no packets during OFF periods. For both TSMIMs example
outputs, the ON-OFF aspects of a voice call are apparent.
In Figure 4.4, two different example outputs for the video component of video telephony
TSMIMs are depicted: H.263 TBR 32 kbps and GBAR H.263 VBR TSMIMs. The speech
components are also represented (using the same TSMIMs as for the voice call), in order to
illustrate the synchronisation of the beginning and ending of each video call (speech and video
components). The H.263 TBR 32 kbps TSMIM supplies the size of each video frame generated
at a constant frame rate of 7.5 frames/s. In this TSMIM, the first generated frame is large
(standalone picture or I-frame), which is followed by 3 “empty” frames. The GBAR H.263 VBR
TSMIM implements a VBR H.263 QCIF video source, generating frames of variable size at a
constant frame rate of 25 frames/s.

Simulator Description
91
1060 1070 1080 1090 1100 1110 1120 1130 1140 11500
10
20
30
40Voice Call VoIP TSM
Pack
et S
ize
[Byt
e]
Time [s]
1060 1070 1080 1090 1100 1110 1120 1130 1140 11500
5
10
15
20
25Voice Call CDMA MSVM TSM
Pack
et S
ize
[Byt
e]
Time [s]
Figure 4.3. Voice Call TSMIMs’ Outputs.
700 800 900 1000 1100 12000
500
1000
1500
2000
2500
3000Video Call GBAR H.263 VBR TSM
Fram
e Si
ze [B
yte]
Time [s]
700 800 900 1000 1100 12000
500
1000
1500
2000
2500Video Call H.263 TBR 32 kbps TSM
Fram
e Si
ze [B
yte]
Time [s]
700 800 900 1000 1100 12000
10
20
30
40
Voice Call VoIP TSM
Pack
et S
ize
[Byt
e]
Time [s]
700 800 900 1000 1100 12000
5
10
15
20
25Voice Call CDMA MSVM TSM
Pack
et S
ize
[Byt
e]
Time [s]
Figure 4.4. Video Call TSMIMs’ Outputs.

Traffic Analysis at the Radio Interface in Converging Mobile and Wireless Communication Systems
92
Two different TSMIMs were implemented for the Video on Demand application, corresponding
to the H.263 TBR 64 kbps and the GOP GBAR MPEG-4 TSMs. Figure 4.5 shows an output
example of the H.263 TBR 64 kbps TSMIM and two output examples (low quality and high
quality) of the GOP GBAR MPEG-4 TSMIM. All three outputs are synchronised (beginning and
ending instants). The H.263 TBR 64 kbps TSMIM is based on the H.263 TBR 32 kbps video
telephony TSMIM, but with a higher frame rate (15 frames/s). The GOP GBAR MPEG-4
TSMIM generates a VBR MPEG-4 QCIF video streaming source at a constant frame rate of
25 frames/s, based on the parameter settings obtained in Chapter 3 for the film “Silence of the
Lambs”. One can observe clearly the GOP cyclicity (GOP pattern – IBBPBBPBBPBB) in the
GOP GBAR MPEG-4 TSMIM outputs.
For the Web Browsing (WWW) application, six different TSMIMs were implemented,
corresponding to six different transmission bitrates (8 kbps, 32 kbps, 64 kbps, 144 kbps,
384 kbps and 2 Mbps). Figure 4.6 shows an output of a synchronised session (beginning and
session volume) for all six modules. As expected, one can observe that the session duration
depends on the transmission bitrate (lower duration for higher bitrates, since web pages are
available faster) and identical reading time intervals between consecutive packet calls (web page
requests).
Three TSMIMs were developed for each of the Email and FTP applications (corresponding to a
total of 6 different TSMIMs). For each application, the three different TSMIMs correspond to
three different transmission bitrates (64 kbps, 144 kbps and 384 kbps). For the implementation
of these TSMIMs, slight changes were introduced to the TSMs described in Chapter 3 (for both
applications): the same data volume distribution was considered for all three transmission bitrates
(corresponding to the data volume presented for the 384 kbps TSMs) and a constant packet
interarrival time was considered for each TSM, based on the average packet size and transmission
bitrate (63.75 ms for the 64 kbps TSMs, 28.3 ms for the 144 kbps TSMs and 10.625 ms for the
384 kbps TSMs). Figure 4.7 and Figure 4.8, corresponding to the Email and FTP applications
respectively, show outputs of a synchronised session (beginning and data volume) for all three
TSMIMs of each application. As expected, one can observe that for higher bitrates, the session
duration is shorter (for the same data volume).

Simulator Description
93
3260 3280 3300 3320 3340 3360 3380 3400 34200
5000
10000
15000Video on Demand GOP GBAR MPEG-4 TSM (High Quality)
Fram
e Si
ze [B
yte]
Time [s]
3260 3280 3300 3320 3340 3360 3380 3400 34200
2000
4000
6000Video on Demand GOP GBAR MPEG-4 TSM (Low Quality)
Fram
e Si
ze [B
yte]
Time [s]
3260 3280 3300 3320 3340 3360 3380 3400 34200
1000
2000
3000Video on Demand H.263 TBR 64 kbps TSM
Fram
e Si
ze [B
yte]
Time [s]
Figure 4.5. Video on Demand TSMIMs’ Outputs.
2450 2500 2550 2600 26500
2000
4000
6000
8000WWW 8kbps Model
Pac
ket S
ize
[Byt
e]
Time [s]
2450 2500 2550 2600 26500
2000
4000
6000
8000WWW 32kbps Model
Pac
ket S
ize
[Byt
e]
Time [s]
2450 2500 2550 2600 26500
2000
4000
6000
8000WWW 64kbps Model
Pac
ket S
ize
[Byt
e]
Time [s]
2450 2500 2550 2600 26500
2000
4000
6000
8000WWW 144kbps Model
Pac
ket S
ize
[Byt
e]
Time [s]
2450 2500 2550 2600 26500
2000
4000
6000
8000WWW 384kbps Model
Pac
ket S
ize
[Byt
e]
Time [s]
2450 2500 2550 2600 26500
2000
4000
6000
8000WWW 2Mbps Model
Pac
ket S
ize
[Byt
e]
Time [s]
Figure 4.6. Web Browsing (WWW) TSMIMs’ Outputs.

Traffic Analysis at the Radio Interface in Converging Mobile and Wireless Communication Systems
94
2070 2075 2080 2085 2090 20950
500
1000
1500Email 64 kbps TSM
Pack
et S
ize
[Byt
e]
Time [s]
2070 2075 2080 2085 2090 20950
500
1000
1500Email 144 kbps TSM
Pack
et S
ize
[Byt
e]
Time [s]
2070 2075 2080 2085 2090 20950
500
1000
1500Email 384 kbps TSM
Pack
et S
ize
[Byt
e]
Time [s] Figure 4.7. Email TSMIMs’ Outputs.
1043 1044 1045 1046 1047 1048 1049 1050 1051 1052 10530
500
1000
1500FTP 64 kbps TSM
Pack
et S
ize
[Byt
e]
Time [s]
1043 1044 1045 1046 1047 1048 1049 1050 1051 1052 10530
500
1000
1500FTP 144 kbps TSM
Pack
et S
ize
[Byt
e]
Time [s]
1043 1044 1045 1046 1047 1048 1049 1050 1051 1052 10530
500
1000
1500FTP 384 kbps TSM
Pack
et S
ize
[Byt
e]
Time [s] Figure 4.8. FTP TSMIMs’ Outputs.

Simulator Description
95
4.3 Traffic Processing Engine
The TPE is the main functional entity of the simulator as it performs all the “convergence” and
traffic processing tasks, associated to a real implementation of a converged network. As
previously addressed in Chapter 1, one assumes that this converged network is supported by a
common IP backbone, offering access to different services via several mobile and wireless
technologies.
From a functional point of view, the TPE receives the UTVs generated by the UTGM and
processes them according to different convergence perspectives/strategies. The traffic is then
routed to the MTs through different access technologies. In the present work, the considered
access technologies are: GSM/GPRS, UMTS (FDD Mode), and HIPERLAN/2, which were
described in Chapter 2. Each access technology is implemented in the simulator as an ATTPM
(Access Technology Traffic Processing Modules). Other ATTPMs can be easily added into the
current simulation platform for analysis of convergence of/with other systems (e.g., broadcasting
systems, such as DVB-T). All MTs are considered to be “convergence” capable, i.e., they are
capable of receiving traffic through all available access technology networks. The main functional
building blocks of the TPE and their interactions are depicted in Figure 4.9.
GSM/GPRSATTPM
UMTSATTPM
HIPERLAN/2ATTPM
CONVERGENCEMANAGERMODULE
MT 1
MT 2
MT N
t
Ps
t
Ps
t
Ps
.
.
.
User TrafficVectors
QoSRequirements
NetworkLoad
ApplicationBitrate / Quality
Convergence Perspective,Av. Capacity Occupation
per Application(per Technology)
Available Technologies,Individual Technology
Parametersand Configuration
Traffic Processing Engine
Inpu
ts
Use
r Tra
ffic
Gen
erat
ion
Mod
ule
Sessions Statistics
CS Calls Statistics
CS TrafficCharacterisation
PS Traffic Statistics
CMM Statistics
Networks’ Load
Performance Outputs Figure 4.9. Traffic Processing Engine.

Traffic Analysis at the Radio Interface in Converging Mobile and Wireless Communication Systems
96
The UTVs generated by the UTGM are firstly analysed by a new functional entity here referred
to as the Convergence Manager Module (CMM). The main functions of the CMM are to detect
new sessions and to route the associated traffic to different ATTPMs according to a user-defined
(simulator input) convergence perspective/strategy. For this purpose, the CMM considers
variable parameters such as the loads of the different access technology networks and the
different application’s priorities/QoS requirements. By applying different convergence
perspectives/strategies, the different parameters are weighted differently and different benefits
are taken into the overall system. The idea behind the CMM is therefore to allow the maximum
flexibility among users and networks.
The CMM’s functional process is depicted in Figure 4.10. The UTVs are all processed by the
CMM before being routed to the different ATTPMs. The CMM constantly monitors the
incoming UTVs, performing the following process:
• If a request for beginning of session is detected, the CMM decides to which access
technology the traffic must be routed (by the Technology Router - TR), and at what
bitrate/quality must the application be delivered (interaction with the application
source). The basis for these decisions are user-defined (simulator input) and are
represented as a Priority Table (PT). A description of the PT functionalities is
presented below. In a real system, all interactions between the CMM and other
entities/network elements will have to be performed via new signalling
protocols/channels.
• During a session (after CMM decisions) the traffic is constantly routed by the TR to
the selected ATTPM and at the selected quality/bitrate.
An alternative for the implementation of the CMM would be, instead of a session based routing,
a packet based routing. This approach would however require, in a real system, much more
sophisticated signalling and synchronisation protocols.
The PT currently implemented in the simulator is represented in Table 4.3. For each application,
the PT defines the priority selection of access technologies and of application bitrate/quality
(given by the TSM column). This PT is based on a highest throughput / best system approach.
The highest throughput concept means that for data and video applications, the highest
available/possible transmission bitrate is selected based on the current networks’ loads. In
respect to the best system approach, priority is given to the most appropriate application-oriented

Simulator Description
97
access technology (e.g., data applications first priority – WLAN; Voice Calls first priority – GSM).
These approaches are technical oriented approaches and do not take into account other
important/relevant issues such as applications usage costs, user preferences/QoS requirements,
network ownerships, etc. Other PTs can be easily tested in the current simulation platform,
enabling the evaluation of other convergence perspectives/strategies.
Beginning ofSession?
t
Ps
Priority TableY
ApplicationBitrate / Quality
TechnologyDecision
N
TechnologyRouter
GSM/GPRS
UMTS
HIPERLAN/2
Av. Network Load(Act. Sessions)
QoSRequirements
Convergence Manager Module
User TrafficVectors
Figure 4.10. Convergence Manager Module.
As it can also be seen in Table 4.3, the voice and video components of the Video Call application
are dealt with separately, and even present different technology priorities, in order to optimise the
highest throughput / best system concepts for each individual component in a “convergence”
scenario.
Other alternative approaches to a single and static PT, as implemented in the simulator, could be:
• a different PT (static or dynamic) per user type, e.g., associated to different monthly
price plans per user type, influencing the technology and quality priorities
definition;
• a different PT (static or dynamic) per user/MT, addressing a more elaborate
scenario where each user can define his own criteria/preferences, based on, for
example, cost reasons or quality reasons (e.g., my sons calls always come through
and at the best quality).

Traffic Analysis at the Radio Interface in Converging Mobile and Wireless Communication Systems
98
Application Priority Access Technology Traffic Source Model 1 GSM/GPRS Classical ON-OFF
2 UMTS CDMA MSVM Voice Call Video Call
(Voice Component) 3 HIPERLAN/2 VoIP
1 HIPERLAN/2 GBAR H.263 VBR
2 UMTS H.263 TBR 32 kbps Video Call
(Video Component) 3 GSM/GPRS H.263 TBR 32 kbps
1 HIPERLAN/2 GOP GBAR MPEG-4 HIGH Quality
2 HIPERLAN/2 GOP GBAR MPEG-4 LOW Quality
3 HIPERLAN/2 H.263 TBR 64 kbps
Video on Demand (Video Component)
4 UMTS H.263 TBR 64 kbps
1 HIPERLAN/2 WWW 2 Mbps
2 HIPERLAN/2 WWW 384 kbps
3 HIPERLAN/2 WWW 144 kbps
4 UMTS WWW 384 kbps
5 UMTS WWW 144 kbps
6 UMTS WWW 64 kbps
7 UMTS WWW 32 kbps
8 UMTS WWW 8 kbps
9 GSM/GPRS WWW 64 kbps
10 GSM/GPRS WWW 32 kbps
Web Browsing
11 GSM/GPRS WWW 8 kbps
1 HIPERLAN/2 Email 384 kbps
2 HIPERLAN/2 Email 144 kbps
3 UMTS Email 384 kbps
4 UMTS Email 144 kbps
5 UMTS Email 64 kbps
6 GSM/GPRS Email 64 kbps
1 HIPERLAN/2 FTP 384 kbps
2 HIPERLAN/2 FTP 144 kbps
3 UMTS FTP 384 kbps
4 UMTS FTP 144 kbps
5 UMTS FTP 64 kbps
FTP
6 GSM/GPRS FTP 64 kbps
Table 4.3. Convergence Manager Module - Priority Table.

Simulator Description
99
The main input of the CMM is the current load of each access technology network. These loads
are calculated as the sum of the mean capacity occupation of all active sessions associated to each
access technology. The session mean capacity occupations (per application and access
technology) are fixed internal reference values of the simulator. These values were obtained based
on the generation and further analysis of 300 sessions of each application (all TSMs).
The first step in order to calculate the session mean capacity occupations was to obtain the mean
session bitrates per application, Table 4.4. Each session bitrate is calculated as the total amount of
bytes generated within the session over the total session duration. The mean session bitrates per
application are therefore the session bitrates averaged over the considered 300 sessions. As it can
be noticed in Table 4.4, the mean session bitrates obtained for applications with a target bitrate
do not correspond exactly to their targets (e.g., H.263 TBR 32 kbps). This is due to the fact that
the associated TSMs are statistically defined. Another fact that can be noticed, is the mean
session bitrates obtained for the WWW application, which are lower than the corresponding
target bitrate values. This is an expected result, since the reading times are not accounted for
within the target bitrates, i.e., these target bitrates only consider the information transmitting
periods (page downloads).
Based on the values listed in Table 4.4, the mean capacity occupation per session of each
application was calculated for each considered access technology. Table 4.5 presents the resulting
values for each access technology and application, based on:
• GSM/GPRS: average number of TSs occupied per session;
• UMTS: average SF used per session and average DL LF per session;
• HIPERLAN/2: average number of LCHs occupied in average per session.
For each new session, the CMM decision process takes into account the overall load (capacity
occupation) of each access technology network, based on the current active sessions (using the
values presented in Table 4.5), and verifies the existence of free capacity for the additional session
(again considering its mean capacity occupation). This process respects the priorities defined in
the PT, and tries to “fit” the new session to the most prioritised available possibility. If there is
no capacity for the new session in all technology priorities defined in the PT, the session is routed
to the highest priority technology (that is available) and selects the lowest application
quality/bitrate.

Traffic Analysis at the Radio Interface in Converging Mobile and Wireless Communication Systems
100
Application Traffic Source Model Mean Session
Bitrate [kbps]
CDMA MSVM 7.62 Voice Call Video Call
(Voice Component) VoIP 8.69
H.263 TBR 32 kbps 34.02 Video Call (Video Component) GBAR H.263 VBR 180.88
H.263 TBR 64 kbps 68.02
GOP GBAR MPEG-4 LOW Quality 105.95 Video on Demand
(Video Component) GOP GBAR MPEG-4 HIGH
Quality 573.39
WWW 8 kbps 5.39
WWW 32 kbps 14.97
WWW 64 kbps 24.62
WWW 144 kbps 45.63
WWW 384 kbps 103.35
Web Browsing
WWW 2 Mbps 517.79
Email 64 kbps 59.78
Email 144 kbps 137.00 Email
Email 384 kbps 365.44
FTP 64 kbps 58.81
FTP 144 kbps 136.65 FTP
FTP 384 kbps 356.50
Table 4.4. Mean session bitrates.
The routed traffic from the CMM is processed by each ATTPM. As already mentioned, three
different ATTPMs were implemented in the simulator, corresponding to the following systems:
GSM/GPRS, UMTS and HIPERLAN/2. The available ATTPMs per simulation are also user-
defined (simulation input), in order to simulate different scenarios with different available access
technologies.
As a basis for the implementation of the ATTPMs, simple capacity models were defined for each
individual access technology. The considered parameters for the definition of these models are
listed in Table 4.6. In summary, the simulator capacity measurement for each access technology
depends on:

Simulator Description
101
• GSM/GPRS: number of TSs;
• UMTS: SF (related to the available number of codes) and DL LF4;
• HIPERLAN/2: number of LCHs.
The traffic processing algorithms implemented in the ATTPMs for CS and PS applications are
represented in Figure 4.11 and Figure 4.12, respectively. These processes work as follows:
• For CS applications, each ATTPM monitors the routed traffic from the CMM in
order to detect new calls. If a new call is detected, the ATTPM verifies if there is
enough capacity in the respective network (TSs for GSM/GPRS, SF and DL LF
for UMTS) for its transmission. If there is enough capacity, the ATTPM reserves
capacity in the network for the whole duration of the call (corresponding to N
MAC Frames). If there is not enough capacity for the call transmission, it is
blocked.
• For PS applications, a similar process to the CS case is applied, but on a packet
basis rather than a session basis. After detecting an incoming session, the ATTPM
checks for available capacity for each packet transmission. Capacity is reserved
during each packet complete transmission or if there is no available capacity, the
packet is discarded.
For the Video Call application case, since it presents both CS (when the voice component is
transmitted over GSM or UMTS) and PS components, an additional mechanism is included in its
traffic processing algorithm: if the voice component is blocked due to lack of capacity, the overall
system blocks the complete Video Call session (therefore, no video transmission is considered).
4 The UMTS power based load estimation is not considered due to two main reasons: 1) the developed simulation
tool does not take into account propagation issues; 2) the target scenarios to be simulated (Chapter 5) assume a small
physical area (and consequently small cells), and therefore, in this case, the limiting load measurement is the DL LF.

Traffic Analysis at the Radio Interface in Converging Mobile and Wireless Communication Systems
102
Mean Capacity Occupation per Session
UMTS Application Traffic Source Model GSM/GPRS
[TSs] SF DL LF
HIPERLAN/2 [LCHs]
Classical
ON-OFF 1.00 - - -
CDMA MSVM - 128 0.007 -
Voice Call Video Call
(Voice Component) VoIP - - - 0.05
H.263 TBR 32 kbps 2.54 64 0.038 0.36* Video Call
(Video Component) GBAR H.263
VBR - - - 1.90*
H.263 TBR 64 kbps - 32 0.074 0.36
GOP GBAR MPEG-4
LOW Quality - - - 0.56
Video on Demand (Video
Component) GOP GBAR MPEG-4
HIGH Quality - - - 2.99
WWW 8 kbps 0.41 256 0.006 0.03
WWW 32 kbps 1.12 128 0.017 0.08
WWW 64 kbps 1.84 64 0.027 0.13
WWW 144 kbps - 32 0.046 0.24
WWW 384 kbps - 16 0.074 0.54
Web Browsing
WWW 2 Mbps - - - 2.70
Email 64 kbps 4.47 32 0.065 0.32
Email 144 kbps - 16 0.139 0.72 Email
Email 384 kbps - 4 0.263 1.91
FTP 64 kbps 4.39 32 0.064 0.31
FTP 144 kbps - 16 0.139 0.72 FTP
FTP 384 kbps - 4 0.256 1.86
* Double capacity occupation per session due to service symmetry (TDD system).
Table 4.5. Mean Capacity Occupation per Session.

Simulator Description
103
Access Technology Parameter Comment
# BTSs Configurable.
# TRX Frequencies per BTS Configurable.
# TSs for User Traffic per BTS Configurable. Remaining TSs used for signalling and control.
GSM/GPRS TS Allocation Scheme Current simulator implementation
considers free TS allocation for voice and data applications.
GPRS Average Coding Scheme Configurable (CS-1 to CS-4). Provides the average throughput in kbps per TS.
GSM
/GPR
S
Max TSs per GPRS MT Configurable. Defines the maximum supported bitrate per GPRS MT.
# Node Bs Configurable.
# Frequency Channels per Node B Configurable (n×5 MHz).
Duplex Mode Current simulator implementation considers only FDD mode.
Target Eb/No Values per Application Configurable.
Power Control Current simulator implementation considers Ideal Power Control.
% codes reserved for Soft Handover Configurable.
Activity Factor Configurable for voice and for data applications.
Ratio Other Cell to Own Cell Interference Configurable.
Orthogonality Factor Configurable.
Downlink Load Factor Configurable (max value).
Channel Coding Rates Configurable per Application.
UM
TS
Code Allocation Scheme Current simulator implementation considers as ideal/optimised allocation.
# APs Configurable.
Average PHY Mode Configurable (PHY Mode 1 to 7).
HL/
2
# LCHs / 2 ms MAC frame / AP Configurable (depends on the selected
average PHY Mode). Throughput per LCH = 192 kbps.
Table 4.6. Access Technologies Capacity Models’ Parameters.

Traffic Analysis at the Radio Interface in Converging Mobile and Wireless Communication Systems
104
New CS CallStarting?
CapacityAvailable ?
Reserve Capacityduring CS Call
Duration(N MAC Frames)
Block CS Call
Start ofSimulation
N
YY
N
7 56
121110
8 4
21
9 3Each MAC
FrameGSM/GPRS
UMTS
Capacity Param.TSs
SF, DL LF
Figure 4.11. Traffic Processing Algorithm – Circuit Switched Applications.
The implemented traffic processing algorithms are realistic for both CS applications and PS video
applications. This is not the case for PS data applications (e.g., Web Browsing), since the buffering
mechanisms (traffic shaping) and scheduling policies existing in real data traffic processing
systems were not considered for simplicity reasons. The major drawback of the current
implementation is that the packet discard rate (number of discarded packets / total number of
packets), considered here for performance evaluation of the data traffic transmission, is in fact a
measure of the amount of packets that would be buffered and delayed in a real system, and not a
real measure of discarded packets (e.g., due to transmission timeouts). In order to avoid over
capacity requests during packet transmissions, maximum allowed peak bitrates for packet
transmission was considered in the ATTPM implementations, Table 4.7, introducing a pseudo-
shaping effect on the data traffic processing algorithms.
In a more realistic implementation, the performance measures of packet data transmission would
be in terms of average (or total) packet delay and packet retransmission rate. These
enhancements are proposed for future work in Chapter 6.
Each ATTPM process run corresponds to the MAC Frame duration of the associated access
technology. Since the MAC frame durations of the different considered access technologies do
not have a common divider, an approximation was used for the GSM/GPRS system. For CS
calls, this approximation has a very reduced impact, since it only affects the total call duration,
which will be a multiple of 5 ms (instead of 4.615 ms). For PS sessions, this approximation is
compensated by a proportional increase in the capacity (in bytes) per GSM/GPRS TS,
minimising its impact in the overall performance.

Simulator Description
105
Technology Max. Peak Bitrate for Packet Transmission Comment
GSM/GPRS Function of Coding Scheme and Max. number of TSs
per GPRS MT,
e.g., 67 kbps (user traffic bitrate)
Corresponds to 5 TS with CS-2
UMTS 1 920 kbps (channel bitrate)
~640 kbps (user traffic bitrate with turbo coding 1/3) Corresponds to SF=4
HIPERLAN/2 3 840 kbps (user traffic bitrate) Corresponds to 20 LCHs
Table 4.7. Maximum Peak Bitrate for Packet Transmission.
New SessionStarting?
Packet(s) toTransmit?
CapacityAvailable ?
Reserve Capacityduring Packet(s)
Transmission(N MAC Frames)
Discard Packet(s)
Last Packetof Session?
7 56
121110
8 4
21
9 3Each MAC
Frame
Start ofSimulation
N
N
YY Y
N
N
Y
GSM/GPRSUMTS
HIPERLAN/2
Capacity Param.TSs
SF, DL LFLCHs
Figure 4.12. Traffic Processing Algorithm – Packet Switched Applications.
System Real MAC Frame Duration
[ms]
Simulator MAC Frame Duration
[ms] GSM 4.615 5
GSM/GPRS 18.46* 20
UMTS 10 10
HIPERLAN/2 2 2
* corresponds to a radio block (4 consecutive TSs).
Table 4.8. MAC Frame Durations in the Simulator.
The fact that the MAC frames do not have a common divider can cause implementation and
synchronisation problems in a real system design, especially if packet based routing approached
are used by the CMM.
As mentioned previously, the TPE takes into account the different application’s priorities/QoS
requirements. These requirements are implemented in the simulator in two ways, using the same
priorities listed in Table 4.9:
• the CMM decisions are made in the same order as the applications priorities;

Traffic Analysis at the Radio Interface in Converging Mobile and Wireless Communication Systems
106
• the traffic processing of the ATTPMs also takes into account the priorities of each
application (e.g., if two sessions of different priorities require capacity at the same
MAC frame, capacity is first reserved for the highest priority application).
Application Processing Priority
Voice Call 1
Video Call (Voice Component) 2
Video Call (Video Component) 3
Video on Demand (Video Component) 4
Web Browsing 5
Email 6
FTP 7
Table 4.9. Application Processing Priorities.
An enhancement of the simulator, could be to consider different priority schemes (dynamic or
static) per user type or even per MT, enabling the analysis of more sophisticated scenarios.
The TPE’s outputs, corresponding to the simulator outputs, include the overall performance
indicators that allow the evaluation of convergence benefits. These outputs will be described in
the following section.
4.4 Output Parameters
The several inputs of the simulator have been presented during its description in the previous
sections. In this section, the output parameters supplied by the simulator and some output
examples will be presented. The simulator allows the selection of the sampling rate of each
output parameter (e.g., every 100 ms), for further analysis. A list of the available output
parameters is presented in Table 4.10, organised into seven different output types.

Simulator Description
107
Available per Output Type Output Parameter
Application Access Technology
Number of Active Sessions (NAS) �(CS+PS) � Session Statistics Ratio of Active Sessions per Active MTs (RSM) Global
Number of Blocked Calls (NBC) � (CS) � CS Calls Statistics Call Blocking Rate (RCB) � (CS) �
Average Call Duration ( Cτ ) � (CS) - CS Traffic Characterisation Generated Traffic (A) [Erl] �(CS) -
Number of Discarded Packets/Frames (NDP) �(PS) �
Percentage of Discarded Packets/Frames (over all Packets/Frames) (ηD) �(PS) � PS Traffic
Statistics
Mean Bitrate ( bR ) �(PS) -
CMM Technology Decision Percentage (ηTD) �(CS+PS) -
CMM Bitrate/Quality Decision Percentage (ηBD) �(CS+PS) -
on Technology (η1PD-T) CMM Statistics
CMM 1st Priority Decisions Percentage
(η1PD) on Bitrate/Quality (η1PD-B) Global
Network’s Load Normalised Capacity Usage (ηU) - �
Call Blocking Rate Degradation (CBRD ) Global
Overall Discarded Packets/Frames Degradation (
DDη ) Global
Overall Performance Degradation
Overall Mean Bitrate Degradation (bRD ) Global
Table 4.10. Simulator Output Parameters.
The parameters RSM, RCB, ηD, ηTD, ηBD, η1PD-T, η1PD-B, and ηU, are given by the following
expressions:
ASSM
AM
NRN
= , (4.1)
where NAM is the number of active MTs;
BCCB
C
NRN
= , (4.2)

Traffic Analysis at the Radio Interface in Converging Mobile and Wireless Communication Systems
108
where NC is the total number of CS calls;
DPD
P
NN
η = , (4.3)
where NP is the total number of packets/frames;
iSTTD
S
NN
η = , (4.4)
where iSTN is the total number of sessions routed through access technology i (GSM/GPRS,
UMTS or HIPERLAN/2) and NS is the total number of sessions;
jSBBD
S
N
Nη = , (4.5)
where jSBN is the total number of sessions using bitrate/quality j;
11
STPD T
S
NN
η − = , (4.6)
where N1ST is the total number of sessions routed through the 1st priority access technology
(according to the PT);
11
SBPD B
S
NN
η − = , (4.7)
where N1SB is the total number of sessions using the 1st priority bitrate/quality (according to the
PT);
, for GSM/GPRS
512, for UMTS
, for HIPERLAN/2
U
U U
U
TS
TS
Co Co
Co CoSHU
DL
DLmax
LCH
LCH
NN
N NN N
NN
ηη
η
= − =
, (4.8)

Simulator Description
109
where UTSN is the number of used TSs, NTS is the total number of available TSs,
UCoN is the
equivalent number of used codes assuming SF=512, NC is the equivalent total number of
available codes assuming SF=512 excluding the amount of codes reserved for soft handover
(NCoSH), ηDLmax is the maximum allowed value for the DL LF (ηDL), ULCHN is the number of used
LCHs, and NLCH is the total number of available LCHs.
In order to have a general and simple overview of the networks’ overall performance, three
overall performance degradation indicators are available (as presented in Table 4.10), considering
global results from all applications and technologies. These parameters are given by the following
expressions:
( )CB
BCR
C all CS applications
NDN
= ; (4.9)
( )D
DP
P all PS applications
NDNη = ; (4.10)
5
1 ( )
( )
max
b
bP
i b PS application iR
P all PS applications
RNR
DN
=⋅
=∑
, (4.11)
where maxbR is the maximum target mean bitrate for a specific application (taking into account the
PT).
The BR degradation (4.9) is calculated as the total blocked CS calls over the total number of CS
calls (for both Voice Call and Video Call applications) and the Discarded Packets/Frames
degradation (4.10) is obtained by dividing all the discarded packets/frames by the total amount of
packets/frames to transmit considering all PS applications. The Mean Bitrate Degradation (4.11)
is obtained by normalising the mean bitrate of each PS application to its maximum target mean
bitrate (taking into account the PT) and weighing each application with the total number of
transmitted packets/frames.

Traffic Analysis at the Radio Interface in Converging Mobile and Wireless Communication Systems
110
The outputs from the simulator are generated in the form of text files (.txt) and further processed
with Matlab for obtaining graphical plots. In the remainder of this section, some examples of the
output parameters obtained from simulations are shown. Merely for information purposes, all
output graphics were obtained from a 1000 users scenario with all access technologies available
(except for the examples presented in Figure 4.24, which was obtained with only GSM/GPRS
and HIPERLAN/2 technologies active, and Figure 4.26 and Figure 4.27, which were obtained
with only GSM/GPRS and UMTS active) with a sampling rate of 10 s during one complete BH.
The users profiles, network configuration and CMM parameters correspond to the ones used in
Chapter 5.
The first set of 4 graphics corresponds to examples of the session statistics. Figure 4.13 shows
the evolution of the total active sessions/calls and the ratio between the total active sessions and
the total active MTs. The latter provides an indication of the evolution of the average number of
active applications per active MT. Figure 4.14 and Figure 4.15 provide the evolution of the
number of active sessions per application, while Figure 4.16 provides the evolution of the
number of active sessions processed per access technology.
0 500 1000 1500 2000 2500 3000 3500 40000
20
40
60
Act
ive
Sess
ions
, NA
S
Time [s]0 500 1000 1500 2000 2500 3000 3500 4000
1
1.05
1.1
1.15
Ratio
Act
ive
Sess
ions
/ A
ctiv
e M
Ts, R
SM
Active SessionsActive Sessions/Active MTs
Figure 4.13. Active Sessions and Ratio Active Sessions/Active MTs.

Simulator Description
111
0 500 1000 1500 2000 2500 3000 3500 40000
2
4
6
8
10
12
14
16
18
Time [s]
Num
ber o
f Act
ive
Sess
ions
, NA
S
Voice CallVideo CallVideo on Demand
Figure 4.14. Active Sessions per Application (Voice Call, Video Call and Video on Demand).
0 500 1000 1500 2000 2500 3000 3500 40000
1
2
3
4
5
6
7
Time [s]
Num
ber o
f Act
ive
Sess
ions
, NA
S
WWWFTPEmail
Figure 4.15. Active Sessions per Application (WWW, FTP and Email).

Traffic Analysis at the Radio Interface in Converging Mobile and Wireless Communication Systems
112
0 500 1000 1500 2000 2500 3000 3500 40000
5
10
15
20
25
Time [s]
Num
ber o
f Act
ive
Sess
ions
, NA
S
GSM/GPRSUMTSHIPERLAN/2
Figure 4.16. Active Sessions per Access Technology.
The following set of three figures corresponds to examples of the CS calls statistics. Figure 4.17
presents the evolution of the cumulative number of CS calls and of CS blocked calls per CS
Application (voice call and video call (voice component)). Figure 4.18 and Figure 4.19 depict the
evolution of the call BR per CS application and per access technology, respectively. Analysing
Figure 4.19 one observes that all blocked calls were performed by GSM in the associated
simulation. The simulator also provides the blocking rate due to lack of available codes or excess
of DL LF for the UMTS system.
Examples of the CS traffic characterisation outputs are presented in Figure 4.20 and Figure 4.21.
Figure 4.20 provides the average call duration for the CS applications. The Video on Demand
average session duration is also included in this figure. One can observe that the average
call/session duration converges approximately to the parameterised values (in this case, 120 s for
all three applications), although the number of calls/sessions is relatively small (few hundreds).
Figure 4.21 provides the overall generated traffic (in Erlang) per CS application. As expected,
these values also converge to specific values.
In what regards to PS traffic statistics, Figure 4.22 presents an example of the evolution of the
total number of transmitted packets/frames (for video applications) and of the total number of
discarded packets/frames per PS application. The voice sessions that are transmitted over
HIPERLAN/2 (VoIP) are also included in these statistics, providing the number of discarded
packets an indicator of the quality of the voice transmission.

Simulator Description
113
0 500 1000 1500 2000 2500 3000 3500 40000
100
200
300
Time [s]
No.
of C
alls,
NC
Total Calls per Service
Voice CallVideo Call
0 500 1000 1500 2000 2500 3000 3500 40000
5
10
15
20
25
Time [s]
No.
of B
lock
ed C
alls,
NBC
Total Blocked Calls per Service
Voice CallVideo Call
Figure 4.17. Number of CS Calls and CS Blocked Calls.
0 500 1000 1500 2000 2500 3000 3500 40000
2
4
6
8
10
12
14
Time [s]
Call
Bloc
king
Rat
e, R CB
[%]
Voice CallVideo Call
Figure 4.18. Blocking Rate per CS Application.

Traffic Analysis at the Radio Interface in Converging Mobile and Wireless Communication Systems
114
0 500 1000 1500 2000 2500 3000 3500 40000
2
4
6
8
10
12
14
Time [s]
Call
Bloc
king
Rat
e, R CB
[%]
GSMUMTS CodesUMTS DL LF
Figure 4.19. CS Calls Blocking Rate per Access Technology.
0 500 1000 1500 2000 2500 3000 3500 40000
20
40
60
80
100
120
140
Time [s]
Ave
rage
Cal
l/Se
ssio
n D
urat
ion,
τ C [s]
Voice CallVideo CallVideo on Demand
Figure 4.20. Average Call/Session Duration per Application.

Simulator Description
115
0 500 1000 1500 2000 2500 3000 3500 40000
1
2
3
4
5
6
7
8
9
10
Time [s]
Gen
erat
ed T
raff
ic, A
[Erl]
Voice CallVideo Call
Figure 4.21. Generated Traffic per CS Application.
0 500 1000 1500 2000 2500 3000 3500 40000
2
4
6
8 x 10⁵
Time [s]
No.
Pac
kets
/Fra
mes
, NP
Total Packets/Frames per Application
Voice Call (VoIP)Video Call (VoIP)Video Call (Video)Video on DemandWWWFTPEmail
0 500 1000 1500 2000 2500 3000 3500 40000
0.5
1
1.5
2
2.5 x 10⁴
Time [s]
No.
Disc
. Pac
kets
/Fra
mes
, ND
P Total Discarded Packets/Frames per Application
Voice Call (VoIP)Video Call (VoIP)Video Call (Video)Video on DemandWWWFTPEmail
Figure 4.22. Number of Transmitted Packets/Frames and Discarded Packets/Frames per PS Application.

Traffic Analysis at the Radio Interface in Converging Mobile and Wireless Communication Systems
116
Figure 4.23 and Figure 4.24 depict the evolution of the discarded packets/frames (in %) per PS
application and per access technology for the Web Browsing application, respectively. In both
graphics, as expected, a convergence tendency is observed in all curves. As one can observe in
Figure 4.24, the simulator provides the percentage of discarded packets/frames within each
access technology: GSM, UMTS (due to lack of available codes or excess of DL LF) and
HIPERLAN/2.
Another important output of the simulator relatively to the PS traffic statistics is the mean bitrate
per PS Application. Figure 4.25 presents an example of the evolution of these values. Again, as
expected, the values converge to specific values. The variations in the mean bitrate per
application are due to the CMM decisions on the bitrate/quality of each new PS session.
The CMM statistics provide information on the decision percentages relatively to the different
technology routing choices per application and the respective transmission quality/bitrate.
Examples of the evolution of these decisions percentages can be observed in Figure 4.26 and
Figure 4.27. Figure 4.26 shows the evolution of the CMM technology decision for the WWW and
FTP applications, while Figure 4.27 shows the evolution of the CMM bitrate/quality decision for
the Email application. The decisions percentages in both cases also present a converged
behaviour. As mentioned previously, both these figures were obtained for a scenario with only
GSM/GPRS and UMTS.
The simulator also provides statistics on the ATTPMs, namely the capacity usage of each access
technology network. As mentioned in Section 4.3, the capacity measurement parameters used in
the simulator are the number of TSs for GSM/GPRS, the available number of codes and DL LF
for UMTS and the number of LCHs for HIPERLAN/2. An example of the evolution of these
four parameters normalised to their maximum allowed values is presented in Figure 4.28.

Simulator Description
117
0 500 1000 1500 2000 2500 3000 3500 40000
2
4
6
8
10
12
14
16
18
Time [s]
Disc
arde
d Pa
cket
s/Fr
ames
, ηD
[%]
Voice Call (VoIP)Video Call (VoIP)Video Call (Video)Video on DemandWWWFTPEmail
Figure 4.23. Percentage of Discarded Packets/Frames per PS Application.
0 500 1000 1500 2000 2500 3000 3500 40000
2
4
6
8
10
12
14
16
18
Time [s]
Disc
arde
d Pa
cket
s, η D
[%] GSM/GPRS
UMTS CodesUMTS DL LFHIPERLAN/2
Figure 4.24. WWW Application Discarded Packets per Access Technology.

Traffic Analysis at the Radio Interface in Converging Mobile and Wireless Communication Systems
118
0 500 1000 1500 2000 2500 3000 3500 40000
200
400
600
800
1000
1200
1400
1600
1800
2000
Time [s]
Mea
n Bi
trate
, Rb [k
bps] Video Call (Video)
Video on DemandWWWFTPEmail
Figure 4.25. Mean Bitrate per PS Application.
0 500 1000 1500 2000 2500 3000 3500 40000
20
40
60
80
100
Time [s]CMM
Tec
h. D
ecisi
on, η
TD [%
] Convergence Manager Tecnhology Decision - WWW ApplicationGSM/GPRSUMTSHIPERLAN/2
0 500 1000 1500 2000 2500 3000 3500 40000
20
40
60
80
100
Time [s]CMM
Tec
h. D
ecisi
on, η
TD [%
] Convergence Manager Tecnhology Decision - FTP Application
GSM/GPRSUMTSHIPERLAN/2
Figure 4.26. CMM Technology Decision Percentage – WWW and FTP applications.

Simulator Description
119
0 500 1000 1500 2000 2500 3000 3500 40000
10
20
30
40
50
60
70
80
90
100
Time [s]
CMM
Bitr
ate/
Qua
lity
Dec
ision
Per
cent
age,
η BD [%
]
Email 64 kbpsEmail 144 kbpsEmail 384 kbps
Figure 4.27. CMM Bitrate/Quality Decision Percentage - Email Application.
0 500 1000 1500 2000 2500 3000 3500 40000
10
20
30
40
50
60
70
80
90
100
Time [s]
Nor
mal
ised
Capa
city
Usa
ge, η
U [%
]
GSM/GPRS TSsHL/2 LCHsUMTS CodesUMTS DL LF
Figure 4.28. Normalised Capacity Usage per Access Technology.

Traffic Analysis at the Radio Interface in Converging Mobile and Wireless Communication Systems
120

Analysis of Results
121
Chapter 5
Analysis of Results 5 Analysis of Results
In this chapter, one analyses the results of simulations for several different scenarios and
following three different approaches. The simulated scenarios are characterised according to
three components: technologies, users and applications. The major performance indicators that
are considered for the overall performance analysis of the simulated scenarios are: CS calls BR,
percentage of PS discarded packets/frames and mean bitrate per PS application.

Traffic Analysis at the Radio Interface in Converging Mobile and Wireless Communication Systems
122
5.1 Scenarios Description
In order to characterise in a simple way the scenarios to be simulated in the present chapter,
referred from here onwards as Convergence Scenarios, three main components have been
identified, Figure 5.1:
• Access Technology Scenario, defined by the available access technologies (to all
users/MTs) and their specific characterisation;
• User Scenario, characterised by the number of users/MTs and user type
penetrations (market segmentation);
• Applications Scenario, identifying the active applications (for all users/MTs), their
characterisation, and their specific traffic characteristics (per user type).
The overall convergence technique/strategy associated to each Convergence Scenario interacts
with these three components, depending on their individual characteristics/requirements.
As mentioned in the previous chapter, the overall convergence technique/strategy is defined by
means of a PT in the CMM of the simulator. The construction of a specific PT is influenced by
the three components above identified, i.e., it contemplates access technology aspects (e.g.,
available technologies with convergence capabilities and their application specific performances),
users preferences (e.g., user defined applications priority/quality requirements, applications costs
issues), and applications’ requirements (e.g., maximum delay, bitrate). As stated in Chapter 4, a
fixed PT was implemented in the current simulation platform, given by Table 4.3, based on a
highest throughput / best system approach. The characterisation of this PT has also been
discussed in Chapter 4.
Each of the components of a Convergence Scenario will be characterised in the following
paragraphs.

Analysis of Results
123
Technologies
Applications
Users
Convergence Scenario
Technologies
Applications
Users
Convergence Scenario
Figure 5.1. Main components for the characterisation of a Convergence Scenario.
As mentioned in Chapter 4, three different access technologies were considered in the
development of the simulation platform: GSM/GPRS, UMTS and HIPERLAN/2. An Access
Technology Scenario characterises/parameterises these three access technologies and defines
which of them are available to the users/MTs. For all Access Technology Scenarios adopted
throughout the present chapter, a common technology parameterisation for the different access
technologies was used, Table 5.1. As a basis for the overall network configuration, a “Public
Square” type scenario (e.g., with 100×100 m2) was considered, assuming collocated base stations
(e.g., in the centre of the square), one per access technology, Figure 5.2.
IP Backbone
GSM/GPRS
UMTS
HL/2
ConvergenceManager
Figure 5.2. Network Configuration of Simulated Scenarios.

Traffic Analysis at the Radio Interface in Converging Mobile and Wireless Communication Systems
124
For the GSM/GPRS system, 30 TSs were considered available for user traffic (in a similar
configuration as presented in Chapter 2 for a medium-capacity cell with four TRXs, with 2 TSs
reserved for signalling and control). For data applications (via GPRS), a maximum user bitrate of
67 kbps is adopted, corresponding to an allocation of 5 TSs with CS-2 (on average). A free TS
allocation scheme between CS and PS applications was considered, although assuming higher
priority for the CS traffic, as stated in Chapter 4.
Access Technology Parameter Comment
# BTSs 1
# TRX Frequencies per BTS 4
# TSs for User Traffic per BTS 30 (remaining 2 TSs used for signalling and control).
GSM/GPRS TS Allocation Scheme Free (all TSs usable for voice and data application).
GPRS Average Coding Scheme CS-2 (13.4 kbps throughput per TS).
GSM
/GPR
S
Max TSs per GPRS MT 5 (maximum supported bitrate per GPRS MT: 5×13.4 kbps=67 kbps).
# Node Bs 1
# Frequency Channels per Node B 1×5 MHz
Duplex Mode FDD mode.
Target DL Eb/No Values per Application See Table 5.2.
Power Control Ideal Power Control.
% codes reserved for Soft Handover 30 %
Activity Factor 0.55 for voice and 1.0 for data applications.
Ratio Other Cell to Own Cell Interference 0.65
Orthogonality Factor 0.5
Downlink Load Factor Max. allowed value: 0.7
Channel Coding Rates 1/2 rate for voice applications and 1/3 rate for data applications.
UM
TS
Code Allocation Scheme Ideal/optimised allocation.
# APs 1
Average PHY Mode PHY Mode 3
HL/
2
# LCHs / 2ms MAC frame / AP 47 (192 kbps / LCH -> Tot ~9 Mbps/AP).
Table 5.1. Parameterisation of the Access Technology Scenarios.

Analysis of Results
125
In what regards the UMTS system, one 5 MHz channel was considered available at the Node B
for FDD mode. The DL target Eb/No values per application used in the simulations are the ones
presented in Table 5.2. These values were obtained from [FCXV03] for the particular case of a
3 km/h mobility scenario (low mobility). The maximum allowed value for the DL LF was set to
0.7, and a 1/2 rate channel coding rate was considered for voice applications and a 1/3 rate for
video and data applications. The values for these parameters and for the remaining ones, listed in
Table 5.2 (for UMTS), were selected from the common value ranges presented in literature (e.g.,
[HoTo00]).
For HIPERLAN/2, PHY Mode 3 was considered as the average PHY Mode in use by the
system. A total of 47 LCHs were considered available per MAC frame (each 2 ms) for user
traffic, providing an overall throughput (DL + UL) of approximately 9 Mbps at the AP. These
values are based on the throughput calculations and simulation results presented in [KrSa01].
Seven different Access Technology Scenarios were considered in the present chapter for
simulation purposes. These scenarios correspond to all possible combinations of available access
technologies, as listed in Table 5.3.
Application DL Target Eb/No [dB] Voice Call 7.5
Video Call (Video Component) 5.7
Video on Demand (Video Component) 5.6
8 kbps 5.7
32 kbps 5.7
64 kbps 5.6
144 kbps 5.3
Data Applications
(Web Browsing,
Email and FTP)
384 kbps 3.8
Table 5.2. DL Target Eb/No values adopted for the UMTS ATTPM.
Ten different User Scenarios are considered in the present chapter, corresponding to different
number of users/MTs, ranging from 100 to 1 000 users in steps of 100 users, Table 5.4. These
User Scenarios will enable to evaluate the impact of the variation of the number of users for
different Access Technology and Applications Scenarios.

Traffic Analysis at the Radio Interface in Converging Mobile and Wireless Communication Systems
126
Available Access Technologies Access Technology
Scenario GSM/GPRS UMTS HIPERLAN/2
G √
U √
H √
G+U √ √
G+H √ √
U+H √ √
G+U+H √ √ √
Table 5.3. Access Technology Scenarios.
User Scenario 1 2 3 4 5 6 7 8 9 10
Number of Users 100 200 300 400 500 600 700 800 900 1 000
Table 5.4. User Scenarios.
For all considered User Scenarios, fixed user type penetration values were adopted, as presented
in Table 5.5. These different user types allow for a more realistic representation of different
market segments with different applications requirements and usage profiles.
User Type 1 User Type 2 User Type 3 Penetration [%] 25 40 35
Table 5.5. User Scenario: User Type Penetration Values.
A fixed Applications Scenario, with all six implemented applications activated, was considered
throughout all the different simulations, Table 5.6. The precise values that were adopted for the
BHCAs and average call/session durations, were arbitrated (with reasonable values), since scarce
literature exists on user traffic profiles for NG networks and applications.
Different BHCA values (providing the average number of CS call attempts / PS sessions per
application during the BH) were considered for each user type. The User Type 1 users are the
most traffic demanding, representing a market segment such as business users, while User Type 3
users are the less traffic demanding, representing, e.g., a mass market segment. The User Type 2
traffic demands represent an intermediate market segment, in which users, for example, use their
MTs for both personal and professional communications, but with lower overall demand than
users of User Type 1.

Analysis of Results
127
BHCA [Calls(/Sessions)/Hr] Application Active User
Type 1 User
Type 2 User
Type 3
Average Call/Session Duration [s]
Voice Call √ 0.5 0.3 0.1 120
Video Call √ 0.4 0.2 0.1 120
Video on Demand √ 0.3 0.3 0.3 120
Web Browsing √ 0.4 0.3 0.2
Email √ 0.3 0.2 0.1
FTP √ 0.2 0.1 0.05
Given by Traffic Source
Models
Table 5.6. Applications Scenario Characterisation.
For the Voice Call, Video Call and Video on Demand applications, average session durations of
120 s were considered for all three user types. For the remaining applications, the session
duration is provided by the traffic source models in function of the session volumes (randomly
generated according to the respective TSMs).
In what regards the simulation methodology followed in this work, the analyses of results are to
be based on simulation sets, composed by a set of simulation runs. A simulation run corresponds
to a complete BH simulation (as previously defined in Section 4.1) of a given Convergence
Scenario concretisation. Each concretisation implies, from the Applications Scenario point of
view, a statistical concretisation of its associated UTVs; this statistical concretisation will be from
here onwards referred to as “instance” of a given Applications Scenario.
In the following sections, analyses of the results of simulations for several different Convergence
Scenarios will be presented, following three different approaches:
• Statistical analysis of user traffic variations (for several instances of the same
Applications Scenario) in the overall performance indicators, for each Access
Technology Scenario and for a fixed User Scenario (Section 5.2);
• For each Access Technology Scenario, analysis of the impact of the number of
users (User Scenario variation) in the overall performance indicators (Section 5.3);
• For a specific User Scenario, analysis of the existence of different Access
Technology Scenarios in the overall performance indicators, given a particular
instance of the Applications Scenario (i.e., several simulation runs maintaining the
same UTVs while varying the Access Technology Scenario) (Section 5.4).

Traffic Analysis at the Radio Interface in Converging Mobile and Wireless Communication Systems
128
Three major performance indicators are considered for the purpose of analysing the results: CS
calls BR, percentage of PS discarded packets/frames and mean bitrate per PS application. The
combination of these three indicators allows for a general understanding of the overall
performance of the simulated scenarios.
When interpreting the performance results of the PS applications, it is important to recall that the
Discarded Packet/Frames indicator provides information on the percentage of packets that
would be buffered and delayed in a real system, and not a real measure of discarded packets.
On average, each simulation run (corresponding to one Busy Hour) lasted about 1 hour in a PIV
2.66 GHz computer with 768 Mbyte of RAM.
5.2 Statistical Analysis
Since user traffic is statistically generated (call/session beginning instants, call/session durations,
session volumes, packet sizes and inter-arrival times, etc.), one needs to analyse the impact of its
variation in the overall performance indicators, maintaining all other parameters constant. In the
present work, this analysis was the first to be done in order to understand if the results of a single
simulation run (corresponding to a single instance of an Application Scenario) would be
representative or not of a more in-depth analysis (i.e., considering several simulation runs),
avoiding excessively long simulation times for obtaining reasonable results.
The adopted procedure was to analyse the mean and the standard deviation values of each
performance indicator for a specific User Scenario (700 users) and for all the different (7) Access
Technology Scenarios. Ten different instances of the Application Scenario were considered in
this analysis, generating ten simulation runs per Access Technology Scenario. Although this is a
quite short set of values in terms of statistical meaning, it presents already a good compromise in
respect to simulation durations within a reasonable timeframe for obtaining indicative results.
In Figure 5.3, the statistical results for the BR performance indicator are presented. The mean
values for each scenario are given by the coloured bars (different coloured bars correspond to
different applications) and the respective standard deviation boundaries are given by the black
error bars centred at the mean values (upper and lower limits corresponding to one standard

Analysis of Results
129
deviation). The same type of results is presented for the Discarded Packets/Frames and Mean
Bitrate performance indicators in Figure 5.4 and Figure 5.5, respectively.
G U H G+U G+H U+H G+U+H0
1
2
3
4
5
6
7
8
9
10
11
Scenario
Call
Bloc
king
Rat
e, R CB
[%]
Voice CallVideo Call
Figure 5.3. BR Statistical Analysis per Access Technology Scenario (700 users, 10 simulation runs).
Analysing the obtained results, one may conclude that the impact of user traffic variation in the
Mean Bitrate indicator is in general relatively low (nearly negligible), while for the BR and
Discarded Packets/Frames indicators a more significant impact is observed.
The standard deviation of the BR results (corresponding to a 68 % confidence interval under the
assumption of a Gaussian process) assumes values between 0.5 % and 2.5 %. Although in
mathematically terms, these values appear to be quite large in comparison to the mean, from a
network performance analysis point of view, these are quite reasonable margins.
In relation to the Discarded Packets/Frames results, the observed standard deviations generally
assumed values between 1 % and 5 %, which again from a network performance analysis point of
view, are quite reasonable.
As previously mentioned, the Mean Bitrate variations are generally very low and can therefore be
considered negligible in most cases. More specifically, the observed standard deviations of the
Mean Bitrate indicator are always below 9 % (in relation to the average values), except for the G
and G+U scenarios, where higher values are observed (for the data applications).

Traffic Analysis at the Radio Interface in Converging Mobile and Wireless Communication Systems
130
G U H G+U G+H U+H G+U+H0
5
10
15
20
25
30
35
40
45
Scenario
Disc
arde
d Pa
cket
s/Fr
ames
, ηD
[%]
Voice Call (VoIP)Video Call (VoIP)Video Call (Video)Video on DemandWWWFTPEmail
Figure 5.4. Discarded Packets/Frames Statistical Analysis per Access Technology Scenario (700 users, 10 simulation
runs).
G U H G+U G+H U+H G+U+H0
200
400
600
800
1000
1200
1400
1600
1800
2000
Scenario
Mea
n Bi
trate
, Rb [k
bps]
Video Call (Video)Video on DemandWWWFTPEmail
Figure 5.5. Mean Bitrate Statistical Analysis per Access Technology Scenario (700 users, 10 simulation runs).

Analysis of Results
131
Although the above results already show a relatively good statistical behaviour for a set of 10
simulation runs, due to the reasonably low standard deviation boundaries observed, a set of 100
simulation runs was performed for the particular case of the Access Technology Scenario with
GSM and HIPERLAN/2, in order to check the reliability of the results obtained previously for
10 simulation runs. It should be noted that once again due to time constraints, this test was
restricted to a specific Convergence Scenario and therefore its results have a limited validity. The
obtained results for the three performance indicators are presented in Figure 5.6 to Figure 5.8.
As it can be observed, the obtained results for 10 and 100 simulation runs are quite similar for all
performance indicators, which confirms the previous statements regarding the reliability of
results based on only 10 simulation runs.
10 1000
0.05
0.1
0.15
0.2
0.25
Number of Simulation Runs
Call
Bloc
king
Rat
e, R CB
[%]
Voice CallVideo Call
Figure 5.6. BR Statistical Analysis for 10 and 100 simulation runs (700 users, G+H).
As a general conclusion of the statistical analysis presented in this section, one can consider that
ten simulation runs per Convergence Scenario provide an already reasonable statistical behaviour,
and therefore one can extrapolate from them indicative error margins for results later obtained
from a single simulation run. This will enable to reduce time consumption by decreasing the
number of simulation runs needed while yet maintaining a reasonable degree of confidence on
the obtained results.

Traffic Analysis at the Radio Interface in Converging Mobile and Wireless Communication Systems
132
10 1000
2
4
6
8
10
12
Number of Simulation Runs
Disc
arde
d Pa
cket
s/Fr
ames
, ηD
[%]
Voice Call (VoIP)Video Call (VoIP)Video Call (Video)Video on DemandWWWFTPEmail
Figure 5.7. Discarded Packets/Frames Statistical Analysis for 10 and 100 simulation runs (700 users, G+H).
10 1000
200
400
600
800
1000
1200
1400
1600
1800
2000
Number of Simulation Runs
Mea
n Bi
trate
, Rb [k
bps]
Video Call (Video)Video on DemandWWWFTPEmail
Figure 5.8. Mean Bitrate Statistical Analysis for 10 and 100 simulations (700 users, G+H).

Analysis of Results
133
5.3 User Scenarios Variation
In this section, one analyses the behaviour of the main performance indicators in function of the
variation of the number of users, i.e., varying the User Scenario, for each Access Technology
Scenario. This type of analysis is useful, for example, for obtaining the number of supported
users for a specific Access Technology Scenario and for certain user profiles in a converged
network scenario.
The qualitative behaviour of the performance indicators are similar for the several Access
Technology Scenarios, and therefore only the results for two particular cases are analysed here, as
a representative set: G+U and G+U+H scenarios. The results of the remaining five Access
Technology Scenarios are presented in Annex 2.
The results presented in this section (and in Annex 2) were obtained from single simulation runs,
and therefore when analysing them one must take into account the associated error margins
(explained in the previous section).
The first set of results corresponds to the G+U Access Technology Scenario. The associated BR,
Discarded Packets/Frames and Mean Bitrate indicators are presented in Figure 5.9 to Figure
5.11, respectively. Although all performance indicators are completely interrelated, the present
analysis will look at the CS applications performance indicator (BR) and the PS applications
performance indicators (Discarded Packets/Frames and Mean Bitrate) separately.
In respect to the BR results, one can observe that it assumes values in the range of 0 % to 9 %
(for 1 000 users), only assuming values greater that zero from 600 users onwards. As expected,
the BR increases with the number of users, due to the increase of the overall user traffic demand.
From a point of view of network performance, these results should be compared with typical
target BR values (commonly between 1 % and 2 % per CS application). Under this aim, and
taking into consideration the error margins analysed in the previous section, the current network
could support between 500 and 600 users (if looking only at the BR indicator), for the given user
profiles.

Traffic Analysis at the Radio Interface in Converging Mobile and Wireless Communication Systems
134
For the PS applications performance indicators, one can observe distinct behaviours for the
video applications (Video Call and Video on Demand) and for the data ones (WWW, FTP and
Email). These two cases will be analysed separately in the following paragraphs. As a general
overview of the two performance indicators, one observes that packets/frames start to be
discarded at 200 users and from thereon presenting an overall increasing tendency, while the
Mean Bitrate indicator presents a general decreasing behaviour, as expected.
As expected, with the increase of the number of users, the percentage of discarded frames for
each video application gradually increases (from 0 % to 30 %), since the mean bitrate of these
applications remains constant (due to the TSMs in use: TBR 32 kbps for Video Call and TBR
64 kbps for Video on Demand). The percentage of discarded frames is higher for the Video on
Demand application, since it requires the double of the capacity than the Video Call one (BHCA
values are similar) and the Video on Demand application is only supported by UMTS.
In respect to the data applications, one observes a decreasing tendency of the mean bitrate values
per application, gradually approaching the minimum values supported by the simulator (8 kbps
for WWW and 64 kbps for FTP and Email) with the increase of the number of users. This
behaviour results in a nearly constant percentage of discarded packets (averaging between 10 %
and 15 %) from 300 up to 800 users. Above 900 users the percentage of discarded packets starts
to increase due to the fact that the mean bitrates of the applications have started to stabilise,
resulting in an effect similar to the case of video applications.
In general one can also observe the effects of prioritisation decisions, implemented in the traffic
processing and in the CMM decision process, on the overall performance results, namely:
• Packets start to be discarded before (in number of users) CS calls are dropped;
• Although in a quite subjective way, the video applications present a more clear (and
dominant) behaviour in relation to % of discarded frames than the data ones;
• The highest priority PS applications present generally lower percentage of discarded
packets/frames than the lowest priority ones (e.g., video call compared to WWW);
• Higher mean bitrates are generally achieved for higher priority data applications
(e.g., higher mean bitrate for WWW than for FTP and Email5).
5 Note that for the current simulated Access Technology Scenario (G+U), the maximum allowed bitrate (in the PT)
for all data applications (WWW, FTP and Email) is 384 kbps.

Analysis of Results
135
100 200 300 400 500 600 700 800 900 10000
1
2
3
4
5
6
7
8
9
10
Number of Users
Call
Bloc
king
Rat
e, R CB
[%]
Voice CallVideo Call
Figure 5.9. BR versus User Scenario (G+U).
100 200 300 400 500 600 700 800 900 10000
5
10
15
20
25
30
35
Number of Users
Disc
arde
d Pa
cket
s/Fr
ames
, ηD
[%]
Video Call (Video)Video on DemandWWWFTPEmail
Figure 5.10. Discarded Packets/Frames versus User Scenario (G+U).

Traffic Analysis at the Radio Interface in Converging Mobile and Wireless Communication Systems
136
If one considers a target maximum percentage of discarded frames between 1 % and 2 % for
video applications (typical values) and a packet discard rate up to 10 % (meaning up to 10 % of
the packets will be delayed, potentially dropped), the overall network could support up to
approximately 500 users. For this number of users, the mean bitrate of the data applications
would still be acceptable (>100 kbps). As previously analysed, from a purely BR perspective, a
number of users between 500 and 600 could be supported.
100 200 300 400 500 600 700 800 900 10000
50
100
150
200
250
300
350
400
450
Number of Users
Mea
n Bi
trate
, Rb [k
bps]
Video Call (Video)Video on DemandWWWFTPEmail
Figure 5.11. Mean Bitrate versus User Scenario (G+U).
In order to have a general and simple overview of the networks’ overall performance, one can
calculate the overall performance degradation parameters presented in Table 4.10 (CBRD ,
DDη
and bRD ). These parameters are represented in Figure 5.12 for the Convergence Scenarios under
analysis. The considered maximum target mean bitrate per PS application are given in Table 5.7.
PS Application Maximum Target Mean Bitrate for GSM+UMTS scenario [kbps]
Video Call (video component) 34.02 (from Table 4.4, H.263 TBR 32 kbps model)
Video on Demand 68.02 (from Table 4.4, H.263 TBR 64 kbps model)
Web Browsing 384
FTP 384
EMAIL 384
Table 5.7. Maximum Target Mean Bitrate per PS Application (G+U).

Analysis of Results
137
As expected from the previous analysis, all three parameters have an increasing tendency,
meaning an increasing overall performance degradation, with the number of users. This
degradation starts to be more relevant from 500 users onwards. One can also notice that the
mean bitrate degradation tends to stabilise for more than 800 users, due to the fact that the
applications are already transmitting at approximately the lowest bitrate (as previously
mentioned). This effect produces a greater increase in the percentage of discarded
packets/frames and in the overall CS BR.
100 200 300 400 500 600 700 800 900 10000
5
10
15
20
25
30
Number of Users
Ove
rall
Perf
orm
ance
Deg
rada
tion
[%]
Call BR Deg., DRCB
Discarded Packets/Frames Deg., DηBMean Bitrate Deg., DRb
Figure 5.12. Overall Performance Degradation versus User Scenario (G+U).
Other interesting parameters to consider, and which help to understand the previous analysis, are
the percentage of 1st priority decisions for both access technology (η1PD-T) and application
bitrate/quality (η1PD-B) selections performed by the CMM, taking into account the PT in use and
the available access technologies. These values are represented in Figure 5.13 for the
Convergence Scenarios under consideration. One can observe a remarkable reduction in the
amount of CMM 1st priority decisions starting from 500 users onwards, resulting in the
previously analysed overall performance degradation.
The second Access Technology Scenario that will be analysed in this section is the G+U+H
scenario, with all access technologies available. For this purpose, a similar analysis to the previous
case will be performed.

Traffic Analysis at the Radio Interface in Converging Mobile and Wireless Communication Systems
138
For the considered number of users (up to 1000), no BR values above zero were obtained (and
therefore no graphic is presented for this parameter), meaning that GSM and UMTS handled all
their respective CS calls with success. In what regards to the performance indicators of the PS
applications, Figure 5.14 provides the percentage of discarded packets/frames per PS application,
while Figure 5.15 depicts the mean bitrates obtained per PS application.
100 200 300 400 500 600 700 800 900 100040
50
60
70
80
90
100
Number of Users
CMM
1st
Prio
rity
Dec
ision
s, η 1P
D [%
]
Access Technology, η1PD-TApplication Bitrate/Quality, η1PD-B
Figure 5.13. Percentage of CMM 1st Priority Decisions versus User Scenario (G+U).
As expected, the percentage of discarded packets/frames generally increases with the number of
users, while the mean bitrate per PS application generally decreases. Since the three access
technologies provide a higher capacity than in the previous case (G+U), the performance
degradation is therefore lower. The mean bitrate of the applications only starts to decrease from
their maximum allowed values when more than 600 users are present, although the decrease is
considerably low. Even for 1 000 users, the mean bitrates obtained for all PS applications are still
very high. This can also be observed in Figure 5.16, where the overall mean bitrate degradation
for 1 000 users is approximately 10 % (in comparison to the maximum allowed values). The
considered maximum target mean bitrate per PS application used in Figure 5.16 is given in Table
5.8.

Analysis of Results
139
PS Application Maximum Target Mean Bitrate for G+U+H scenario [kbps]
VoIP (Voice Call and voice component of Video Call) 8.69 (from Table 4.4)
Video Call (video component) 180.88 (from Table 4.4, GBAR H.263 VBR model)
Video on Demand 573.39 (from Table 4.4, GOP GBAR MPEG-4 HQ model)
Web Browsing 2000
FTP 384
EMAIL 384
Table 5.8. Maximum Target Mean Bitrate per PS Application (G+U+H).
The percentage of discarded packets/frames increases until the number of users reaches
approximately 800 users and from thereon tends to stabilise (up to 1 000 users). This can be
more clearly observed in Figure 5.16, where the overall discarded packets/frames degradation
stabilises between 3 % and 4 %. This effect is due to the compensation of the increase of the
number of users with the mean bitrate reduction observed in Figure 5.15. Considering again a
target maximum percentage of discarded frames between 1 % and 2 % for video applications and
a packet discard rate of up to 10 %, the overall network could support up to approximately 700
users. For this number of users, the mean bitrates of the data applications are still close to their
maximum allowed values.
Observing now the percentage of 1st priority decisions performed by the CMM, Figure 5.17, it is
quite clear that there starts to exist a considerable reduction in the amount of CMM 1st priority
decisions between 700 and 800 users, resulting in the previously analysed overall performance
degradation.
As previously mentioned, the performance results of the remaining five Access Technology
Scenarios (G, U, H, G+H and U+H) are presented in Annex 2. These results present in general a
similar behaviour to the ones considered in this section, and are therefore not analysed in detail.

Traffic Analysis at the Radio Interface in Converging Mobile and Wireless Communication Systems
140
100 200 300 400 500 600 700 800 900 10000
2
4
6
8
10
12
14
Number of Users
Disc
arde
d Pa
cket
s/Fr
ames
, ηD
[%]
Voice Call (VoIP)Video Call (VoIP)Video Call (Video)Video on DemandWWWFTPEmail
Figure 5.14. Discarded Packets/Frames versus User Scenario (G+U+H).
100 200 300 400 500 600 700 800 900 10000
200
400
600
800
1000
1200
1400
1600
1800
2000
Number of Users
Mea
n Bi
trate
, Rb [k
bps]
Video Call (Video)Video on DemandWWWFTPEmail
Figure 5.15. Mean Bitrate versus User Scenario (G+U+H).

Analysis of Results
141
100 200 300 400 500 600 700 800 900 10000
2
4
6
8
10
12
Number of Users
Ove
rall
Perf
orm
ance
Deg
rada
tion
[%]
Call BR Deg., DRCB
Discarded Packets/Frames Deg., DηBMean Bitrate Deg., DRb
Figure 5.16. Overall Performance Degradation versus User Scenario (G+U+H).
100 200 300 400 500 600 700 800 900 100085
90
95
100
Number of Users
CMM
1st
Prio
rity
Dec
ision
s, η 1P
D [%
] Access Technology, η1PD-TApplication Bitrate/Quality, η1PD-B
Figure 5.17. Percentage of CMM 1st Priority Decisions versus User Scenario (G+U+H).

Traffic Analysis at the Radio Interface in Converging Mobile and Wireless Communication Systems
142
5.4 Access Technology Scenarios Variation
The third and last approach adopted for analysing the simulator results is presented in this
section. This approach will focus on the analysis of the impact of different Access Technology
Scenarios (i.e., different available access technologies) in the overall performance indicators, for a
specific User Scenario (i.e., number of users) and for a particular instance of the Applications
Scenario (i.e., maintaining the same UTVs for all the different Access Technology Scenarios). By
maintaining the same instance of the Applications Scenario, a more precise comparative analysis
can be performed between the different outputs for the several Access Technology Scenarios.
This type of analysis is useful, for example, for the evaluation of which technology or
combination of technologies are ideal for supporting a given number of users with specific traffic
profiles in a converged network scenario.
Only one User Scenario will be considered in the present analysis: 700 users. The results for other
User Scenarios, namely 500, 600, 800, 900 and 1 000 users are presented in Annex 3, which can
be analysed in a similar way as the one presented in the following paragraphs.
Figure 5.18 presents the obtained results for the CS applications BR, while the percentage of
discarded packets/frames and the mean bitrate values for the PS applications are presented in
Figure 5.19 and Figure 5.20, respectively. As one can expect, when more technologies are
available better overall performances are achieved. This fact is quite clear for all performance
indicators (for instance, the BR parameter only presents values greater than zero when
HIPERLAN/2 is not available).
Looking firstly at the individual technology scenario performances (GSM, UMTS and
HIPERLAN/2), one can observe the following results for each performance indicator:
• BR (only applicable to GSM and UMTS): UMTS presents a lower BR in
comparison to GSM;
• % of Discarded Packets/Frames: HIPERLAN/2 presents the overall lowest values
while UMTS presents the highest ones;
• Mean Bitrate: HIPERLAN/2 obtained again the overall best results, followed by
UMTS, that presents slightly higher values than GSM.

Analysis of Results
143
G U H G+U G+H U+H G+U+H0
2
4
6
8
10
12
Access Technology Scenario
Call
Bloc
king
Rat
e, R CB
[%]
Voice CallVideo Call
Figure 5.18. BR versus Access Technology Scenario (700 users).
G U H G+U G+H U+H G+U+H0
5
10
15
20
25
30
35
40
Access Technology Scenario
Disc
arde
d Pa
cket
s, η D
[%]
Voice Call (VoIP)Video Call (VoIP)Video Call (Video)Video on DemandWWWFTPEmail
Figure 5.19. Discarded Packets/Frames versus Access Technology Scenario (700 users).

Traffic Analysis at the Radio Interface in Converging Mobile and Wireless Communication Systems
144
G U H G+U G+H U+H G+U+H0
200
400
600
800
1000
1200
1400
1600
1800
Access Technology Scenario
Mea
n Bi
trate
, Rb [k
bps]
Video Call (Video)Video on DemandWWWFTPEmail
Figure 5.20. Mean Bitrate versus Access Technology Scenario (700 users).
In order to help on the analysis of these results, one can again report to the overall performance
degradation parameters and the percentage of 1st priority decisions performed by the CMM.
These parameters are represented in Figure 5.21 and Figure 5.22, respectively. In order to have
the same comparative basis between the different Access Technology Scenarios, these figures
were obtained using exactly the same target objectives for all scenarios. In particular, the
maximum target mean bitrate that is used in Figure 5.21 for each PS application (for all Access
Technology Scenarios) is given by Table 5.8 (corresponding to the maximum target values of the
PT). The values presented in Figure 5.22 also assume, independently of the access technology
scenario, the first priority decision (for both access technology and application quality/bitrate
selection) that is considered in the overall PT.
As expected, the HIPERLAN/2 system, due to its much higher capacity, presents better
performances than the other individual systems. The worst performance of the UMTS system in
terms of discarded packets/frames in comparison to the GSM system is due to the fact that the
Video on Demand application is not supported by the latter system, and therefore less capacity is
required. In an equivalent situation (i.e., deactivating the Video on Demand application), the
UMTS system (taking into account the parameters of Table 5.1) would present better results than
the GSM system (for all three performance indicators).

Analysis of Results
145
G U H G+U G+H U+H G+U+H0
10
20
30
40
50
60
70
80
90
Access Technology Scenario
Ove
rall
Perf
orm
ance
Deg
rada
tion
[%]
Call BR Deg., DRCB
Discarded Packets/Frames Deg., DηBMean Bitrate Deg., DRb
Figure 5.21. Overall Performance Degradation versus Access Technology Scenario (700 users).
G U H G+U G+H U+H G+U+H0
10
20
30
40
50
60
70
80
90
100
Access Technology Scenario
CMM
1st
Prio
rity
Dec
ision
s, η 1P
D [%
] Access Technology, η1PD-TApplication Bitrate/Quality, η1PD-B
Figure 5.22. Percentage of CMM 1st Priority Decisions versus Access Technology Scenario (700 users).

Traffic Analysis at the Radio Interface in Converging Mobile and Wireless Communication Systems
146
The overall performance degradation parameters, as well as the percentage of 1st priority
decisions performed by the CMM confirm the better performance of the HIPERLAN/2 system
and relatively low performance of the GSM and UMTS systems.
Analysing the results for the cases where more than one technology is available, one can observe
that, for the number of users under consideration, the performance obtained is approximately the
same (close to its maximum values) for the cases where the HIPERLAN/2 system is available.
This is due to the high capacity of the HIPERLAN/2 system, which handles nearly all the PS
traffic, while the other system(s) handle without any blocking the CS calls. More specifically one
can observe the following facts for the multi-technology scenarios where HIPERLAN/2 is
present:
• zero BR is always obtained;
• the % of discarded packets/frames as well as the mean bitrate per PS application
present approximately the same values for all scenarios.
These results can be further confirmed and understood by observing the overall performance
degradation parameters, with values lower than 6 %, and the percentage of CMM 1st priority
decisions, generally above 90 %.
For the User Scenario under analysis (700 users), one can conclude that there is no significant
benefit of combining the three systems in relation to the results obtained for the 2 technology
scenarios where one system is HIPERLAN/2, since the same overall results are approximately
obtained. In fact, the standalone HIPERLAN/2 scenario already provides nearly the same overall
performance than the multi-technology scenarios where HIPERLAN/2 is available.
The G+U scenario, although with much lower performance than the scenarios with
HIPERLAN/2, obtained better results from the point of view of the percentage of discarded
packets/frames, than the UMTS standalone scenario, maintaining similar values for the other
parameters. More specifically, the G+U scenario presented similar overall results for the CS calls
BR and mean bitrate indicators in comparison to the UMTS standalone scenario, but providing a
much lower percentage of discarded packets/frames for the PS applications.

Conclusions
147
Chapter 6
Conclusions 6 Conclusions
This chapter finalises this work, summarising conclusions and pointing out aspects to be
developed in future work.

Traffic Analysis at the Radio Interface in Converging Mobile and Wireless Communication Systems
148
The current thesis intended to analyse the overall performance of a converged multi-technology
system (convergence benefits), mainly focussing on capacity aspects of the radio interface. Three
technologies have been considered for this purpose: GSM/GPRS, UMTS and HIPERLAN/2.
The analysis was performed with the aid of a newly developed simulation platform, considering
several scenarios. Different approaches were followed for the analysis of the overall performance
results, namely:
• Analysis of the impact of users traffic variations (in order to analyse the impact of
the statistical behaviour of user generated traffic in the overall performance);
• Analysis of the impact of the number of users in specific scenarios corresponding
to different available access technologies (e.g., for obtaining the number of
supported users for a specific Access Technology Scenario and for certain user
profiles in a converged network scenario);
• Analysis of the impact of the availability of different access technologies for a
particular number of users (e.g., for evaluation of what technology or combination
of technologies are ideal for supporting a given number of users with specific traffic
profiles in a converged network scenario).
A key and novel concept adopted in the development of the present work is the Convergence
Manager. This new element, which is present at both the terminal and network sides, is basically
responsible for the implementation of all convergence functionalities in the overall system.
Basically, the CM allocates the packets (on a session basis) coming from different users using
various applications to different access technologies (and vice-versa). In the implemented
simulation platform, a single convergence perspective/strategy was implemented based on a
highest throughput (highest available/possible transmission bitrate per application) / best system
(priority is given to the most appropriate application-oriented access technology) approach.
As a first step for the development of the present work, the radio interfaces of the three
considered technologies, GSM/GPRS, UMTS and HIPERLAN/2, have been studied with the
aim of establishing simple capacity models per individual technology to be further implemented
in the simulation platform. In the implementation of these capacity models, several
approximations were considered for each technology in order to enable the desired analysis in the
context of a Master Thesis. Nevertheless, there was always the concern that the taken
approximations kept the essential characteristics of each technology standard under

Conclusions
149
consideration. An example of the adopted approximations can be the considered air interface
load estimation in DL for UMTS. The simulator considers only the throughput based approach
(DL LF) and does not take into account the power based one. This approximation was taken
since, besides the developed simulation tool not supporting propagation aspects, the target
scenarios to be simulated assume a small physical area (and consequently small cell sizes), and
therefore, in this case, the limiting UMTS load measurement is the DL LF. Other approximations
include, for example, “rounded” MAC frame durations for GSM and GSM/GPRS, ideal power
control for UMTS and average PHY mode consideration for HIPERLAN/2.
Six different applications have been considered for user traffic generation: Voice Call, Video Call,
Video on Demand, Web Browsing, Email and FTP, representing all four service classes (with
different QoS requirements) defined by 3GPP. These applications and the supporting services
have been characterised in detail. In order to implement the user traffic generation mechanisms
in the simulation platform, specific traffic source models, as well as call/session generation and
duration processes, were necessary for each considered application. For this purpose, an
extensive literature survey has been performed to obtain such traffic source models and
respective parameterisation values, taking into consideration the three supporting access
technologies. A complete mapping between the considered technologies (GSM/GPRS, UMTS
and HIPERLAN/2), applications and traffic source models has been performed, forming a basis
for the simulator development. In particular, the voice and video components of the Video Call
application (with separate traffic source models per component) can be transmitted via separate
access technologies (although synchronisation issues can be a limiting factor in a real network
scenario).
The developed simulation platform, implemented in Visual C++ programming language, is based
on two main functional blocks:
• the User Traffic Generation Module, which is responsible for generating the users
and their associated traffic (by means of the implemented traffic source models).
The outputs of this block are User Traffic Vectors per active application per user,
providing complete information on the beginning instants and durations of CS
calls, and on the beginning instants and sizes of each packet belonging to PS
sessions;
• the Traffic Processing Engine, which is the main functional entity of the simulator

Traffic Analysis at the Radio Interface in Converging Mobile and Wireless Communication Systems
150
as it performs all the “convergence” and traffic processing tasks. It receives the
User Traffic Vectors generated by the User Traffic Generation Module and
processes them according to different convergence perspectives/strategies (by
means of a Convergence Manager Module and three Access Technology Traffic
Processing Modules).
For simplicity reasons, the simulator only considers downlink user traffic processing, disregarding
the uplink components, due to the high asymmetry of the majority of the considered
applications, with a higher capacity demand on the downlink direction, and also because, in
general, the downlink component is capacity limited, in opposition to the uplink components
which are usually interference/power limited. All Mobile Terminals have been considered to be
capable of receiving traffic through all available access technology networks. Several user-defined
inputs parameterise the simulator, enabling the simulation of different user, applications and
technology scenarios. The simulator provides several types of output indicators for overall
performance evaluation, namely CS (call blocking rate) and PS (% discarded packets/frames and
mean bitrate per application) traffic statistics.
The developed simulator constitutes a flexible and upgradeable platform, allowing, for example,
an easy inclusion of different convergence perspectives/strategies. Hence, this simulation
platform provides a complete functional framework for the evaluation of the convergence of
mobile and wireless communication systems.
All different scenarios (Convergence Scenarios) that were analysed in the present work have been
characterised according to their three main components: access technologies, users and
applications. Three major performance indicators were considered for the overall performance
analysis of these simulated Convergence Scenarios: CS calls BR, percentage of PS discarded
packets/frames and mean bitrate obtained per PS application. Auxiliary parameters, helping in
the results analysis, have also been considered, namely the overall performance degradation
parameters (joining the results for all applications in unique parameters) and the percentage of 1st
priority decisions performed by the CMM in each simulation. On average, each simulation run
(corresponding to one Busy Hour simulation) lasted approximately 1 hour in a PIV 2.66 GHz
computer with 768 Mbyte of RAM.
From the statistical analysis of user traffic variations performed in this work, it was verified that
ten simulation runs per Convergence Scenario provide an already reasonable statistical behaviour,

Conclusions
151
therefore allowing the extrapolation of indicative error margins for results obtained from single
simulation runs. From a network performance point of view, the error margins (i.e., variability)
observed for the performance indicators were quite acceptable, mainly taking into account the
fact that the increase of the parameters for some applications are compensated with their
decrease for the others, maintaining the overall performance with a relatively low variation. These
results were obtained analysing the results for all possible access technology scenarios,
considering a fixed User Scenario of 700 users. In particular, considering 10 simulation runs per
scenario, the obtained BR standard deviations assumed (absolute) values between 0.5 % and
2.5 %, while the percentage of discarded packets/frames standard deviations were generally
between 1 % and 5 % (absolute values). The obtained mean bitrate standard deviations were also
quite low (always below 9 % relatively to the average values, except for the GSM and
GSM+UMTS scenarios, where higher values were observed for the data applications). These
facts allow for a reasonable degree of confidence on results obtained with single simulation runs,
reducing the number of needed simulation runs and consequent time consumption.
The impact of the number of users has been analysed for two specific Access Technology
Scenarios: GSM+UMTS and GSM+UMTS+HIPERLAN/2, maintaining the same Applications
Scenario. The evolution of the performance indicators with the increase of the number of users
has behaved as expected, i.e., the CS calls BR and the percentage of discarded packets/frames
increases while the mean bitrate obtained per PS application decreases. The effects of the
prioritisation schemes implemented in the simulator were also noticed (e.g., higher mean bitrates
were generally achieved for higher priority data applications and higher priority PS applications
presented generally lower percentage of discarded packets/frames than the lowest priority ones).
Considering a target maximum percentage of discarded packets/frames of 10 % for data
applications and between 1 % and 2 % for video applications and a target maximum BR for CS
calls also between 1 % and 2 %, one has observed that the GSM+UMTS Access Technology
Scenario supports up to approximately 500 users, while the GSM+UMTS+HIPERLAN/2 one
supports up to approximately 700 users. Although the difference in amount of supported users
between these two scenarios is not very significant, the achieved mean bitrates per PS application
is much higher for the GSM+UMTS+HIPERLAN/2 scenario, allowing the support of a broader
range of high bitrate services.
From the analysis of the impact of the availability of different access technologies, maintaining
the same User and Applications Scenarios, one has observed that, as expected, better overall

Traffic Analysis at the Radio Interface in Converging Mobile and Wireless Communication Systems
152
performances are achieved when more technologies are available. Considering only the
standalone Access Technology Scenarios (i.e., GSM, UMTS and HIPERLAN/2 scenarios), the
HIPERLAN/2 system obtained the best performance results, due to its much higher capacity.
The results obtained for the cases where more than one access technology was available, show
that, for 700 users (User Scenario that was analysed), the overall performance is approximately
the same (and close to its maximum values) for the cases when HIPERLAN/2 is available. This
is again due to the high capacity of the HIPERLAN/2 system that handles nearly all the PS
traffic, while the other system(s) handle without any blocking the CS calls. Hence, for the
analysed User Scenario, one can conclude that there is no significant benefit of combining the
three systems in relation to the results obtained for the 2 technology scenarios where one system
is HIPERLAN/2. In fact, the standalone HIPERLAN/2 scenario already provides nearly the
same overall performance than the multi-technology scenarios where HIPERLAN/2 is available.
The GSM+UMTS scenario, although with much lower performance than the scenarios with
HIPERLAN/2, presented better results from the point of view of the percentage of discarded
packets/frames, than the standalone UMTS scenario, maintaining similar performances in
relation to the other parameters.
The use of several HIPERLAN/2 APs (more specifically 4, for coverage enhancement) was
initially considered, instead of only one, but all the user traffic (for the User Scenarios considered)
would be perfectly supported (at maximum bitrates) by this system itself due to the high offered
capacity. This would in fact mean that in hot-spots with HIPERLAN/2 coverage (with several
APs), and if all users had convergence capable terminals (supporting HIPERLAN/2
connectivity), the deployment of other systems would not present considerable advantages.
Although HIPERLAN/2 (and other WLAN systems) offers a high capacity on the radio
interface, in a real network deployment one must also take into account the backbone
transmission capacities, which can create a considerable bottleneck on the overall supported
traffic. Summarising, and considering a convergence approach, HIPERLAN/2 (or other WLAN
systems) can be foreseen as optimum candidates for coverage of hot-spot areas (in or even not in
conjunction with 2G and 3G systems), providing high throughputs for the user applications, and
the other systems (GSM/GPRS and UMTS) as the providers of broader coverage and still
supporting all applications (although with less performance in terms of bitrate).
This is not at all a finalised work, mainly due to the complexity of the subject underlying this

Conclusions
153
Thesis. A wide range of issues can be improved, leading to the evaluation in a more realistic and
detailed manner of the possible benefits of convergence of mobile and wireless systems. Some of
these issues are left as suggestions for work continuation:
• implementation of additional access technologies, namely broadcasting systems, in
order to study the convergence benefits of such systems with other cellular
technologies;
• inclusion of propagation aspects into each implemented access technology, allowing
a better and more detailed analysis of convergence between systems, since, based
on the channel conditions between the MTs and the BSs, different technology
routing decisions can be performed (e.g., in response to fast fading);
• in depth analysis of other application scenarios, namely with different traffic
profiles per user type, and their impact in the overall performance of a converged
network;
• enhancement of the session based routing of the current convergence manager
implementation to a packet based routing; this, however, requires a much more
detailed analysis of the protocols, namely for signalling and synchronisation;
• implementation of other convergence perspectives/strategies (i.e., different priority
tables), e.g., different (dynamic or static) priority tables per user type (or even per
user) allowing a more realistic evaluation of a converged network where the user
selects (pre-configures) his priorities based on price, location, type of call (e.g.,
family calls routed with highest quality independent of price);
• improvement of the traffic processing algorithms, namely with the implementation
of the involved protocol stacks and of (new) scheduling and traffic shaping
techniques (namely for packet based routing). In this case, the performance
measures of packet data transmission will also include: average (or total) packet
delay and packet retransmission rate;
• support of different types of MTs (e.g., some with access to one or two types of
access technologies and others with access to all available technologies); this will
also allow a more realistic evaluation of a converged network, since it is expected
that in such networks, only a part of the users (namely in an initial stage) would
have fully convergence capable terminals, while others would continue with their
existing single technology terminals (but still using the same network).

Traffic Analysis at the Radio Interface in Converging Mobile and Wireless Communication Systems
154

Annex 1
155
Annex 1
Validation of Random Number Generators Annex 1 - Validation of Random Number Generators
In the present annex, a simple validation of each implemented RNG is presented, based on a
comparison with the respective theoretical PDFs/PFs.

Traffic Analysis at the Radio Interface in Converging Mobile and Wireless Communication Systems
156
For the implementation of statistical traffic source models, Random Number Generators (RNG)
are essential. In the case of the traffic source models considered in the present report, 10
different RNGs were necessary for their implementation. More specifically, RNGs for the
following statistical distributions were used: Uniform, Gamma, Beta, Exponential, Geometrical,
Normal, LogNormal, Pareto, Poisson and Weibul.
The selected Uniform RNG algorithm is the function “ran1()” presented in [PTVF92], since,
according to the authors, no statistical test is known to fail with it. This function guarantees
uncorrelation between consecutive samples for a number of samples up to 108. The remaining
RNG algorithms are based on transformations of this Uniform RNG.
In the present annex, a simple validation of each implemented RNG is presented, based on:
• a comparison between the theoretical PDFs (for the continuous random variables)
or PFs (for the discrete random variables: Geometric and Poisson) and the
PDF/PF equivalent modified histograms obtained from data generated by the
RNGs (Figures A1.1 to A1.10);
• the calculation of the respective Mean Square Error, MSE (Table A1.1).
For this purpose, a set of data containing a total number of occurrences Noc=5×10⁴ for each
RNG was analysed.
Histograms within an observation window of [xmin, xmax] sub-divided into NI intervals of width I
were built. The PDF/PF equivalent modified histograms, px[n], were obtained normalising the
histograms by Noc and I:
1[ ] [ ], 1, 2, ...,x oc Ioc
p n n n n NN I
= ⋅ =⋅
, (A1.1)
where noc[n] corresponds to the number of occurrences within interval n.
The MSE obtained for the data of each RNG is presented in Table A1.1 and was calculated as:
( )2MSE E [ ] [ ]x n xp x p n = −
(A1.2)
where E[x] is the expected value of x and px[xn] is the discretised theoretical PDF or the
theoretical PF of the statistical distribution under consideration. The xn values of the discretised

Annex 1
157
theoretical PDF correspond to the centre values of each of the NI intervals under consideration.
RNG xmin xmax I MSE
Uniform (min=0, max=1) 0 1 0.01 1.90×10⁻³
Gamma (β=9, λ=100) 0 2500 25 3.58×10⁻¹⁰
Beta (p=1, q=8) 0 1 0.01 1.40×10⁻³
Exponential (1/µCD =3) 0 25 0.25 3.35×10⁻⁶
Geometric (PPC=0.2) 0 35 1 3.84×10⁻⁷
Normal (µN=0, σN=1) -4 4 0.1 3.28×10⁻⁵
LogNormal (µLN=0.97, σLN2=4.38) 0 100 1 1.90×10⁻⁵
Pareto (αp=1.1, k=81.5) 0 1200 10 3.90×10⁻⁸
Poisson (λc=60) 30 90 1 4.16×10⁻⁷
Weibul (λk=0.45, βk=0.80) 0 25 0.25 2.49×10⁻⁴
Table A1.1. Observation parameters and MSE of each RNG.
From the analysis of the graphs, one can conclude that for such a set of data, the PDF/PF
equivalent modified histograms present an acceptable approximation to the respective theoretical
PDFs/PFs. The obtained values for the MSE are reasonably low in comparison to the values
assumed by the theoretical PDFs/PFs. Therefore, one can assume the liability of the above
RNGs for the intended simulation purposes, which encompass the generation of a number of
samples of each statistical distribution in the order of magnitude of 104.

Traffic Analysis at the Radio Interface in Converging Mobile and Wireless Communication Systems
158
0 0.1 0.2 0.3 0.4 0.5 0.6 0.7 0.8 0.9 10
0.2
0.4
0.6
0.8
1
1.2
1.4p(
x)
x
Uniform PDF, pU(x)RNG, px[n]
Figure A1.1. Comparison between the Uniform PDF and the PDF equivalent modified histogram obtained from the
Uniform RNG (min=0, max=1).
0 500 1000 1500 2000 25000
0.5
1
1.5 x 10⁻³
p(x)
x
Gamma PDF, pG(x)RNG, px[n]
Figure A1.2. Comparison between the Gamma PDF and the PDF equivalent modified histogram obtained from the
Gamma RNG (β=9, λ=100).

Annex 1
159
0 0.1 0.2 0.3 0.4 0.5 0.6 0.7 0.8 0.9 10
1
2
3
4
5
6
7
8p(
x)
x
Beta PDF, pB(x)RNG, px[n]
Figure A1.3. Comparison between the Beta PDF and the PDF equivalent modified histogram obtained from the
Beta RNG (p=1, q=8).
0 5 10 15 20 250
0.05
0.1
0.15
0.2
0.25
0.3
0.35
p(x)
x
Exponential PDF, pE(x)RNG, px[n]
Figure A1.4. Comparison between the Exponential PDF and the PDF equivalent modified histogram obtained from
the Exponential RNG (1/µCD =3).

Traffic Analysis at the Radio Interface in Converging Mobile and Wireless Communication Systems
160
0 5 10 15 20 25 30 350
0.02
0.04
0.06
0.08
0.1
0.12
0.14
0.16
0.18
0.2p[
x]
x
Geometric PF, pGe[x]RNG, px[n]
Figure A1.5. Comparison between the Geometric PF and the PF equivalent modified histogram obtained from the
Geometrical RNG (PPC=0.2).
-4 -3 -2 -1 0 1 2 3 40
0.05
0.1
0.15
0.2
0.25
0.3
0.35
0.4
0.45
p(x)
x
Normal PDF, pN(x)RNG, px[n]
Figure A1.6. Comparison between the Normal PF and the PF equivalent modified histogram obtained from the
Normal RNG (µN=0, σN=1).

Annex 1
161
0 10 20 30 40 50 60 70 80 90 1000
0.05
0.1
0.15
0.2
0.25
0.3
0.35p(
x)
x
Lognormal PDF, pLN(x)RNG, px[n]
Figure A1.7. Comparison between the Lognormal PDF and the PDF equivalent modified histogram obtained from
the Lognormal RNG (µLN=0.97, σLN2=4.38).
0 200 400 600 800 1000 12000
0.002
0.004
0.006
0.008
0.01
0.012
0.014
p(x)
x
Pareto PDF, pP(x)RNG, px[n]
Figure A1.8. Comparison between the Pareto PDF and the PDF equivalent modified histogram obtained from the
Pareto RNG (αp=1.1, k=81.5).

Traffic Analysis at the Radio Interface in Converging Mobile and Wireless Communication Systems
162
20 30 40 50 60 70 80 90 1000
0.01
0.02
0.03
0.04
0.05
0.06p[
x]
x
Poisson PF, pPo[x,t]RNG, px[n]
Figure A1.9. Comparison between the Poisson PF and the PF equivalent modified histogram obtained from the
Poisson RNG (λc=60).
0 5 10 15 20 250
0.1
0.2
0.3
0.4
0.5
0.6
0.7
p(x)
x
Weibul PDF, pW(x)RNG, px[n]
Figure A1.10. Comparison between the Weibul PDF and the PDF equivalent modified histogram obtained from the
Weibul RNG (λk=0.45, βk=0.80).

Annex 2
163
Annex 2
User Scenarios Variation Results Annex 2 - User Scenarios Variation Results
This annex presents results for the main performance indicators (BR, Discarded Packets/Frames
and Mean Bitrate) as a function of the User Scenarios (i.e., of the number of users), for five
different Access Technology Scenarios (G, U, H, G+H and U+H). These results are a
complement to those presented in Section 5.3 and were also obtained from single simulation
runs.

Traffic Analysis at the Radio Interface in Converging Mobile and Wireless Communication Systems
164
100 200 300 400 500 600 700 800 900 10000
2
4
6
8
10
12
14
16
18
20
Number of Users
Call
Bloc
king
Rat
e, R CB
[%]
Voice CallVideo Call
Figure A2.1. BR versus User Scenario (G).
100 200 300 400 500 600 700 800 900 10000
5
10
15
20
25
30
35
40
Number of Users
Disc
arde
d Pa
cket
s/Fr
ames
, ηD
[%]
Video Call (Video)Video on DemandWWWFTPEmail
Figure A2.2. Discarded Packets/Frames versus User Scenario (G).

Annex 2
165
100 200 300 400 500 600 700 800 900 10000
10
20
30
40
50
60
Number of Users
Mea
n Bi
trate
, Rb [k
bps]
Video Call (Video)Video on DemandWWWFTPEmail
Figure A2.3. Mean Bitrate versus User Scenario (G).
100 200 300 400 500 600 700 800 900 10000
1
2
3
4
5
6
7
8
9
10
Number of Users
Call
Bloc
king
Rat
e, R CB
[%]
Voice CallVideo Call
Figure A2.4. BR versus User Scenario (U).

Traffic Analysis at the Radio Interface in Converging Mobile and Wireless Communication Systems
166
100 200 300 400 500 600 700 800 900 10000
10
20
30
40
50
60
Number of Users
Disc
arde
d Pa
cket
s/Fr
ames
, ηD
[%]
Video Call (Video)Video on DemandWWWFTPEmail
Figure A2.5. Discarded Packets/Frames versus User Scenario (U).
100 200 300 400 500 600 700 800 900 10000
50
100
150
200
250
300
350
400
450
Number of Users
Mea
n Bi
trate
, Rb [k
bps]
Video Call (Video)Video on DemandWWWFTPEmail
Figure A2.6. Mean Bitrate versus User Scenario (U).

Annex 2
167
100 200 300 400 500 600 700 800 900 10000
2
4
6
8
10
12
14
Number of Users
Disc
arde
d Pa
cket
s/Fr
ames
, ηD
[%]
Voice Call (VoIP)Video Call (VoIP)Video Call (Video)Video on DemandWWWFTPEmail
Figure A2.7. Discarded Packets/Frames versus User Scenario (H).
100 200 300 400 500 600 700 800 900 10000
200
400
600
800
1000
1200
1400
1600
1800
2000
Number of Users
Mea
n Bi
trate
, Rb [k
bps]
Video Call (Video)Video on DemandWWWFTPEmail
Figure A2.8. Mean Bitrate versus User Scenario (H).

Traffic Analysis at the Radio Interface in Converging Mobile and Wireless Communication Systems
168
100 200 300 400 500 600 700 800 900 10000
0.1
0.2
0.3
0.4
0.5
0.6
0.7
0.8
Number of Users
Call
Bloc
king
Rat
e, R CB
[%]
Voice CallVideo Call
Figure A2.9. BR versus User Scenario (G+H).
100 200 300 400 500 600 700 800 900 10000
2
4
6
8
10
12
14
Number of Users
Disc
arde
d Pa
cket
s/Fr
ames
, ηD
[%]
Voice Call (VoIP)Video Call (VoIP)Video Call (Video)Video on DemandWWWFTPEmail
Figure A2.10. Discarded Packets/Frames versus User Scenario (G+H).

Annex 2
169
100 200 300 400 500 600 700 800 900 10000
200
400
600
800
1000
1200
1400
1600
1800
2000
Number of Users
Mea
n Bi
trate
, Rb [k
bps]
Video Call (Video)Video on DemandWWWFTPEmail
Figure A2.11. Mean Bitrate versus User Scenario (G+H).
100 200 300 400 500 600 700 800 900 10000
0.05
0.1
0.15
0.2
0.25
0.3
0.35
0.4
0.45
Number of Users
Call
Bloc
king
Rat
e, R CB
[%]
Voice CallVideo Call
Figure A2.12. BR versus User Scenario (U+H).

Traffic Analysis at the Radio Interface in Converging Mobile and Wireless Communication Systems
170
100 200 300 400 500 600 700 800 900 10000
2
4
6
8
10
12
14
16
Number of Users
Disc
arde
d Pa
cket
s/Fr
ames
, ηD
[%]
Voice Call (VoIP)Video Call (VoIP)Video Call (Video)Video on DemandWWWFTPEmail
Figure A2.13. Discarded Packets/Frames versus User Scenario (U+H).
100 200 300 400 500 600 700 800 900 10000
200
400
600
800
1000
1200
1400
1600
1800
2000
Number of Users
Mea
n Bi
trate
, Rb [k
bps]
Video Call (Video)Video on DemandWWWFTPEmail
Figure A2.14. Mean Bitrate versus User Scenario (U+H).

Annex 3
171
Annex 3
Access Technology Scenarios Variation Results Annex 3 - Access Technology Scenarios Variation Results
This annex presents results for the main performance indicators (BR, Discarded Packets/Frames
and Mean Bitrate) as a function of the Access Technology Scenarios (i.e., of the available access
technologies), for five different User Scenarios (500, 600, 800, 900 and 1 000 users). These results
are a complement to those presented in Section 5.4 and were also obtained from single
simulation runs. For each User Scenario, the results are obtained maintaining the same
Applications Scenario instance (i.e., the same UTVs).

Traffic Analysis at the Radio Interface in Converging Mobile and Wireless Communication Systems
172
G U H G+U G+H U+H G+U+H0
1
2
3
4
5
6
Access Technology Scenario
Call
Bloc
king
Rat
e, R CB
[%]
Voice CallVideo Call
Figure A3.1. BR versus Access Technology Scenario (500 users).
G U H G+U G+H U+H G+U+H0
5
10
15
20
25
30
35
Access Technology Scenario
Disc
arde
d Pa
cket
s, η D
[%]
Voice Call (VoIP)Video Call (VoIP)Video Call (Video)Video on DemandWWWFTPEmail
Figure A3.2. Discarded Packets/Frames versus Access Technology Scenario (500 users).

Annex 3
173
G U H G+U G+H U+H G+U+H0
200
400
600
800
1000
1200
1400
1600
1800
2000
Access Technology Scenario
Mea
n Bi
trate
, Rb [k
bps]
Video Call (Video)Video on DemandWWWFTPEmail
Figure A3.3. Mean Bitrate versus Access Technology Scenario (500 users).
G U H G+U G+H U+H G+U+H0
1
2
3
4
5
6
Access Technology Scenario
Call
Bloc
king
Rat
e, R CB
[%]
Voice CallVideo Call
Figure A3.4. BR versus Access Technology Scenario (600 users).

Traffic Analysis at the Radio Interface in Converging Mobile and Wireless Communication Systems
174
G U H G+U G+H U+H G+U+H0
5
10
15
20
25
30
35
Access Technology Scenario
Disc
arde
d Pa
cket
s, η D
[%]
Voice Call (VoIP)Video Call (VoIP)Video Call (Video)Video on DemandWWWFTPEmail
Figure A3.5. Discarded Packets/Frames versus Access Technology Scenario (600 users).
G U H G+U G+H U+H G+U+H0
200
400
600
800
1000
1200
1400
1600
1800
2000
Access Technology Scenario
Mea
n Bi
trate
, Rb [k
bps]
Video Call (Video)Video on DemandWWWFTPEmail
Figure A3.6. Mean Bitrate versus Access Technology Scenario (600 users).

Annex 3
175
G U H G+U G+H U+H G+U+H0
2
4
6
8
10
12
Access Technology Scenario
Call
Bloc
king
Rat
e, R CB
[%]
Voice CallVideo Call
Figure A3.7. BR versus Access Technology Scenario (800 users).
G U H G+U G+H U+H G+U+H0
5
10
15
20
25
30
35
40
45
50
Access Technology Scenario
Disc
arde
d Pa
cket
s, η D
[%]
Voice Call (VoIP)Video Call (VoIP)Video Call (Video)Video on DemandWWWFTPEmail
Figure A3.8. Discarded Packets/Frames versus Access Technology Scenario (800 users).

Traffic Analysis at the Radio Interface in Converging Mobile and Wireless Communication Systems
176
G U H G+U G+H U+H G+U+H0
200
400
600
800
1000
1200
1400
1600
1800
Access Technology Scenario
Mea
n Bi
trate
, Rb [k
bps]
Video Call (Video)Video on DemandWWWFTPEmail
Figure A3.9. Mean Bitrate versus Access Technology Scenario (800 users).
G U H G+U G+H U+H G+U+H0
2
4
6
8
10
12
14
16
18
Access Technology Scenario
Call
Bloc
king
Rat
e, R CB
[%]
Voice CallVideo Call
Figure A3.10. BR versus Access Technology Scenario (900 users).

Annex 3
177
G U H G+U G+H U+H G+U+H0
10
20
30
40
50
60
Access Technology Scenario
Disc
arde
d Pa
cket
s, η D
[%]
Voice Call (VoIP)Video Call (VoIP)Video Call (Video)Video on DemandWWWFTPEmail
Figure A3.11. Discarded Packets/Frames versus Access Technology Scenario (900 users).
G U H G+U G+H U+H G+U+H0
200
400
600
800
1000
1200
1400
1600
1800
Access Technology Scenario
Mea
n Bi
trate
, Rb [k
bps]
Video Call (Video)Video on DemandWWWFTPEmail
Figure A3.12. Mean Bitrate versus Access Technology Scenario (900 users).

Traffic Analysis at the Radio Interface in Converging Mobile and Wireless Communication Systems
178
G U H G+U G+H U+H G+U+H0
2
4
6
8
10
12
14
16
18
Access Technology Scenario
Call
Bloc
king
Rat
e, R CB
[%]
Voice CallVideo Call
Figure A3.13. BR versus Access Technology Scenario (1 000 users).
G U H G+U G+H U+H G+U+H0
10
20
30
40
50
60
Access Technology Scenario
Disc
arde
d Pa
cket
s, η D
[%]
Voice Call (VoIP)Video Call (VoIP)Video Call (Video)Video on DemandWWWFTPEmail
Figure A3.14. Discarded Packets/Frames versus Access Technology Scenario (1 000 users).

Annex 3
179
G U H G+U G+H U+H G+U+H0
200
400
600
800
1000
1200
1400
1600
Access Technology Scenario
Mea
n Bi
trate
, Rb [k
bps]
Video Call (Video)Video on DemandWWWFTPEmail
Figure A3.15. Mean Bitrate versus Access Technology Scenario (1 000 users).

Traffic Analysis at the Radio Interface in Converging Mobile and Wireless Communication Systems
180

References
181
References
References [3GPP01a] 3GPP, Digital cellular telecommunications system (Phase 2+); Physical layer on the radio path;
General description (Release 1999), TSG GERAN Technical Specification, No. 05.01,
Ver. 8.6.0, Nov. 2001 (http://www.3gpp.org).
[3GPP01b] 3GPP, Packet switched conversational multimedia applications; Default codecs (Release 5), TSG
SSA Technical Specification, No. 26.235, Ver. 5.0.0, June 2001
(http://www.3gpp.org).
[3GPP01c] 3GPP, Service aspects; Services and Service Capabilities (Release 5), TSG SSA Technical
Specification, No. 22.105, Ver. 5.0.0, Oct. 2001 (http://www.3gpp.org).
[3GPP02a] 3GPP, Radio Access Network; GPRS; Overall description of the GPRS radio interface; Stage 2
(Release 1999), TSG GSM/EDGE Technical Specification, No. 03.64, Ver. 8.10.0,
Feb. 2002 (http://www.3gpp.org).
[3GPP02b] 3GPP, Radio Access Network; Radio transmission and reception (Release 1999), TSG
GSM/EDGE Technical Specification, No. 05.05, Ver. 8.12.0, Apr. 2002
(http://www.3gpp.org).
[3GPP02c] 3GPP, Transparent end-to-end packet switched streaming service (PSS); Protocols and codecs
(Release 4), TSG SSA Technical Specification, No. 26.234, Ver. 4.3.0, Mar. 2002
(http://www.3gpp.org).
[3GPP02d] 3GPP, QoS concept and architecture (Release 5), TSG SSA Technical Specification, No.
23.107 V5.4.0, Mar. 2002 (http://www.3gpp.org).
[3GPP03] 3GPP (http://www.3gpp.org).
[4GMF03] 4th Generation Mobile Forum (http://www.4gmf.org).

Traffic Analysis at the Radio Interface in Converging Mobile and Wireless Communication Systems
182
[ACGN02] Aguiar,J.(ed), Correia,L.M., Gil,J., Noll,J., Karlsen,M.E., Svaet,S., Mousley,T.,
Hunt,B., Raynes,D., Lehmann,G., Müller,R., Hofstetter,H., Tröger,H. and Burr,A.,
Definition of Scenarios, IST-FLOWS Project, Public Deliverable D1, European
Commission, IST Office, Brussels, Belgium, Apr. 2002.
[ANWI03] IST-ANWIRE Project (http://www.anwire.org).
[BeVE99] Bettstetter,C., Vogel,H. and Eberspächer,J., “GSM Phase 2+ General Packet Radio
Service GPRS: Architecture, Protocols and Air Interface”, IEEE Communications
Surveys, Vol. 2, No. 3, 3rd Quarter 1999, pp. 2-14.
[BRAI03] IST-BRAIN Project (http://www.ist-brain.org).
[BRAN03] ETSI BRAN (http://portal.etsi.org/bran).
[CELL03] Cellular Online (http://www.cellular.co.za).
[ChRe99] Chandra,K. and Reibman,A.R., “Modeling One- and Two-Layer Variable Bit Rate
Video”, IEEE/ACM Transactions on Networking, Vol. 7, No. 3, June 1999, pp. 398-
413.
[CISC03] Cisco Systems (http://www.cisco.com).
[CISM03] IST-CISMUNDUS Project (http://www.brunel.ac.uk/project/Cismundus).
[DiLS01] Dillinger,M., Luo,J. and Schulz,E., “Radio Resource Scheduling Algorithms for
Mixed VoIP and HTTP Traffic in HIPERLAN/2 System”, in Proc. of IST Mobile
Communications Summit, Sitges, Spain, Sep. 2001.
[DRIV03] IST-DRiVE Project (http://www.ist-drive.org).
[DVBP03] Digital Video Broadcasting Project (http://www.dvb.org).
[ETSI00a] ETSI, HIPERLAN Type 2; System Overview, Broadband Radio Access Networks
(BRAN) Technical Report, No. TR 101.683, Ver. 1.1.1., France, Feb. 2000
(http://www.etsi.org).
[ETSI00b] ETSI, HIPERLAN Type 2; Data Link Control (DLC) Layer Part 1:Basic Data Transport

References
183
Functions, Broadband Radio Access Networks (BRAN) Technical Standard, No. TS
101.761-1, Ver. 1.1.1., France, Apr. 2000 (http://www.etsi.org).
[ETSI01] ETSI, HIPERLAN Type 2; Physical (PHY) layer, Broadband Radio Access Networks
(BRAN) Technical Standard, No. TS 101.475, Ver. 1.3.1., France, Dec. 2001
(http://www.etsi.org).
[ETSI98] ETSI, Universal Mobile Telecommunications System (UMTS); Selection procedures for the choice
of radio transmission technologies of the UMTS (UMTS 30.03 version 3.2.0), Technical
Report, No. TR 101 112, Ver. 3.2.0 , France, Apr. 1998 (http://www.etsi.org).
[EURE00] EURESCOM P921, UMTS radio access, D2: Guidelines For UMTS Radio Access Network
Design, Germany, Oct. 2000 (http://www.eurescom.de/public/projects/p900-
series/P921/).
[FäBC98] Färber,J., Bodamer,S. and Charzinski,J., Measurement and modelling of Internet traffic at
access networks, COST-257 Technical Report, No. 43, 1998.
[FCXV03] Ferreira,L. (ed.), Correia,L., Xavier,D., Vasconcelos,A. and Fledderus,E., Final report
on traffic estimation and services characterisation, IST-MOMENTUM Project, Public
Deliverable D1.4, European Commission, IST Office, Brussels, Belgium, May 2003.
[FiRe01] Fitzek,F.H.P. and Reisslein,M., “MPEG-4 and H.263 Video Traces for Network
Performance Evaluation”, IEEE Network, Vol. 15, No. 6, Nov./Dec. 2001, pp. 40-
54.
[FLOW03] IST-FLOWS Project (http://www.flows-ist.org).
[FrMe94] Frost,V.S. and Melamed,B., “Traffic Modeling for Telecommunications Networks”,
IEEE Communications Magazine, Vol. 34, No.3, Mar. 1994, pp. 70-81.
[FrNg00] Frey,M. and Nguyen-Quang,S., “A Gamma-Based Framework for Modeling
Variable-Rate MPEG Video Sources: The GOP GBAR Model”, IEEE/ACM
Transactions on Networking, Vol. 8, No. 6, Dec. 2000, pp. 710-719.
[HaCS01] Hanzo,L., Cherriman,J., and Streit,J., Wireless Video Communications, IEEE Press, New
York, New York, USA, 2001.

Traffic Analysis at the Radio Interface in Converging Mobile and Wireless Communication Systems
184
[Heym97] Heyman,D., “The GBAR Source Model for VBR Videoconferences”, IEEE/ACM
Transactions on Networking, Vol. 5, No. 4, Aug. 1997, pp. 554-560.
[HoTo00] Holma,H. and Toskala,A. (eds.), WCDMA for UMTS, John Wiley & Sons,
Chichester, UK, 2000.
[ILDK96] Ismail,M.R., Lambadaris,I., Devetsikiotis,M. and Kaye,A.R., “Simulation and
Modeling of Variable Bit Rate MPEG Video Transmission over ATM Networks”,
International Journal of Communication Systems, Vol. 9, 1996, pp. 283-297.
[IPUN03] ipUnplugged (http://www.ipunplugged.com).
[ITUT93] ITU-T, B-ISDN Services Aspects, ITU-T Recommendation I.211, Geneva, Switzerland,
Mar. 1993.
[IzRe99] Izquierdo,M.R. and Reeves,D.S., “A survey of statistical source models for variable-
bit-rate compressed video”, Multimedia Systems, Vol. 7, No.3, 1999, pp. 199-213.
[JeJe01] Jeon,W.S. and Jeong,D.G., “Call Admission Control for Mobile Multimedia
Communications with Traffic Asymmetry between Uplink and Downlink”, IEEE
Transactions on Vehicular Technology, Vol. 50, No. 1, Jan. 2001, pp. 59-66.
[John99] Johnsson,M., HiperLAN/2 – The Broadband Radio Transmission Technology Operating in
the 5 GHz Frequency Band, White Paper, Version 1.0, HiperLAN/2 Global Forum,
1999 (http://www.hiperlan.com).
[KlLL01] Klemm,A., Lindemann,C. and Lohmann,M., “Traffic Modeling and Characterization
for UMTS Networks”, in Proc. of GLOBECOM'01 - IEEE Global Telecommunications
Conference, San Antonio, Texas, USA, Nov. 2001.
[KMST00] Khun-Jush,J., Malmgren,G., Schramm,P. and Torsner,J., “HIPERLAN type 2 for
broadband wireless communication”, Ericsson Review, No. 2, 2000.
[KoPP01a] Koutsakis,P., Paterakis,M. and Psychis,S., “Integrating voice, video and bursty data
packet traffic over burst-error wireless TDMA channels with adjustable request
bandwidth”, in Proc. of PIMRC’2001 - 12th IEEE International Symposium on Personal,
Indoor and Mobile Radio Communications, San Diego, California, USA, Oct. 2001.

References
185
[KoPP01b] Koutsakis,P., Psychis,S. and Paterakis,M., “On the integration of MPEG-4 Video
Streams with Voice and E-mail Data Packet Traffic over Wireless Picocellular
Networks”, in Proc. of PIMRC’2001 - 12th IEEE International Symposium on Personal,
Indoor and Mobile Radio Communications, San Diego, California, USA, Oct. 2001.
[KrSa01] Kristensen,F. and Sandgren,M., A system simulation of wireless local area networks operating
in the 5 GHz band, Masters Thesis, Telia Research, Malmo, Sweden, Aug. 2001
(http://www.hiperlan.com).
[KrTr97] Krunz,M. and Tripathi,S.K., “On the characterization of VBR MPEG streams”, in
Proc. of . SIGMETRICS’97 - ACM International Conference on Measurement and Modeling of
Computer Systems, Seattle, Washington, USA, June 1997.
[Kwok95] Kwok,T.C., “A Vision for Residential Broadband Services: ATM-to-the-Home”,
IEEE Network, Vol. 9, No. 5, Sep./Oct. 1995, pp. 14-28.
[LaGD00] Lazaro,O., Girma,D. and Dunlop,J., “Statistical analysis and evaluation of modelling
techniques for self-similar video source traffic”, in Proc. of PIMRC’2000 - 11th IEEE
International Symposium on Personal, Indoor and Mobile Radio Communications, London, UK,
Sep. 2000.
[LaOR98] Lakshman,T.V., Ortega,A. and Reibman,A.R., “VBR Video: Tradeoffs and
Potentials”, Proceedings of the IEEE, Vol. 86, No. 5, May 1998, pp. 952-973.
[Mand01] Mandato,D. Concepts for Service adaptation, scalability and QoS handling on mobility enabled
networks, IST-BRAIN Project, Deliverable 1.2, European Commission, IST Office,
Brussels, Belgium, Mar. 2001.
[MASK88] Maglaris,B., Anastassiou,D., Sen,.P., Karlsson,G. and Robbins,J.D., “Performance
Models of Statistical Multiplexing in Packet Video Communications”, IEEE
Transactions on Communications, Vol. 36, No. 7, July 1988, pp. 834-843.
[MIND03] IST-MIND Project (http://www.ist-mind.org).
[MOBI03] IST-MOBIVAS Project (http://mobivas.cnl.di.uoa.gr).
[MOBY03] IST-MOBYDICK Project (http://www.ist-mobydick.org).

Traffic Analysis at the Radio Interface in Converging Mobile and Wireless Communication Systems
186
[MWIF01] MWIF, IP in the RAN as a Transport Option in 3rd Generation Mobil Systems, MWIF
Technical Report, WG4 – IP in the RAN, No. MTR-006, Ver. 2.0.0, June 2001
(http://www.mwif.org).
[NaGT91] Nanda,S., Goodman,D.J. and Timor,U., “Performance of PRMA: A Packet Voice
Protocol for Cellular Systems”, IEEE Transactions on Vehicular Technology, Vol. 40, No.
3, Aug. 1991, pp. 584-598.
[NOKI03] Nokia (http://www.nokia.com).
[NOMA03] Nomadix (http://www.nomadix.com).
[NyJO01] Nyberg,H., Johansson,C. and Olin,B., “A streaming Video Traffic Model for the
Mobile Access Network”, in Proc. of VTC’2001 - IEEE 54th Vehicular Technology
Conference, Atlantic City, New Jersey, USA, Oct. 2001.
[OVER03] IST-OverDRiVE Project (http://www.ist-overdrive.org).
[PCMF99] Priscolli.F.D., Conforto.P., Marziale.V., Ferrari.G., Moretti,L., Barbieri,M., Ghaheri-
Niri,S., Kadelka,A., Dinis,M., Macedo,E. and Davies,R., Target and Trial System Service,
Mobility and Coverage Requirements, ACTS-ACCORD Project, Deliverable AC318-UK-
DIS-022, Part I-b1, European Commission, ACTS Central Office, Brussels, Belgium,
1999.
[PTVF92] Press,W.H., Teukolsky,S.A., Vetterling,W.T., and Flannery,B.P., Numerical Recipes in
C: The Art of Scientific Computing, Cambridge University Press, Cambridge, UK, 1992.
[RaMe01] Rábanos,J. and Mesquida,C., Mobile Communications of Third Generation (in Spanish),
Telefónica Móviles España, Madrid, Spain, 2001.
[Ross87] Ross,S.M., Introduction to Probability and Statistics for Engineers and Scientists, John Wiley &
Sons, New York, New York, USA, 1987.
[SB3G01] IST Project Cluster “Systems beyond 3G”, A Vision on Systems beyond 3G - Release
2001, European Commission, IST Office, Brussels, Belgium, Feb. 2001
(http://www.cordis.lu/ist/ka4/mobile/proclu/c/beyond3g.htm).
[SCOU03] IST-SCOUT Project (http://www.ist-scout.org).

References
187
[ShRJ02] Shankaranarayanan,N.K., Rastogi, A. and Jiang,Z., “Performance of a wireless data
network with mixed interactive user workloads”, in Proc. of ICC’2002 - IEEE
International Conference on Communications, New York, New York, USA, Apr./May 2002.
[SPWW02] Stewart,J.(ed.), Pitt,L., Winskel,M., Williams,R., Graham,I., Aguiar,J., Correia,L.M.,
Hunt,B., Moulsley,T., Paint,F., Svaet,S., Bauling,M., Burr,A., Eskedal,T., Yin,V. and
Stimming,C., FLOWS Scenarios and Definition of Services, IST-FLOWS Project, Public
Deliverable D6, European Commission, IST Office, Brussels, Belgium, Dec. 2002.
[SUIT03] IST-SUITED Project (http://www.ist-suited.com).
[TEXA03] Texas Instruments (http://www.ti.com).
[TRUS03] IST-TRUST Project (http://www.ist-trust.org).
[UMTS01] UMTS Forum, The UMTS Third Generation Market – Phase II: Structuring the Service
Revenue Opportunities, Report No.13, London, UK, Apr. 2001.
[VaRF99] Valkó,A.G., Rácz,A. and Fodor,G., “Voice QoS in Third-Generation Mobile
Systems”, IEEE Journal on Selected Areas in Communications, Vol. 17, No. 1, Jan. 1999,
pp. 109-123.
[Vica97] Vicari,N., Measurement and Modeling of WWW-Sessions, COST-257 Technical Report,
No. 52, 1997.
[Vlah01] Vlahodimitropoulos,K.(ed.), Requirements Analysis and Functional Specifications, IST-
CAUTION Project, Deliverable D-2.1, European Commission, IST Office, Brussels,
Belgium, July 2001.
[VLLX02] Vriendt,J., Lainé,P., Lerouge,C. and Xu,X., “Mobile Network Evolution: A
Revolution on the Move”, IEEE Communications Magazine, Vol. 40, No. 4, Apr. 2002,
pp. 104-111.
[Walk00] Walke,B.H., Mobile Radio Networks, Networking and Protocols, John Wiley & Sons,
Chichester, UK, 2000.
[WINE03] IST-WINEGLASS Project (http://domobili.cselt.it/WineGlass).

Traffic Analysis at the Radio Interface in Converging Mobile and Wireless Communication Systems
188
[WSI03] IST-WSI Project (http://www.ist-wsi.org).
[Yaco02] Yacoub,M.D., Wireless Technology, Protocols, Standards, and Techniques, CRC Press, Boca
Raton, Florida, USA, 2002.
[Yaco93] Yacoub,M.D., Foundations of Mobile Radio Engineering, CRC Press, Florida, Boca Raton,
Florida, USA, 1993.
[ZSMH00] Zurbes,S., Stahl, W., Matheus,K. and Haartsen,J., “Radio network performance of
Bluetooth”, in Proc. of ICC’2000 - IEEE International Conference on Communications, New
Orleans, Louisiana, USA, June 2000.