Embed Size (px)
Citation preview

T E C H N I C A L R E P O R T 0 6 4
2 0
Ministry of Forests and Range Forest Science Program
Group Selection Silvicultural Systems for High-elevation Forests (ESSFwc3) to Maintain Caribou Habitat in the Cariboo RegionMount Tom Adaptive Management TrialEstablishment Report
064
The Best Place on Earth

Ministry of Forests and RangeForest Science Program
Group Selection Silvicultural Systems for High-elevation Forests (ESSFwc3) to Maintain Caribou Habitat in the Cariboo RegionMount Tom Adaptive Management TrialEstablishment Report
Michaela J. Waterhouse (Editor)
The Best Place on Earth

The use of trade, firm, or corporation names in this publication is for the information and convenience of the reader. Such use does not constitute an official endorsement or approval by the Government of British Columbia of any product or service to the exclusion of any others that may also be suitable. Contents of this report are presented for discussion purposes only. Funding assistance does not imply endorsement of any statements or information contained herein by the Government of British Columbia. Uniform Resource Locators (urls), addresses, and contact information contained in this document are current at the time of printing unless otherwise noted.
Citation Waterhouse, M. J. (editor). 20. Group selection silvicultural systems for high-elevation forests (ESSFwc3) to maintain caribou habitat in the Cariboo Region: Mount Tom adaptive management trial establishment report. B.C. Min. For. Range, Res. Br., Victoria, B.C. Tech. Rep. 064. www.for.gov.bc.ca/hfd/pubs/Docs/Tr/Tr064.htm
Prepared byMichaela J. WaterhouseB.C. Ministry of Forests and RangeForest SciencesSuite 200, 640 Borland StreetWilliams Lake, BC V2G 4T
Library and Archives Canada Cataloguing in Publication Data
Waterhouse, Michaela J Group selection silvicultural systems for high elevation forests (Essfwc3) to maintain caribou habitat in the Cariboo Region : Mount Tom adaptative management trial establishment report / [by Michaela J. Waterhouse (editor)]
(Technical report ; 064)Includes bibliographical references.ISBN 978-0-7726-6482-2 (print version)ISBN 978-0-7726-6484-6 (PDF)
. Caribou--Habitat--British Columbia--Quesnel Highland. 2. Caribou--Food--British Columbia--Quesnel Highland. 3. Forest management--Environmental aspects--British Columbia--Quesnel Highland. 4. Lichens-- Effect of logging on--British Columbia--Quesnel Highland. I. British Columbia. Forest Science Program II. Title. III. Series: Technical report (British Columbia. Forest Science Program) 064
SD392 W38 20 639.97’965809775 C20-909027-9
Copies of this report may be obtained from:Crown Publications, Queen’s PrinterPO Box 9452 Stn Prov GovtVictoria, BC v8w 9v7-800-663-605www.crownpub.bc.ca
For more information on Forest Science Program publications, visit our web site at: www.for.gov.bc.ca/scripts/hfd/pubs/hfdcatalog/index.asp
© 20 Province of British Columbia
When using information from this or any Forest Science Program report, please cite fully and correctly.

ABSTRACT
The Mount Tom adaptive management trial was initiated in 999 on 4067 hectares in mountain caribou (Rangifer tarandus caribou) winter habitat in east-central British Columbia. It builds on and expands knowledge gained from the Quesnel Highland Alternative Silvicultural Systems trial, set up fur-ther to the south in 990, to explore options to maintain caribou habitat while allowing for some forest harvesting. The principal objective of the Mount Tom adaptive management trial is to examine the effects of applying group selection silvicultural systems and more specific treatments (e.g., open-ing size and site preparation), in a range of ecological and geographical contexts, at the operational level. The following topics are part of the trial: ar-boreal lichen abundance and species composition, stand development, stand stability, regeneration, understorey vegetation, snow accumulation and melt, microclimate, and operational harvesting. The size of the eight cutblocks (> 00 ha each) enables the forest company overseeing the project to realize economies of scale regarding layout, harvesting, and transportation, plus pro-viding an opportunity to test different types of equipment. When the Mount Tom trial is fully developed, the treated and no-harvest control areas will be extensive enough to directly measure caribou use. The trial also provides an opportunity for other researchers to work on the site and for extension activi-ties. The purpose of this establishment report is to document information about the study area, layout, and methods associated with the individual studies embedded in this long-term, complex trial.
iii

iv
ACKNOWLEDGEMENTS
The Mount Tom trial is a co-operative trial partnered between researchers and habitat biologists from the Ministry of Forests, Lands and Natural Re-source Operations – Cariboo Region (Williams Lake) working in partnership with staff of West Fraser Mills Ltd. (Quesnel Divison), BC Timber Sales (BCTS), and the Quesnel Forest District. Particular thanks to Greg Scott, Larry Gardner, Rob Sandberg, Mike Pelchat, Allan Johnsrude, and John Youds for implementing the project on the ground and providing valuable input.
Harold Armleder was instrumental in designing the project, providing input to the harvesting, and extending the project. The planted stock, vegeta-tion, and microclimate studies were designed and implemented by Teresa Newsome. Similarly, Michaela Waterhouse was responsible for the lichen and stand stability projects. Pat Teti undertook the hydrological studies. Ray Coupé and Ordell Steen helped extensively with the eco-classification and stand structure assessment. Jean Heineman and Skye Dunbar made signifi-cant contributions to preparation of this report. Bob Sagar installed the climate stations, then collected and analyzed the data over the years. Co-op student Celina Gabriel did an excellent job preparing the stand structure data report.
Thanks to the many students and contractors, especially Scott Trusler, Janet Marsh, Scott Zimonick, and Janet Zimonick, who have collected data for much of the project.
Funding was provided by the Ministry of Forests and Range – FIA Land-base program via West Fraser Mills Ltd. and the Ministry of Forests and Range Forest Science Program.

TABLE OF CONTENTS
v
Abstract . . . . . . . . . . . . . . . . . . . . . . . . . . . . . . . . . . . . . . . . . . . . . . . . . . . . . . . . iiiAcknowledgements . . . . . . . . . . . . . . . . . . . . . . . . . . . . . . . . . . . . . . . . . . . . . . iv Introduction . . . . . . . . . . . . . . . . . . . . . . . . . . . . . . . . . . . . . . . . . . . . . . . . . . 2 Study Area . . . . . . . . . . . . . . . . . . . . . . . . . . . . . . . . . . . . . . . . . . . . . . . . . . . 3
2. Site and Block Descriptions . . . . . . . . . . . . . . . . . . . . . . . . . . . . . . . . . 32.2 Ecological Classification . . . . . . . . . . . . . . . . . . . . . . . . . . . . . . . . . . . 5
3 Treatments . . . . . . . . . . . . . . . . . . . . . . . . . . . . . . . . . . . . . . . . . . . . . . . . . . . . . . . . . . . . . . 73. Harvest and Control Treatments . . . . . . . . . . . . . . . . . . . . . . . . . . . . 73.2 Site Preparation . . . . . . . . . . . . . . . . . . . . . . . . . . . . . . . . . . . . . . . . . . . 93.3 Opening Sizes . . . . . . . . . . . . . . . . . . . . . . . . . . . . . . . . . . . . . . . . . . . .
4 Experimental Projects . . . . . . . . . . . . . . . . . . . . . . . . . . . . . . . . . . . . . . . . . 24. Lichen Abundance, Stand Structure, Small Tree, and
Coarse Woody Debris . . . . . . . . . . . . . . . . . . . . . . . . . . . . . . . . . . . . . 24.. Objectives . . . . . . . . . . . . . . . . . . . . . . . . . . . . . . . . . . . . . . . . . . . 24..2 Layout . . . . . . . . . . . . . . . . . . . . . . . . . . . . . . . . . . . . . . . . . . . . . . 24..3 Data collection methods . . . . . . . . . . . . . . . . . . . . . . . . . . . . . . 44..4 Data analysis . . . . . . . . . . . . . . . . . . . . . . . . . . . . . . . . . . . . . . . . 9
4.2 Stand Stability . . . . . . . . . . . . . . . . . . . . . . . . . . . . . . . . . . . . . . . . . . . . 204.2. Objectives . . . . . . . . . . . . . . . . . . . . . . . . . . . . . . . . . . . . . . . . . . . 204.2.2 Layout . . . . . . . . . . . . . . . . . . . . . . . . . . . . . . . . . . . . . . . . . . . . . . 204.2.3 Data collection methods . . . . . . . . . . . . . . . . . . . . . . . . . . . . . . 204.2.4 Data analysis . . . . . . . . . . . . . . . . . . . . . . . . . . . . . . . . . . . . . . . . 2
4.3 Planted and Natural Regeneration . . . . . . . . . . . . . . . . . . . . . . . . . . . 224.3. Objectives . . . . . . . . . . . . . . . . . . . . . . . . . . . . . . . . . . . . . . . . . . . 224.3.2 Layout . . . . . . . . . . . . . . . . . . . . . . . . . . . . . . . . . . . . . . . . . . . . . . 234.3.3 Data collection methods . . . . . . . . . . . . . . . . . . . . . . . . . . . . . . 284.3.4 Data analysis . . . . . . . . . . . . . . . . . . . . . . . . . . . . . . . . . . . . . . . . 29
4.4 Understorey Vegetation . . . . . . . . . . . . . . . . . . . . . . . . . . . . . . . . . . . . 294.4. Objectives . . . . . . . . . . . . . . . . . . . . . . . . . . . . . . . . . . . . . . . . . . . 294.4.2 Layout . . . . . . . . . . . . . . . . . . . . . . . . . . . . . . . . . . . . . . . . . . . . . . 304.4.3 Data collection methods . . . . . . . . . . . . . . . . . . . . . . . . . . . . . . 34.4.4 Data analysis . . . . . . . . . . . . . . . . . . . . . . . . . . . . . . . . . . . . . . . . 33
4.5 Snow Accumulation and Ablation . . . . . . . . . . . . . . . . . . . . . . . . . . . 344.5. Objectives . . . . . . . . . . . . . . . . . . . . . . . . . . . . . . . . . . . . . . . . . . . 344.5.2 Layout . . . . . . . . . . . . . . . . . . . . . . . . . . . . . . . . . . . . . . . . . . . . . . 344.5.3 Data collection methods . . . . . . . . . . . . . . . . . . . . . . . . . . . . . . 344.5.4 Data analysis . . . . . . . . . . . . . . . . . . . . . . . . . . . . . . . . . . . . . . . . 34
4.6 Microclimate Monitoring . . . . . . . . . . . . . . . . . . . . . . . . . . . . . . . . . . 354.6. Objectives . . . . . . . . . . . . . . . . . . . . . . . . . . . . . . . . . . . . . . . . . . . 354.6.2 Layout . . . . . . . . . . . . . . . . . . . . . . . . . . . . . . . . . . . . . . . . . . . . . . 354.6.3 Data collection methods . . . . . . . . . . . . . . . . . . . . . . . . . . . . . . 364.6.4 Data analysis . . . . . . . . . . . . . . . . . . . . . . . . . . . . . . . . . . . . . . . . 37
5 Extension . . . . . . . . . . . . . . . . . . . . . . . . . . . . . . . . . . . . . . . . . . . . . . . . . . . . 386 References . . . . . . . . . . . . . . . . . . . . . . . . . . . . . . . . . . . . . . . . . . . . . . . . . . . . 38

vi
appendices File reports associated with the establishment of Mount Tom trial . . . . 42 Qualitative observations regarding harvesting at the Mount Tom
study site . . . . . . . . . . . . . . . . . . . . . . . . . . . . . . . . . . . . . . . . . . . . . . . . . . . . . 433 Description of codes used for regeneration data collection . . . . . . . . . . . 47
tables Site characteristics of blocks . . . . . . . . . . . . . . . . . . . . . . . . . . . . . . . . . . . . . 42 Stand information from pre-harvest cruise data . . . . . . . . . . . . . . . . . . . . 53 Provisional ESSFwc3 classification for the Mount Tom trial in 200 . . . 64 Description of ecological strata groupings in the Mount Tom study area
used in planted stock studies . . . . . . . . . . . . . . . . . . . . . . . . . . . . . . . . . . . . . 75 Harvest information for blocks . . . . . . . . . . . . . . . . . . . . . . . . . . . . . . . . . . . 86 Site preparation and planting details for study blocks . . . . . . . . . . . . . . . 07 Experimental activities by block . . . . . . . . . . . . . . . . . . . . . . . . . . . . . . . . . . 28 Plot density for lichen data collection pre- and post-harvest by block . . 39 Plot density for collection of small-tree and coarse woody debris
data by block . . . . . . . . . . . . . . . . . . . . . . . . . . . . . . . . . . . . . . . . . . . . . . . . . . 30 Stand structure variables recorded for each lichen assessment tree . . . . . 8 Lichen abundance classes . . . . . . . . . . . . . . . . . . . . . . . . . . . . . . . . . . . . . . . . 82 Schedule of lichen and stand structure measurements . . . . . . . . . . . . . . . 93 Sampling density for treefall data collected on opening edges, in the
forested matrix, and in no-harvest controls . . . . . . . . . . . . . . . . . . . . . . . . 24 Openings selected to measure treefall on 0 m wide transects
around the perimeters . . . . . . . . . . . . . . . . . . . . . . . . . . . . . . . . . . . . . . . . . . 25 Schedule of treefall measurements . . . . . . . . . . . . . . . . . . . . . . . . . . . . . . . . 226 Sampling densities for regeneration study at CP550- . . . . . . . . . . . . . . . . 237 Sampling densities for regeneration study at CP55- . . . . . . . . . . . . . . . . 248 Sampling densities for residual patch monitoring in CP550-
and CP 55- . . . . . . . . . . . . . . . . . . . . . . . . . . . . . . . . . . . . . . . . . . . . . . . . . . . 289 Schedule of CP550-- and CP55- regeneration measurements . . . . . . . 2820 Location of vegetation plots on CP550- using the original
plot layout protocol . . . . . . . . . . . . . . . . . . . . . . . . . . . . . . . . . . . . . . . . . . . . . 32 Location of post-harvest 3.99 m radius vegetation plots on
CP550-- using the revised plot layout protocol . . . . . . . . . . . . . . . . . . . . . 3222 Location of post-harvest 3.99 m radius vegetation plots on
CP55- using the revised plot layout protocol . . . . . . . . . . . . . . . . . . . . . . 33
figures Location and layout of the Mount Tom adaptive management trial . . . . 42 Layout of CP550- treatment and control areas showing planted
stock openings, lichen plots, and treefall openings. . . . . . . . . . . . . . . . . . . 53 Layout of CP239-3 treatment and control areas showing lichen
plots and treefall openings. . . . . . . . . . . . . . . . . . . . . . . . . . . . . . . . . . . . . . . 64 Layout of CP242-4 showing snow survey plots, lichen plots,
and treefall openings. . . . . . . . . . . . . . . . . . . . . . . . . . . . . . . . . . . . . . . . . . . . 75 Layout of CP55- showing planted stock openings. . . . . . . . . . . . . . . . . . . 256 Schematic diagram of layout in the clearcut opening at CP550-. . . . . . . 267 Schematic diagram of layout in the clearcut opening at CP55-. . . . . . . . 26
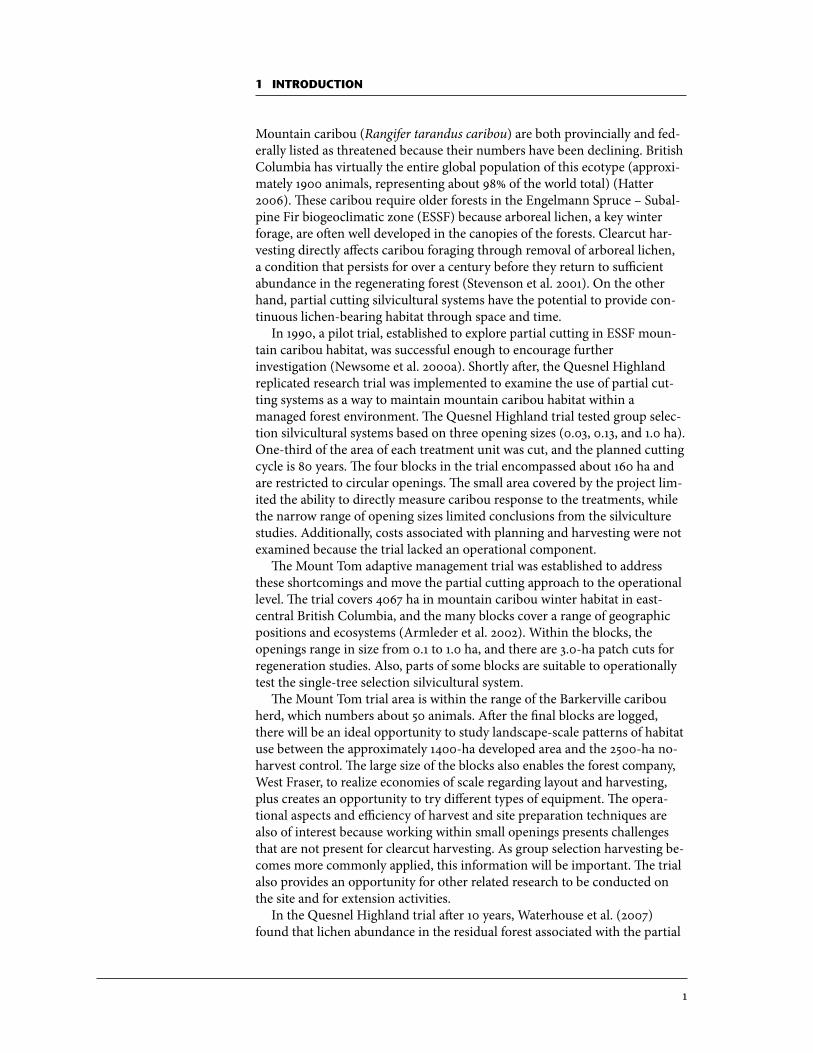
1 INTRODUCTION
Mountain caribou (Rangifer tarandus caribou) are both provincially and fed-erally listed as threatened because their numbers have been declining. British Columbia has virtually the entire global population of this ecotype (approxi-mately 900 animals, representing about 98% of the world total) (Hatter 2006). These caribou require older forests in the Engelmann Spruce – Subal-pine Fir biogeoclimatic zone (ESSF) because arboreal lichen, a key winter forage, are often well developed in the canopies of the forests. Clearcut har-vesting directly affects caribou foraging through removal of arboreal lichen, a condition that persists for over a century before they return to sufficient abundance in the regenerating forest (Stevenson et al. 200). On the other hand, partial cutting silvicultural systems have the potential to provide con-tinuous lichen-bearing habitat through space and time.
In 990, a pilot trial, established to explore partial cutting in ESSF moun-tain caribou habitat, was successful enough to encourage further investigation (Newsome et al. 2000a). Shortly after, the Quesnel Highland replicated research trial was implemented to examine the use of partial cut-ting systems as a way to maintain mountain caribou habitat within a managed forest environment. The Quesnel Highland trial tested group selec-tion silvicultural systems based on three opening sizes (0.03, 0.3, and .0 ha). One-third of the area of each treatment unit was cut, and the planned cutting cycle is 80 years. The four blocks in the trial encompassed about 60 ha and are restricted to circular openings. The small area covered by the project lim-ited the ability to directly measure caribou response to the treatments, while the narrow range of opening sizes limited conclusions from the silviculture studies. Additionally, costs associated with planning and harvesting were not examined because the trial lacked an operational component.
The Mount Tom adaptive management trial was established to address these shortcomings and move the partial cutting approach to the operational level. The trial covers 4067 ha in mountain caribou winter habitat in east-central British Columbia, and the many blocks cover a range of geographic positions and ecosystems (Armleder et al. 2002). Within the blocks, the openings range in size from 0. to .0 ha, and there are 3.0-ha patch cuts for regeneration studies. Also, parts of some blocks are suitable to operationally test the single-tree selection silvicultural system.
The Mount Tom trial area is within the range of the Barkerville caribou herd, which numbers about 50 animals. After the final blocks are logged, there will be an ideal opportunity to study landscape-scale patterns of habitat use between the approximately 400-ha developed area and the 2500-ha no-harvest control. The large size of the blocks also enables the forest company, West Fraser, to realize economies of scale regarding layout and harvesting, plus creates an opportunity to try different types of equipment. The opera-tional aspects and efficiency of harvest and site preparation techniques are also of interest because working within small openings presents challenges that are not present for clearcut harvesting. As group selection harvesting be-comes more commonly applied, this information will be important. The trial also provides an opportunity for other related research to be conducted on the site and for extension activities.
In the Quesnel Highland trial after 0 years, Waterhouse et al. (2007) found that lichen abundance in the residual forest associated with the partial

2
cuts increased relative to the no-harvest controls, and the lichen composition shifted to a greater proportion of Bryoria, a more preferred species (Rominger et al. 996). Others have confirmed that partial cutting systems, which retain most of the basal area, can increase ventilation of lichen on re-sidual trees and thereby maintain foraging habitat (Stevenson and Coxson 2007). The size of blocks (> 00 ha each) is large enough to test if lichen re-sponses at an operational scale are similar to those that resulted from the approximately 0-ha treatments tested in the Quesnel Highland trial. Treefall rates were very low in the residual forest of the partial cuts in the Quesnel Highland trial; the Mount Tom trial will add to these data and provide an op-portunity to examine the stability of edges around openings of various sizes.
In addition to lichen and stand development responses to group selection harvesting and the resulting response of caribou, a range of other topics is of interest from forest management perspectives. In particular, knowledge of re-generation responses within small openings is critical due to the limitations imposed by the cool climate, short growing season, cold and often wet soils, heavy snow loads, and competitive vegetation communities that are charac-teristic of the ESSF zone (Farnden 994). The high proportion of forest edge relative to area in small openings compared to clearcuts also has important ramifications relative to seedling environment. The Mount Tom study offers the opportunity to examine responses of planted Engelmann spruce and sub-alpine fir to opening size, microsite type (mechanically mounded versus natural preferred), and distance from the forest edge, all of which have had demonstrated importance in the Quesnel Highland trial (Newsome et al. 2000b; Stathers et al. 200).
Snow and microclimate responses in small openings are also of interest because peak flows produced during spring snowmelt are the dominant channel-forming process in the British Columbia interior, and are therefore important to the quality of fish habitat. Within individual watersheds, the ESSF zone has a relatively large influence on the magnitude and timing of the peak flows due to high snow accumulation in the winter and high snowmelt rates in the spring (Teti 200). Although the ESSF forest has a large effect on snow accumulation and the timing and rate of melt, there is limited qualita-tive understanding of this process. If group selection harvesting becomes widespread, we require information about how it will affect the accumulation and melting of snow, because the timing of spring snowmelt is important hy-drologically and the timing of snow disappearance is important silviculturally. At present, there are no published studies of the net effects of high-elevation group selection on snow accumulation and melt in British Co-lumbia, although some work has been done in the United States and Alberta (Golding and Swanson 978; Kattleman et al. 983). The snow study at Mount Tom has a powerful design because it includes both pre- and post-harvest measurements and examines the effects of different topographic aspects.
In the late 990s, through the Cariboo–Chilcotin land planning process, the group selection silvicultural systems tested in the Quesnel Highland trial became the key part of the “modified harvesting” prescription described in the CCLUP Mountain Caribou Management strategy (Youds et al. 2000). It is important to continue measuring and fully implementing the Mount Tom trial to test the longer-term effectiveness of this management strategy.
The principal objective of the Mount Tom adaptive management trial is to examine the effects of applying partial cutting, in a range of ecological and geographical contexts, at the operational level. The purpose of this establish-ment report is to document the study area, layout, and methods associated

3
with the many studies embedded in this long-term, complex trial. Specifical-ly, this report describes studies designed to:
• Measure the response of arboreal lichens to partial cutting, • Describe the pre-harvest stand structure and monitor the post-harvest
stand development,• Measure the treefall rates on opening edges and within the residual forest,• Measure the response of Engelmann spruce and subalpine fir regeneration
in a range of opening sizes, ecotypes, site preparation and microsite plant-ing options,
• Monitor the vegetation development in openings,• Determine the effects of the group selection treatment on snow accumula-
tion and snow ablation rates, and • Monitor the microclimate.
This report also describes the harvesting operations and extension oppor-tunities in the trial.
2 STUDY AREA
2.1 Site and Block Descriptions
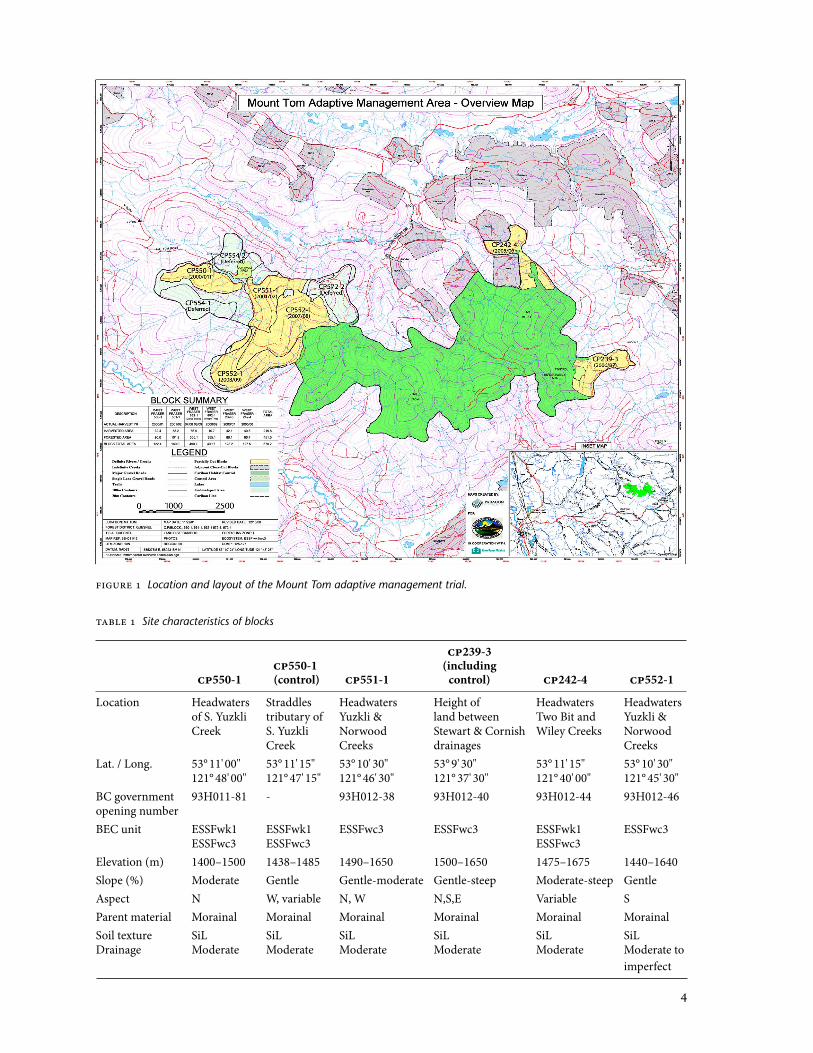
The Mount Tom study area is located approximately 7 km north of Wells, B.C., in the Quesnel Forest District at 53o 09' – 53o ' N and 2o 37' – 2o 49' W. The study area straddles the ESSFwk / ESSFwc3 boundary and is regularly used by mountain caribou. The 4067 ha study area is entirely forested, with the ex-ception of about 6 ha of alpine. The whole area was designated for “modified” harvesting under the Cariboo–Chilcotin Land Use Plan (Youds et al. 2000). The area was split into two: one part would be developed immediately (200–202) (407 ha), and the other part (2500 ha) not harvested for 0 years after completion of the first phase of development (Figure ). This provides a large undeveloped area where caribou use of harvested and undisturbed stands can be studied.
Due to the large scale of the project, harvesting of the 407-ha develop-ment area is proceeding block by block (Figure ). Five of the eight blocks were harvested between March 200 and March 20. There were two name changes: CP572-3 became CP239-3 and CP572-4 became CP242-4. Also, the original CP553- was amalgamated with CP552-. The final three blocks (newly named CP553- and CP553-2 [formerly CP554] and CP572-2) will be cut when they become economically viable.
The stands are similar in structure to those in the Quesnel Highland proj-ect (Steen et al. 2005), where Engelmann spruce and subalpine fir are the common species and the proportion of subalpine fir generally increases and becomes clumpy with elevation. Based on stand structure data collected from three blocks in the Mount Tom trial, about 2% of the stems over 2.5 cm dbh are spruce, yet they make up 29% of the basal area. The largest trees range from 200 to 400 years old and the oldest tree is about 460 years. Woody de-bris over 7.5 cm diameter ranged from 280 to 430 m³/ha across all the blocks. Data from three blocks were summarized by C. Gabriel and Wintergreen Consultants (Appendix ). Site characteristics for the harvested blocks are provided in Table , while pre-harvest stand volumes according to original cruise data are summarized in Table 2.
4
FIGURE 1 Location and layout of the Mount Tom adaptive management trial.
TABLE 1 Site characteristics of blocks
CP239-3 CP550-1 (including CP550-1 (control) CP551-1 control) CP242-4 CP552-1
Location Headwaters Straddles Headwaters Height of Headwaters Headwaters of S. Yuzkli tributary of Yuzkli & land between Two Bit and Yuzkli & Creek S. Yuzkli Norwood Stewart & Cornish Wiley Creeks Norwood Creek Creeks drainages CreeksLat. / Long. 53° 11' 00" 53° 11' 15" 53° 10' 30" 53° 9' 30" 53° 11' 15" 53° 10' 30" 121° 48' 00" 121° 47' 15" 121° 46' 30" 121° 37' 30" 121° 40' 00" 121° 45' 30"BC government 93H011-81 - 93H012-38 93H012-40 93H012-44 93H012-46opening number BEC unit ESSFwk1 ESSFwk1 ESSFwc3 ESSFwc3 ESSFwk1 ESSFwc3 ESSFwc3 ESSFwc3 ESSFwc3Elevation (m) 1400–1500 1438–1485 1490–1650 1500–1650 1475–1675 1440–1640Slope (%) Moderate Gentle Gentle-moderate Gentle-steep Moderate-steep GentleAspect N W, variable N, W N,S,E Variable SParent material Morainal Morainal Morainal Morainal Morainal Morainal Soil texture SiL SiL SiL SiL SiL SiLDrainage Moderate Moderate Moderate Moderate Moderate Moderate to imperfect
5
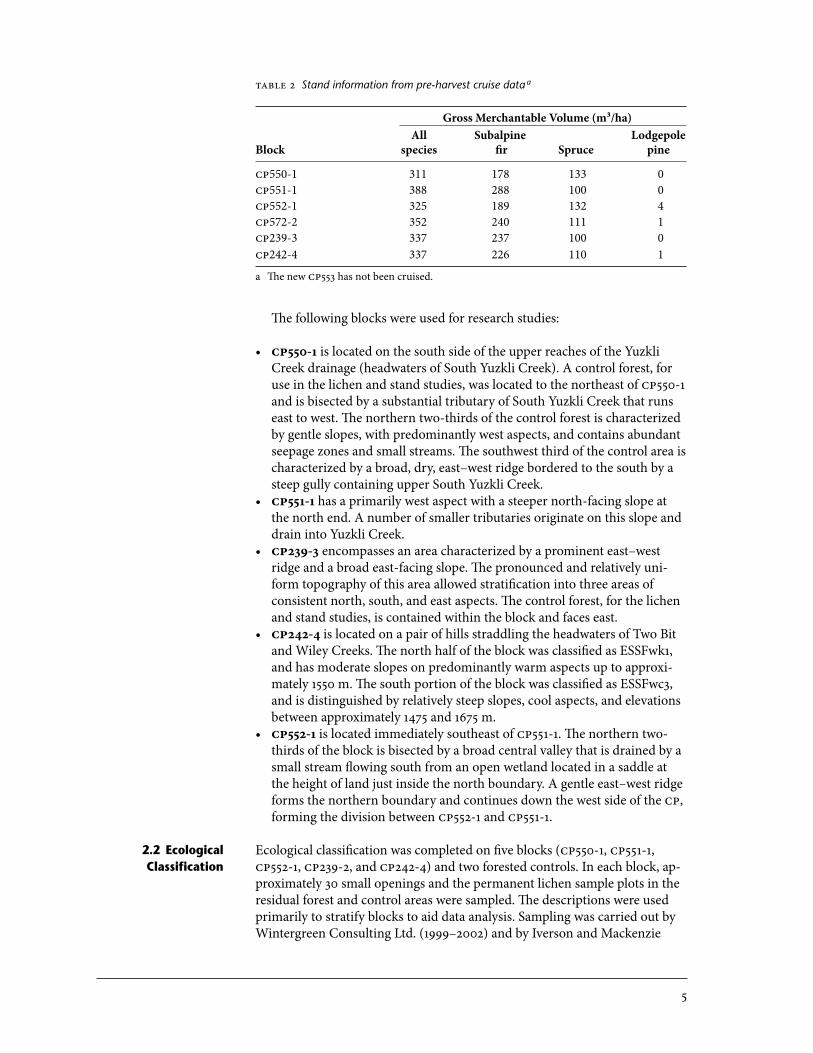
The following blocks were used for research studies:
• CP550- is located on the south side of the upper reaches of the Yuzkli Creek drainage (headwaters of South Yuzkli Creek). A control forest, for use in the lichen and stand studies, was located to the northeast of CP550- and is bisected by a substantial tributary of South Yuzkli Creek that runs east to west. The northern two-thirds of the control forest is characterized by gentle slopes, with predominantly west aspects, and contains abundant seepage zones and small streams. The southwest third of the control area is characterized by a broad, dry, east–west ridge bordered to the south by a steep gully containing upper South Yuzkli Creek.
• CP55- has a primarily west aspect with a steeper north-facing slope at the north end. A number of smaller tributaries originate on this slope and drain into Yuzkli Creek.
• CP239-3 encompasses an area characterized by a prominent east–west ridge and a broad east-facing slope. The pronounced and relatively uni-form topography of this area allowed stratification into three areas of consistent north, south, and east aspects. The control forest, for the lichen and stand studies, is contained within the block and faces east.
• CP242-4 is located on a pair of hills straddling the headwaters of Two Bit and Wiley Creeks. The north half of the block was classified as ESSFwk, and has moderate slopes on predominantly warm aspects up to approxi-mately 550 m. The south portion of the block was classified as ESSFwc3, and is distinguished by relatively steep slopes, cool aspects, and elevations between approximately 475 and 675 m.
• CP552- is located immediately southeast of CP55-. The northern two-thirds of the block is bisected by a broad central valley that is drained by a small stream flowing south from an open wetland located in a saddle at the height of land just inside the north boundary. A gentle east–west ridge forms the northern boundary and continues down the west side of the CP, forming the division between CP552- and CP55-.
2.2 Ecological Classification
Ecological classification was completed on five blocks (CP550-, CP55-, CP552-, CP239-2, and CP242-4) and two forested controls. In each block, ap-proximately 30 small openings and the permanent lichen sample plots in the residual forest and control areas were sampled. The descriptions were used primarily to stratify blocks to aid data analysis. Sampling was carried out by Wintergreen Consulting Ltd. (999–2002) and by Iverson and Mackenzie
TABLE 2 Stand information from pre-harvest cruise data a
Gross Merchantable Volume (m³/ha) All Subalpine Lodgepole Block species fir Spruce pine
CP550-1 311 178 133 0CP551-1 388 288 100 0CP552-1 325 189 132 4CP572-2 352 240 111 1CP239-3 337 237 100 0CP242-4 337 226 110 1
a The new CP553 has not been cruised.

6
Biological Consulting (2003). It included both vegetation descriptions and soil descriptions from at least four soil pits on each block (a minimum of one per ecological type). Classification was complicated by the occurrence of the study area on the ESSFwk and ESSFwc3 boundary, and because the available biogeoclimatic classification (Steen and Coupé 997) has not been completed for the ESSFwc3. A draft ecological classification was completed to aid eco-logical stratification for the ESSFwc3 portion of the study area (Table 3).
TABLE 3 Provisional ESSFwc3 classification for the Mount Tom trial in 2010
Soil moisture andnutrient regime CP551-1 CP552-1 239-3 242-4 Draft classification
2-3/B-C – wc3 /01d wc3 /01d wc3 /01d Provisional Rhododendron/feathermoss unit ESSFwc3/02. Note: Wintergreen labelled this as SMC 3 and it is probably drier than 3, according to the provisional classification.
3-4C wc3 /01 wc3 /01 wc3 /01 wc3 /01 wc3 /01
4+-5/C-D wc3 /01h wc3 /01h wc3 /01h wc3 /01h Not described for ESSFwc3 – could be a little wetter than the 01 and may only be in small patches so may be combined into the 01 or the 01w.
5-6/B-E wc3 /01w wc3 /01w wc3 /01w wc3 /01w Provisional Valeriana/Thalictrum unit ESSFwc3/04
6-7/C-E wc3 /03 wc3 /03 wc3 /03 wc3 /03 There are two provisional wetter series, the 05 and 06, that will replace some of the areas classified as 03.
For the planted stock studies, CP550- and CP55- were each assigned to a single ecological variant (ESSFwk for CP550- and ESSFwc3 for CP55-) based on the dominant ecological characteristics. For both blocks, ecosystem units were mapped in selected openings and then grouped into wet and well drained classes. Some CP55- openings had intimate mixtures of wet and well drained ecosystems and these areas were designated as mosaics (Table 4).
For the lichen study, plots in CP550- were stratified by ecoclass ( = sub-hygric to hygric site series in ESSFwk, and 2 = mesic ESSFwc3 and submesic to drier ESSFwk site series). CP239-3 is predominantly ESSFwc3, and the li-chen plots were stratified based on aspect (north or east). CP242-4 was separated into ESSFwc3 (higher elevation, north aspect) and ESSFwk (lower elevation, south aspect), and this was used to classify the lichen plots.
The other blocks were mapped, but further work on grouping ecosystems for stratification purposes was not necessary. Reports concerning the original stratification done by Wintergreen Consultants are listed in Appendix .

7
3 TREATMENTS
3.1 Harvest and Control Treatments
Within the whole study area (4067 ha), about 400 ha was planned for devel-opment and a 2500-ha area was set aside as a no-harvest control (Figure ). The developed portion of the study area includes eight blocks, of which five were harvested between 2000 and 200 for at total of 029 ha (Table 5). The remaining three blocks are in the planning phase for development. The five blocks cut so far were harvested using a group selection silvicultural system where openings ranged in size from 0. to .0 ha. In addition, a 3.0-ha open-ing was also harvested in CP550-, CP239-3, and CP55-. The cutting cycle is 80 years, and at each entry about 30% of the area (excluding main roads) is cut. A small portion of CP552- (0.8 ha) was partially cut using the single-tree selection silvicultural system. The remaining three blocks will be cut with a combination of group and single-tree selection.
Block layout was intended to be approached with a “total chance view,” whereby both economics and technical issues were considered not only for the first entry, but for multiple entries that would follow. In particular, atten-tion was given to laying out the group selection openings so that they were not too close to each other in order to reduce the risk of treefall. Openings could be variable in shape, but harvest efficiency had to be taken into ac-count. The contractor who did the block layout was also given leeway to include or exclude clumps of trees, as appropriate, rather than following exact, mapped-out boundaries. Within each block, every opening was la-belled with a unique alphabetical identifier (e.g., A, AA) and mapped using GPS. In the field, one or two reference trees on the edge of each opening were blazed and painted with the opening number.
TABLE 4 Description of ecological strata groupings in the Mount Tom study area used in planted stock studies
Soil BEC units CP # regimes Stratum numbera included Description
550-1 SMR:> 4–6 wet (1) ESSFwk1/ 04, Moist herbaceous sites (transitioning to the SNR: C-D 07, and minor ESSF wc3/01w and 01h). amounts of 01
550-1 SMR: 3–4 well drained (2) ESSFwk1/03 Well-drained benches and upper slopes SNR: B–C dominated by rhododendron (R. albiflorum), with some black huckleberry, oval-leaved blue- berry, and black gooseberry. This was often transitioning to ESSFwc3/01.
551-1 SMR: 4–5 wet (1) ESSFwc3/01w Moist to wet herbaceous community. The 01h SNR: C–D and 01h was present in small areas and not as wet as the 01w.
551-1 SMR: 3–4 well drained (2) ESSFwc3/01 Well-drained shrub community dominated by SNR: B–C rhododendron.
551-1 SMR: 3–5 mosaic (3) ESSFwc3/01, This stratum is a mosaic of patches of wetter SNR: B–D 01w, 01h, small herb and drier shrubby areas. In the amounts of 03 provisional classification in 2010 the ESSFwc3/03 = ESSFwc3/05.
a This stratum numbering system is used on maps and in analysis output.
8
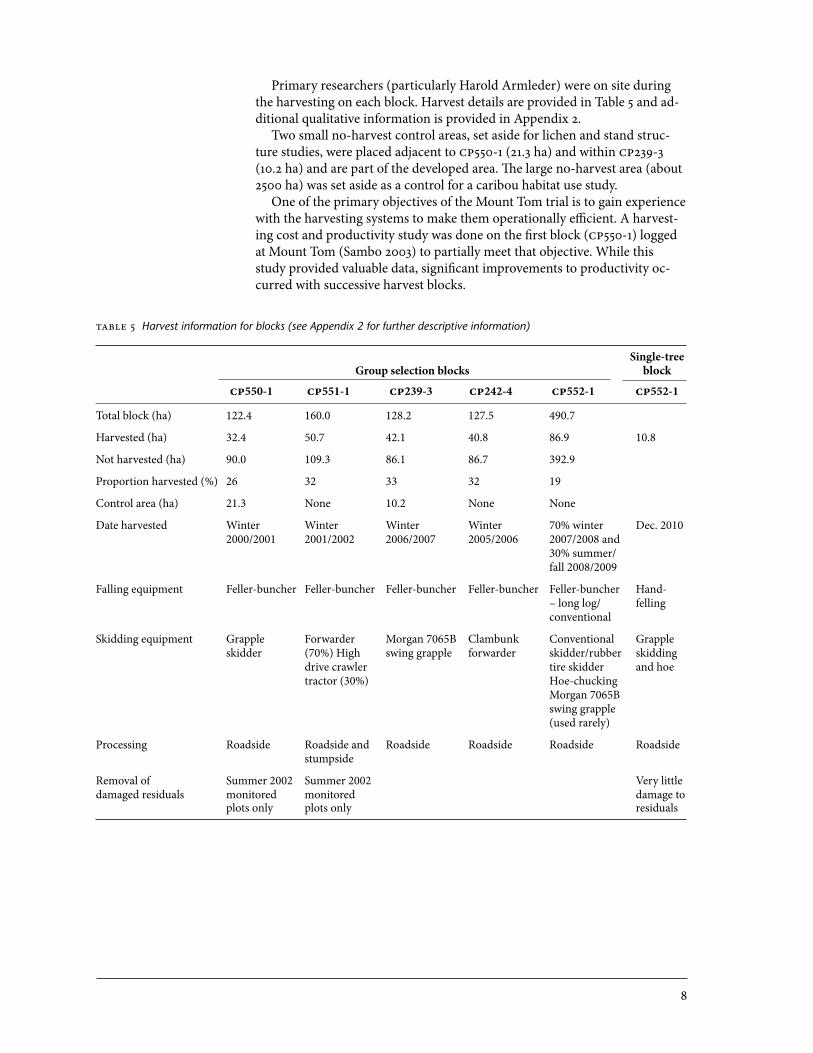
Primary researchers (particularly Harold Armleder) were on site during the harvesting on each block. Harvest details are provided in Table 5 and ad-ditional qualitative information is provided in Appendix 2.
Two small no-harvest control areas, set aside for lichen and stand struc-ture studies, were placed adjacent to CP550- (2.3 ha) and within CP239-3 (0.2 ha) and are part of the developed area. The large no-harvest area (about 2500 ha) was set aside as a control for a caribou habitat use study.
One of the primary objectives of the Mount Tom trial is to gain experience with the harvesting systems to make them operationally efficient. A harvest-ing cost and productivity study was done on the first block (CP550-) logged at Mount Tom (Sambo 2003) to partially meet that objective. While this study provided valuable data, significant improvements to productivity oc-curred with successive harvest blocks.
TABLE 5 Harvest information for blocks (see Appendix 2 for further descriptive information)
Single-tree Group selection blocks block
CP550-1 CP551-1 CP239-3 CP242-4 CP552-1 CP552-1
Total block (ha) 122.4 160.0 128.2 127.5 490.7
Harvested (ha) 32.4 50.7 42.1 40.8 86.9 10.8
Not harvested (ha) 90.0 109.3 86.1 86.7 392.9
Proportion harvested (%) 26 32 33 32 19
Control area (ha) 21.3 None 10.2 None None
Date harvested Winter Winter Winter Winter 70% winter Dec. 2010 2000/2001 2001/2002 2006/2007 2005/2006 2007/2008 and 30% summer/ fall 2008/2009
Falling equipment Feller-buncher Feller-buncher Feller-buncher Feller-buncher Feller-buncher Hand- – long log/ felling conventional
Skidding equipment Grapple Forwarder Morgan 7065B Clambunk Conventional Grapple skidder (70%) High swing grapple forwarder skidder/rubber skidding drive crawler tire skidder and hoe tractor (30%) Hoe-chucking Morgan 7065B swing grapple (used rarely)
Processing Roadside Roadside and Roadside Roadside Roadside Roadside stumpside
Removal of Summer 2002 Summer 2002 Very little damaged residuals monitored monitored damage to plots only plots only residuals

9
3.2 Site Preparation
The initial harvesting in CP550- resulted in large slash piles within the open-ings as well as on the roadside, and a layer of slash composed of smaller pieces described as “fluffy” in places. This post-harvest condition presented some challenges to planting immediately after harvest. Most of the block needed blading to remove the 30 cm + slash layer before planting could pro-ceed. Piles were not burned until the fall, so seedlings were fill planted into the burnt areas the following year.
When CP55- was harvested, planting was delayed for a year to allow the site to be properly prepared. Stump-side processing was used instead of road-side processing to reduce the need to deal with large slash piles. Where stump-side processing was done, slash materials were piled following com-pletion of harvesting using an excavator working on snow. As a result, there was little disturbance to surface soil layers, but there was layer of slash laid down to facilitate equipment movement that had to be managed prior to planting. Stump-side piles were small, and there were enough plantable spots even where burning was incomplete.
All piles were burned the fall following piling (Table 6). In CP550-, piles were lit by helicopter, whereas they were lit by hand in CP55 and CP552. It was estimated that 40–00% of each pile was burned, with an overall average of approximately 75% of material consumed (G. Scott, pers. comm., 200)
An excavator was used to mound selected openings (Table 6). For CP550- and CP55-, where the regeneration study was taking place, mounded open-ings were selected across different opening size classes and ecological strata. In these blocks, mounding treatments were not preferentially assigned to wetter openings as would have been done operationally. Mounds were con-structed in groups of two to five to in an effort to re-create the clumpy nature of the original stand, and were allowed to settle for one winter prior to plant-ing. The excavator removed any large debris or shrubs where the mounds were to be created, then incorporated forest floor material into the middle of mounds.
All harvested openings were planted (Table 6), but regeneration studies were conducted only on blocks CP550- and CP55-. Operational planting density was approximately 800 stems/ha. Some of the openings in CP550- had large slash piles that were not burned until the fall, after planting. Plant-ers were instructed to leave a buffer of approximately 5 m around each pile. The burn spots were fill-planted in August 2002. On CP55-, the burn spots were small enough that the area did not have to be fill-planted. For CP550- and CP55-, planters were instructed to plant a 50/50 mix of subalpine fir and spruce in research openings, and the range of microsites was used for both species. Planting on other blocks was done to West Fraser operational stan-dards where proportionally more spruce was planted, on the assumption that subalpine fir would seed-in naturally.
Preferred natural micrositesBased on results from the Quesnel Highland phase of EP04.02, preferred natural microsites were those that (a) enhanced soil drainage and warming (i.e., natural raised microsites and areas around stumps), (b) were free of overtopping vegetation, and (c) on steeper slopes, offered protection from snowpress and snowcreep (i.e., close to stumps). Rotten wood (from friable red to well-decomposed) was considered an acceptable planting medium, es-pecially if it offered a raised planting site. On preferred natural microsites, planters were instructed to (a) do standard screefing down to acceptable

0
planting material, (b) avoid areas of dense rhododendron and depressions, and (c) where possible, plant seedlings in clumps. Planting crews did not al-ways follow the instruction to plant in clumps as rigorously as intended. This was especially noted on CP55-. On CP550-, seedlings were planted on pre-ferred natural microsites in the year after harvest to optimize contact with mycorrhizae before fungal populations declined after harvest. Mound seed-lings were not planted on CP550- until the following year, resulting in a -year age difference between these treatments. On CP55-, with the exception
TABLE 6 Complete site preparation and planting details for study blocks (CP550-1 and CP551-1) and select information for the operational blocks is presented
Group selection blocks
CP550-1 CP551-1 CP239-3 CP242-4 CP552-1
Site preparation
Piling completed 9.7 ha July 2001 40.7 ha 26.2 ha 14.3 ha 2.5 ha July 2002 July 2002 Sept. 2008 Sept. 2008
Treatment & area Mounding Mounding Mounding Mounding 8.7ha 5.6 ha 37.4 ha 30.7 ha Chemical 8.9 ha
Site prep date July 2001/2002 July 2002 July 2008 Mounding Sept. 2008, Oct. 2009 Chemical Aug. 2009
Equipment Excavator Excavator
Planting
Contractor Celtic Celtic Reforestation Reforestation
Date planted 15.4 ha 10.5 ha 26.7 ha 36.3 ha 51 ha July 2001 July 2002 July 2008 July 2007 July 2009 17.2 ha 32.7 ha 9.7 ha July 2002 July 2003 July 2009
SE request key 2000DQU0055 03DQU0054;
SE stocktype PSB 412A 2+0 1+0 PSB 410;
Chemical Pesticide free Ambush 50 EC treatments in @ 140 mil/ha – the nursery applied May 16/03 for Lygus bug
SE seedlot 4814 4814
BL request key 01DQ0046 03DQU0052
BL stocktype PSB 410 2+0 1+0 410
Chemical Treated in 140 mil/ha – treatments in nursery with applied May 16/03 the nursery Cymbush 250 for Lygus bug EC @ 280 ml/ha
BL seedlot 44927 44927

of a few hectares that were planted operationally the summer immediately after harvest due to extra stock availability, planting on preferred natural mi-crosites was delayed for year so that they could be planted at the same time as mound seedlings.
Mechanical moundsMechanical mounds were allowed to settle for a year before seedlings were planted. Planters were instructed to plant seedlings on the tops of mounds unless materials were too coarse to allow acceptably tight planting. In such cases, it was acceptable to position the seedlings on the sides of mounds. No instructions were given regarding preferred mound aspect. Two seedlings could be planted on large mounds, as long as they were at least 50 cm apart. On CP550-, seedlings on mounds were planted year after the seedlings on the preferred natural microsites, whereas at CP55- both mounds and pre-ferred natural microsites were planted in the same year (2003).
Residual clumpsOften in high-elevation forests there is a large component of smaller non-merchantable trees that are usually disposed of by burning in slash piles following harvest. There is a possibility that these trees may respond to the overstorey removal and grow into a harvestable size. These smaller trees often are found in clumps. In addition, based on observations at the Quesnel High-land study, new regeneration appears to establish around the edges of these clumps. Farnden (994) concurred that at high elevation, and especially on wetter sites, trees tend to establish in clumps on raised hummocks where drainage is better. Therefore, pilot trials were established on two sites, CP550- and CP55-, to study both the response of the clumps of non-merchantable residual trees and seedlings planted within and around these clumps. On CP550-, clumps of smaller non-merchantable residual trees were retained across a variety of opening sizes. However, it was difficult to remove timber in small openings without damaging the residual clumps, and, even in large openings, trees in small clumps (two to six trees) were frequently scarred during harvest. Therefore, on CP55-, the decision was made to not leave re-sidual clumps in the smaller openings and to leave only larger clumps in the medium and large openings where smaller non-merchantable trees were present. Even if edge residuals were damaged, those located in the inner por-tion of the clump were not scarred. The stand structure in CP55- had fewer patches of small stems that would be considered non-merchantable, so resid-ual clumps were retained in only two larger openings. As a result, the residual clump treatment was not well replicated on CP55-. Seedlings were planted around the edges of residual clumps at both CP550- and CP55-, and also within the larger clumps at CP55-. Seedlings in residual patches were plant-ed the summer after logging (200) on CP550- and two summers after logging on CP55- (2003).
3.3 Opening Sizes
For several of the studies, openings were classed as very small (0.–0.2 ha), small (0.2–0.4 ha), medium (0.5–0.7 ha), and large (> 0.9 ha). A 3.0-ha open-ing was cut in each of three blocks to create a clearcut comparison for silviculture studies. The very small openings were used only in the stand sta-bility study.

2
4 EXPERIMENTAL PROJECTS
An overview of the distribution of the experimental projects by block within the study area is shown in Table 7.
4.1 Lichen Abundance, Stand
Structure, Small Tree, and Coarse Woody
Debris
Michaela Waterhouse and Harold Armleder
4.. Objectives
• Compare pre-harvest lichen abundance and species composition by block (a) among harvested (forest matrix) and control areas, (b) among ecologi-cal units, and (c) among the forest matrix and openings to be cut.
• Compare post-harvest lichen abundance and composition in the forest matrix in the harvested blocks with the no-harvest control areas, using the pre-harvest data as a control.
• Compare post-harvest to pre-harvest lichen abundance and composition, by block and ecological unit.
• Measure the pre- and post-harvest stand structure in terms of species composition, crown class, density by diameter class, age structure, ingress, and growth rates.
• Describe wildlife trees (species, decay class, breakage, and density), pre-harvest and post-harvest.
• Describe coarse woody debris attributes (volume, decay class), pre-harvest and post-harvest.
4..2 Layout A total of 24 plots, 0.0 ha in area (radius of 5.64 m), were es-tablished in CP550-, CP239-3, and CP242-4 to measure arboreal lichen abundance and composition, stand structure, and wildlife tree attributes, pre- and post-harvest (Table 8). Enough plots were established to collect lichen data from about 50 trees in each dominant ecological stratum within the harvested and control area of each block. Prior to harvest, three plots were set up in ecoclass 3 in CP550-, and 0 plots were established on the south aspect in CP239-3. These were abandoned post-harvest due to insufficient sample size and are not included in Table 8.
Plots were established prior to harvest in (a) areas designated as group se-lection openings (08 plots), (b) areas designated as forest matrix between the openings (90 plots), and (c) the control areas tied to CP550- and CP239-3 (43
TABLE 7 Experimental activities by blocka
CP550-1 CP239-3Project Harvested Control Harvested Control CP242-4 CP551-1 CP552-1
Eco-classification X X X X X X XLichen X X X X X Treefall X X X X X Planted regeneration X X Vegetation X X Stand structure X X X Snow studies X
a Controls are forested areas established for CP550- and CP239-3.

3
plots). In addition to lichen data, stand structure and wildlife tree data were collected in all plots for trees ≥ 7.5 cm diameter at breast height (dbh). For the 33 plots that continue to be measured post-harvest (i.e., forest matrix and control), centres were marked with .3 m tall and cm diameter hollow aluminum poles and flagged with blue and pink “MoF Research” tape. Alu-minum labels were attached with plastic straps to each pole. Each tree bole was labelled by hammering an aluminum nail through a blue, numbered plastic growth and yield tag at a height of .5 m. Tag numbers are unique within plots but not within blocks.
In the forested matrix of each harvested block, 5 lichen plots were used to sample small trees (< 7.5 cm dbh) and coarse woody debris pre-harvest (Table 9). Within each plot, four subplots were established to examine those trees < .3 m tall. These subplots were established 3 m from the plot centre in the four cardinal directions, and were 5 m2 in area (r = .26 m). The subplots were not permanently marked. Two 25 m long coarse woody debris transects were established at right angles from the plot centre in two randomly selected cardinal directions, and recorded in the electronic data.
TABLE 8 Plot density for lichen data collection pre- and post-harvest by block
Ecological unit Openings Forest matrix Control Total
CP550-1 1 20 15 13 48 2 17 15 12 44Total 37 30 25 92
CP239-3 N aspect 20 25 0 45 E aspect 19 16 18 53Total 39 41 18 98
CP242-4 ESSFwk1 16 8 n/a 24 ESSFwc3 16 11 n/a 27Total 32 19 n/a 51
Total for study 108 90 43 241
TABLE 9 Plot density for collection of small-tree (< 7.5 cm dbh) and coarse woody debris data by block
Ecological unit Number of plots Plot numbers
CP550-1 1 6 70, 106, 39, 24/25, 93/94, 88 2 9 103/104, 56, 58, 49/50, 40, 31, 77, 69/68*Total 15
CP239-3 N aspect 7 10/11(125m W), 17/18 (25m E), 15/16 (50m E), 12/13 (100m E), 9, 4, 6 E aspect 4 56, 58/59 (50m E), 58/59 (100m E), 49/50 (100m E) S aspect* 4 21/22 (100m W), 30, 4/5 (125m W), 24/25 (50m W)Total 15
CP242-4 ESSFwk1 6 16, 18W25, 33W25, 39, 37/38, 26 (25m) ESSFwc3 9 71, 76E25, 78W50, 70E50, 67W50, 65, DDD*, DD*, 17W25Total 15
Total for study 45
* CP239-3 South-aspect plots measured only pre-harvest, CP550- plot 69/68 measured only pre-treatment, and CP242-4 DDD and DD are in openings that were logged.
4
Plot location procedures were as follows:
• Group selection openings A total of 08 plots were located in the approximate centre of the planned
openings as estimated on a :0 000 field map. Distance and azimuth from a mapped GPS boundary station to the plot centre were measured by hip chain and compass. Two plots were established in some of the medium and large openings of CP239-3 to meet lichen tree sampling targets. Only pre-harvest measurements were taken at these plots.
• Matrix Plots were established at existing cruise plot centres that had been laid out
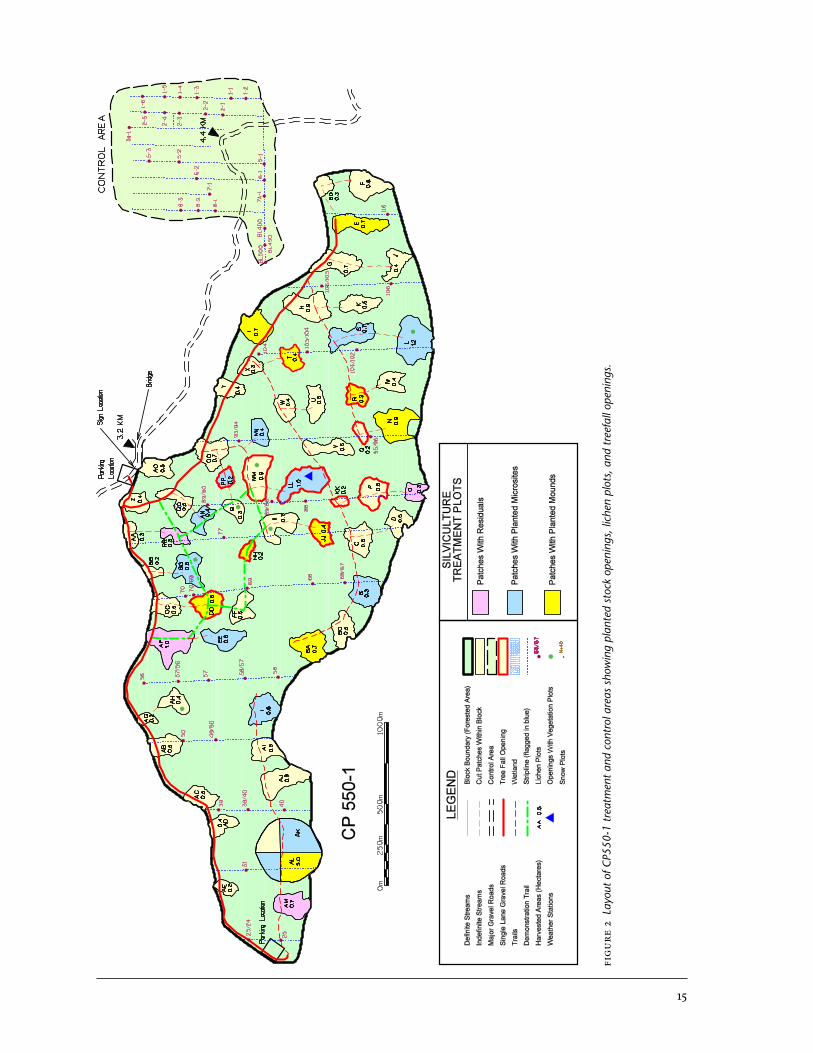
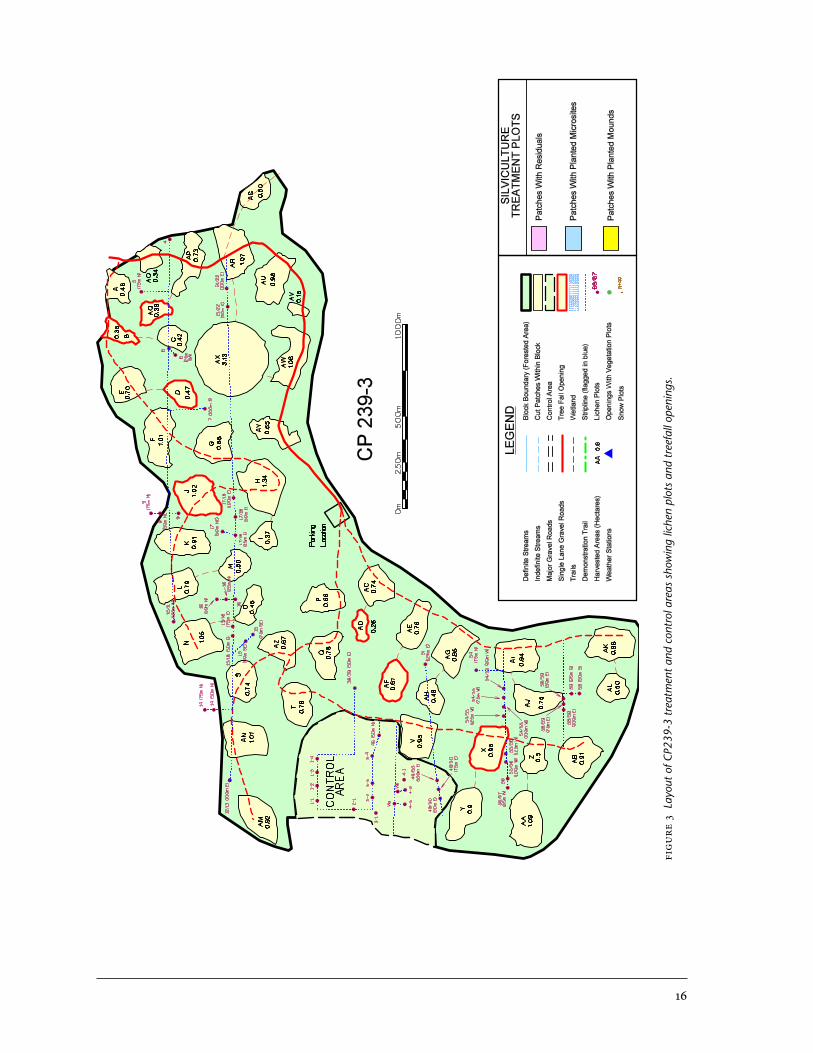
on grids of either 200 × 200 m (CP550-) or 50 × 50 m (CP239-3 and CP242-4). The cruise lines that connect the plots have been regularly flagged in blue “MoF Research” tape. The points where the cruise line crossed a road were flagged with pink. In CP550- and CP242-4, additional plots were established at intermediate intervals of 25 or 50 m. In CP239-3, it was sometimes necessary to locate plots on offsets from the cruise plots lines. In all cases, efforts were made to locate plot centres at least 20 m from des-ignated road rights-of-way and harvest opening boundaries, although in some cases the buffer distance was reduced to 2 m to meet sample goals. All the plot locations are shown on the block maps (Figures 2, 3, and 4).
• Controls In CP550-, the forested control is located outside of CP550-, above the
northeast corner of the block (Figure 2). The perimeter is flagged in or-ange. An east–west baseline, marked at 50-m intervals, was established along the southern edge of the control forest. A point of commencement (POC) was established at each 50-m interval along the east–west baseline, from which north–south transects flagged in blue “MoF Research” and yellow tape were run. Plots were established every 50 m along the north–south transects (Figure 2). In CP239-3, the forested control is located within the block (Figure 3). It has an easterly aspect and is representative of the entire block. Eighteen plots were established using the same ap-proach as for the rest of CP239-3. Six plots were established concurrently with the other CP239-3 plots, and 2 plots were added in 2002. All the plot locations are shown on the block maps (Figures 2 and 3).
4..3 Data collection methods In each of the 24 lichen assessment plots, arboreal lichen abundance was assessed for all trees ≥ 7.5 cm dbh. For each tree, species, dbh (cm), crown class, and wildlife tree decay class were record-ed (Table 0). Lichen abundance was assessed using the ocular estimation system based on photographs (Armleder et al. 992), but with the modifica-tion that additional photographs were used to split lichen classes 2 and 3 into high and low classes (2L, 2H, 3L and 3H) (Table ). The 4.5-m measurement zone (from the ground up) was estimated from the growth and yield tag placed at the .5-m mark on the tree. In order to maintain consistency, one surveyor does all the lichen assessments within a block in any one year. In addition to the photographs, the surveyor uses weighed lichen samples to compare with lichen clumps on assessed trees to ensure consistent, accurate lichen abundance estimates across all plots. In addition to abundance, the composition of the sample is broken into a percentage of Alectoria spp. and Bryoria spp., estimated to the nearest 0%.
To determine minimum stand age from the oldest trees, a selection of trees > 50 cm dbh were cored at breast height (20 cm). Up to a maximum of
5
FIGU
RE 2
Lay
out
of C
P550
-1 t
reat
men
t an
d co
ntro
l are
as s
how
ing
plan
ted
stoc
k op
enin
gs, l
iche
n pl
ots,
and
tre
efal
l ope
ning
s.
6
FIGU
RE 3
Lay
out
of C
P239
-3 t
reat
men
t an
d co
ntro
l are
as s
how
ing
liche
n pl
ots
and
tree
fall
open
ings
.

7
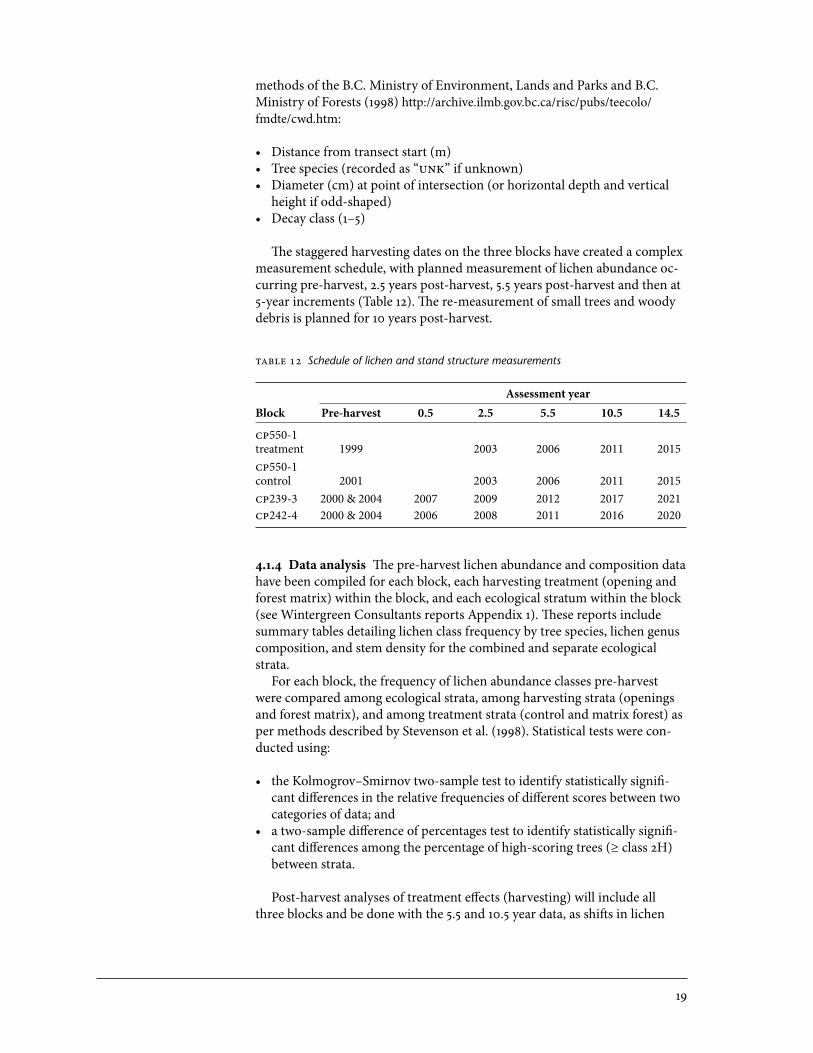
FIGURE 4 Layout of CP242-4 showing snow survey plots, lichen plots, and treefall openings.

8
two trees per plot and 3–5 trees per block including Engelmann spruce, subalpine fir, and lodgepole pine were selected. Where trees fell outside the lichen plot, distance and direction to each cored tree from plot centre was documented.
In the subset of lichen plots used for small tree tallies (Table 9) the data were collected by size class. For trees < 7.5 cm dbh and ≥ .3 m tall, they were tallied by species, dbh class (0–2.4 cm or 2.5–7.4 cm), and wildlife tree decay class. For trees < .3 m tall, stems within each of the four small tree subplots were tallied by species, height class (< 5 cm or ≥ 5 cm), vigour (live or dead), and surface substrate class: mineral soil, surface organic materials (LFH), hard woody debris (decay classes and 2), medium woody debris (decay class 3), soft woody debris (decay classes 4 and 5), and rock (covered by < 2 cm of mineral or organic material). The percentage of the plot surface occupied by each substrate class (available substrate) was also visually esti-mated and recorded for each sub-plot.
Coarse woody debris pieces > 7.5 cm diameter at the point of transect in-tersection were assessed, and the following information was recorded, using
TABLE 10 Stand structure variables recorded for each lichen assessment tree
Variable Class
Crown position 1 = dominant (crown above the main canopy) 2 = co-dominant (forming the main canopy) 3 = intermediate (crown below but extending into the main canopy) 4 = suppressed (crown entirely below the main canopy)
Wildlife tree 1 = live 2 = declining – trees with few live branches and/or needles thinning; used for trees that
appear to be dying. Mature trees and regeneration that exhibited a high degree of defo-liation were included.
3 = dead – fine branches present and bark tight – no cracks in the bark 4 = loose bark – ranges from trees with cracks in the bark through trees with only 25% of
the bark remaining 5 = clean – trees with < 25% of the bark remaining 6 = stub
Breakage BT = broken top BB = broken base BM = broken middle
TABLE 11 Lichen abundance classes (modified from Armleder et al. 1992)
Lichen class No. of 5-g clumps
0 01 > 0–12L 1–5.92H 6–103L 10.1–35.93H 36–504 50.1–1255 > 125
9
methods of the B.C. Ministry of Environment, Lands and Parks and B.C. Ministry of Forests (998) http://archive.ilmb.gov.bc.ca/risc/pubs/teecolo/fmdte/cwd.htm:
• Distance from transect start (m)• Tree species (recorded as “UNK” if unknown)• Diameter (cm) at point of intersection (or horizontal depth and vertical
height if odd-shaped)• Decay class (–5)
The staggered harvesting dates on the three blocks have created a complex measurement schedule, with planned measurement of lichen abundance oc-curring pre-harvest, 2.5 years post-harvest, 5.5 years post-harvest and then at 5-year increments (Table 2). The re-measurement of small trees and woody debris is planned for 0 years post-harvest.
TABLE 12 Schedule of lichen and stand structure measurements
Assessment yearBlock Pre-harvest 0.5 2.5 5.5 10.5 14.5
CP550-1treatment 1999 2003 2006 2011 2015 CP550-1control 2001 2003 2006 2011 2015 CP239-3 2000 & 2004 2007 2009 2012 2017 2021CP242-4 2000 & 2004 2006 2008 2011 2016 2020
4..4 Data analysis The pre-harvest lichen abundance and composition data have been compiled for each block, each harvesting treatment (opening and forest matrix) within the block, and each ecological stratum within the block (see Wintergreen Consultants reports Appendix ). These reports include summary tables detailing lichen class frequency by tree species, lichen genus composition, and stem density for the combined and separate ecological strata.
For each block, the frequency of lichen abundance classes pre-harvest were compared among ecological strata, among harvesting strata (openings and forest matrix), and among treatment strata (control and matrix forest) as per methods described by Stevenson et al. (998). Statistical tests were con-ducted using:
• the Kolmogrov–Smirnov two-sample test to identify statistically signifi-cant differences in the relative frequencies of different scores between two categories of data; and
• a two-sample difference of percentages test to identify statistically signifi-cant differences among the percentage of high-scoring trees (≥ class 2H) between strata.
Post-harvest analyses of treatment effects (harvesting) will include all three blocks and be done with the 5.5 and 0.5 year data, as shifts in lichen

20
abundance occur quite slowly. For these more complex data, logistic regres-sion based on the change in lichen abundance in the treatments will be used (Waterhouse et al. 2007).
Summary statistics were calculated for density (stems/ha) of Engelmann spruce and subalpine fir in four size classes:< .3 m tall, ≥ .3 m tall up to 7.4 cm dbh, ≥ 7.5–2.4 dbh, and ≥ 2.5 cm dbh. Basal area was calculated for all stems ≥ .3 m tall and for stems ≥ 2.5 cm dbh.
Age data were summarized and used to estimate minimum age of the three stands, based on the number of tree rings at breast height (20 cm). Age of increment cores that did not include the pith was increased from the ring count by the estimated number missing rings, determined from the focus of the arc of the innermost visible ring and the number of growth rings in a comparable length of the youngest visible portion of the core.
Coarse woody debris volume was calculated using the formula:
V = (π2∑d2)/8L
where: V = m3/ha; d = diameter of CWD (cm); L = total transect length (m)
4.2 Stand Stability
Michaela Waterhouse and Harold Armleder
4.2. Objectives
• Compare rates of treefall among (a) the forest matrix of each block, (b) the 0-m forested edges around openings, and (c) the forested controls.
• Compare rates of treefall on the perimeters among openings of different sizes.
• Describe the attributes of the treefall (decay class, size class, species, crown class, and direction of fall) at each assessment.
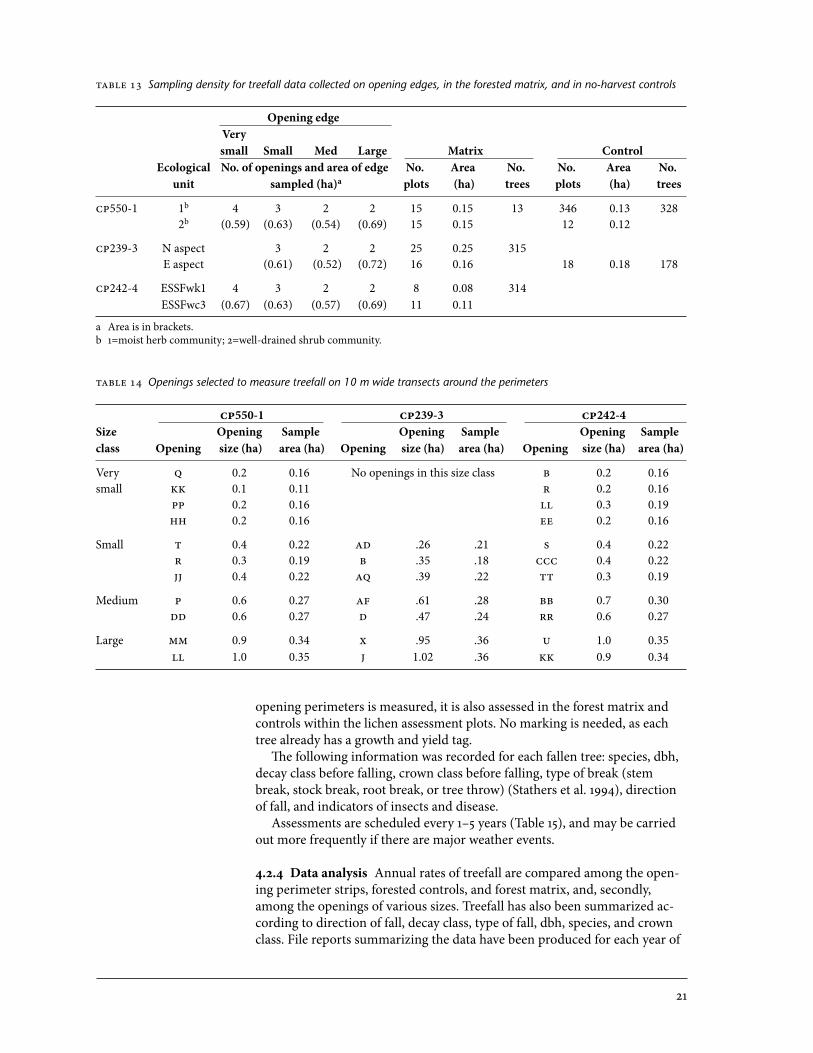
4.2.2 Layout Treefall following harvest is monitored in three blocks: CP550--, CP239-3, and CP242-4. In each block, the perimeter of group selection openings of various sizes, the forest matrix, and the controls are being exam-ined (Table 3). For each block, group selection openings in very small (0.–0.2 ha), small (0.3–0.4 ha), medium (0.5–0.7 ha), and large (0.8–.0 ha) size classes were randomly selected from the subset of openings that had been ecologically classified to provide approximately equal numbers in the main ecological strata (Table 3). The number of openings per size class var-ied, but an approximately equal area (0.5–0.7 ha) was sampled. All sample strips are 0 m in width from the tree boles on the opening edge into the for-est matrix. The openings where perimeters were assessed are shown in Figures 2, 3 and 4, and listed in Table 4.
In the forested matrix and no-harvest controls, fallen trees are measured in all the 0.-ha lichen plots (Figures 2, 3, and 4). The initial sample size of trees in the lichen plots is listed in Table 8.
4.2.3 Data collection methods Treefall was initially assessed 3–6 months (0.5 years) post-harvest, in a 0 m wide forested strip around the perimeter of each selected opening. In the strips around the openings, the bole of each fallen tree is painted with a blue “X” and an aluminum tag is stapled at the base of the tree. The tags are imprinted with the year and tree number. All fallen trees were mapped. In the first post-harvest assessment, trees that had fallen due to the harvesting process were discounted if there were marks and scars caused by chainsaws, and if sawdust was present. When treefall on the
2
opening perimeters is measured, it is also assessed in the forest matrix and controls within the lichen assessment plots. No marking is needed, as each tree already has a growth and yield tag.
The following information was recorded for each fallen tree: species, dbh, decay class before falling, crown class before falling, type of break (stem break, stock break, root break, or tree throw) (Stathers et al. 994), direction of fall, and indicators of insects and disease.
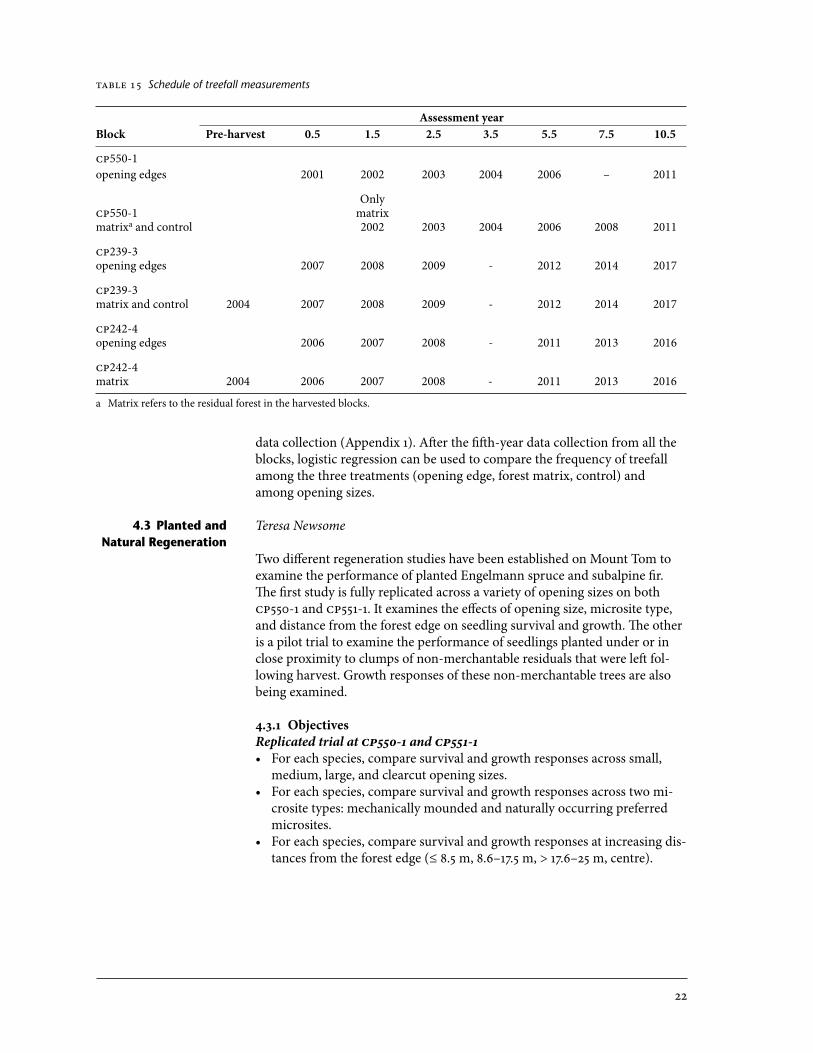
Assessments are scheduled every –5 years (Table 5), and may be carried out more frequently if there are major weather events.
4.2.4 Data analysis Annual rates of treefall are compared among the open-ing perimeter strips, forested controls, and forest matrix, and, secondly, among the openings of various sizes. Treefall has also been summarized ac-cording to direction of fall, decay class, type of fall, dbh, species, and crown class. File reports summarizing the data have been produced for each year of
TABLE 13 Sampling density for treefall data collected on opening edges, in the forested matrix, and in no-harvest controls
Opening edge Very small Small Med Large Matrix Control Ecological No. of openings and area of edge No. Area No. No. Area No. unit sampled (ha)a plots (ha) trees plots (ha) trees
CP550-1 1b 4 3 2 2 15 0.15 13 346 0.13 328 2b (0.59) (0.63) (0.54) (0.69) 15 0.15 12 0.12
CP239-3 N aspect 3 2 2 25 0.25 315 E aspect (0.61) (0.52) (0.72) 16 0.16 18 0.18 178
CP242-4 ESSFwk1 4 3 2 2 8 0.08 314 ESSFwc3 (0.67) (0.63) (0.57) (0.69) 11 0.11
a Area is in brackets.b =moist herb community; 2=well-drained shrub community.
TABLE 14 Openings selected to measure treefall on 10 m wide transects around the perimeters
CP550-1 CP239-3 CP242-4Size Opening Sample Opening Sample Opening Sampleclass Opening size (ha) area (ha) Opening size (ha) area (ha) Opening size (ha) area (ha)
Very Q 0.2 0.16 No openings in this size class B 0.2 0.16small KK 0.1 0.11 R 0.2 0.16 PP 0.2 0.16 LL 0.3 0.19 HH 0.2 0.16 EE 0.2 0.16
Small T 0.4 0.22 AD .26 .21 S 0.4 0.22 R 0.3 0.19 B .35 .18 CCC 0.4 0.22 JJ 0.4 0.22 AQ .39 .22 TT 0.3 0.19
Medium P 0.6 0.27 AF .61 .28 BB 0.7 0.30 DD 0.6 0.27 D .47 .24 RR 0.6 0.27
Large MM 0.9 0.34 X .95 .36 U 1.0 0.35 LL 1.0 0.35 J 1.02 .36 KK 0.9 0.34
22
data collection (Appendix ). After the fifth-year data collection from all the blocks, logistic regression can be used to compare the frequency of treefall among the three treatments (opening edge, forest matrix, control) and among opening sizes.
4.3 Planted and Natural Regeneration
Teresa Newsome
Two different regeneration studies have been established on Mount Tom to examine the performance of planted Engelmann spruce and subalpine fir. The first study is fully replicated across a variety of opening sizes on both CP550- and CP55-. It examines the effects of opening size, microsite type, and distance from the forest edge on seedling survival and growth. The other is a pilot trial to examine the performance of seedlings planted under or in close proximity to clumps of non-merchantable residuals that were left fol-lowing harvest. Growth responses of these non-merchantable trees are also being examined.
4.3. ObjectivesReplicated trial at CP550- and CP55-• For each species, compare survival and growth responses across small,
medium, large, and clearcut opening sizes.• For each species, compare survival and growth responses across two mi-
crosite types: mechanically mounded and naturally occurring preferred microsites.
• For each species, compare survival and growth responses at increasing dis-tances from the forest edge (≤ 8.5 m, 8.6–7.5 m, > 7.6–25 m, centre).
TABLE 15 Schedule of treefall measurements
Assessment yearBlock Pre-harvest 0.5 1.5 2.5 3.5 5.5 7.5 10.5
CP550-1opening edges 2001 2002 2003 2004 2006 – 2011
OnlyCP550-1 matrix matrixa and control 2002 2003 2004 2006 2008 2011
CP239-3opening edges 2007 2008 2009 - 2012 2014 2017
CP239-3matrix and control 2004 2007 2008 2009 - 2012 2014 2017
CP242-4opening edges 2006 2007 2008 - 2011 2013 2016
CP242-4matrix 2004 2006 2007 2008 - 2011 2013 2016
a Matrix refers to the residual forest in the harvested blocks.

23
Pilot trial• Monitor growth and condition of residuals in openings.• For each regeneration species, compare survival and growth of seedlings
planted around patches of residual trees.
4.3.2 Layout The replicated regeneration trial on CP550- and CP55- was established to determine the effects of three experimental factors:
• opening size (small, medium, large)• microsite (mechanical mounds, preferred natural microsite)• distance from edge (≤ 8.5 m, 8.6–7.5 m, 7.6–25 m, centre)
To accommodate these experimental factors, group selection openings were selected across four size classes: small (0.2–0.4 ha), medium (0.5–0.7 ha), large (≥ 0.85 ha), and clearcut (3.0–3.4 ha) to be representative of the dis-tribution of ecological strata on each cutblock. Planting treatments (mechanical mounds or preferred natural microsites) were randomly as-signed to openings in small, medium, and large size classes in the group selection openings, with an even distribution of each ecotype to the extent possible in each opening size class. Fewer openings existed in the large size class, and, as a result, only one opening was mounded at each of CP550- and CP55-. The sampling densities in CP550- and CP55- are reported in Tables 6 and 7, respectively. Clearcut openings were divided into northeast, south-east, southwest, and northwest quadrants, with mechanical mounding and
TABLE 16 Sampling densities for regeneration study at CP550-1 (not including residual openings)
Size Microsite Actual No. Ecologicalclass treatment Opening size (ha) seedlings stratuma
Small Natural preferred PP 0.2 108 1 B 0.3 131 1 AN 0.4 147 1 NN 0.4 146 2 Mechanical mound HH 0.2 71 2 R 0.3 130 1 JJ 0.4 121 1 T 0.4 146 2
Medium Natural preferred GG 0.6 154 1 I6 0.6 139 2 EE 0.6 150 2 S 0.7 103 1 Mechanical mound DD 0.6 141 2 E 0.7 116 1 I 0.7 124 nab
BA 0.7 161 2
Large Natural preferred LL 1.0 149 2 L 1.2 161 1 Mechanical mound N 0.9 154 1
Clearcut Natural preferred CC 3.0 296 1 Mechanical mound CC 3.0 132 1
a =moist herb community; 2=well-drained shrub community.b Not applicable

24
natural preferred microsite treatments assigned to diagonally positioned quadrants to provide equal exposure to north- and south-facing forest edges. The exception was the clearcut in CP550-, where mounding was restricted to one southern quadrant because the northern quadrants were too steep to allow safe excavator operation. The openings that were assigned to each treat-ment within CP550- and CP55- are shown in Figures 2 and 5, respectively.
Individual openings were laid out by locating a centre point and then es-tablishing radial transects from the centre to the forest edge, along which target seedlings could be selected in the four distance classes listed above. The centre point for the opening was located by visually approximating the point in an east–west direction, and from there, running a north–south tran-sect across the opening. The centre point of the north–south transect was considered to be the centre of the opening, and was marked with a .3-m alu-minum post. For small, medium, and large group selection openings, eight radial transects were established at 45o intervals (north, northeast, east, southeast, south, southwest, west, northwest) from the centre to the forest edge, with transect ends at the forest edge also being marked with .3 m alu-minum posts. For clearcut openings, 2 radial transects were distributed from the opening centre to the forest edge, with the result that three transects were located in each of the four microsite treatment quadrants. Schematic dia-grams illustrate the layout of the clearcut openings at CP550- (Figure 6) and CP 55- (Figure 7). The design in the clearcut was changed after the first year so that each of the microsite treatments in the CP550- clearcut had two addi-tional radial transects. Note that two POCs were established, one above the road and one below the road.
TABLE 17 Sampling densities for regeneration study at CP551-1 (not including residual openings)
Size Microsite Actual No. Ecologicalclass treatment Opening size (ha) seedlings stratuma
Small Natural preferred BB 0.29 122 1 CQ 0.31 140 2 CK 0.44 147 3 Mechanical mound AK 0.42 152 1 D 0.37 137 3
Medium Natural preferred W 0.56 164 1 CC 0.69 158 3 AN 0.64 146 2 Mechanical mound AO 0.57 148 2 CB 0.69 164 3 BF 0.6 164 1
Large Natural preferred BH 0.85 164 1 BC 0.85 152 2 CE 0.98 164 2 Mechanical mound BI 0.87 136 1
Clearcut Natural preferred X 3.35 398 3 Mechanical mound X 3.35 398 3
a =moist herb community; 2=well-drained shrub community; 3=mosaic of herb and shrub patches.

25
FIGURE 5 Layout of CP551-1 showing planted stock openings.

26
�����������
����
��
� �
�
���������������
���������������
������������
����������������������������������������������������������������������������������� �������������
�����
���������
���������
�����
����
���� ����
�����
�����
������
�����
������� ������������� ������������������������������� �����������������������������������
FIGURE 6 Schematic diagram of layout in the clearcut opening at CP550-1.
FIGURE 7 Schematic diagram of layout in the clearcut opening at CP551-1.

27
In each opening, target seedlings were selected along each radial transect, starting at the forest edge and moving towards the centre. Within each of the four distance classes, seedlings were selected within 7 m to either side of the radial transect. For mounded openings, the allowable distance from transects was increased as necessary to accommodate the fact that mounds were not regularly distributed. Sections of transects that ran through slash piles or roads were not used. The sampling density goal was three target seedlings of each species in each distance class along each radial transect, plus 0 seed-lings of each species at the centre of group selection openings and 30 seedlings of each species per treatment in the centres of clearcuts, which would result in a total of 64 seedlings in individual group selection openings and a total of 204 seedlings in each clearcut opening. This target sampling density was not consistently achieved because (a) there were not always enough seedlings within the prescribed distance from the transect, especially if the transect ran through slash piles, (b) the 7.6–25 m distance class did not exist for small openings, (c) for some medium openings, the 7.6–25 m dis-tance class extended so far that it reduced the number of seedlings that could be selected for the centre class, and (d) at CP550- the mounding treatment could be completed only in one quadrant of the 3-ha opening.
Theoretically, the pilot trial layout was intended to be similar to the repli-cated trial, with residual clumps of non-merchantable stems distributed evenly across opening sizes and ecological strata. However, the number of small non-merchantable stems was not uniform across either site. On CP550-, four openings (two small, one medium, and one large) were selected for long-term assessment and clumps within each opening with two or more re-sidual stems were selected for monitoring. Damage to residual trees was high in small openings at CP550- because of the limited area available for harvest machinery to manoeuvre. Therefore, a decision was made to limit the residu-al patch treatment at CP55- to the medium and large openings. The clumps of residuals that were selected were also larger so that the inner trees were undamaged. On both CP550- and CP55-, a range of sizes of residual trees within each clump were selected for assessment, and were tagged with a nail or with wires for smaller stems. Where residual trees were tall enough, dbh was marked with blue paint. Seedlings were planted in pre-determined loca-tions around and through the clumps of trees on all openings where the residual treatments were established.
All seedlings that had been selected to be part of the study were marked with pigtail wires, which were tagged with pre-numbered aluminum tags that were not necessarily selected in sequential order. Subalpine fir pigtails were flagged with blue “MoF” tape, and spruce pigtails were flagged with orange “MoF” tape. In 2008, live seedlings were mapped to facilitate relocation in the 0th-year assessment. The location of seedlings along transects was re-corded as the distance from the timber edge (where an aluminum stake marked the beginning of each row), and the distance and direction from the transect, at right angles from the transect. For each residual patch, a stump in close proximity was spray painted blue and marked with a large spike and an aluminum tag. Seedling location was then recorded as distance and bearing to the stump. Tables 7 and 8 show the sample sizes for planted and residual trees.
28
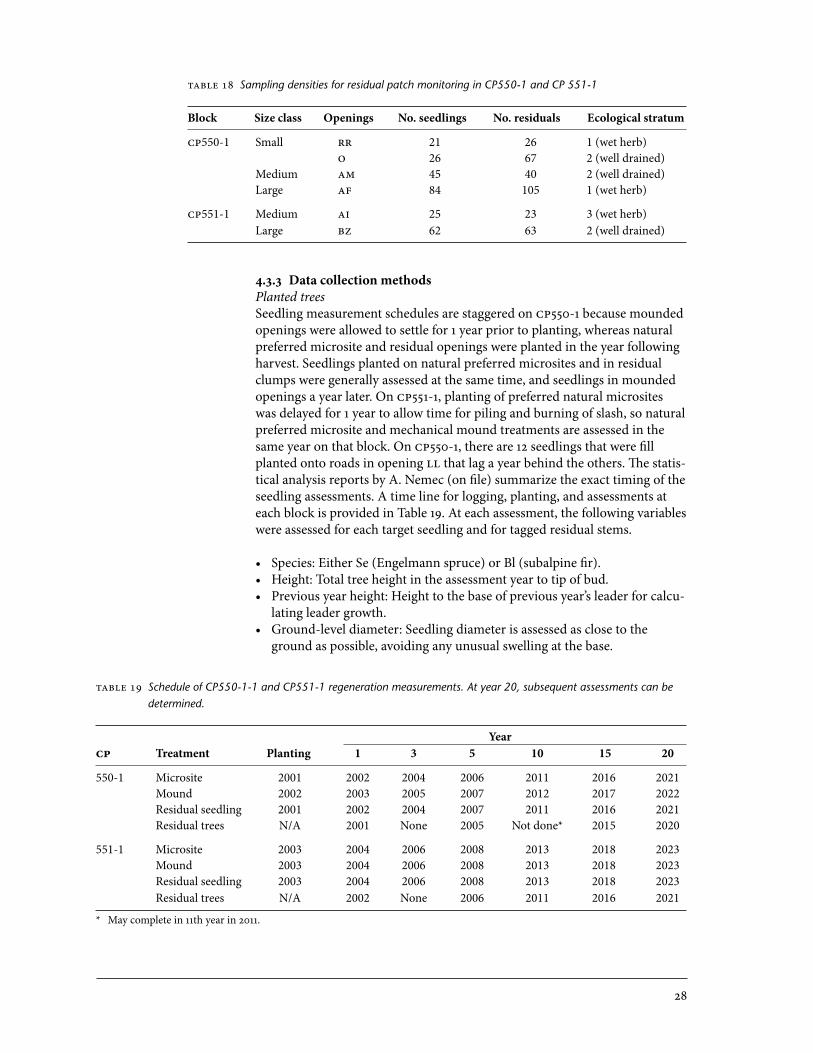
4.3.3 Data collection methodsPlanted treesSeedling measurement schedules are staggered on CP550- because mounded openings were allowed to settle for year prior to planting, whereas natural preferred microsite and residual openings were planted in the year following harvest. Seedlings planted on natural preferred microsites and in residual clumps were generally assessed at the same time, and seedlings in mounded openings a year later. On CP55-, planting of preferred natural microsites was delayed for year to allow time for piling and burning of slash, so natural preferred microsite and mechanical mound treatments are assessed in the same year on that block. On CP550-, there are 2 seedlings that were fill planted onto roads in opening LL that lag a year behind the others. The statis-tical analysis reports by A. Nemec (on file) summarize the exact timing of the seedling assessments. A time line for logging, planting, and assessments at each block is provided in Table 9. At each assessment, the following variables were assessed for each target seedling and for tagged residual stems.
• Species: Either Se (Engelmann spruce) or Bl (subalpine fir).• Height: Total tree height in the assessment year to tip of bud.• Previous year height: Height to the base of previous year’s leader for calcu-
lating leader growth. • Ground-level diameter: Seedling diameter is assessed as close to the
ground as possible, avoiding any unusual swelling at the base.
TABLE 19 Schedule of CP550-1-1 and CP551-1 regeneration measurements. At year 20, subsequent assessments can be determined.
Year CP Treatment Planting 1 3 5 10 15 20
550-1 Microsite 2001 2002 2004 2006 2011 2016 2021 Mound 2002 2003 2005 2007 2012 2017 2022 Residual seedling 2001 2002 2004 2007 2011 2016 2021 Residual trees N/A 2001 None 2005 Not done* 2015 2020
551-1 Microsite 2003 2004 2006 2008 2013 2018 2023 Mound 2003 2004 2006 2008 2013 2018 2023 Residual seedling 2003 2004 2006 2008 2013 2018 2023 Residual trees N/A 2002 None 2006 2011 2016 2021
* May complete in th year in 20.
TABLE 18 Sampling densities for residual patch monitoring in CP550-1 and CP 551-1
Block Size class Openings No. seedlings No. residuals Ecological stratum
CP550-1 Small RR 21 26 1 (wet herb) O 26 67 2 (well drained) Medium AM 45 40 2 (well drained) Large AF 84 105 1 (wet herb)
CP551-1 Medium AI 25 23 3 (wet herb) Large BZ 62 63 2 (well drained)

29
• Vigour: Tree vigour is recorded as good, moderate, poor, moribund, dead, or missing. See Appendix 3 for definitions.
• Overtopping class: An estimate of vegetation competition was recorded as overtopped, threatened, or free of vegetation. See Appendix 3 for defini-tions.
• Damage and damage cause: Damage is assessed for the foliage (FD), leader (LD), and stem (SD), and the cause of the damage is also recorded. If there are multiple damaging agents, the worst damage is recorded (i.e., damage that most seriously affects conifer development). See Appendix 3 for defi-nitions.
In addition to the preceding variables, the following data are being collect-ed for the residual trees according to the measurement schedule (Table 9):
• Diameter at breast height (dbh): For trees > .3 m tall, dbh was assessed at .3 m above the high side of the tree, according to the growth and yield guidelines. The measurement point was marked either by a nail placed just below .3 m or by a paint pen line at .3 m for trees too small to take a nail. Ground-level diameter was also recorded for all trees, as described above.
• Crown width: Diameter of the crown was obtained by measuring the crown width in the north–south and east–west direction.
4.3.4 Data analysis Analysis of variance (ANOVA) is used to analyze all vari-ables. Data from CP550- and CP55- were analyzed separately in years , 3, and 5, using the following experimental levels: opening size, microsite treat-ment, and distance from edge. In year 5, ANOVA was also carried out across the two blocks, with block as an additional experimental level. The Bonferro-ni test was used for mean separation. Summary statistics are also calculated for all variables, by the experimental levels described above. For categorical variables, observations are summarized by frequency and percentage accord-ing to the same experimental levels.
4.4 Understorey Vegetation
Teresa Newsome
The vegetation project was conducted in CP550- and CP55- and has two components. The first component involves permanent vegetation plots and is aimed at examining the effects of harvest treatments on vegetation develop-ment. Data were collected both pre- and post-harvest. The second component is aimed at characterizing competing vegetation development within a 50 cm radius of planted seedlings as an aid to explaining survival and growth re-sponses.
4.4. ObjectivesFor permanent vegetation plots
• Describe understorey vegetation pre-harvest.• Compare vegetation responses across small, medium, large, and clearcut
opening sizes.• Compare vegetation responses across three ecological strata (moist herb,
well-drained shrub, mosaic).• Compare vegetation responses at increasing distances from the forest edge
(≤ 8.5 m, 8.6-7.5 m, > 7.5 m, at centre).
30
For seedling-centred plots
• Characterize neighbouring and overtopping vegetation within 50 cm of planted seedlings on mechanically mounded, preferred natural, and resid-ual patch microsites.
4.4.2 Layout4.4.2. Permanent vegetation plots The protocol for establishing permanent vegetation measurement plots changed three times as the project progressed due to unforeseen difficulties in relocating plots post-harvest due to slash loads in some openings. As a result, there are differences in layout of vegeta-tion plots within CP550- pre- and post-harvest. On CP55- pre-harvest layout differs but all post-harvest layout is the same.
Pre-harvest vegetation plotsIn CP550-, pre-harvest vegetation plots were established in six group selec-tion openings (two in each of the small, medium, and large size classes). In each opening, plots were established along a north–south transect at distances of 5 and 0 m from each of the north and south edges, and at the centre, for a total of five plots in each opening. Plots were 0 m2 in area (radius of .78 m) except for the centre plot, which was 50 m2 (radius of 3.99 m). Due to diffi-culties in locating the vegetation plots in three of the openings after logging, the pre-harvest protocol for CP55- had to be quickly changed, as the data collection contract was in progress. We decided to establish one 00-m2 (5.64 m radius) plot at the centre of selected openings, where it could be easily re-located. This provided an approximate description of pre-harvest vegetation, but did not provide for subsequent post-harvest description of vegetation de-velopment at stand edges. Therefore, the following post-harvest protocol was developed.
Post-harvest vegetation plotsThe three openings (I, GG, and MM) where the vegetation plots could be relo-cated in CP550- have been continued using the original protocol described in the pre-harvest section above. In openings II, B, and BD, the plots could not be relocated. Opening BD was dropped and replaced with AH. Vegetation plots were established on these three openings using a revised protocol. The same revised protocol was used on the six openings that were sampled pre-harvest on CP55-. The revised protocol entailed establishing four 50-m2 (3.99 m radius) plots in each opening along a north–south transect that passed through the opening centre: one at the centre of the opening (which on CP55- was established pre-harvest but where the plot was larger [5.64 m radius]), one 6 m from the north timber edges, one 6 m from the south tim-ber edge, and one 0 m into the adjacent forest from the opening edge (i.e., 6 m due north of the northernmost opening plot). The forest plot was re-quired to be of the same ecological stratum as the opening, and was shifted in position if this was not the case. Where seedling and vegetation monitoring were taking place in the same opening, the vegetation plots were offset up to 0 m to avoid the potential for vegetation to be trampled during seedling as-sessments. Plot centres were marked with .3-m aluminum poles spray painted blue at the top. To facilitate relocation, GPS co-ordinates were record-ed for each vegetation plot centre. To further assist in relocation of centre plots, a spike was driven into a stump outside of the centre plot area, and was
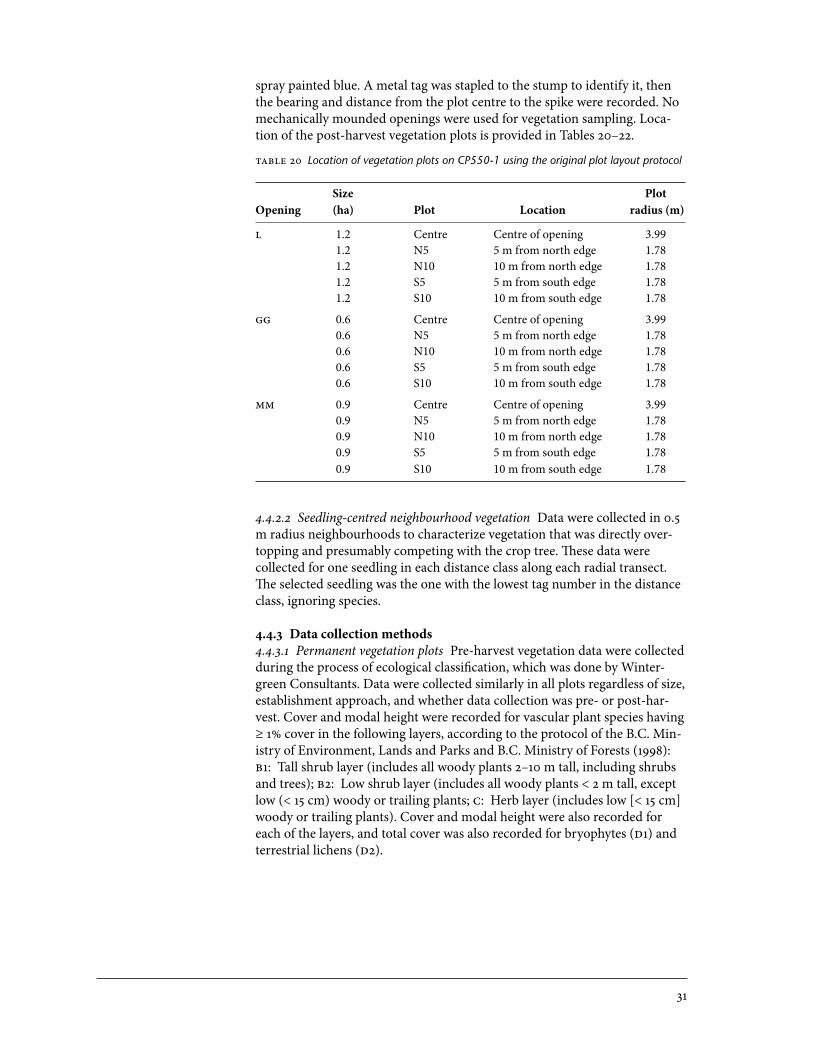
3
TABLE 20 Location of vegetation plots on CP550-1 using the original plot layout protocol
Size PlotOpening (ha) Plot Location radius (m)
L 1.2 Centre Centre of opening 3.99 1.2 N5 5 m from north edge 1.78 1.2 N10 10 m from north edge 1.78 1.2 S5 5 m from south edge 1.78 1.2 S10 10 m from south edge 1.78
GG 0.6 Centre Centre of opening 3.99 0.6 N5 5 m from north edge 1.78 0.6 N10 10 m from north edge 1.78 0.6 S5 5 m from south edge 1.78 0.6 S10 10 m from south edge 1.78
MM 0.9 Centre Centre of opening 3.99 0.9 N5 5 m from north edge 1.78 0.9 N10 10 m from north edge 1.78 0.9 S5 5 m from south edge 1.78 0.9 S10 10 m from south edge 1.78
4.4.2.2 Seedling-centred neighbourhood vegetation Data were collected in 0.5 m radius neighbourhoods to characterize vegetation that was directly over-topping and presumably competing with the crop tree. These data were collected for one seedling in each distance class along each radial transect. The selected seedling was the one with the lowest tag number in the distance class, ignoring species.
4.4.3 Data collection methods 4.4.3. Permanent vegetation plots Pre-harvest vegetation data were collected during the process of ecological classification, which was done by Winter-green Consultants. Data were collected similarly in all plots regardless of size, establishment approach, and whether data collection was pre- or post-har-vest. Cover and modal height were recorded for vascular plant species having ≥ % cover in the following layers, according to the protocol of the B.C. Min-istry of Environment, Lands and Parks and B.C. Ministry of Forests (998): B: Tall shrub layer (includes all woody plants 2–0 m tall, including shrubs and trees); B2: Low shrub layer (includes all woody plants < 2 m tall, except low (< 5 cm) woody or trailing plants; C: Herb layer (includes low [< 5 cm] woody or trailing plants). Cover and modal height were also recorded for each of the layers, and total cover was also recorded for bryophytes (D) and terrestrial lichens (D2).
spray painted blue. A metal tag was stapled to the stump to identify it, then the bearing and distance from the plot centre to the spike were recorded. No mechanically mounded openings were used for vegetation sampling. Loca-tion of the post-harvest vegetation plots is provided in Tables 20–22.
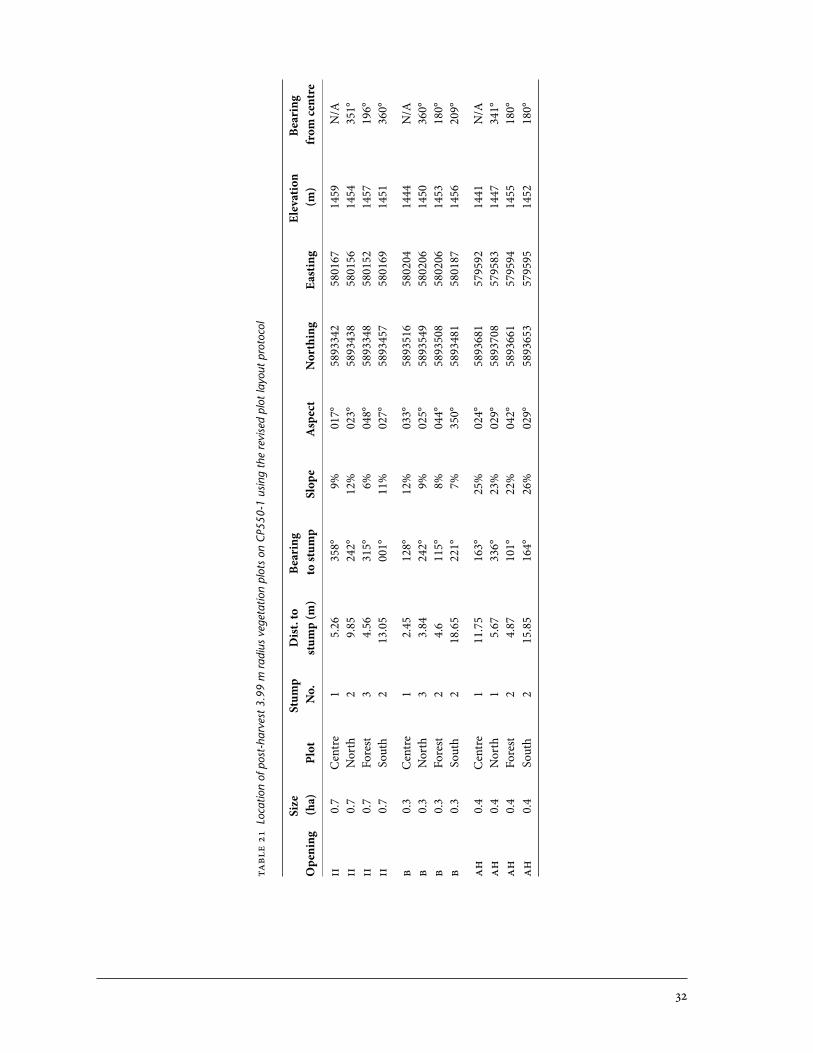
32
TABL
E 21
Loc
atio
n of
pos
t-ha
rves
t 3.
99 m
rad
ius
vege
tatio
n pl
ots
on C
P550
-1 u
sing
the
rev
ised
plo
t la
yout
pro
toco
l
Si
ze
St
ump
Dis
t. to
B
eari
ng
Elev
atio
n B
eari
ngO
peni
ng
(ha)
Pl
ot
No.
st
ump
(m)
to st
ump
Slop
e A
spec
t N
orth
ing
East
ing
(m)
from
cen
tre
II
0.7
Cen
tre
1 5.
26
358°
9%
01
7°
5893
342
5801
67
1459
N
/AII
0.
7 N
orth
2
9.85
24
2°
12%
02
3°
5893
438
5801
56
1454
35
1°II
0.
7 Fo
rest
3
4.56
31
5°
6%
048°
58
9334
8 58
0152
14
57
196°
II
0.7
Sout
h 2
13.0
5 00
1°
11%
02
7°
5893
457
5801
69
1451
36
0°
B 0.
3 C
entr
e 1
2.45
12
8°
12%
03
3°
5893
516
5802
04
1444
N
/AB
0.3
Nor
th
3 3.
84
242°
9%
02
5°
5893
549
5802
06
1450
36
0°B
0.3
Fore
st
2 4.
6 11
5°
8%
044°
58
9350
8 58
0206
14
53
180°
B 0.
3 So
uth
2 18
.65
221°
7%
35
0°
5893
481
5801
87
1456
20
9°
AH
0.4
Cen
tre
1 11
.75
163°
25
%
024°
58
9368
1 57
9592
14
41
N/A
AH
0.4
Nor
th
1 5.
67
336°
23
%
029°
58
9370
8 57
9583
14
47
341°
AH
0.4
Fore
st
2 4.
87
101°
22
%
042°
58
9366
1 57
9594
14
55
180°
AH
0.4
Sout
h 2
15.8
5 16
4°
26%
02
9°
5893
653
5795
95
1452
18
0°
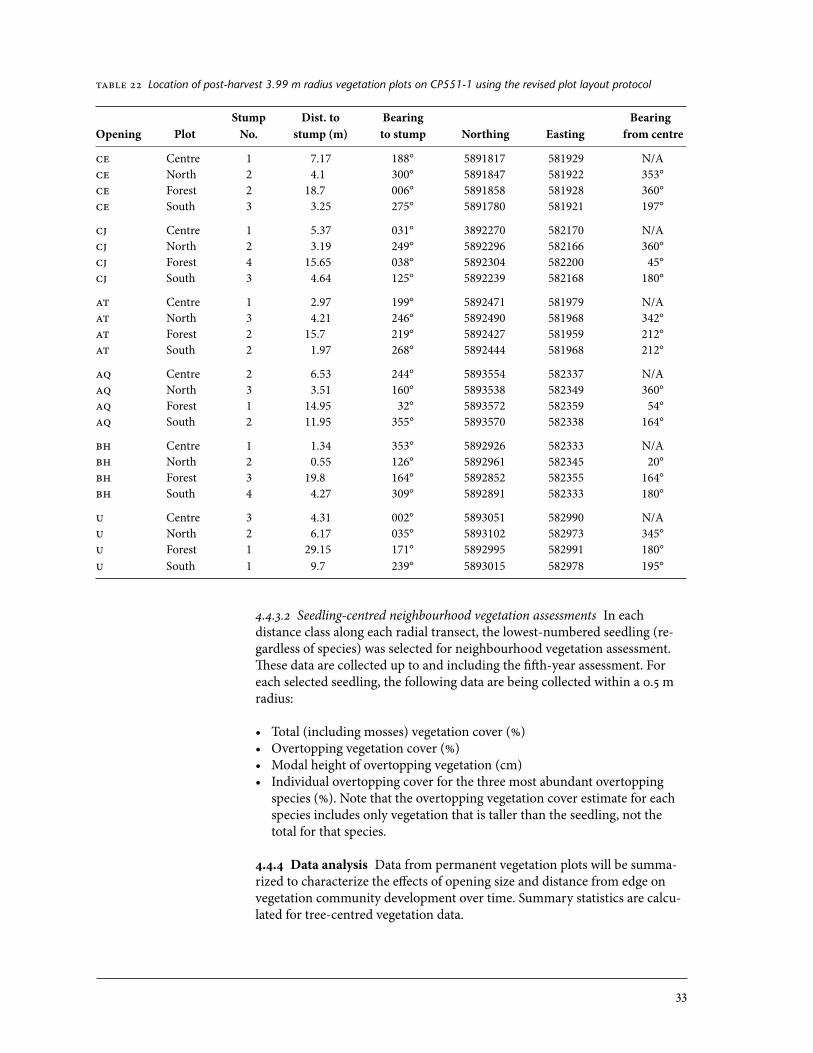
33
4.4.3.2 Seedling-centred neighbourhood vegetation assessments In each distance class along each radial transect, the lowest-numbered seedling (re-gardless of species) was selected for neighbourhood vegetation assessment. These data are collected up to and including the fifth-year assessment. For each selected seedling, the following data are being collected within a 0.5 m radius:
• Total (including mosses) vegetation cover (%)• Overtopping vegetation cover (%)• Modal height of overtopping vegetation (cm)• Individual overtopping cover for the three most abundant overtopping
species (%). Note that the overtopping vegetation cover estimate for each species includes only vegetation that is taller than the seedling, not the total for that species.
4.4.4 Data analysis Data from permanent vegetation plots will be summa-rized to characterize the effects of opening size and distance from edge on vegetation community development over time. Summary statistics are calcu-lated for tree-centred vegetation data.
TABLE 22 Location of post-harvest 3.99 m radius vegetation plots on CP551-1 using the revised plot layout protocol
Stump Dist. to Bearing BearingOpening Plot No. stump (m) to stump Northing Easting from centre
CE Centre 1 7.17 188° 5891817 581929 N/ACE North 2 4.1 300° 5891847 581922 353°CE Forest 2 18.7 006° 5891858 581928 360°CE South 3 3.25 275° 5891780 581921 197°
CJ Centre 1 5.37 031° 3892270 582170 N/ACJ North 2 3.19 249° 5892296 582166 360°CJ Forest 4 15.65 038° 5892304 582200 45°CJ South 3 4.64 125° 5892239 582168 180°
AT Centre 1 2.97 199° 5892471 581979 N/AAT North 3 4.21 246° 5892490 581968 342°AT Forest 2 15.7 219° 5892427 581959 212°AT South 2 1.97 268° 5892444 581968 212°
AQ Centre 2 6.53 244° 5893554 582337 N/AAQ North 3 3.51 160° 5893538 582349 360°AQ Forest 1 14.95 32° 5893572 582359 54°AQ South 2 11.95 355° 5893570 582338 164°
BH Centre 1 1.34 353° 5892926 582333 N/ABH North 2 0.55 126° 5892961 582345 20°BH Forest 3 19.8 164° 5892852 582355 164°BH South 4 4.27 309° 5892891 582333 180°
U Centre 3 4.31 002° 5893051 582990 N/AU North 2 6.17 035° 5893102 582973 345°U Forest 1 29.15 171° 5892995 582991 180°U South 1 9.7 239° 5893015 582978 195°

34
4.5 Snow Accumulation and
Ablation
Pat Teti
4.5. Objectives
• Compare pre-harvest (a) snow accumulation, (b) ablation rates, and (c) snow density on north and south aspects (over 3 years prior to harvest).
• Compare post-harvest (a) snow accumulation, (b) ablation rates, and (c) snow density on north and south aspects (over 3 years after harvest).
• Develop models for peak snow accumulation, snow ablation rate, and date of snow disappearance as functions of canopy properties, topographic as-pect, and group selection treatment.
4.5.2 Layout Two snow survey plots were established in CP242-4, one on a north-facing slope and one on a south-facing slope (Figure 4). Details are de-scribed in file reports by P. Teti (Appendix ). Each of the two snow plots are 8 ha in area, consisting of a grid of permanent reference points. Due to the large plot size in relation to the harvesting pattern, each plot includes repre-sentative areas of openings and unlogged forest. Points were established at 0-m intervals along six east–west lines. Each line is 400 m long and separat-ed from adjacent lines by 40 m. Each point is a tree that had been marked (metal tag and blue spray paint), and for which differential GPS co-ordinates were recorded. Snow depth was measured at an offset from the tree in order to avoid bias.
4.5.3 Data collection methods At each of the two snow survey plots, re-peated measures of snow depth were made at each point in each plot through the spring for 5 years before logging and 2 years after logging. Snow density was measured in snow pits in each plot during each snow survey to deter-mine snow water equivalent (SWE).
Snow surveys were repeated five or six times between early April and early June of each sample year. Snow surveys consisted of measuring and recording snow depth at every point in each plot, as well as density in several represent-ative snow pits in each plot.
Hemispherical photos taken before and after partial harvesting (2003 and 2006) were used as the basis for calculating a variety of canopy gap and radi-ation parameters. These included canopy gap within 30 degrees of the zenith, sky view factor (an index of long-wave radiation exchange), and direct and diffuse solar radiation transmittances. These will be compared with peak snow accumulation and snow ablation rates. Pre-logging basal area (prism sweep) surveys were completed for the south plot.
4.5.4 Data analysisSnow accumulation and ablationCanopy gap and radiation data were calculated using hemispherical photos taken pre- and post-harvest (2003 and 2006) (see Sagar report Appendix ).
Differences between plotsLarge differences are expected between plots in average peak snow water equivalent, average ablation rate, and average snow-free dates because of the effect of aspect. These contrasts will be made for the pre-logging and post-logging periods. The effects of logging will be separately analyzed for the north- and south-facing slopes.

35
Differences within plotsThe objective of the project is to determine the average effects of the logging treatment on the response variables, and also to determine the degree to which changes in the dependent variables at individual points can be ex-plained by changes in the independent variables at individual points.
High inter-annual variability in peak snow accumulation and date of snow disappearance are expected. Therefore, response variables will be either standardized within years, or years of snow data will be analyzed separately. The major treatment effects are expected to be changes in peak snow depth, snow water equivalent, and time of snow disappearance at points that fall within openings. For each plot, response variables at each point will be:
• Standardized peak snow depths before and after logging, • Standardized peak snow water equivalent before and after logging, • Snow ablation rate before and after logging, and• Average dates of snow disappearance before and after logging.
The independent variables at each point will be:
• Logged (true or false), • Overhead canopy densities before and after logging, and• Solar radiation transmittance during the ablation season before and after
logging.
4.6 Microclimate Monitoring
Teresa Newsome and Bob Sagar
4.6. Objectives
• Measure the general climate variables (air temperature, soil temperature, and growing-season precipitation) in one .0-ha opening at each of CP550- and CP55-.
• Measure wind velocity and direction in the .0-ha opening in CP550-.• Measure the rooting-zone soil temperature (0.5 m depth) and shoot-
height air temperature (0.5 m height) in the same .0-ha openings in CP550- and CP55-.
• Use climate and microclimate data to interpret experimental results.
4.6.2 Layout Automated weather stations for monitoring microclimate were located in two .0-ha openings within the Mount Tom research trials. The first weather station, designated as MT, was located at an elevation of 460 m in opening LL, on a gentle north-facing slope in CP550-. The second weather station, designated as MT2, was located at an elevation of 585 m in opening CE, on a moderate west-facing slope in CP55-. A third weather station, des-ignated as MTWND, for measuring windspeed and wind direction, was located in opening LL near the MT site. Both openings were roughly rectan-gular in shape with long axes orienting up and down the slope. The weather stations were located about one-half to two-thirds of the way up each block along the plot centre line. The MT and MTWND weather stations were in-stalled on 24 and 25 July 200, while the MT2 weather station was installed on 20 July 2002.
The measurements being made at each weather station consisted of near-ground air temperature at 5 cm aboveground, air temperature at

36
approximately .3 m aboveground (either unshielded or in a standard Steven-son screen), soil temperature at 5 cm beneath the mineral-organic interface, and rainfall. Near-ground air temperature and 5-cm soil temperature meas-urements were each replicated four times at MT and MT2.
Air temperature was measured with 30 AWG Chromel-Constantan (Omega Engineering Inc., Laval, Quebec), twisted and soldered fine-wire thermocouples with effective diameters of 0.5 mm. At MT, near-ground air temperature measurements were also made with thermistors (configured as Campbell Scientific, model 07 sensors) located in close proximity (within 0 cm) to the fine-wire thermocouples in order to compare the two sensor types. The thermistors were potted in epoxy and had an effective diameter of 5 mm. Both sensors types were unshielded for the near-ground air tempera-ture measurements. Air temperature at .3 m above the ground was measured inside of a standard white Stevenson Screen at the MT site and was unshield-ed at the MT2 site. An unshielded fine-wire thermocouple, .3 m above the ground, was added at MT on 3 June 2005 to allow better comparison with the MT2 site.
Initially, thermistors identical to those used for air temperature measure-ment were installed at both sites to measure soil temperature. Over the first 4 years of this study, many of these thermistors began failing due to cracking of the epoxy surrounding the electronic components. All the soil temperature thermistors were replaced with thermocouples on 3 June 2005. The soil thermocouples were twisted and soldered thermocouples (24 AWG Chromel- Constantan) placed in a 3 cm long piece of 6-mm brass tubing and encased in epoxy resin.
Rainfall was measured at the MT and MT2 sites with tipping bucket rain-gauges (Texas Electronics, Dallas, Texas, Model 525M) mounted on wooden posts approximately m above the ground.
The wind monitoring station was located near the centre of opening LL. Instruments consisting of a wind vane and cup anemometer (Met One, Grants Pass, Oregon) were mounted at approximately 9. m above the ground on a three-sided, galvanized steel tower (Radio Shack Inc.). The sensors were affixed to steel pipes that had been bolted to the tower and extended horizon-tally about m from the tower.
In 2007, a University of Northern British Columbia graduate student under Stephan Dery installed several meteorological monitoring installations in CP242-4. A meteorological tower was installed in opening G (at 0U 0589270E 5894506N) and lysimeters were set up in openings D and DDD.
4.6.3 Data collection methods Every year since installation, data were col-lected using CR0X dataloggers and SM92 storage modules (Campbell Scientific Canada Corp., Edmonton, Alberta). The dataloggers at the MT and MT2 sites took readings of all sensors once per minute during the summer and once every 5 or 0 minutes during the winter. Daily maximum, mini-mum, and average values were recorded for all temperature sensors, and daily totals were recorded for the raingauges. Stations were visited three times per growing season for sensor maintenance and data downloading, typically in early June, late July, and late September.
Measurements were logged once per second at the MTWND site and gener-al statistics were based on one-minute wind runs. These included hourly averages of windspeed and direction, daily maximum and mean windspeeds, and daily histograms (eight direction classes) of wind direction. It is impor-

37
tant to note the distinction between maximum windspeeds based on -minute wind runs, and those based on “instantaneous” (-second) readings. Instantaneous readings are generally .5–2.5 times higher than those based on -minute wind runs. One-minute wind runs are effectively an average of all the peak gusts and lulls that occurred during the minute.
The datalogger was programmed to take more detailed measurements in cases of extreme wind events or gust events. The threshold for beginning de-tailed measurements was set to a minimum -second windspeed of 72 km/hr. The data collected included summaries of minimum, maximum, and average windspeed, and average wind direction for each minute. This rapid data col-lection continued until the -second windspeed had not exceeded the 72 km/hr threshold for a period of hour. At the end of this hour, an additional array consisting of 250 seconds of -second windspeed and direction data was stored by the datalogger. This array was centred on the highest -second gust during the wind event. For the purpose of this analysis, one extreme wind event was separated from the next when 6 hours or longer had elapsed since the end of the last intense data collection period.
Data will continue to be collected annually until the trees planted in CP55- reach year 0 in 203. At that point the schedule for further assess-ments will be evaluated.
The University of Northern British Columbia meteorological tower in opening G measures snow depth, air temperature, relative humidity, soil tem-perature, precipitation in summer, shortwave radiation, windspeed, and wind direction. The lysimeters in openings D and DDD measured snowmelt runoff from the 2008–2009 winter season. Shortwave radiation was also measured in openings D and DDD from January through June 2008.
4.6.4 Data analysis From the data collected, the following variables of interest were derived: snow cessation date, total growing-season rainfall, occurrence of growing-season frost events (< 0°C and < -4°C), extreme mini-mum air temperatures, and growing degree days based on air and soil temperatures.
Snow cessation dates are determined by examining the diurnal temperature range as measured by the 5-cm air temperatures at each post. Snow-covered sensors have a small diurnal temperature range with temperatures at or below 0°C. When snowmelt exposes the sensor to the air, there is a sudden increase in the diurnal temperature range, with temperatures above 0°C being possi-ble. The date when this occurs is called the snow cessation date. Since the sensors were at 5 cm above the ground, the actual snow-free date at a given location will be later. For this study, snow cessation dates were determined based on temperature data from each post and then averaged to obtain a treatment mean. Snow cessation dates have a bearing on when the effective growing season starts at a given location and may influence budburst dates.
Analysis of air temperature data focussed on growing-season microclimate conditions at the sites. The growing season was defined as the period between June and 5 September each year. Seedlings are especially susceptible to frost during the bud flushing period, which generally occurs during the peri-od 5 June to 5 July at these sites. The primary variable of interest is daily minimum 5-cm air temperature at each of the measurement posts. Total numbers of frosts (Ta < 0°C) and severe frosts (Ta < -4°C) were tabulated for the periods of interest on a treatment average basis.

38
Growing degree days (GDD) based on the daily average 5-cm air tempera-ture (averaged over the four posts at each site) is calculated using a 5°C threshold. Using daily mean soil temperatures, the soil temperature index (STI) is calculated in the same way as for growing degree days. The STI for a particular day is the total degrees that the daily average soil temperature ex-ceeds a threshold temperature. For example, if a 5°C threshold was set and the daily average temperature was 7°C, then the STI equals 2 for the day. The temperature threshold used in this analysis was 5°C. The name STI has been used here to avoid the assumption that the index is related to seedling growth and phenology. The STI integrates such factors as solar irradiance, near-ground air temperature, snow-free season, and soil physical properties. These factors may affect seedling growth and survival; however, no growth effect should be inferred based on the STI alone.
Annual and summary reports have been prepared by R. Sagar (Appendix ).
5 EXTENSION
The Mount Tom trial has been set up for formal and informal extension op-portunities. Informational signs describing the project and showing the layout have been set up on CP550--, CP239-3, and CP242-4. Direction signs and openings signs were also posted on research openings in CP550-, CP55-, CP239-3, and CP242-4. A signed demonstration trail was installed in CP550- to show the various treatments (Figure 2). The trail is used annually to dis-cuss forestry and wildlife issues with students from high school and university, and with technical and professional forestry staff. Annual meet-ings are held between the project partners to exchange information and plan project activities. An extension note (Armleder et al. 2002) and journal arti-cle (Armleder and Waterhouse 200) have been published about the project.
6 REFERENCES
Armleder, H.M, S.K. Stevenson, and S.D. Walker. 992. Estimating the abun-dance of arboreal forage lichens. B.C. Min. For., Victoria, B.C. Land Manag. Handb. Field Guide Insert 7.
Armleder, H.M. and M.J. Waterhouse. 200. Habitat management for a spe-cies at risk: the Mount Tom adaptive management project. BC Forest Professional 7 (): 20–2. www.abcfp.ca/publications_forms/documents/BCFP-200-_MountainCaribou.pdf (Accessed Feb. 20).
Armleder, H.M., M.J. Waterhouse, T.A. Newsome, P. Teti, and K. Soneff. 2002. Mount Tom adaptive management project overview: Quesnel Highland alternative silvicultural systems. B.C. Min. For., Res. Br., Vic-toria, B.C. Cariboo Forest Region Exten. Note 37.

39
B.C. Ministry of Environment, Lands and Parks and B.C. Ministry of Forests. 998. Field Manual for describing terrestrial ecosystems. Land Manag. Handb. 25. http://archive.ilmb.gov.bc.ca/risc/pubs/teecolo/fmdte/ cwd.htm (Accessed Feb. 20).
Farnden, C. 994. Forest regeneration in the ESSF zone of north-central Brit-ish Columbia. Can. For. Serv., Pac. For. Cen., Inform. Rep. BC-X-35.
Golding, D.L. and R.H. Swanson. 978. Snow accumulation and melt in small forest openings in Alberta. Can. J. For. Res. 8(4): 380–388.
Hatter, I. 2006. Mountain caribou 2006 survey results, subpopulation trends and extinction risk. Draft. B.C. Min. Environ., Victoria, B.C. www.env.gov.bc.ca/wld/speciesconservation/mc/files/MC_2006_Populaton_ Survey.pdf (Accessed Feb. 20).
Kattlemann, R.C., N.H. Berg, and J. Rector. 983. The potential for increasing streamflow from Sierra Nevada watersheds. Water Res. Bull. 9(3): 395–40.
Newsome, T.A., H.M. Armleder, M.J. Waterhouse, and O.A. Steen. 2000a. Fifth year results from group selection harvesting in the ESSFwc3 on windthrow, artificial and natural regeneration. B.C. Min. For., Res. Br., Victoria, B.C., Cariboo Forest Region Exten. Note 30. www.for.gov.bc.ca/hfd/pubs/RSI/FSP/Cariboo/C_ext_notes/ENC30.pdf (Accessed Feb. 20).
Newsome T.A., M.J. Waterhouse, H.M. Armleder, and O.A. Steen. 2000b. We’re harvesting timber and maintaining caribou habitat: what about silviculture and other concerns? In: Proceedings: From science to man-agement and back: a science forum for southern interior ecosystems of British Columbia. C. Holstedt, K. Sutherland, and T. Innes (editors). Southern Interior Forest Extension and Research Partnership, Kam-loops B.C., pp. 49–53.
Rominger, E.M., C.T. Robbins, and M.A. Evans. 996. Winter foraging ecolo-gy of woodland caribou in northeastern Washington. J. Wildl. Manag. 60: 79–728.
Sambo, S.M. 2003. Using a group selection silvicultural system to main-tain caribou habitat in southern British Columbia. FERIC Advantage 4(4): –5.
Stathers, R.J., T. Newsome, M.J. Waterhouse, and C. Sutherland. 200. Microclimate studies on a group selection silvicultural system in a high-elevation ESSFwc3 forest in the Cariboo Forest Region. B.C. Min. For., Victoria, B.C. Work. Pap. 58.
Stathers, R.J., T.P. Rollerson, and S.J. Mitchell. 994. Windthrow handbook for British Columbia forests. B.C. Min. For., Victoria, B.C. Work. Pap. 940.
Steen, O.A. and R.A. Coupé. 997. A field guide to forest site identification and interpretation for the Cariboo Forest Region. B.C. Min. For., Victo-ria, B.C. Land Manag. Handb. 39.

40
Steen, O.A., R.A. Coupé, H.M. Armleder, and R.J. Dawson. 2005. Develop-ment and structure of three high-elevation old spruce-fir stands in the Quesnel Highland of East-Central British Columbia. B.C. Min. For., Res. Br., Victoria, B.C. Res. Rep. 26.
Stevenson, S.K., H.M. Armleder, M.J. Jull, D.G. King, B.N. McLellan, and D.S. Coxson. 200. Mountain caribou in managed forests: recommendations for managers. 2nd ed. Wildlife Br., B.C. Min. Environ., Lands and Parks, Victoria, B.C. Wildlife Rep. No. R-26.
Stevenson, S.K. and D.S. Coxson. 2007. Arboreal forage lichens in partial cuts – a synthesis of research results from British Columbia, Canada. Rangi-fer Special Issue 7: 55–65.
Stevenson, S.K., A.N. Lance, and H.M. Armleder. 998. Estimating the abun-dance of arboreal forage lichens: user’s guide. B.C. Min. For., Victoria, B.C. Land Manag. Handb. 43.
Teti, P. 200. The effects of small openings on snow in a high elevation forest. In: Can. Water Resourc. Assoc. BC Branch 200 Conference, Whistler, B.C. Changing Water Environments: Research and Practise, pp.9-27.
Waterhouse, M.J., H.M. Armleder, and A.F.L. Nemec. 2007. Arboreal forage lichen response to partial cutting of high elevation mountain caribou range in the Quesnel Highland of east-central British Columbia. Rangi-fer Special Issue 7: 4–53.
Youds, J., J. Young, H.M. Armleder, M. Lloyd, M. Pelchat, M. Folkema, A.R. Hoffos, and C. Bauditz. 2000. Cariboo-Chilcotin Land-Use Plan: Mountain Caribou Strategy. Cariboo Mid-Coast Interagency Manage-ment Committee, Spec. Rep., Williams Lake, B.C.
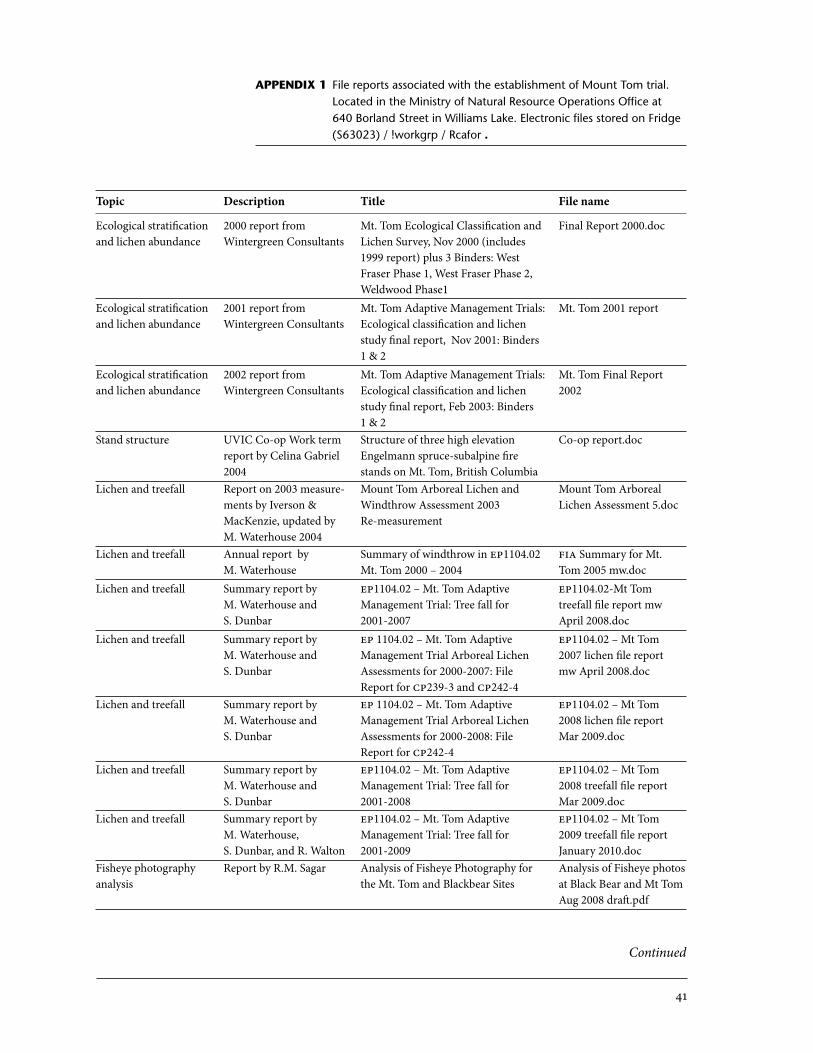
4
APPENDIX 1 File reports associated with the establishment of Mount Tom trial. Located in the Ministry of Natural Resource Operations Office at 640 Borland Street in Williams Lake. Electronic files stored on Fridge (S63023) / !workgrp / Rcafor .
Topic Description Title File name
Ecological stratification 2000 report from Mt. Tom Ecological Classification and Final Report 2000.docand lichen abundance Wintergreen Consultants Lichen Survey, Nov 2000 (includes 1999 report) plus 3 Binders: West Fraser Phase 1, West Fraser Phase 2, Weldwood Phase1 Ecological stratification 2001 report from Mt. Tom Adaptive Management Trials: Mt. Tom 2001 reportand lichen abundance Wintergreen Consultants Ecological classification and lichen study final report, Nov 2001: Binders 1 & 2 Ecological stratification 2002 report from Mt. Tom Adaptive Management Trials: Mt. Tom Final Reportand lichen abundance Wintergreen Consultants Ecological classification and lichen 2002 study final report, Feb 2003: Binders 1 & 2 Stand structure UVIC Co-op Work term Structure of three high elevation Co-op report.doc report by Celina Gabriel Engelmann spruce-subalpine fire 2004 stands on Mt. Tom, British Columbia Lichen and treefall Report on 2003 measure- Mount Tom Arboreal Lichen and Mount Tom Arboreal ments by Iverson & Windthrow Assessment 2003 Lichen Assessment 5.doc MacKenzie, updated by Re-measurement M. Waterhouse 2004 Lichen and treefall Annual report by Summary of windthrow in EP1104.02 FIA Summary for Mt. M. Waterhouse Mt. Tom 2000 – 2004 Tom 2005 mw.docLichen and treefall Summary report by EP1104.02 – Mt. Tom Adaptive EP1104.02-Mt Tom M. Waterhouse and Management Trial: Tree fall for treefall file report mw S. Dunbar 2001-2007 April 2008.docLichen and treefall Summary report by EP 1104.02 – Mt. Tom Adaptive EP1104.02 – Mt Tom M. Waterhouse and Management Trial Arboreal Lichen 2007 lichen file report S. Dunbar Assessments for 2000-2007: File mw April 2008.doc Report for CP239-3 and CP242-4Lichen and treefall Summary report by EP 1104.02 – Mt. Tom Adaptive EP1104.02 – Mt Tom M. Waterhouse and Management Trial Arboreal Lichen 2008 lichen file report S. Dunbar Assessments for 2000-2008: File Mar 2009.doc Report for CP242-4Lichen and treefall Summary report by EP1104.02 – Mt. Tom Adaptive EP1104.02 – Mt Tom M. Waterhouse and Management Trial: Tree fall for 2008 treefall file report S. Dunbar 2001-2008 Mar 2009.docLichen and treefall Summary report by EP1104.02 – Mt. Tom Adaptive EP1104.02 – Mt Tom M. Waterhouse, Management Trial: Tree fall for 2009 treefall file report S. Dunbar, and R. Walton 2001-2009 January 2010.docFisheye photography Report by R.M. Sagar Analysis of Fisheye Photography for Analysis of Fisheye photosanalysis the Mt. Tom and Blackbear Sites at Black Bear and Mt Tom Aug 2008 draft.pdf
Continued

42
Topic Description Title File name
Snow depth and solar File Report by Pat Teti Snow depths and solar radiation Teti Mt Tom File Reportradiation before and after partial logging at the Apr 2009.pdf Mt. Tom Adaptive Management TrialMicroclimate Summary e report by The Microclimate of the Mount Tom The Microclimate of the R.M. Sagar 2010 based Research Trials 2001-2009, Project Mount Tom Research on annual file reports EP1104.02 Trials 2001-2009.docxRegeneration response: Summary report by Mount Tom Adaptive Management EP1104.02 Mt Tom 5thFifth Year Results J. Heineman and Project EP1104.02: Summary of yr seedling summary_ T. Newsome Regeneration response: Fifth Year mar22-10.docx Results
Table continued from previous page

43
APPENDIX 2 Qualitative observations regarding harvesting at the Mount Tom study site
Group selection harvesting
The following information was compiled from a report prepared by S & F Construction Ltd. and discussions with Greg Scott (West Fraser Mills Ltd.).
Block layout• CP550- was the first block harvested. As a result, the learning curve was
steep and a number of changes were made for layout and harvesting of subsequent blocks. These issues are outlined below.
• Stand composition and structure were not an over-riding attribute when group selection openings were laid out. As a result, a number of openings included patches of small-diameter subalpine fir, which were both time consuming to harvest and process, and had low economic value in com-parison to areas where spruce was more abundant. From a caribou perspective, however, subalpine fir tends to be a marginally more valuable species because it has higher arboreal lichen loading and retains its lower branches for longer periods than spruce. Therefore, because of both cari-bou and economic factors, subsequent blocks were laid out so that group selection openings avoided areas that were predominantly scrubby subal-pine fir.
• With the changed approach, volume harvested on all blocks was approxi-mately 50% subalpine fir and 50% spruce, with a slight leaning to higher spruce volume in some areas. Diameter distributions of harvested stems differed because subalpine fir was, on average, smaller than spruce.
• S&F indicated that road layout was a problem at CP550-. There were two main roads with three spur roads off one of the main roads, which meant a total of 5.9 km of road had to be built to a temporary standard. Efficiency was reduced because machinery had to be moved from one location to the other and there was a lot of backtracking. They suggested that road sys-tems be laid out so that they connected in a loop.
• As a result of experience on CP550-, opening shape was adjusted from square to triangular or tear-shaped so that wood could be funnelled from the widest areas through the narrow end. Small square blocks were laid out along the road. This serves to maximize the amount of roadside deck-ing space.
Timing• Harvest timing was an important issue at these high-elevation blocks. Ef-
forts were made to start harvesting well before the end of the calendar year when snow accumulations were less than 0.7 m, and to get out before Feb-ruary. Heavy snowfall generally occurs between January and April. For example, on CP55-, there was approximately 0.7 m of snow when har-vesting started in January and 2 m when it finished in April.
• Once a road is opened up, it can be maintained in an open condition as long as it is used continually, but it becomes more difficult and costly to open high-elevation roads once snowpack starts to exceed m in depth.
• The advantage to deep snowpack is that machines can move easily over it and cause no damage to the forest floor. The disadvantage is that felled trees sometimes break through the crust and disappear into deep snow,

44
making it difficult for the skidder to locate them. Lost trees require an extra trip to remove them when the snow has melted down enough. To counter this problem, the skidder operator tries to yard the trees as quick-ly as possible following felling.
• There was very little ground disturbance, even in wet areas of the ESSFwc3.
Felling and bunching• The main efficiency problem seems to have been associated with the large
numbers of small openings. The feller-buncher operator had to set up and check lines and the machinery had to be walked from one location to the other. Efficiencies could be gained if the two main road systems were con-nected in a loop.
• In CP550-, it was difficult to save patches of residual regeneration in small openings because there was too much damage. Saving good-quality resid-uals should be limited to larger openings.
• As a result of the changed harvest approach to logging in dense subalpine fir patches, CP550- was the only block where planting in residual patches could be done across all opening sizes.
• For openings ≥ 0.5 ha, technical difficulties associated with machine oper-ation were about the same, whereas smaller openings (0.–0.4 ha) were more challenging. This was mainly because there was difficulty falling within the designated opening and minimizing damage to surrounding timber.
• Safe work procedures had to be developed by the logging contractor to minimize the falling of snags (valuable for wildlife) located outside the opening boundaries.
• On CP552-, approximately one-third was summer logged and two-thirds were winter logged.
Processing• CP550- was a conventional long-log approach with processing at the
roadside. The whole tree was yarded to the roadside, and limbed and bucked using a stroker delimber processor.
• S&F encountered difficulties on CP550- with processing in the small openings. They suggested laying out the overall block so that small open-ings were at the back skid trails and wood could be funnelled down through progressively larger openings to the roadside.
• As a result of the S&F experience, and the difficulties with build-up of slash at the roadside, two processing systems were used on CP55-. A long-log system using crawler tractors with roadside processing was used on steeper sections. Roadside processing was done with a dangle head processor unit. On flatter sections, a stump-side processing system (limb-ing and bucking to length) was used. A small tilt-cab feller-buncher and a dangle head processor unit were used. A forwarder then moved the wood out to the road. The result was less build-up of slash at the roadside, but piling and burning then had to be carried out for areas where stump-side processing had been done, incurring increased costs.

45
Single-tree selection harvesting in CP552-
This is the first use of single-tree selection on the Mount Tom adaptive man-agement trial. During the layout of CP552-, the consultant was asked to identify an area in which a single-tree selection harvest system could be used. The area identified was a stand of small-diameter subalpine fir with a compo-nent of larger-diameter spruce and subalpine fir. The distribution of smaller subalpine fir made it less attractive for group selection.
The area was included in the timber cruise of the whole block, resulting in two cruise plots within the area. Subsequently, eight stand and stock plots were established on a 00 x 00 m grid over the area and were used to gener-ate the basal area baseline for the unit. From these data, the basal area was determined to be 38.8 m²/ha. The timber cruise data indicated that the basal area was 29.8 m²/ha.
A plan was developed outlining the location of the Standard Unit bounda-ry and location of the designated skid trails, taking into consideration the topographical features noted during the stand and stocking survey. The des-ignated skid trails were spaced approximately 2 tree lengths apart and a tree removal skid trail width of 8 m was assumed. This width was used because the harvesting contractor and equipment configuration were not known. The volume to be removed from the skid trails was calculated at 295 m3, and 60 m3 was estimated for incidental/residual damage.
MarkingA mark-to-cut method was used with the following marking criteria and re-sults:
• A 30% basal area removal target was used. • Trees were marked that could be removed with limited residual damage.• Trees that were in decline but still merchantable were marked.• Initially a BAF 6 prism was used to determine how much BA was available
for removal. This did not work well as the timber type was not uniform. • Most of the block was marked by identifying small groups of two to eight
trees.• Each marked tree was tallied and put into a diameter class so that a vol-
ume estimate could be generated.• In total, 203 stems of subalpine fir and 3 stems of spruce were marked
within the diameter range of 20–75 cm dbh for a volume estimate of 488 m3.• It took about 20 hours to mark the 0.8-ha area.
HarvestingHarvesting began in November 200 by Paradigm Logging—a contractor with many years of partial cutting experience. The following are details about what was done:
• The snow depth in the area was an average of 0.5 m, which was favourable for harvesting (usual depths during winter harvesting are .3–2.0 m).
• The marked trees were hand felled, then a Hitachi Excavator EX200 was used to carefully move the cut stems to a designated skid trail, thus drasti-cally reducing the residual damage.
• A grapple skidder was used to move the stems to roadside for further pro-cessing and loading.

46
• It was estimated that 843 m3 (± 30%) would be removed; actual delivered volume was 53 m3. The difference was due in part to the actual skid trail removal width being 5–6 m (instead of the assumed 8 m) and the residual damage volume allocation was never used.
• There was virtually no damage to the residual trees. • The harvesting contractor was paid by the hour (due in part to the small
amount of volume being removed) with costs averaging 30/m3 for har-vesting, and trucking costs of approximately 2/m3.
The following lessons should be considered for future single-tree selection harvesting:
• Skid trail spacing was good at around 2 tree lengths; however, a 6-m tree
removal width should be used for volume calculation.• Removing small clumps of trees as opposed to single trees works better for
marking and reducing the amount of residual damage by creating more work space.
• If feasible, a running tally of volume/stems removed during harvesting could be done to adjust total volume cut so that the target removal is met.
• A larger area of single-tree selection would reduce some harvesting costs.• Harvesting a larger block with portions designated for group selection and
other portions (based on timber type) for single-tree selection would also reduce the harvesting costs.

47
APPENDIX 3 Description of codes used for regeneration data collection
Code Seedling Condition Codes Good Seedling shows no signs of stress, has a vigorous growth
rate and a generally healthy appearance. 2 Fair Seedling is under some form of stress, may have minor
defects, and has a moderate growth rate. 3 Poor Seedling is under severe stress, may have major defects,
and the growth rate is poor. 4 Moribund Seedling is almost dead. 5 Dead 6 Missing 7 Destructively
Sampled
Seedling Vegetation Cover Codes O Overtopped The leader of the crop tree is at present overtopped by
surrounding vegetation; crop tree available sunlight is greatly reduced.
T Threatened The leader of the crop tree is at or near the same height of the surrounding vegetation, and /or is likely to be overtopped within two growing seasons.
F Free Growing The leader of the crop tree is well above the surround-ing vegetation and is not likely to become threatened.
Seedling Damage Codes: (SD, FD, LD)
Stem Condition (SD) Foliage / Branch Condition (FD) Leader Condition (LD)
Chlorotic Y Mottled M Curled CStem bent B Necrotic N Forked FStem smashed, crushed, trampled S Needles absent, defoliated A Browsed BStem cut, clipped, broken C Browsed B Dead terminal bud TStem forked F Dead buds on lateral branches D Snapped or broken SBark peeled or abraded (greater P Gall aphid GA New leader (ex. lateral has NL than 25%) taken over) Gall rust GR Gall rust GR Absent or missing AOther symptoms O Other symptoms O Other symptoms O

48
Damage Cause Codes: (SC, FC, LC)
General Specific
Herbicide H Pine needle cast (Lophodermella concolor) DFLMechanical equipment M Western gall rust (Endocronartium harknessii) DSGHand tools T Gall aphid (Adelges cooleyi) IAGFalling slash (human caused) S Budworm (Choristoneura spp.) IDBD1
Falling or sliding debris X Spruce weevil (Pissodies strobi) IWSFrost (E)2 FR Pine terminal weevil (Pissodes terminalis) IWPSnow press (N) SP Vegetation press VP Drought DR No or abnormal flush N Rodents, small animals R Big game B Livestock L Fire F Insects: specify if known (See list TRENDS 1997) I Disease: specify if known (See list TRENDS 1997) D Destructively sampled Z Winter damage WD Wind (ex. Windthrow) W Other (specify) O Unknown U
Only specific species are coded on the TRENDS form and the 2-cycle was not included, so use general code for all budworm.2 The codes in brackets were used prior to Sep. 200.