Embed Size (px)
Citation preview

Available online at www.sciencedirect.com
www.elsevier.com/locate/gca
Geochimica et Cosmochimica Acta 75 (2011) 6821–6843
Group IVA irons: New constraints on the crystallization andcooling history of an asteroidal core with a complex history
T.J. McCoy a,⇑, R.J. Walker b, J.I. Goldstein c, J. Yang c, W.F. McDonough b,D. Rumble d, N.L. Chabot e, R.D. Ash b, C.M. Corrigan a, J.R. Michael f,
P.G. Kotula f
a Department of Mineral Sciences, National Museum of Natural History, Smithsonian Institution, Washington, DC 20560-0119, United Statesb Department of Geology, University of Maryland, College Park, MD 20742, United States
c Department of Mechanical and Industrial Engineering, 313 Engineering Lab, University of Massachusetts, 160 Governors Drive,
Amherst, MA 01003, United Statesd Geophysical Laboratory, 5251 Broad Branch Road, NW, Washington, DC 20015-1305, United States
e Johns Hopkins University, Applied Physics Laboratory, 11100 Johns Hopkins Road, Laurel, MD 20723-6099, United Statesf Materials Characterization Department, Sandia National Laboratories, P.O. Box 5800, MS 0886, Albuquerque, NM 87185, United States
Received 25 May 2010; accepted in revised form 28 June 2011; available online 8 September 2011
Abstract
We report analyses of 14 group IVA iron meteorites, and the ungrouped but possibly related, Elephant Moraine (EET)83230, for siderophile elements by laser ablation ICP-MS and isotope dilution. EET was also analyzed for oxygen isotopiccomposition and metallographic structure, and Fuzzy Creek, currently the IVA with the highest Ni concentration, was ana-lyzed for metallographic structure. Highly siderophile elements (HSE) Re, Os and Ir concentrations vary by nearly threeorders of magnitude over the entire range of IVA irons, while Ru, Pt and Pd vary by less than factors of five. Chondrite nor-malized abundances of HSE form nested patterns consistent with progressive crystal–liquid fractionation. Attempts to collec-tively model the HSE abundances resulting from fractional crystallization achieved best results for 3 wt.% S, compared to 0.5or 9 wt.% S. Consistent with prior studies, concentrations of HSE and other refractory siderophile elements estimated for thebulk IVA core and its parent body are in generally chondritic proportions. Projected abundances of Pd and Au, relative tomore refractory HSE, are slightly elevated and modestly differ from L/LL chondrites, which some have linked with groupIVA, based on oxygen isotope similarities.
Abundance trends for the moderately volatile and siderophile element Ga cannot be adequately modeled for any S con-centration, the cause of which remains enigmatic. Further, concentrations of some moderately volatile and siderophile ele-ments indicate marked, progressive depletions in the IVA system. However, if the IVA core began crystallization with�3 wt.% S, depletions of more volatile elements cannot be explained as a result of prior volatilization/condensation processes.The initial IVA core had an approximately chondritic Ni/Co ratio, but a fractionated Fe/Ni ratio of �10, indicates an Fe-depleted core. This composition is most easily accounted for by assuming that the surrounding silicate shell was enrichedin iron, consistent with an oxidized parent body. The depletions in Ga may reflect decreased siderophilic behavior in a rela-tively oxidized body, and more favorable partitioning into the silicate portion of the parent body.
Phosphate inclusions in EET show D17O values within the range measured for silicates in IVA iron meteorites. EET has atypical ataxitic microstructure with precipitates of kamacite within a matrix of plessite. Chemical and isotopic evidence for agenetic relation between EET and group IVA is strong, but the high Ni content and the newly determined, rapid cooling rateof this meteorite show that it should continue to be classified as ungrouped. Previously reported metallographic cooling ratesfor IVA iron meteorites have been interpreted to indicate an inwardly crystallizing, �150 km radius metallic body with little
0016-7037/$ - see front matter Published by Elsevier Ltd.
doi:10.1016/j.gca.2011.09.006
⇑ Corresponding author. Tel.: +1 202 633 2206.E-mail address: [email protected] (T.J. McCoy).

6822 T.J. McCoy et al. / Geochimica et Cosmochimica Acta 75 (2011) 6821–6843
or no silicate mantle. Hence, the IVA group was likely formed as a mass of molten metal separated from a much larger parentbody that was broken apart by a large impact. Given the apparent genetic relation with IVA, EET was most likely generatedvia crystal–liquid fractionation in another, smaller body spawned from the same initial liquid during the impact event thatgenerated the IVA body.Published by Elsevier Ltd.
1. INTRODUCTION
With nearly 70 members, IVA is the third largest groupof iron meteorites. IVA iron meteorites are characterizedby a Widmanstatten pattern kamacite bandwidth of0.23–0.43 mm (Buchwald, 1975), and belong to the fineoctahedrite (Of) structural class. The Ni content of thegroup varies from �7.45 (Jamestown) to �12.4 (FuzzyCreek) wt.% Ni, consistent with substantial crystal–liquidfractionation of metal in the parent body (Wasson andRichardson, 2001). The iron meteorites of this group differfrom most other iron groups by their depletion in volatilesiderophile elements (e.g., Ga, Ge) coupled with compara-tively modest Ni contents. About half the members of thegroup have seen moderate to heavy shock, and a few mem-bers of the group contain silicates. It has been argued thatthe silicates were introduced via a high temperature impact(Wasson et al., 2006).
Almost since the recognition of the group, significantdebate has ensued about their origin. Depletion in volatilesiderophile elements may have been caused by pre-accretionary processes, such as nebular evaporation/condensation, acting on precursor materials (e.g., Sears,1978). Alternately, the depletions in the IVA irons mayhave resulted from processes that occurred in the parentbody prior to core formation, such as oxidation/reductionreactions, or impact volatilization (Wasson and Richard-son, 2001; Ruzicka and Hutson, 2006; Wasson et al., 2006).
Like magmatic iron groups IIAB, IIIAB and IVB, whichare generally accepted to have formed via crystal–liquidfractionation of asteroidal cores, group IVA irons exhibitelement–element trends broadly consistent with fractionalcrystallization (Scott, 1972; Wasson and Richardson,2001). However, although it is generally agreed that frac-tional crystallization played an important role, a quantita-tive understanding of the collective processes that led tothe formation of the IVA suite remains elusive. One ofthe more vexing issues with respect to IVA formation isthe initial S content of the system. Sulfur, and to a lesserextent P, play important roles in controlling the partition-ing of siderophile elements between solid and liquid metal.Some studies have estimated that the initial S content of theIVA system was �0.5 to 3 wt.%, based on inter-elementvariations of elements such as Ir–Au (Willis and Goldstein,1982; Jones and Drake, 1983; Wasson and Richardson,2001; Chabot, 2004; Wasson et al., 2006). Ga and Gevariations, however, cannot be easily reconciled with suchlow initial S. The behavior of these two volatile, moderatelysiderophile elements is more consistent with considerablyhigher initial S (e.g., �9 wt.%; Chabot, 2004). In an attemptto develop a model that could account for all of thechemical characteristics of the IVA suite, Scott et al.
(1996) considered dendritic crystallization of metal, coupledwith the trapping of melt, during which S was concentratedin the liquid during fractional crystallization. This wouldhave resulted in variable, progressive changes in the parti-tion coefficients for siderophile elements, and could success-fully account for some of the observed chemical variations.However, their model also failed to adequately account forGa–Ge variations. Wasson and Richardson (2001) success-fully modeled Ir, Au and As variations by appealing to frac-tional crystallization of a relatively low S system (0.5 wt.%),coupled with variable incorporation of trapped melt, butthey did not rigorously consider the problematic Ga orGe contents in their model.
The incomplete understanding of the chemical crystalli-zation history of IVA irons is accompanied by continuingdebate about the physical history of the IVA core. Numer-ous studies have noted the large apparent range of metallo-graphic cooling rates among IVA irons, which isinconsistent with a slowly cooled core, mantled by appre-ciable silicate rock or regolith (Goldstein and Short, 1967;Rasmussen et al., 1995; Haack et al., 1996; Yang et al.,2008). The variations in cooling rates have been accountedfor in several ways. For example, Haack et al. (1996) inter-preted the different cooling rates to be the result of an im-pact-generated breakup and reassembly of a crystallizingcore. The proposed scrambling and reassembly of partiallydifferentiated metal into a new core could potentiallyaccount for the differential cooling rates, yet does not wellaccount for the good correlation between cooling rate andextent of chemical fractionation. Wasson et al. (2006) spec-ulated that the methodology to constrain metallographiccooling rates may be flawed, and that IVA cooling rateswere actually generally constant. Yang et al. (2008) con-cluded that the IVA irons cooled below 650 �C at highlyvariable rates of 100–6600 K/Myr, where cooling rate de-creased with increasing Ni content. To account for this theyproposed inward crystallization of a metallic body of radius150 ± 50 km with <1 km of silicate mantle. They deter-mined that such a body may have formed from a differen-tiated protoplanet that was stripped of much of its silicatemantle via a grazing impact (e.g., Asphaug et al., 2006),and broken into several smaller bodies, one of which wasmolten metal with a very thin silicate mantle. Goldsteinet al. (2009a,b), subsequently provided two additional cool-ing rate measures which support the variation of metallo-graphic cooling rates with Ni content: cloudy taenitehigh-Ni particle dimensions, and tetrataenite bandwidth.
A major objective of this study is to constrain the originand evolution of the IVA parent body from the onset ofcrystallization through subsolidus cooling, using bothchemical trends and metallographic data. As part of thisstudy, we also consider the possible genetic linkage between

Group IVA irons: New constraints on crystallization and cooling 6823
group IVA irons and the currently ungrouped iron, Ele-phant Moraine (EET) 83230 (hereafter referred to asEET), an ataxite with precipitates of kamacite within a ma-trix of plessite, using new composition and oxygen isotopedata. It has been previously suggested that EET is geneti-cally linked to IVA, although its Ni content is much higherthan any known IVA iron, and it contains large sized ironphosphates. If it is a member of chemical group IVA, it isimportant because it is much more chemically evolved thanany other recognized IVA. Finally, in order to further con-sider crystallization and post-crystallization processes, wereport new metallographic cooling rates for both EETand Fuzzy Creek. Fuzzy Creek is currently the IVA ironwith the highest Ni content, and the only IVA sample whichdoes not have a Widmanstatten pattern.
2. ANALYTICAL METHODS
2.1. Oxygen isotopic analysis
Phosphates from the ungrouped iron meteorite EETwere analyzed for oxygen isotopes in order to examine apossible genetic relation with the IVA irons. The methodof in situ, spot analysis for oxygen isotopes with an ultravi-olet (UV) laser (Wiechert and Hoefs, 1995; Rumble et al.,1997) and purified fluorine (Asprey, 1976) was chosen in or-der to conserve the meteorite. Analysis of the phosphatemineral apatite for 16O–17O–18O by in situ UV laser fluori-nation has been previously demonstrated by Jones et al.(1999), albeit with non-stoichiometric oxygen yields, andd18O values more widely dispersed than in analyses of sili-cate or oxide minerals by the same method. The d17O andd18O data obtained by UV laser fluorination of terrestrialapatite samples scattered parallel to and on either side ofthe terrestrial fraction line (TFL) (Jones et al., 1999). De-spite scatter in d18O values, it is commonly observed inthe analysis of oxygen isotopes that mass-dependent errorsand kinetic isotope fractionation effects associated withnon-stoichiometric yields of oxygen are self-canceling inrelation to measured values of D17O (Rumble et al.,2007). This is important here, as it is the D17O that is usedto assess genetic affinities.
A thin slice was cut from EET measuring approximately1.5 � 1.5 cm. It contained four inclusions of Fe-phosphate1–2 mm in diameter that were entirely surrounded by metal.The sample was placed in a reaction chamber together withpolished billets of Gore Mountain garnet (USNM 107144)and San Carlos olivine (USNM 136718), evacuated, andfluorinated repeatedly with purified F2 for 5 days untilspontaneous fluorination reactions had ceased and blankO2 was no longer measurable. Repeated pre-fluorinationof samples prior to analysis by in situ UV laser fluorinationis required to eliminate H2O and organic contaminants ab-sorbed along grain boundaries.
On the day of analysis, the Fe-phosphate, Gore Moun-tain garnet and San Carlos olivine were analyzed. The tworeference materials were analyzed both before and after theanalysis of EET. San Carlos olivine gave d18O and D17Ovalues of +5.22 ± 0.04& and �0.02 ± 0.03&, respectively.Previous UV laser fluorination analyses for San Carlos
olivine were, for USNM 136718, d18O = +5.23 ± 0.15&,and for Harvard 131265, d18O = +5.19 ± 0.08&, in goodagreement with values obtained in the present study (Rum-ble et al., 1997). Gore Mountain garnet (USNM 107144)analyzed on the same day as EET phosphate gave a puz-zling range of d18O values, from +5.35 to +6.20, comparedto previous UV laser fluorination values of +6.02 ± 0.14&
(Rumble et al., 1997). The same analyses of GoreMountain, however, gave the expected value of D17O =+0.01 ± 0.06&, so we have high confidence in the reportedD17O for EET. Both reference materials, San Carlos olivineand Gore Mountain garnet, lie on the TFL.
2.2. 187Re–187Os and highly siderophile element analysis of
bulk samples
Pieces of 13 IVA iron meteorites were obtained from theSmithsonian Institution National Museum of Natural His-tory (see Electronic Annex for museum sample numbers)and sawn into small chunks (0.11–0.44 g) appropriate forbulk analysis of HSE via isotope dilution (Re, Os, Ir, Ru,Pt and Pd). A piece of an additional IVA iron meteorite,Muonionalusta, was obtained from J. Blichert-Toft. EET83230 was also obtained from the Smithsonian and ana-lyzed as part of this analytical campaign. Prior to dissolu-tion, each meteorite piece was mechanically cleaned bypolishing with a fresh piece of carborundum, and examinedusing a binocular microscope to verify the absence of rustand/or inclusions.
The chemical-separation and mass spectrometric tech-niques used in this study for Re–Os isotopic analysis andisotope dilution analysis of Ir, Ru, Pt and Pd have been pre-viously published (Shirey and Walker, 1995; Rehkamperet al., 1997; Cook et al., 2004; Becker et al., 2006; Walkeret al., 2008). A brief description follows with additional de-tails provided in the Electronic Annex. At least two bulkchunks of most IVA irons were analyzed. For one chunk,the polished metal, a mixed spike consisting of 185Re and190Os, separate spikes consisting of 191Ir, 104Ru, 198Pt and110Pd, approximately 6 g of concentrated HNO3 and 3 gof concentrated HCl, were frozen into quartz or Pyrexe
Carius tubes, sealed and heated at 240 �C for more than24 h to obtain complete sample-spike equilibration. Forthe second chunk, samples were processed in the sameway, but only the mixed Re–Os spike and an individual194Pt spike were added in order to optimize the measure-ment for the 190Pt–186Os isotope system (not reported here).Osmium was purified using a carbon tetrachloride (CCl4)solvent extraction technique (Cohen and Waters, 1996) fol-low by microdistillation purification (Birck et al., 1997).The Os total processing blank was 3 ± 2 pg (n = 7), andwas inconsequential for all samples.
Rhenium, Ir, Ru, Pt and Pd were separated and purifiedfrom the residual acid using anion exchange columns. TheRe, Ir, Ru, Pt and Pd blanks for this procedure averaged2 ± 1, 4 ± 1, 9 ± 3, 300 ± 100 and 60 ± 20 pg, respectively,with the uncertainties defining the range (n = 2). All analy-ses are blank corrected. The blanks comprised <1% of thetotal element analyzed and had negligible impact on analyt-ical uncertainties.

6824 T.J. McCoy et al. / Geochimica et Cosmochimica Acta 75 (2011) 6821–6843
Osmium was analyzed via negative thermal ionizationmass spectrometry (Creaser et al., 1991) using procedurespreviously discussed (Cook et al., 2004). For the levels ofOs extracted from the IVA iron meteorites (>20 ng), exter-nal reproducibility in the 187Os/188Os ratio was ±0.05% (2r)or better, based on repeated analyses of comparable quan-tities of a standard, as well as duplicate analyses (separatedissolutions of the meteorite) for all samples. For samplesfrom which <10 ng of Os were separated for analysis(Chinautla and EET), external reproducibility in187Os/188Os was ±0.1% (2r)
Rhenium, Ir, Ru, Pt and Pd analyses were conductedusing a Nu Plasma multi-collector inductively-coupled plas-ma mass spectrometer (MC-ICP-MS) and a Cetac Ariduse
desolvating nebulizer. All analyses were accomplished usingstatic, multiple Faraday bucket collection. Salient ratioswere measured to better than ±0.1% (2r). The reported187Re/188Os ratio 2r uncertainties include the combineduncertainty in the isotopic measurements and blankcorrections. The Os and Re blank corrections introducedmaximum uncertainties of ±0.1% for all samples. The max-imum analytical uncertainties in 187Re/188Os were ±0.15%for most samples. Most of the first round IVA irons werenot optimally spiked for isotopic measurement. Conse-quently, these samples were not included in the isochronset used in the regression.
Prior studies have shown that the variance about themean for multiple chunks of iron taken from the same piecefor HSE is 62% (Walker et al., 2008). This level of repro-ducibility includes minor variations resulting from analyti-cal methods (weighing spikes and samples, massspectrometric uncertainties including error magnificationresulting from non-ideal spiking), as well as sample hetero-geneity. Comparisons of the new data with published dataare provided in the Electronic Annex Table EA1. There isconsiderable variability in the literature data, so the newdata are in good agreement with the results of some studies,and as much as 20% different in comparison to other stud-ies. For the modeling conducted here, relative differences inthe concentrations of the HSE among IVA irons are consid-erably more important than absolute abundances, so sys-tematic differences between the new and prior studies haslittle impact on this study.
2.3. Laser ablation ICP-MS
In situ chemical analyses of each sample analyzed forbulk HSE were conducted in order to obtain complemen-tary bulk HSE data by another method, as well as datafor a large range of other elements (including the monoiso-topic HSE Rh and Au, which cannot be determined by iso-tope dilution). These analyses were carried out using aThermo-Finnigan Element 2 coupled to a laser ablation sys-tem with a photon wavelength of 213 nm (UP213, NewWave Research). The mass spectrometer was operated ina dynamic peak hopping mode with mass/charge position-ing achieved by a combination of magnet current shifts andvoltage offsets (Hamester et al., 1999). Details regarding theanalytical system and mode of operation for iron meteoriteshave been recently published (Walker et al., 2008) and are
only briefly reviewed here. Additional details are providedin the Electronic Annex. A comparison of the new datawith published results is presented in Table EA2.
Each analysis sequence consisted of five standard refer-ence materials (SRM) run before and after the data acqui-sition of three separate samples. Analyses of these SRMsprovided multi-sample calibration curves used for deter-mining element concentrations and for constraining instru-ment drift. The laser sampling involved the analyses of fourseparate, adjacent line traces (�0.8 mm long) producedusing a �100 lm diameter beam. All data were processedusing the LAMTRACE (Achterbergh et al., 2001) software,which determines element concentrations based on ratios ofbackground-subtracted count rates for samples and stan-dards, known concentrations in the standards and theknown concentration of an internal standard in the un-knowns. In all cases, the internal standard for the IVA anal-yses was Pt, as determined by isotope dilution, and wasused as an input for 194Pt. Platinum is particularly usefulin this role because its concentration varied little acrossthe IVA suite. From this, concentrations of V, Cr, Mn,Cu, Zn, Ga, Ge, As, Mo, Ru, Rh, Pd, W, Re, Os, Ir andAu were determined. The detection limits used in this studywere set at the background count rate plus three times thestandard deviation of the background. For many elements,the standard deviation reflected spatial heterogeneities asso-ciated with trace phases, and analyses of cross-cutting tae-nite and kamacite bands.
Determining the magnitude of elemental heterogeneitybetween taenite and kamacite is important here becausenon-representative sampling of taenite and kamacite, inthe small chunks of iron dissolved for bulk analysis ofHSE, could lead to incorrect assumptions regarding thebulk compositions that are modeled. Consequently, someirons with relatively coarse taenite and kamacite were ana-lyzed and are reported separately from the bulk in TableEA3. For some elements, differences in concentrations be-tween the two phases were large; for other elements, differ-ences were minor or not resolvable (Fig. EA1). Because ofthe likelihood of spatial overlap none of these analyses canbe considered to represent pure end member compositionsof either kamacite or taenite.
2.4. Metallography and cooling rates
Samples of Fuzzy Creek and EET were examined byoptical microscopy and scanning electron microscopy afterstandard metallographic polishing. Each sample was etchedwith 2% nital for various times so that the cloudy zone, ifpresent, plessite and other features would be visible in theSEM. The SEM studies were accomplished using a ZEISSSupra 55VP field emission SEM at Sandia National Labo-ratories. The SEM data were obtained at 5 kV in order tomaximize the measurement of surface detail. Each samplewas also examined for shock effects evidenced in the micro-structure by optical microscopy and SEM, and the shock le-vel was estimated. The bulk chemical compositions ofFuzzy Creek and EET were measured using an electronprobe microanalyzer. Both meteorites have a fine micro-structure which is representative at the sub mm level.

Table 1Oxygen isotope analyses of phosphate in EET 83230 by ultravioletlaser fluorination.
Sample D17O d17O d18O
Grain A, spot 1 1.147 2.1 1.81Grain A, spot 2 1.115 0.16 �1.81Grain D, combined 2 spots 1.138 3.68 4.82Average values 1.134 1.98 1.61Standard deviation ±0.017 ±1.76 ±3.32
Fig. 1. Oxygen isotope data for iron phosphate inclusions in EET83230 obtained by UV laser fluorination. Also included forcomparison are data for silicates from IVA irons reported byClayton and Mayeda (1996), and for bronzite and tridymite fromIVA irons analyzed with UV laser fluorination by Wang et al.(2004).
Group IVA irons: New constraints on crystallization and cooling 6825
Multiple quantitative line scans were taken in 1–5 lm stepsacross the three phases in Fuzzy Creek, and the fine plessitein EET, and the Fe, Co, Ni and P contents averaged.
Thin sections of Fuzzy Creek and EET were examinedusing the scanning transmission electron microscope(STEM). The iron meteorite samples were thinned for theTEM using a dual beam FEI DB-235 focused ion beam(FIB)/SEM instruments at Sandia National Laboratories.The samples had a thickness of 50–100 nm and wereapproximately 10 lm in length and 5 lm in width. Thin sec-tions were cut perpendicular to kamacite–taenite interfacesin EET from the polished and etched meteorite sample sur-face. Using this methodology, the kamacite–taenite inter-face is oriented perpendicular to the surface of the thinsection, the ideal geometry for measuring Ni concentrationgradients which are necessary for an accurate cooling ratedetermination. Thin sections of selected kamacite–taeniteinterface regions in EET and taenite regions cut at randomorientations with respect to kamacite/taenite interfaces inFuzzy Creek were analyzed using a FEI Tecnai F30ST fieldemission transmission – STEM at Sandia National Labora-tories, operated at 300 kV. Quantitative Ni gradients in tae-nite 0.5–2 lm in length were measured in a direction normalto kamacite–taenite interfaces using the stored EDS X-rayscan data. The X-ray data in each pixel were converted tocomposition using the Cliff–Lorimer method (Cliff andLorimer, 1975) with X-ray spatial resolution of 2–4 nm.
Samples of Fuzzy Creek and EET were also prepared forelectron backscatter diffraction (EBSD) investigation. Thistechnique allows for the identification of various phases(kamacite and taenite) and the determination of orientationrelations with respect to each other. Successful applicationof EBSD requires that the sample surface be clean and rel-atively flat and free of preparation induced damage. Mete-orite samples were polished using standard metallographicpolishing procedures followed by a two-step vibratory pol-ishing procedure. The first vibratory polishing was per-formed using 0.1 lm Al2O3 for 4 h followed by a secondvibratory polishing step using 0.04 lm SiO2 for 2–4 h thatproduces both a mechanical polishing effect, but also actsas a chemical polish, which produces very smooth surfaces.Both steps were carried out on napped cloth. This proce-dure produced samples that had minimal surface relief be-tween the kamacite and taenite, and were free ofspecimen preparation induced damage. EBSD studies ofkamacite and taenite in meteoritic metal were accomplishedusing a ZEISS Supra 55VP SEM outfitted with an EBSDunit from HKL Technology, with Channel 5 software. Ori-entation maps of fcc and bcc regions of Fuzzy Creek andEET were made using a beam voltage of 20 kV, a beam cur-rent of about 1–2 nA, and a spot size of less than 2 nm indiameter. The sample was tilted 70� from the horizontalfor orientation mapping.
In order to measure the cooling rates of Fuzzy Creekand EET, information about the nucleation process of thekamacite, the nucleation temperature, the effect of impinge-ment by adjacent kamacite plates, the Fe–Ni and Fe–Ni–Pphase diagrams, and the interdiffusion coefficients whichcontrol the growth of the Widmanstatten pattern areneeded (Yang et al., 2008). The Ni profile matching method
(Goldstein and Ogilvie, 1965) was used to obtain a coolingrate for individual measured taenite zoning profiles. Themeasured Ni composition versus distance profile across tae-nite adjacent to a kamacite platelet is compared to Ni pro-files calculated for several assumed cooling rates. A matchbetween the observed and calculated profiles allows a cool-ing rate to be determined for each meteorite (Yang andGoldstein, 2006).
3. RESULTS
3.1. Oxygen isotopes
Phosphate inclusions from EET are characterized by awide range in d18O, from �1.8& to +4.8& (Table 1). Widevariations in d18O commonly accompany non-stoichiome-tric yields of oxygen owing to isotope fractionation betweenincompletely fluorinated, oxygen-bearing reaction prod-ucts. In the case of phosphates, the guilty co-reaction prod-uct of O2 is POF3. Oxygen isotope fractionation between O2
and POF3, however is mass-dependent and, thus, has littleor no impact on D17O values (Jones et al., 1999).
The analyses of iron phosphate inclusions in EET showmutually consistent values of D17O, averaging +1.134 ±0.017& (1r) (Table 1). This value is well within the range

Table 2Osmium isotopic and HSE + Ni composition data for IVA irons. Samples are listed in order of descending Re concentration. Nickelconcentrations are in wt.%, HSE are in ng/g. D187Os – per mil deviation from isochrons.
Sample IS Wt. (g) Ni Re Os Ir Ru Pt Pd 187Os/188Os 187Re/188Os D187Os
IVA irons
Jamestownp
0.24 74.5 379.5 4245.1 3450 4770 6648 2902 0.12939 0.4308 �0.5p0.18 377.9 4229.0 6452 0.12950 0.4307 0.6
Maria Elena (1935) 0.21 75.5 348.4 3777.6 3190 4703 6621 3242 0.13011 0.4445 �4.1p0.16 342.5 3762.9 6491 0.13008 0.4387 0.2
Yanhuitlan 0.19 75.1 345.9 3795.0 3193 4743 6656 3026 0.12977 0.4393 �3.3p0.12 343.4 3791.9 6650 0.12978 0.4365 �1.1
La Grange 0.25 75.7 285.3 2983.1 2656 4361 6414 3430 0.13146 0.4611 �3.6p0.23 284.7 3013.3 6251 0.13139 0.4554 0.1
Gibeon 0.20 77.8 272.9 2809.9 2560 4320 6088 3619 0.13215 0.4681 �2.3p0.18 269.9 2797.2 6222 0.13218 0.4652 0.4
Charlotte 0.11 80.4 204.1 1954.5 1941 3862 5922 4437 0.13465 0.5036 �5.1p0.21 200.2 1944.2 5787 0.13466 0.4966 0.4
Muonionalustap
0.24 84.8 114.5 1090.9 1146 2754 4462 6471 0.13546 0.5064 0.8Bushman Land
p0.24 87.6 111.0 958.55 1170 3085 5062 5663 0.13943 0.5590 �0.9p0.27 112.0 966.39 4968 0.13950 0.5591 �0.3
Steinbachp
0.33 94 71.44 542.01 783 2846 4708 6626 0.14552 0.6365 �0.9p0.14 73.42 557.30 4717 0.14564 0.6362 0.5
New Westvillep
0.45 94.1 43.76 319.46 493 2047 3650 6394 0.14755 0.6617 �0.4p0.25 43.62 318.29 3560 0.14760 0.6620 �0.1
Duchesne 0.44 92.8 36.32 248.77 395 1995 3193 7813 0.14882 0.6812 �2.9p0.18 34.81 247.92 3222 0.14894 0.6784 0.50.17 34.64 246.14 3182 0.14871 0.6800 �3.1
Duel Hill (1854) 0.44 104.5 33.70 246.36 378.9 1695 3158 7673 0.14887 0.6843 �4.9p0.25 34.32 244.32 2965 0.14890 0.6788 �0.3p0.23 34.33 245.04 2971 0.14889 0.6769 1.2
Fuzzy Creek 0.32 111.3 16.91 135.84 204.0 1469 2566 8142 0.14230 0.6009 �5.1p0.30 16.61 133.80 2485 0.14265 0.5995 �0.5
Chinautlap
0.29 95.4 8.605 47.662 2396 0.16423 0.8741 �0.50.26 8.503 47.299 127.8 1429 2490 5207 0.16418 0.8703 2.0
EET 83230 0.21 163 8.686 63.460 95.40 1053 1616 9820 0.14643 0.6611 �11.1
6826 T.J. McCoy et al. / Geochimica et Cosmochimica Acta 75 (2011) 6821–6843
of values measured in IVA iron meteorites for silicates of+1.02& to +1.26&, as reported by Clayton and Mayeda(1996), and for bronzite and tridymite of +1.07& to+1.26&, as reported by Wang et al. (2004) (Fig. 1).
3.2. 187Re–187Os and highly siderophile elements
Rhenium–Os isotopic, and bulk HSE concentration datafor the IVA iron meteorites are provided in Table 2. Dupli-cate isotope dilution analyses of separate meteorite chunksin most instances generally provide very similar Re/Os ratiosand Os isotopic compositions, within analytical uncertain-ties. The greatest total deviation in 187Os/188Os and187Re/188Os from the average for duplicate or triplicate anal-yses of each sample was no more than 0.12% (Fuzzy Creek)and 0.89% (EET), respectively. Absolute concentrations ofRe and Os in duplicate or triplicate analyses of samples var-ied from the average a maximum of 2.1% (Duchesne) and1.4% (Steinbach), respectively. Duplicate or triplicate analy-ses of Pt also suggest reproducibility of no worse than�±3%(for EET). Further discussion of analytical reproducibilityand a comparison of data with published results are pro-vided in the Electronic Annex Table EA1.
The new results are indicative of minimal heterogeneitieswith respect to HSE within bulk samples, on the mm scale
sampled by different chunks. Heterogeneities resulting fromthe sampling of widely separated chunks of the meteorite(e.g., pieces from different museum collections) cannot beassessed here.
The moderate fractionation of Re from Os duringcrystallization of the IVA suite led to a range in 187Re/188Osfrom 0.431 (Jamestown) to 0.983 (Chinautla), and acorresponding range in 187Os/188Os from 0.1294 to0.1642. A regression of 187Os/188Os versus 187Re/188Os datafor 14 IVA irons (and five duplicate analyses) gives a slopeof 0.07858 ± 0.00030 (2r), and an initial 187Os/188Os =0.09559 ± 0.00017 using ISOPLOT (Ludwig, 2003)(Fig. 2). Application of a k for 187Re = 1.666 � 10�11 yr�1
(Smoliar et al., 1996) yields an age of 4540 ± 17 Ma(MSWD = 1.8). This age is significantly older than the pre-viously reported Re–Os isochron age of 4464 ± 26 Ma, andthe intercept is correspondingly lower compared with thevalue of 0.09584 ± 23, reported for 10 IVA iron meteorites(Smoliar et al., 1996). That study recognized considerablevariance of data about the isochron they reported andeliminated data for three samples that would have beenconsistent with an older age. The new isochron age is sim-ilar to the Re–Os ages of other iron meteorite groups (Lucket al., 1980; Horan et al., 1992, 1998; Shen et al., 1996;Smoliar et al., 1996; Cook et al., 2004; Walker et al., 2008).
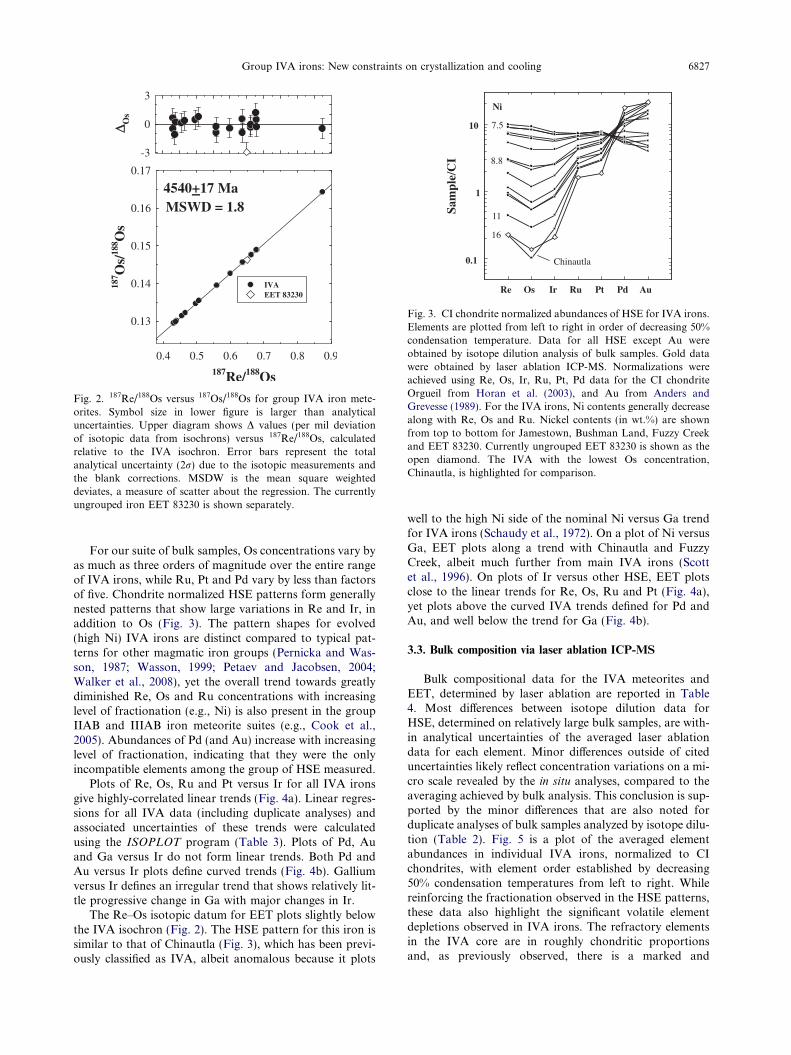
Fig. 2. 187Re/188Os versus 187Os/188Os for group IVA iron mete-orites. Symbol size in lower figure is larger than analyticaluncertainties. Upper diagram shows D values (per mil deviationof isotopic data from isochrons) versus 187Re/188Os, calculatedrelative to the IVA isochron. Error bars represent the totalanalytical uncertainty (2r) due to the isotopic measurements andthe blank corrections. MSDW is the mean square weighteddeviates, a measure of scatter about the regression. The currentlyungrouped iron EET 83230 is shown separately.
Re Os Ir Ru Pt Pd Au
Sam
ple/
CI
0.1
1
10
Chinautla
7.5
11
16
8.8
Ni
Fig. 3. CI chondrite normalized abundances of HSE for IVA irons.Elements are plotted from left to right in order of decreasing 50%condensation temperature. Data for all HSE except Au wereobtained by isotope dilution analysis of bulk samples. Gold datawere obtained by laser ablation ICP-MS. Normalizations wereachieved using Re, Os, Ir, Ru, Pt, Pd data for the CI chondriteOrgueil from Horan et al. (2003), and Au from Anders andGrevesse (1989). For the IVA irons, Ni contents generally decreasealong with Re, Os and Ru. Nickel contents (in wt.%) are shownfrom top to bottom for Jamestown, Bushman Land, Fuzzy Creekand EET 83230. Currently ungrouped EET 83230 is shown as theopen diamond. The IVA with the lowest Os concentration,Chinautla, is highlighted for comparison.
Group IVA irons: New constraints on crystallization and cooling 6827
For our suite of bulk samples, Os concentrations vary byas much as three orders of magnitude over the entire rangeof IVA irons, while Ru, Pt and Pd vary by less than factorsof five. Chondrite normalized HSE patterns form generallynested patterns that show large variations in Re and Ir, inaddition to Os (Fig. 3). The pattern shapes for evolved(high Ni) IVA irons are distinct compared to typical pat-terns for other magmatic iron groups (Pernicka and Was-son, 1987; Wasson, 1999; Petaev and Jacobsen, 2004;Walker et al., 2008), yet the overall trend towards greatlydiminished Re, Os and Ru concentrations with increasinglevel of fractionation (e.g., Ni) is also present in the groupIIAB and IIIAB iron meteorite suites (e.g., Cook et al.,2005). Abundances of Pd (and Au) increase with increasinglevel of fractionation, indicating that they were the onlyincompatible elements among the group of HSE measured.
Plots of Re, Os, Ru and Pt versus Ir for all IVA ironsgive highly-correlated linear trends (Fig. 4a). Linear regres-sions for all IVA data (including duplicate analyses) andassociated uncertainties of these trends were calculatedusing the ISOPLOT program (Table 3). Plots of Pd, Auand Ga versus Ir do not form linear trends. Both Pd andAu versus Ir plots define curved trends (Fig. 4b). Galliumversus Ir defines an irregular trend that shows relatively lit-tle progressive change in Ga with major changes in Ir.
The Re–Os isotopic datum for EET plots slightly belowthe IVA isochron (Fig. 2). The HSE pattern for this iron issimilar to that of Chinautla (Fig. 3), which has been previ-ously classified as IVA, albeit anomalous because it plots
well to the high Ni side of the nominal Ni versus Ga trendfor IVA irons (Schaudy et al., 1972). On a plot of Ni versusGa, EET plots along a trend with Chinautla and FuzzyCreek, albeit much further from main IVA irons (Scottet al., 1996). On plots of Ir versus other HSE, EET plotsclose to the linear trends for Re, Os, Ru and Pt (Fig. 4a),yet plots above the curved IVA trends defined for Pd andAu, and well below the trend for Ga (Fig. 4b).
3.3. Bulk composition via laser ablation ICP-MS
Bulk compositional data for the IVA meteorites andEET, determined by laser ablation are reported in Table4. Most differences between isotope dilution data forHSE, determined on relatively large bulk samples, are with-in analytical uncertainties of the averaged laser ablationdata for each element. Minor differences outside of citeduncertainties likely reflect concentration variations on a mi-cro scale revealed by the in situ analyses, compared to theaveraging achieved by bulk analysis. This conclusion is sup-ported by the minor differences that are also noted forduplicate analyses of bulk samples analyzed by isotope dilu-tion (Table 2). Fig. 5 is a plot of the averaged elementabundances in individual IVA irons, normalized to CIchondrites, with element order established by decreasing50% condensation temperatures from left to right. Whilereinforcing the fractionation observed in the HSE patterns,these data also highlight the significant volatile elementdepletions observed in IVA irons. The refractory elementsin the IVA core are in roughly chondritic proportionsand, as previously observed, there is a marked and

Ir (ng/g)
100 1000 10000
HSE
(ng
/g)
1
10
100
1000
10000
Ru
Pt
Os
Re
a
Ir (ng/g)
100 1000 10000
HSE
(ng
/g)
1000
10000
Pd
Au
Ga
b
Fig. 4. Logarithmic plot of the concentration of Ir (in ng/g) versus other HSE concentrations, as well as the volatile moderately siderophileelement Ga (also in ng/g). (a) Rhenium, Os, Ru and Pt data for all IVA irons plot along well-correlated linear trends. Results of regressionsare provided in Table 3. (b) Palladium and Au data plot along curved arrays, consistent with D values that change in a non-linear mannerrelative to Ir. Gallium data show a steep increase in concentration with decrease in Ir, then a gradual decline. Data for the currentlyungrouped iron EET 83230 are shown as diamonds.
Table 3Linear regressions and uncertainties (2r) of log–log plots of HSEconcentration data versus Ir. Regressions do not include data forEET 83230. MSWD, mean squared weighted deviates.
Element Slope 2r MSWD
Re 1.098 0.035 0.28Os 1.268 0.056 3.5Ru 0.435 0.033 1.5Pt 0.343 0.025 1.3
1 For interpretation of color in this figure, the reader is referredto the web version of this article.
6828 T.J. McCoy et al. / Geochimica et Cosmochimica Acta 75 (2011) 6821–6843
progressive depletion in moderately volatile elements thatfollows a relative scale of half-mass condensation tempera-tures for a given nebular environment, with Ge being >2 or-ders of magnitude depleted relative to the refractoryelements.
In addition to the differences in some elements betweenkamacite and taenite domains noted above, we also ob-served minor domains, as the laser beam advanced alongtracks where phosphides and high Cr and Mo (oxide orphosphate?) phases were encountered; these heterogeneitiesreflect phases that are likely <20 lm across (with size esti-mate based on 3 s or less transient signals during ablationthat reveal 1–2 order of magnitude sharp increases in signalintensity). Plots showing the relative partitioning of ele-ments between kamacite (low Ni phase) and taenite (higherNi phase) for several elements in various IVA irons are pro-vided in the Electronic Annex Fig. EA1. Again, it is impor-tant to note that because of spatial overlap of the laserbeam, end member compositions of each phase were likelyrarely obtained. Important for this study is the fact that,although HSE distributions between kamacite and taeniteare typically resolvable, they are not so large as to causemajor biases in bulk composition data as a result of prefer-ential sampling of one phase versus the other.
3.4. Metallography
3.4.1. Fuzzy Creek (IVA)
Fuzzy Creek has a recrystallized-reheated microstruc-ture (Fig. 6) and lacks the expected fine octahedral structure
of the IVA irons. The kamacite matrix shows a recrystal-lized structure with a grain size of 5–20 lm. Taenite grains,which are 2–10 lm in size are distributed on grain bound-aries and kamacite triple junctions together with a smallernumber of schreibersite grains (�0.5 vol %) 1–2 lm in size.Some of the taenite regions contain small kamacite precip-itates while other taenite regions do not.
The bulk composition of Fuzzy Creek, obtained fromline scans obtained with the electron probe microanalyzer,and accounting for the wt.% P present in small phosphides,is 12.4 wt.% Ni, 86.2 wt.% Fe, 0.49 wt.% Co and 0.18 wt.%P. Nickel and Fe contents determined by laser ablationICP-MS are, respectively, 1.1 wt.% lower and 2.1 wt.%higher (Table 4). These differences could reflect analyticaldifferences, or minor differences in bulk composition amongdifferent pieces of the meteorite analyzed. For the purposeshere, the differences are not considered important. Theaverage Ni content of the kamacite and phosphide phasesare: 6.9 ± 0.1 and 37 wt.%, respectively. Taenite regionsare not chemically homogeneous at the spatial resolutionof the electron probe microanalyzer of 1 lm, and vary from22 to 32 wt.% Ni with an average Ni content of26.2 ± 2.8 wt.% (Yang et al., 2011).
The crystal structure of the kamacite and the taenite re-gions at kamacite–kamacite grain boundaries can be ob-served using EBSD. Fig. 7a shows the bcc kamacitegrains of different orientation (color)1 that dominate themicrostructure. There is also a large amount of bcc materialof differing orientation within the taenite regions at thekamacite/kamacite grain boundaries. The bcc structure isobserved in the taenite regions as both bcc kamacite andas bcc martensite, a2. The bcc martensite forms on coolingof the taenite with Ni contents less than about 28 wt.%.Fig. 7b shows the fcc taenite which has a Ni content greaterthan about 28 wt.% Ni. It appears from the orientationmaps that there are fcc taenite regions with Ni contentsabove 28 wt.% and other taenite regions with fine scale
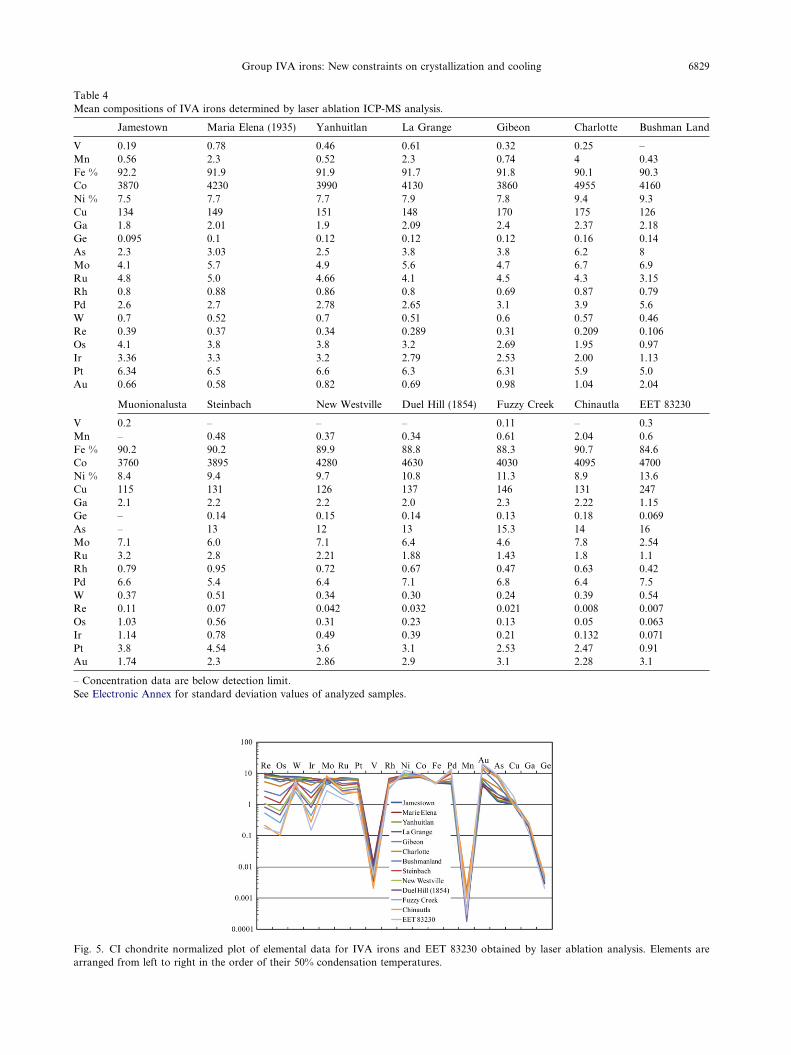
Table 4Mean compositions of IVA irons determined by laser ablation ICP-MS analysis.
Jamestown Maria Elena (1935) Yanhuitlan La Grange Gibeon Charlotte Bushman Land
V 0.19 0.78 0.46 0.61 0.32 0.25 –Mn 0.56 2.3 0.52 2.3 0.74 4 0.43Fe % 92.2 91.9 91.9 91.7 91.8 90.1 90.3Co 3870 4230 3990 4130 3860 4955 4160Ni % 7.5 7.7 7.7 7.9 7.8 9.4 9.3Cu 134 149 151 148 170 175 126Ga 1.8 2.01 1.9 2.09 2.4 2.37 2.18Ge 0.095 0.1 0.12 0.12 0.12 0.16 0.14As 2.3 3.03 2.5 3.8 3.8 6.2 8Mo 4.1 5.7 4.9 5.6 4.7 6.7 6.9Ru 4.8 5.0 4.66 4.1 4.5 4.3 3.15Rh 0.8 0.88 0.86 0.8 0.69 0.87 0.79Pd 2.6 2.7 2.78 2.65 3.1 3.9 5.6W 0.7 0.52 0.7 0.51 0.6 0.57 0.46Re 0.39 0.37 0.34 0.289 0.31 0.209 0.106Os 4.1 3.8 3.8 3.2 2.69 1.95 0.97Ir 3.36 3.3 3.2 2.79 2.53 2.00 1.13Pt 6.34 6.5 6.6 6.3 6.31 5.9 5.0Au 0.66 0.58 0.82 0.69 0.98 1.04 2.04
Muonionalusta Steinbach New Westville Duel Hill (1854) Fuzzy Creek Chinautla EET 83230
V 0.2 – – – 0.11 – 0.3Mn – 0.48 0.37 0.34 0.61 2.04 0.6Fe % 90.2 90.2 89.9 88.8 88.3 90.7 84.6Co 3760 3895 4280 4630 4030 4095 4700Ni % 8.4 9.4 9.7 10.8 11.3 8.9 13.6Cu 115 131 126 137 146 131 247Ga 2.1 2.2 2.2 2.0 2.3 2.22 1.15Ge – 0.14 0.15 0.14 0.13 0.18 0.069As – 13 12 13 15.3 14 16Mo 7.1 6.0 7.1 6.4 4.6 7.8 2.54Ru 3.2 2.8 2.21 1.88 1.43 1.8 1.1Rh 0.79 0.95 0.72 0.67 0.47 0.63 0.42Pd 6.6 5.4 6.4 7.1 6.8 6.4 7.5W 0.37 0.51 0.34 0.30 0.24 0.39 0.54Re 0.11 0.07 0.042 0.032 0.021 0.008 0.007Os 1.03 0.56 0.31 0.23 0.13 0.05 0.063Ir 1.14 0.78 0.49 0.39 0.21 0.132 0.071Pt 3.8 4.54 3.6 3.1 2.53 2.47 0.91Au 1.74 2.3 2.86 2.9 3.1 2.28 3.1
– Concentration data are below detection limit.See Electronic Annex for standard deviation values of analyzed samples.
Fig. 5. CI chondrite normalized plot of elemental data for IVA irons and EET 83230 obtained by laser ablation analysis. Elements arearranged from left to right in the order of their 50% condensation temperatures.
Group IVA irons: New constraints on crystallization and cooling 6829

Fig. 6. Reflected light photograph of the Fuzzy Creek microstruc-ture. K, kamacite; T, taenite; and Ph, phosphide. Arrows point tophosphides present at kamacite/kamacite grain boundaries. Fieldof view is 80 � 70 lm.
6830 T.J. McCoy et al. / Geochimica et Cosmochimica Acta 75 (2011) 6821–6843
bcc martensite and bcc kamacite precipitates. The taenitecontaining 31–33 wt.% Ni, as measured by the electronmicroprobe, has a Kurdjumov–Sachs {110}bcc//{11 1}fccorientation relationship with the adjacent recrystallizedkamacite which contains �7 wt.% Ni.
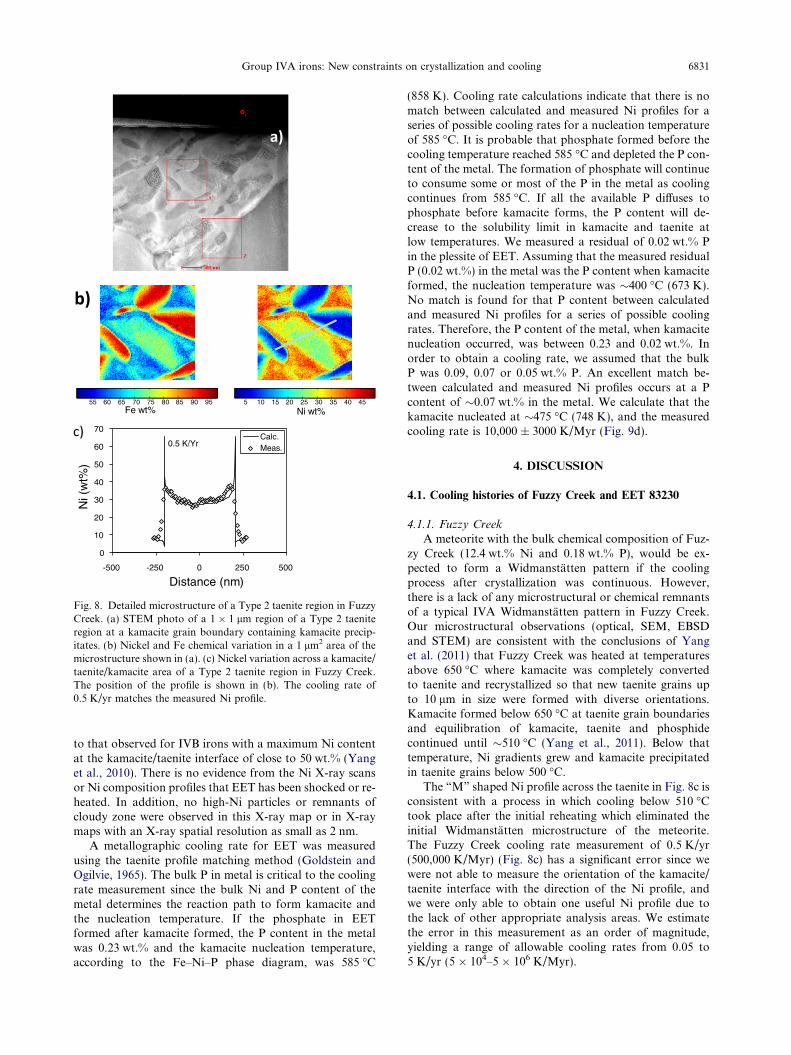
The taenite regions were observed in more detail in theSTEM using thin sections of Fuzzy Creek. Fig. 8a showsa STEM dark field image of a 4 � 4 lm taenite region con-taining kamacite precipitates. A quantitative X-ray scanshowing the Ni and Fe chemical variation in a 1 lm2 areaof the taenite region (Fig. 8a) is shown in Fig. 8b. The tae-nite–martensite regions have about 25–27 wt.% Ni in theircenters (light green) with increasing Ni to >35 wt.% at theinterfaces (red) with kamacite, which contains �7 wt.% Ni(dark blue). Fig. 8c shows a quantitative “M” shaped Niprofile across the taenite in a kamacite/taenite/kamacite re-gion in Fig. 8b.
One cooling rate measurement for Fuzzy Creek was ob-tained by modeling the nucleation and growth process of akamacite precipitate which formed inside a taenite grain
Fig. 7. EBSD analysis of Fuzzy Creek. (a) Bcc polycrystals. Kamacite witaenite regions. (b) Fcc poly-crystals �31–33 wt.% Ni. Curved black arroboundaries during reheating of the Fuzzy Creek meteorite. Curved whitetaenite (now bcc martensite) from the formation of the Widmanstatten paduring final cooling.
during slow cooling from the reheating temperature(Fig. 8a–c). We chose the initial composition of the taeniteparticle as the average taenite composition of 24.5 wt.% Nifor the specific taenite region in Fig. 8a. We assume that P issaturated in taenite, since the bulk P content is 0.18 wt.%and phosphide is prevalent in the meteorite. Therefore,kamacite nucleates by mechanism II (c! c + Ph.!a + c + Ph.) according to Yang and Goldstein (2005),and the nucleation temperature for the kamacite precipi-tates is about 520 �C (793 K) (Yang and Goldstein, 2006).The Fe–Ni and Fe–Ni–P phase diagrams, and the interdif-fusion coefficients, which control the growth of theWidmanstatten pattern, are given by Yang et al. (2008).The simulated result using the taenite profile matchingmethod (Goldstein and Ogilvie, 1965) and the measuredresults (Fig. 8c) match for a given cooling rate at 0.5 K/yr(500,000 K/Myr) (Fig. 8c).
3.4.2. EET 83230
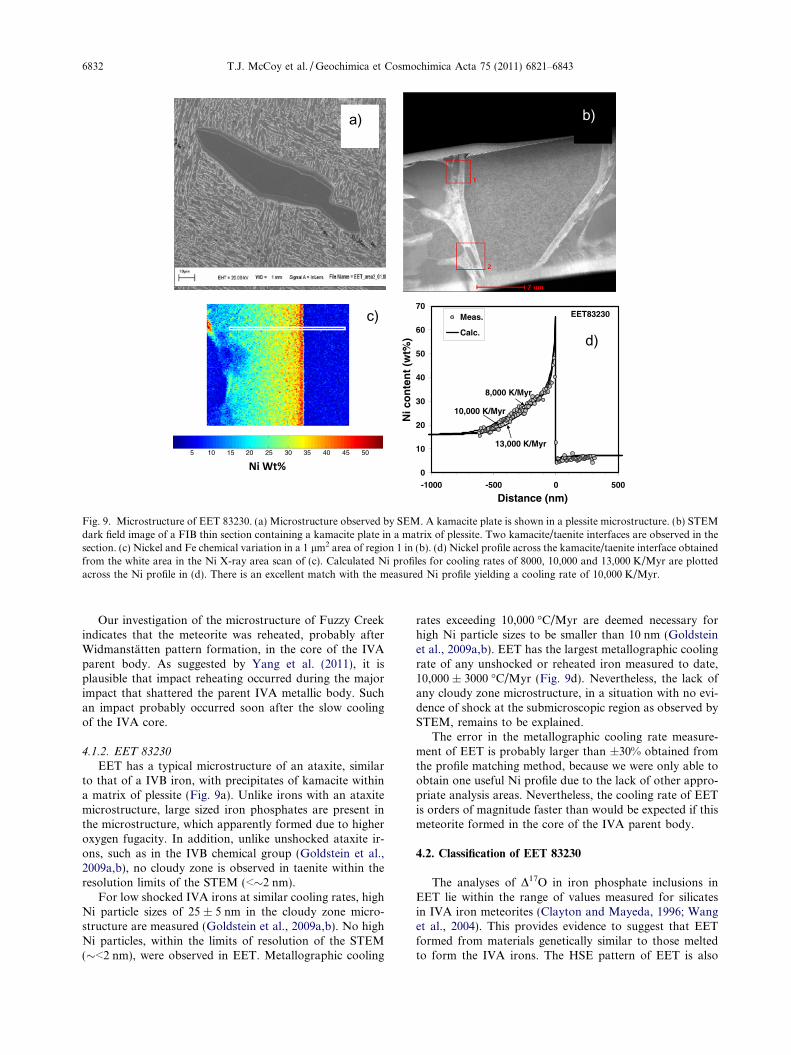
Clarke (1989) described remarkable mm-sized crystals ofnearly pure iron phosphate (Fe3(PO4)2, sarcopside or graf-tonite) in EET which are rimmed by troilite. EET has a typ-ical microstructure of an unshocked ataxite, similar to thatof an unshocked IVB iron, with precipitates of kamacitewithin a matrix of plessite (Fig. 9a). No cloudy zone is ob-served in taenite at high magnification in the SEM, and noapparent post shock or reheating event changes are ob-served in the microstructure.
The kamacite/taenite interface was observed in more de-tail using the STEM to determine if a cloudy zone structureis present and if there are any features which indicate ashock or reheating event. Fig. 9b shows a STEM photo ofa FIB thin section containing a kamacite plate in a matrixof plessite in EET. The FIB section was cut normal to akamacite/taenite boundary on the polished surface of thesample. The Ni and Fe chemical variation in a 1 lm2 areaof this microstructure (scan area 1 in Fig. 9b) is shown inFig. 9c. A Ni composition profile normal to the kamacite/taenite interface is shown in Fig. 9d. The Ni profile is similar
th �7 wt.% Ni, fine scale martensite �24–28 wt.% Ni within Type 2w points to Type 1 taenite particles formed on kamacite/kamacitearrow points to Type 2 taenite regions containing residual high Nittern, and high Ni taenite formed at the reheating temperature and
55 60 65 70 75 80 85 90 95 5 10 15 20 25 30 35 40 45Fe wt% Ni wt%
0
10
20
30
40
50
60
70
-500 -250 0 250 500
Distance (nm)
Ni (
wt%
)
Calc.Meas.0.5 K/Yr
Fig. 8. Detailed microstructure of a Type 2 taenite region in FuzzyCreek. (a) STEM photo of a 1 � 1 lm region of a Type 2 taeniteregion at a kamacite grain boundary containing kamacite precip-itates. (b) Nickel and Fe chemical variation in a 1 lm2 area of themicrostructure shown in (a). (c) Nickel variation across a kamacite/taenite/kamacite area of a Type 2 taenite region in Fuzzy Creek.The position of the profile is shown in (b). The cooling rate of0.5 K/yr matches the measured Ni profile.
Group IVA irons: New constraints on crystallization and cooling 6831
to that observed for IVB irons with a maximum Ni contentat the kamacite/taenite interface of close to 50 wt.% (Yanget al., 2010). There is no evidence from the Ni X-ray scansor Ni composition profiles that EET has been shocked or re-heated. In addition, no high-Ni particles or remnants ofcloudy zone were observed in this X-ray map or in X-raymaps with an X-ray spatial resolution as small as 2 nm.
A metallographic cooling rate for EET was measuredusing the taenite profile matching method (Goldstein andOgilvie, 1965). The bulk P in metal is critical to the coolingrate measurement since the bulk Ni and P content of themetal determines the reaction path to form kamacite andthe nucleation temperature. If the phosphate in EETformed after kamacite formed, the P content in the metalwas 0.23 wt.% and the kamacite nucleation temperature,according to the Fe–Ni–P phase diagram, was 585 �C
(858 K). Cooling rate calculations indicate that there is nomatch between calculated and measured Ni profiles for aseries of possible cooling rates for a nucleation temperatureof 585 �C. It is probable that phosphate formed before thecooling temperature reached 585 �C and depleted the P con-tent of the metal. The formation of phosphate will continueto consume some or most of the P in the metal as coolingcontinues from 585 �C. If all the available P diffuses tophosphate before kamacite forms, the P content will de-crease to the solubility limit in kamacite and taenite atlow temperatures. We measured a residual of 0.02 wt.% Pin the plessite of EET. Assuming that the measured residualP (0.02 wt.%) in the metal was the P content when kamaciteformed, the nucleation temperature was �400 �C (673 K).No match is found for that P content between calculatedand measured Ni profiles for a series of possible coolingrates. Therefore, the P content of the metal, when kamacitenucleation occurred, was between 0.23 and 0.02 wt.%. Inorder to obtain a cooling rate, we assumed that the bulkP was 0.09, 0.07 or 0.05 wt.% P. An excellent match be-tween calculated and measured Ni profiles occurs at a Pcontent of �0.07 wt.% in the metal. We calculate that thekamacite nucleated at �475 �C (748 K), and the measuredcooling rate is 10,000 ± 3000 K/Myr (Fig. 9d).
4. DISCUSSION
4.1. Cooling histories of Fuzzy Creek and EET 83230
4.1.1. Fuzzy Creek
A meteorite with the bulk chemical composition of Fuz-zy Creek (12.4 wt.% Ni and 0.18 wt.% P), would be ex-pected to form a Widmanstatten pattern if the coolingprocess after crystallization was continuous. However,there is a lack of any microstructural or chemical remnantsof a typical IVA Widmanstatten pattern in Fuzzy Creek.Our microstructural observations (optical, SEM, EBSDand STEM) are consistent with the conclusions of Yanget al. (2011) that Fuzzy Creek was heated at temperaturesabove 650 �C where kamacite was completely convertedto taenite and recrystallized so that new taenite grains upto 10 lm in size were formed with diverse orientations.Kamacite formed below 650 �C at taenite grain boundariesand equilibration of kamacite, taenite and phosphidecontinued until �510 �C (Yang et al., 2011). Below thattemperature, Ni gradients grew and kamacite precipitatedin taenite grains below 500 �C.
The “M” shaped Ni profile across the taenite in Fig. 8c isconsistent with a process in which cooling below 510 �Ctook place after the initial reheating which eliminated theinitial Widmanstatten microstructure of the meteorite.The Fuzzy Creek cooling rate measurement of 0.5 K/yr(500,000 K/Myr) (Fig. 8c) has a significant error since wewere not able to measure the orientation of the kamacite/taenite interface with the direction of the Ni profile, andwe were only able to obtain one useful Ni profile due tothe lack of other appropriate analysis areas. We estimatethe error in this measurement as an order of magnitude,yielding a range of allowable cooling rates from 0.05 to5 K/yr (5 � 104–5 � 106 K/Myr).
0
10
20
30
40
50
60
70
-1000 -500 0 500
Distance (nm)
Ni c
on
ten
t (w
t%)
Meas.
Calc.
8,000 K/Myr
10,000 K/Myr
13,000 K/Myr
EET83230
a) b)
5 10 15 20 25 30 35 40 45 50
c) d)
Fig. 9. Microstructure of EET 83230. (a) Microstructure observed by SEM. A kamacite plate is shown in a plessite microstructure. (b) STEMdark field image of a FIB thin section containing a kamacite plate in a matrix of plessite. Two kamacite/taenite interfaces are observed in thesection. (c) Nickel and Fe chemical variation in a 1 lm2 area of region 1 in (b). (d) Nickel profile across the kamacite/taenite interface obtainedfrom the white area in the Ni X-ray area scan of (c). Calculated Ni profiles for cooling rates of 8000, 10,000 and 13,000 K/Myr are plottedacross the Ni profile in (d). There is an excellent match with the measured Ni profile yielding a cooling rate of 10,000 K/Myr.
6832 T.J. McCoy et al. / Geochimica et Cosmochimica Acta 75 (2011) 6821–6843
Our investigation of the microstructure of Fuzzy Creekindicates that the meteorite was reheated, probably afterWidmanstatten pattern formation, in the core of the IVAparent body. As suggested by Yang et al. (2011), it isplausible that impact reheating occurred during the majorimpact that shattered the parent IVA metallic body. Suchan impact probably occurred soon after the slow coolingof the IVA core.
4.1.2. EET 83230
EET has a typical microstructure of an ataxite, similarto that of a IVB iron, with precipitates of kamacite withina matrix of plessite (Fig. 9a). Unlike irons with an ataxitemicrostructure, large sized iron phosphates are present inthe microstructure, which apparently formed due to higheroxygen fugacity. In addition, unlike unshocked ataxite ir-ons, such as in the IVB chemical group (Goldstein et al.,2009a,b), no cloudy zone is observed in taenite within theresolution limits of the STEM (<�2 nm).
For low shocked IVA irons at similar cooling rates, highNi particle sizes of 25 ± 5 nm in the cloudy zone micro-structure are measured (Goldstein et al., 2009a,b). No highNi particles, within the limits of resolution of the STEM(�<2 nm), were observed in EET. Metallographic cooling
rates exceeding 10,000 �C/Myr are deemed necessary forhigh Ni particle sizes to be smaller than 10 nm (Goldsteinet al., 2009a,b). EET has the largest metallographic coolingrate of any unshocked or reheated iron measured to date,10,000 ± 3000 �C/Myr (Fig. 9d). Nevertheless, the lack ofany cloudy zone microstructure, in a situation with no evi-dence of shock at the submicroscopic region as observed bySTEM, remains to be explained.
The error in the metallographic cooling rate measure-ment of EET is probably larger than ±30% obtained fromthe profile matching method, because we were only able toobtain one useful Ni profile due to the lack of other appro-priate analysis areas. Nevertheless, the cooling rate of EETis orders of magnitude faster than would be expected if thismeteorite formed in the core of the IVA parent body.
4.2. Classification of EET 83230
The analyses of D17O in iron phosphate inclusions inEET lie within the range of values measured for silicatesin IVA iron meteorites (Clayton and Mayeda, 1996; Wanget al., 2004). This provides evidence to suggest that EETformed from materials genetically similar to those meltedto form the IVA irons. The HSE pattern of EET is also

Group IVA irons: New constraints on crystallization and cooling 6833
similar to some in the IVA iron suite, however, the muchhigher Ni content, coupled with the large difference in cool-ing rate compared with other evolved IVA irons, probablymean that it did not form from the same magma.
The most likely explanation for these apparently contra-dictory characteristics is that the meteorite formed in a sec-ond parent body. The hit and run impact model of Asphauget al. (2006) invoked for IVA irons by Ruzicka and Hutson(2006) and Yang et al. (2008), allows for several moltenmetallic bodies to be formed as part of the same impactonto a larger body, thus, irons from different offspringbodies could have very similar chemical/isotopic composi-tions, but different cooling histories. For this scenario,EET could have been derived from an independent, muchsmaller body, having a much faster cooling rate. A similarcase for crystallization in genetically related, but distinctparent bodies has previously been made for Fuzzy Creek(Yang et al., 2007), and for Maria Elena (1935), which dis-plays a Widmanstatten pattern when viewed by eye, but hasbeen severely reheated with the formation of rounded tae-nite regions at kamacite/taenite boundaries. Because ofpossible minor differences in volatile components, such asS, in secondary metallic bodies, similar, but not necessarilyidentical crystallization paths would be expected for ele-ments like HSE. Consequently, the good but not perfectfit of the HSE data for EET compared to the IVA ironscan be explained.
4.3. 187Re–187Os isotopic constraints
The Re–Os isotopic systematics of the IVA irons define agenerally well-constrained isochron. The goodness of fit ofthe data to a primordial isochron limits possible open-sys-tem behavior of Re and Os, and likely the other HSE, tono more than a few tens of Ma subsequent to crystallization.This supports the assumption that the relative HSE abun-dances of these iron meteorites were set by primary mag-matic processes in a core. The initial 187Os/188Os ratio forthe isochron is similar to prior estimates for the initial ratiofor the solar system (Shen et al., 1996; Smoliar et al., 1996).The Re–Os age of the IVA isochron, within regressionuncertainties, is a minimum of 10 Ma younger than the for-mation of the first solids in the solar system at �4.567 Ga(e.g., Amelin et al., 2002). A recent U–Pb isotope study oftroilites from the IVA iron Muonionalusta, however, re-ported an older isochron age of 4.5635 ± 0.0005 Ga, indi-cating crystallization �3 Ma subsequent to the formationof the first solids in the solar system (Blichert-Toft et al.,2010). The latter age is also consistent with model 182W agesthat suggest very early segregation of metal from silicate inthe IVA parent body (e.g., Horan et al., 1998; Burkhardtet al., 2009). The disagreement between Re–Os and U–Pbages of �0.5% may reflect uncertainties in the 187Re decayconstant (not included in the regression uncertainty). How-ever, two independent determinations of the 187Re decayconstant differ by only as much as 0.2% (Smoliar et al.,1996; Selby et al., 2007). Selby et al. (2007) based their deter-mination on a cross calibration of Re–Os and U–Pb ages forterrestrial materials. Collectively, these results suggest thatuncertainty in the decay constant and cross calibration
errors between Re–Os and U–Pb are less than can accountfor the age differential. The difference in ages may also resultfrom crystallization over an extended period of time, as sug-gested by the diversity in cooling rates. Muonionalustalikely cooled rapidly, comparable to the cooling rate of sim-ilarly evolved Gibeon, whereas some of the most chemicallyevolved IVA irons with high Re/Os, such as Chinautla mayhave taken more than 10 Myr to cool sufficiently to becomeclosed to Re–Os transport. Slow cooling of the more evolvedportions of the core could lead to generation of a compositeIVA isochron with a slightly shallower (younger) slope thanwould be consistent if all samples crystallized essentiallysimultaneously.
The only meteorite examined here that plots resolvedlyoff (below) the IVA isochron is the ungrouped iron EET.We speculate that this reflects minor open-system behaviorof Re–Os at least 100 Ma subsequent to crystallization,rather than late crystallization, which would be inconsistentwith its rapid cooling rate.
4.4. Crystallization models
Modeling of high precision data for the HSE has provenuseful in demonstrating their coherent nature during crys-tallization of the cores of planetesimals, because of theirgenerally high abundances and predictable relative behav-iors resulting from magmatic processes (Pernicka andWasson, 1987; Chabot, 2004; Petaev and Jacobsen, 2004).A recent HSE study of the IVB magmatic iron meteoritesrevealed closed-system behavior for the Re–Os isotopic sys-tem, and well-behaved differentiation systematics for all ofthe HSE, given low (<1 wt.%) S and P contents in theparental melt to the IVB system (Walker et al., 2008).
The IVA irons likely began to crystallize from a single,molten mass of iron. Information about the chemicalcomposition of the parent body and the segregated parentalmetal, as well as the nature of the crystallization processinvolved (such as liquid–solid mixing) can, therefore, poten-tially be gleaned via modeling the HSE. In addition to theHSE, the moderately siderophile element (MSE) Ga, an-other diagnostic trace element, is modeled in order to gen-erate an internally consistent database for IVA irons withinthe broad sequence of the presumed crystal–liquid fraction-ation that created them.
Walker et al. (2008) discussed the power of specificallymodeling the HSE as a group. Nevertheless, modelingHSE in a dynamic, complex magmatic system can be chal-lenging, given the presence of even small quantities of S andP in iron systems, which reduce the tendency of the liquid tohost HSE and MSE. Further, increases in S, and to a lesserextent P, in the liquid are a likely consequence of core crys-tallization processes, because both are highly incompatiblein solid metal. Thus, solid metal–liquid metal D values ofmost HSE and MSE typically increase as S and P contentsincrease in the liquid (e.g., Jones and Drake, 1983; Jonesand Malvin, 1990; Chabot and Jones, 2003). Modeling ofsiderophile elements, therefore, requires estimates of theinitial S and P content of the system, as well as an under-standing of how D values change as crystallization proceeds(Chabot, 2004).

6834 T.J. McCoy et al. / Geochimica et Cosmochimica Acta 75 (2011) 6821–6843
As discussed for modeling the IVB system (Walker et al.,2008), our modeling of the IVA system begins with Re andOs. In brief, this element pair provides a uniquely powerfulinitial constraint on the chemical composition and pro-cesses involved in the formation of iron meteorite systems.This stems from three factors. First, for this study, Re andOs are precisely measured and the 187Re–187Os isotopic sys-tematics of the IVA system requires that abundances of Reand Os have not been modified significantly by processessubsequent to initial crystallization. Second, there is evi-dence that for this iron group, the initial Re/Os of theIVA iron core was within, or nearly within the range ofchondritic meteorites, if it is assumed the parent bodyhad a bulk chondritic composition (see below). Third, be-cause of the linearity of Ir versus Re and Os (as well asRu and Pt) on logarithmic plots (Fig. 4a), precise, internallyconsistent relative D values (concentration ratio betweensolid metal and liquid metal) for Re and Os can be obtainedfor every increment of crystallization, applying the slopes ofthose regression lines, coupled with D values for Ir that areappropriate for the S and P content of the liquid modeledand using:
Slope of correlation ¼ ½DðHSEÞ � 1�=½DðIrÞ � 1� ð1Þ
Iridium was the reference element used here for deter-mining absolute D values of Re, Os, Pt and Ru by the slopemethod, because it is the best experimentally studied of theHSE (see Walker et al. (2008) for further discussion of thisapproach towards modeling). The DIr values used here werecalculated from the parameterization of Chabot and Jones(2003). Tracking of the compositional evolution of the solidand liquid is done at 0.1% increments of crystallization,along with accounting for the progressive changes in Sand P contents of the liquid metal. For all calculations, aconstant D value for S of 0.001 was applied. Small changesin DP, and resulting changes in the concentration of P werecalculated using the appropriate S concentration of the li-quid and the parameterization for DP (Chabot and Jones,2003).
Based on cooling rate considerations, Yang et al. (2008)concluded that early formed IVA irons likely crystallizedwithin the first 10% of fractional crystallization of theIVA parent melt. Consequently, for our modeling, the Reconcentration of the hypothesized initial melt was chosenso that the first precipitating solids would have concentra-tions as similar as possible to that of the least fractionated(highest Re) IVA iron meteorite, Jamestown. The Os con-centration was iteratively fitted by adjusting Re/Os to liewithin the range of chondritic meteorites (0.082–0.092;Walker et al., 2002). Here we justify the assumption of achondritic ratio for systems containing lower S (e.g.,63 wt.%), based on a mass balance argument. The leastevolved IVA meteorites, such as Jamestown, have relativelyhigh HSE concentrations (e.g., �380 ng/g Re). If solid me-tal–liquid metal DRe values for S contents �3% or lower areapplied (D 6 2.1), parental melt concentrations necessaryto form Jamestown would have to be P190 ng/g. Giventhat the average Re concentration in chondrites is�60 ng/g (Walker et al., 2002), this minimum liquidconcentration would be consistent with virtually 100%
extraction efficiency of HSE into metal in a metal-silicatesystem in which the metal comprises �30% of the mass ofthe system, or >65% extraction efficiency into a core com-prising �20% of the mass of the system. The case becomesstronger for systems with <1 wt.% S where the smaller D
values would require high efficiency extraction into a corecomprising lower proportions of metal. For higher initialS, this constraint is lifted because of the higher D valuesand greater possible fractionation of Re/Os in initial precip-itates, although the ratio could not have been more than�10% higher than chondritic, even with 9 wt.% S.
The application of DIr values calculated for 0.5, 3 and9 wt.% initial S (and 0.1 wt.% P for each S content), defineour Models A, B and C, with initial D values for Re at 1.6,2.1 and 4.2, respectively, and for Os at 1.7, 2.3 and 4.6,respectively (slope derived DRe values compared to valuesdirectly determined using the parameterization of Chabotand Jones (2003) are provided in the Electronic AnnexFig. EA2). One implication of the models is that with high-er initial S contents (e.g., P1 wt.%) the higher D values re-quire increasingly lower levels of fractional crystallizationto produce most of the diversity of HSE concentrations inthe IVA suite. Lower starting S requires considerably moreextensive crystal–liquid fractionation to achieve the rangeof HSE concentrations observed. Models that require lim-ited levels of fractional crystallization become problematicwhen considering the wide range of cooling rates deter-mined for group IVA.
Model solid and liquid evolution tracks for plots of Reconcentration versus Re/Os, together with the data forIVA irons, are shown in Fig. 10a–f. Model A assumes thelowest initial S content, and therefore, is characterized bythe lowest D values for Re and Os. This model results inthe most limited spread between liquid and solid trackson plots of Re versus Re/Os. Our model was chosen to havean initial liquid with Re/Os at the high end of the chondriticrange (Fig. 10a and b). The Re concentration was chosen toallow formation of Jamestown within the first 2% of crys-tallization of the body, albeit forming as a 40:60 mixtureof initial solid and trapped liquid. For this model it is notpossible to use a higher initial Re/Os in the parental meltbecause increasing the ratio, without decreasing Re, wouldmove the solid and liquid tracks so that Jamestown wouldplot to the left of the mixing line between the initial meltand solid compositions. For this model, a IVA iron meteor-ite with an intermediate Re concentration, such as Bush-man Land, would be produced after �80% crystallization.Irons with lower Re would require >80% crystallization.However, our inability to calculate appropriate D values,and the sensitivity of the calculations to D values at suchhigh extents of crystallization precludes meaningful model-ing to higher percentages of crystallization. Overall, thismodel does not fit the IVA data very well. The limitedspread between liquid and solid tracks does not allow someof the IVA data to plot between the two tracks, regardlessof the starting composition. For example, using Jamestownto constrain the highest initial Re permissible for the suite,several IVA irons with high to moderate Re plot substan-tially to the right of the solid track. IVA iron compositionsin this region of the diagram cannot be achieved by either

Re (ng/g)1 10 100 1000
Re/
Os
0.06
0.08
0.10
0.12
0.14
0.16
0.18
0.20
0.22
0.20.4
0.8
0.6Fuzzy Creek
0.77
L98S2
L90S10
EET83230
Chinautla
L95S5 0.70
Chondritic
0.20.4Chondritic
0.6
0.8
Bushman Land
Chinautla
Re (ng/g)10 100
Re/
Os
0.08
0.10
0.12
0.14
0.16
0.18
0.20
EET 83230
Fuzzy Creek
Re (ng/g)
Re/
Os
0.088
0.092
0.096
0.100
0.2
0.4
Jamestown
Chondritic
0.6
200 400
Re (ng/g)
Re/
Os
0.084
0.088
0.092
0.096
0.100
0.2
0.4
Jamestown
Chondritic
200 400 600
c
a b
d
Re (ng/g)100
Re/
Os
0.080
0.085
0.090
0.095
0.100
0.2
Chondritic
500300 700
Re (ng/g)1 10 100
Re/
Os
0.08
0.10
0.12
0.14
0.16
0.18
0.20
0.2
Chondritic
0.4
e f
Fig. 10. Fractional crystallization models for Re (in ng/g) versus Re/Os calculated for three sets of starting parameters (Models A, B and C)discussed in the text. Each model is defined by the S and P concentrations assumed for the initial melt. D(Re) and D(Os) were determinedrelative to D(Ir) via the slope method discussed in the text. The method used to select the initial parameters is also discussed in the text. Theblack circles are the data for the IVA irons reported by this study. Where duplicate analyses were determined, the symbols shown are averages.Shown for comparison are liquid (red) and solid (blue) evolution tracks, as discussed in the text. The partially filled diamond symbolrepresents the starting liquid composition. The green star represents the composition of the first solid to form. Open squares with crosses alongthe liquid and solid tracks correspond to increments of 20% fractional crystallization. Mixing curves (dotted) connect the equilibrium solidsand liquids at each of these fractions. The range of Re/Os ratios within which most bulk chondrites plot is shown in the stippled areas. a.Model A with initial S of 0.5 wt.%. (b) Expanded scale view of high Re portion of (a). (c) Model B with initial S of 3 wt.%. (d) expanded scaleview of high Re portion of (c). (e) Model C with initial S of 9 wt.%. (f) Expanded scale view of high Re portion of (e). (For interpretation ofthe references to color in this figure legend, the reader is referred to the web version of this article.)
Group IVA irons: New constraints on crystallization and cooling 6835
fractional crystallization or by trapping of liquids in earlierformed solids (see Walker et al. (2008) for details of solid–liquid mixing). Because of this, we discount the possibilityof such low initial S.
Model B (Fig. 10c and d) employs a starting liquid com-position with Re/Os in the range of chondrites, and James-town forming after �22% crystallization, as approximately
a 70:30 mixture of solid and trapped equilibrium liquid.Choosing initial Re and Os concentrations to crystallizeJamestown earlier in the sequence (e.g., after substantiallyless fractional crystallization), the initial liquid would haveto have slightly suprachondritic Re/Os. For example, astarting liquid with Re/Os of �0.095 and �200 ng/g Rewould be required for Jamestown to form within the first
Table 5Bulk distribution coefficients (D values) for modeling fractionalcrystallization using two models (B and C) discussed in the text.
BI B80 CI C60
IrC&J 1.99 9.95 3.85 51.4Re 2.09 10.8 4.12 56.3Os 2.25 12.3 4.61 64.9Ru 1.43 4.90 2.24 22.9Pt 1.34 4.07 1.98 18.3PdC&J 0.458 0.658 0.531 0.951AuC&J 0.280 0.541 0.367 1.06GaC&J 0.906 2.13 1.29 5.13
I, 80 and 60 subscripts refer to values calculated for the inception ofcrystallization and after 80% (for Model B) and 60% (for Model C)crystallization. C&J – derived from Chabot and Jones (2003)parameterization. Other values obtained from slopes relative to Ir(Table 3).
6836 T.J. McCoy et al. / Geochimica et Cosmochimica Acta 75 (2011) 6821–6843
5% of crystallization. This is plausible given the possibilityof modest fractionation of Re/Os during incomplete metalsegregation combined with the higher D values accompany-ing the higher S content. Most other IVA irons examinedhere fit along either the solid track, or between it and theliquid track. A relatively low Re sample like Duchesnewould have formed after >70% fractional crystallization,and Chinautla, with the highest Re/Os of the suite exam-ined, would require >80% fractional crystallization. FuzzyCreek plots to the left of the liquid track. Its Re–Os elemen-tal systematics could be accounted for only as the result ofmixing variable proportions of a highly fractionated liquid(formed after �80% fractional crystallization) with smallproportions of a nearly equally evolved solid (formed after�70% fractional crystallization) (Fig. 10d). Based solelyupon Re–Os data, Model B is judged to be acceptable forthe IVA data. Fuzzy Creek shows no petrologic evidence(high abundances of sulfides and/or phosphides) for suchhigh percentages of a liquid component, although thatcould owe to the small size of these meteorites and unrepre-sentative sampling. Perhaps some evidence for significantmelt trapping in evolved IVA irons comes from Steinbach,which is large enough and fine-grained enough to provide arepresentative mode. Modal analyses of �18 cm2 of Stein-bach (Scott et al., 1996) reveals 6.6 vol % troilite, consistentwith inclusion of a significant, S-rich trapped meltcomponent.
Model C requires a similarly high amount of fractionalcrystallization to generate Jamestown in order to maintainthe Re/Os of the initial liquid within the range of chon-drites. In this case, the Re/Os of the parental melt can beraised as much as 6% above the chondritic range (0.098).The model shown uses a Re/Os at the upper end of thechondritic range for the parental melt (Fig. 10e and f)and is consistent with the formation of Jamestown after�15% fractional crystallization. The compositions of mostother IVA irons are consistent with formation as solids,or mixtures of solids and liquids after anywhere from�20% to nearly 60% fractional crystallization, with FuzzyCreek and EET again plotting slightly to the left of the li-quid track. As with Model B, their compositions can be ac-counted for by liquid–solid mixing. Thus, Model C also cansuccessfully account for the Re–Os systematics of the IVAirons.
Given the problems inherent with Model A, only Mod-els B and C are further considered with respect to Pt, Ru,Pd, Au and the volatile siderophile Ga. Table 5 providesinitial D values for each element, as well as D values after80% and 60% fractional crystallization for Models B andC, respectively. Due to their generally similar metal parti-tioning behavior to Ir, appropriate D values for Pt andRu were calculated for every increment of crystallizationrelative to DIr using Eq. (1) from above. Because of theirvery different and non-linear behaviors relative to the otherHSE, Pd and Au were modeled using D values obtainedfrom the parameterization of Chabot and Jones (2003).
The concentration of Pt was iteratively established nextfor Models B and C, after Re and Os. Platinum concentra-tions were chosen to achieve starting melt concentrationswith chondritic Pt/Os (between 1.7 and 2.0; Horan et al.,
2003), and to match the liquid and solid tracks to theIVA data to be as consistent as possible with the Re–Osportion of the models. The remaining element concentra-tions were chosen to crystallize solid metal bearing the com-position of Jamestown after 15–25% fractionalcrystallization (where possible), to be consistent with chon-dritic Re, Os and Pt model results.
Model B and C results for Pt versus Pt/Os are very sim-ilar to those of Re versus Re/Os (Fig. 11a–d). For Model B,most IVA meteorite compositions plot between the solidand liquid tracks, with Chinautla requiring �80% fractionalcrystallization, similar to Re–Os model results. FuzzyCreek plots between the liquid and solid tracks, and thus,the relative proportions of solid and liquid estimated bythe Re–Os and Pt–Os models are not consistent.
Internally consistent (relative to Re) estimates of the Irand Ru contents of the parental liquids are iteratively deter-mined for results from Models B and C in plots of Ir versusRe and Ir versus Ru (Electronic Annex Fig. EA3a–d). Bothmodels are consistent with Re–Os and Pt–Os results, butprovide little additional discrimination between the initialS contents. Significant differences show up, however, inthe amounts of fractional crystallization (i.e., 30–40%) re-quired to generate a lower Ni iron, like Jamestown.
Problems are apparent for Model C in plots of Ir versusPd, and Ir versus Au (Fig. 12a–d). For both element pairsModel C fails to capture the IVA irons with higher Ni con-tents between solid and liquid tracks. Thus, unless otherfactors controlled the behavior of these elements, or theparameterization of Chabot and Jones (2003) is consider-ably in error, Model C fails to account for the range ofcompositions present in IVA irons. The success of ModelB, compared to Model C, to account for all of the HSE isbest illustrated in models of evolution of residual liquidsas fractional crystallization progresses (Fig. 13a and b).Model B better describes the Au and Pd variations ob-served in the IVA suite, compared to Model C.
These findings support a model IVA core with an initialS content of �3 wt.% (Model B), instead of 0.5 wt.% (Mod-el A) as proposed by Wasson and Richardson (2001) andWasson et al. (2006), which was based on fitting a quadratic

Fig. 11. Fractional crystallization model for Pt (in ng/g) versus Pt/Os calculated for Models B and C discussed in the text. Symbols are thesame as for Fig. 10. (a and b) The range of Pt/Os ratios within which most bulk chondrites plot is shown in the stippled areas. (a) Model Bwith initial S of 3 wt.%. (b) Expanded scale view of high Pt portion of (a). (c) Model C with initial S of 9 wt.%. (d) Expanded scale view of highPt portion of (c).
Group IVA irons: New constraints on crystallization and cooling 6837
equation to Ir–Au and Ir–As, where S was the independentvariable. Their fit, however, does not well reproduce exper-imental data (see Chabot, 2004). Our conclusion of an ini-tial S content of 3 wt.% is in good agreement with studiesby Scott et al. (1996) and Chabot (2004), who based theirconclusions primarily on Ir–Au correlations, coupled withexperimental data.
As noted by previous studies (Scott et al., 1996; Chabot,2004), the Ir versus Ga trend (or Au versus Ga trend) ismore consistent with the higher initial S content of ModelC. However, neither model provides a particularly goodfit for the data. For Model B (Fig. 14a), many of the IVAdata plot outside of the liquid and solid tracks, regardlessof the initial melt composition chosen. For Model C, an ini-tial liquid composition can be chosen such that almost allIVA data plot between liquid and solid tracks. AlthoughModel C superficially appears to better account for theIVA Ga data compared to Model B, on close inspectionit too inadequately accounts for the changes in concentra-tions. The HSE define regular, progressive changes in con-centrations on element–element plots (Fig. 4a–b). Incontrast, early formed IVA irons are characterized by rela-tively sharp increases in Ga, up to a maximum concentra-tion at Gibeon for our suite. Concentrations thengenerally decrease slightly with decreasing Ir (Fig. 14a).This observation is not consistent with a gradual changein DGa as a result of progressive changes in S and P. Suchchanges in concentrations could occur as a result of an
abrupt increase of the solid–liquid D value for Ga that inturn could conceivably result from either the initiation ofcrystallization of a Ga-rich phase at the point of transition,or a sudden change (increase) in the S content of the liquid.It could also occur as a result of the loss of Ga due to post-crystallization heating of the more evolved IVA irons. Noneof these options, however, appears to be viable for the IVAsystem. We are not aware of an appropriate Ga-rich phasewhose appearance would lead to an abrupt change in D va-lue. A sudden increase in S content of the melt would likelyhave an even greater effect on the HSE, which is not ob-served. Finally, there is considerable evidence that someIVA irons experienced substantial reheating after initialcrystallization (e.g., Goldstein et al., 2009a,b). Reheatingcould possibly lead to volatile loss of Ga, although thereheating temperatures are most likely below 1000 �C,and there is no correlation between the trends and reheatinghistory of the IVA suite. Consequently, we must continueto ascribe changes in Ga to a process that remains uniden-tified in order to account for its behavior. Although Ge isnot discussed here, Ge trends in IVA irons lead to similarreasoning as for Ga.
4.5. IVA core composition and parent body characteristics
Chondrite normalized abundances of refractory throughmoderately volatile elements (Fig. 5) show effects of at leasttwo distinct processes. First we will consider the refractory

Ir (ng/g)
100 1000 10000
Pd
(ng/
g)
1000
3000
5000
7000
9000
11000
0.20.4
Chinautla
EET83230
Fuzzy Creek
0.8
0.6
Ir (ng/g)100 1000 10000
Pd
(ng/
g)
1000
3000
5000
7000
9000
11000
0.20.4
Ir (ng/g)100 1000 10000
Au
(ng/
g)
1000
3000
0.2
0.4
Chinautla
EET83230Fuzzy Creek
0.8
0.6
0.4
Ir (ng/g)100 1000 10000
Au
(ng/
g)1000
3000
0.2
0.40.4
d c
ba
Fig. 12. Fractional crystallization models for Ir versus Pd and Au calculated for Models B and C discussed in the text. Symbols are the sameas for Fig. 10. (a) and (c) are for Model B (3 wt.% initial S) and (b) and (d) are for Model C (9 wt.% initial S). Calculations for Pd and Au weremade with D values determined using the parameterization method of Chabot and Jones (2003), as discussed in the text. Note that the smallergray circles represent IVA meteorite data from Wasson and Richardson (2001).
Re Os Ir Ru Pt Pd Au
Sam
ple/
CI
0.1
1
10
Re Os Ir Ru Pt Pd Au
Sam
ple/
CI
0.1
1
10
b a
Fig. 13. CI chondrite normalized solid compositions generated via fractional crystallization for every 5 wt.% of crystallization from initialmelt compositions shown in red. (a) is for Model B, and (b) is for Model C, as discussed in the text. The blue pattern is the first solid to formand the green pattern is the last to form, after 55 and 85 wt.% crystallization, respectively, for Models B and C. Note that the Model C, withthe higher initial S, leads to less variation in the concentrations of Pd and Au than are actually observed for IVA irons (Fig. 3). Note too thatModel C requires an HSE pattern for the initial melt that is more fractionated relative to chondritic, than that for Model B. (Forinterpretation of the references to color in this figure legend, the reader is referred to the web version of this article.)
6838 T.J. McCoy et al. / Geochimica et Cosmochimica Acta 75 (2011) 6821–6843
elements on the left side of Fig. 5. As discussed above,much of the great variance in abundances among someHSE (Re, Os, Ir) can be attributed to, and successfullymodeled as the result of solid metal–liquid metal partition-ing in the IVA core. Further, our calculated HSE concen-trations for the parental melt to the IVA irons (Table 6)are similar to what would be expected for a planetary body
with a core that comprises 20–30% of the mass of the body,and that has virtually quantitatively concentrated the HSEfrom the entire body. For example, the abundances are gen-erally comparable to those proposed for Earth’s core(McDonough, 2003; Table 6).
Based on similarities in D17O between IVA silicates andL and LL chondrites (Clayton and Mayeda, 1996), both
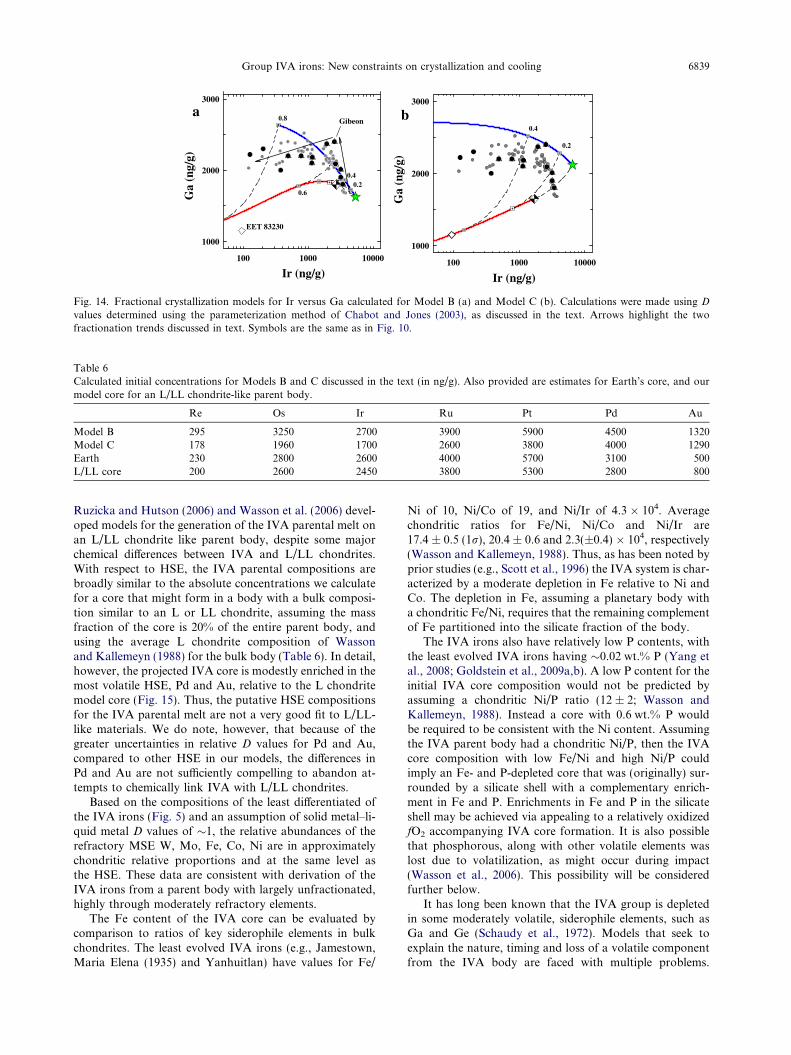
Ir (ng/g)100 1000 10000
Ga
(ng/
g)
1000
2000
3000
0.20.4
0.6
0.8 Gibeon
EET 83230
Ir (ng/g)100 1000 10000
Ga
(ng/
g)
1000
2000
3000
0.2
0.4
b a
Fig. 14. Fractional crystallization models for Ir versus Ga calculated for Model B (a) and Model C (b). Calculations were made using D
values determined using the parameterization method of Chabot and Jones (2003), as discussed in the text. Arrows highlight the twofractionation trends discussed in text. Symbols are the same as in Fig. 10.
Table 6Calculated initial concentrations for Models B and C discussed in the text (in ng/g). Also provided are estimates for Earth’s core, and ourmodel core for an L/LL chondrite-like parent body.
Re Os Ir Ru Pt Pd Au
Model B 295 3250 2700 3900 5900 4500 1320Model C 178 1960 1700 2600 3800 4000 1290Earth 230 2800 2600 4000 5700 3100 500L/LL core 200 2600 2450 3800 5300 2800 800
Group IVA irons: New constraints on crystallization and cooling 6839
Ruzicka and Hutson (2006) and Wasson et al. (2006) devel-oped models for the generation of the IVA parental melt onan L/LL chondrite like parent body, despite some majorchemical differences between IVA and L/LL chondrites.With respect to HSE, the IVA parental compositions arebroadly similar to the absolute concentrations we calculatefor a core that might form in a body with a bulk composi-tion similar to an L or LL chondrite, assuming the massfraction of the core is 20% of the entire parent body, andusing the average L chondrite composition of Wassonand Kallemeyn (1988) for the bulk body (Table 6). In detail,however, the projected IVA core is modestly enriched in themost volatile HSE, Pd and Au, relative to the L chondritemodel core (Fig. 15). Thus, the putative HSE compositionsfor the IVA parental melt are not a very good fit to L/LL-like materials. We do note, however, that because of thegreater uncertainties in relative D values for Pd and Au,compared to other HSE in our models, the differences inPd and Au are not sufficiently compelling to abandon at-tempts to chemically link IVA with L/LL chondrites.
Based on the compositions of the least differentiated ofthe IVA irons (Fig. 5) and an assumption of solid metal–li-quid metal D values of �1, the relative abundances of therefractory MSE W, Mo, Fe, Co, Ni are in approximatelychondritic relative proportions and at the same level asthe HSE. These data are consistent with derivation of theIVA irons from a parent body with largely unfractionated,highly through moderately refractory elements.
The Fe content of the IVA core can be evaluated bycomparison to ratios of key siderophile elements in bulkchondrites. The least evolved IVA irons (e.g., Jamestown,Maria Elena (1935) and Yanhuitlan) have values for Fe/
Ni of 10, Ni/Co of 19, and Ni/Ir of 4.3 � 104. Averagechondritic ratios for Fe/Ni, Ni/Co and Ni/Ir are17.4 ± 0.5 (1r), 20.4 ± 0.6 and 2.3(±0.4) � 104, respectively(Wasson and Kallemeyn, 1988). Thus, as has been noted byprior studies (e.g., Scott et al., 1996) the IVA system is char-acterized by a moderate depletion in Fe relative to Ni andCo. The depletion in Fe, assuming a planetary body witha chondritic Fe/Ni, requires that the remaining complementof Fe partitioned into the silicate fraction of the body.
The IVA irons also have relatively low P contents, withthe least evolved IVA irons having �0.02 wt.% P (Yang etal., 2008; Goldstein et al., 2009a,b). A low P content for theinitial IVA core composition would not be predicted byassuming a chondritic Ni/P ratio (12 ± 2; Wasson andKallemeyn, 1988). Instead a core with 0.6 wt.% P wouldbe required to be consistent with the Ni content. Assumingthe IVA parent body had a chondritic Ni/P, then the IVAcore composition with low Fe/Ni and high Ni/P couldimply an Fe- and P-depleted core that was (originally) sur-rounded by a silicate shell with a complementary enrich-ment in Fe and P. Enrichments in Fe and P in the silicateshell may be achieved via appealing to a relatively oxidizedfO2 accompanying IVA core formation. It is also possiblethat phosphorous, along with other volatile elements waslost due to volatilization, as might occur during impact(Wasson et al., 2006). This possibility will be consideredfurther below.
It has long been known that the IVA group is depletedin some moderately volatile, siderophile elements, such asGa and Ge (Schaudy et al., 1972). Models that seek toexplain the nature, timing and loss of a volatile componentfrom the IVA body are faced with multiple problems.

Re Os Ir Ru Pt Pd Au
Mod
elIn
itia
l/CI
1
10Model B
L
Model CEarth
Fig. 15. Plot of calculated initial concentrations of HSE for ourModels B and C, normalized to CI chondrites (from Horan et al.(2003) and Anders and Grevesse (1989) for Au) in the parental meltto the IVA core. HSE concentrations for our model L chondritecore (see text), and estimated abundances for Earth’s core(McDonough, 2003) are shown for comparison.
Fig. 16. Chondrite normalized abundance pattern for the moder-ately volatile elements in the IVA irons versus their 50% masscondensation temperature (Lodders, 2003). With decreasing con-densation temperature, the volatile abundances decrease markedly.An extrapolation of the IVA iron data to the much lowercondensation temperature for S leads to a prediction that itsabundance in the IVA core would be <1 lg/g. This result would beat odds with our modeling of the HSE data. If there is 3 wt.% S inthe IVA core, then the depletion trend noted for the moderatelyvolatile elements is only slightly affected by volatile depletion, andinstead is mostly due to the partitioning of these elements into thesilicate shell of the IVA body.
6840 T.J. McCoy et al. / Geochimica et Cosmochimica Acta 75 (2011) 6821–6843
Chondritic proportions of refractory elements in the IVAcore provide a reference frame for the apparent progressivedepletion in moderately volatile elements, which appear tofollow a depletion trend predicted for a nebular environ-ment (Fig. 16). Notably, in IVA irons Ga is an order ofmagnitude and Ge is >2 orders of magnitude more depletedthan in chondrites. If these elements were wholly extractedinto the IVA core, their concentrations would be enrichedover a putative parent bulk composition. It is a challengefor any model to explain the Ga and Ge depletions inIVA irons, while also envisaging a IVA core with 3 wt.%S, or even �0.5 wt.% S, as estimated by Wasson et al.(2006), given that S is a more volatile element. If a conven-tional nebular depletion model is invoked to explain the Gaand Ge depletions, then a simple extrapolation of this mod-el predicts a volatile depleted core having �1 ppm S(Fig. 16). Thus, there is an apparent conflict between theGa–Ge depletion models and a model suggesting the IVAcore has between 0.5 and 3 wt.% S.
One way to account for depletions in moderately volatileelements is via loss through impact volatilization. Forexample, in their model for producing the IVA irons froman L–LL chondrite-like parent, Wasson et al. (2006) arguedthat metallic Fe was produced from the dissociation of FeOand FeS by impact heating and reduction by C, at or nearthe surface of the parent body. In addition, Ga and Ge werepartially volatilized and lost from the melt at this time. Theresulting metallic liquid eventually drained to the center ofthe body to form a core. Wasson et al. (2006) recognizedthat the production of metal on a relatively small bodyvia impact heating is a volume limited process. They sug-gested that the total volume of melting of chondritic mate-rial by this process was �5 km3. Consequently, they arguedfor a relatively small parent body (�10–20 km radius) witha small core. If the highly variable cooling rates discussedabove are accurate, however, the IVA parent body wouldhave to have been considerably larger, e.g., the �150 km ra-dius body suggested by Yang et al. (2008). For such a large
body the impact melting hypothesis of Wasson et al. (2006)loses viability.
As an alternative to loss through volatilization, we pres-ent a model that allows for a IVA core with 3 wt.% S andlow Ga and Ge contents. The model is consistent with theprior proposal that the IVA body was assembled frommaterials having a composition comparable to either anordinary chondrite (H, L or LL all provide satisfactory fitsgiven existing constraints) with a mild depletion in moder-ately volatile elements (enough to satisfy the S in the coreargument) or an Earth-like composition, given its inventoryof moderately depleted volatile elements. Followingaccretion, the IVA parent body experiences metal-silicatesegregation under oxidized conditions, with Ga and Gepartitioned mostly into the silicate shell. The significantconstraints for this model are the observation that IVAirons have low Fe/Ni and high Ni/P values relative to chon-drites. A prediction of this model is that the silicate shell ofthe IVA body is enriched in P, Ga and Ge (along with Mn,Cr and V), a composition that is comparable to that pre-dicted by Wasson and Richardson (2001), although theyconsidered that only a minor fraction of Ga and Ge waspartitioned into the silicate shell.
The most contentious aspect of this model is the parti-tioning of Ge between the silicate and metallic phases.There is a significant body of literature demonstrating thatGa can range from lithophile or siderophile depending onthe P–T–Xi–fO2 conditions (Schmidt et al., 1989; Kongand Ebihara, 1996; Capobianco et al., 1999; Jaeger andDrake, 2000; Righter and Drake, 2000; Holzapfel et al.,2001; Liu and Fleet, 2001), but the data for Ge present aless definitive perspective with most findings revealing thatit behaves as a siderophile element under most conditions.Experimental investigations reveal that there is a strongbulk compositional dependency on the oxidation states ofGa and Ge in the silicate melts, with Jana and Walker

Group IVA irons: New constraints on crystallization and cooling 6841
(1999) observing that under oxidizing conditions Ge be-comes less siderophile, and so too Fe, Co, W and P. Coreformation on the Earth, which is likely to have occurred un-der more reducing conditions, resulted in Ga being almostfully lithophile, whereas �90% of the planetary budget ofGe partitioned into the Earth’s core (McDonough, 2003).Overall the marked depletion in Ga and Ge observed inIVA irons may be the result of a combination of factorsinvolving volatilization and oxidation.
5. CONCLUSIONS
(1) New metallographic cooling rates of 500,000 K/Myrand 10,000 ± 3000 K/Myr were determined for Fuz-zy Creek and EET 83230, respectively. Chemicaland oxygen isotopic evidence indicate a genetic rela-tion between the high Ni EET and group IVA, butthe cooling rate for EET is much faster than forany IVA, and especially IVA irons with high Ni.Prior cooling rate data for other IVA irons haveled to the suggestion that the IVA group crystallizedin a secondary parent body that was deficient in sili-cate mantle, and formed when a primary parent bodywas shattered via a large impact. EET most likelycrystallized in a smaller secondary parent body thatsampled the same core of the primary parent bodyof the IVA group.
(2) A regression of 187Os/188Os versus 187Re/188Os datafor IVA irons gives an age of 4540 ± 17 Ma. Thisage is consistent with early solar system formation,and implies that the HSE remained closed systemsafter initial crystallization.
(3) We have modeled fractional crystallization using newhighly siderophile element data, assuming initial Sabundances of 0.5, 3 and 9 wt.%. Given our assumedinitial elemental ratios and D values, our attempts tomodel Re and Os abundances resulting from frac-tional crystallization of a melt with 0.5 wt.% S wereunsuccessful, suggesting that higher S concentrationswere present in the initial IVA proto-body melt.Models employing either 3 or 9 wt.% S can explainRe, Os, Pt and Ru abundances, while only 3 wt.% Sinitial melts can successfully be used to model Pdand Au. Abundances of the volatile siderophile Gacannot be adequately modeled at either S concentra-tion, suggesting that some as yet unidentified mecha-nism is needed to account for its behavior.
(4) The overall depletion in Fe, P, Ga and Ge in IVAirons may result from sequestration of these elementsinto the mantle of the primary parent body duringdifferentiation under relatively oxidizing conditions,or volatilization or some combination of these.
ACKNOWLEDGMENTS
Funding for this work was provided by NASA GrantsNNG06GF56G (to T.J.M.), NNX07AM29G and NNX10AG94G(to R.J.W.), NNX08AG53G (to J.I.G.), NNX09AG90G (to
N.L.C.) and NNX08AH76G (to W.F.M.) which is gratefullyacknowledged. The authors thank Janne Blichert-Toft for the sam-ple of Muonionalusta.
APPENDIX A. SUPPLEMENTARY DATA
Supplementary data associated with this article can befound, in the online version, at doi:10.1016/j.gca.2011.09.006.
REFERENCES
Achterbergh E. V., Ryan C. G., Jackson S. E. and Griffin W. L.(2001) Appendix 3: data reduction software for LA-ICP-MS. InLaser Ablation-ICP-MS in the Earth Sciences, vol. 29 (ed. P.Sylvester). Mineralogical Association of Canada, Short Course
Series, 243pp.Amelin Y., Krot A. N., Hutcheon I. D. and Ulyanov A. A. (2002)
Lead isotopic ages of chondrules and calcium–aluminum richinclusions. Science 297, 1678–1683.
Anders E. and Grevesse N. (1989) Abundances of the elements:meteoritic and solar. Geochim. Cosmochim. Acta 53, 197–214.
Asphaug E., Agnor C. B. and Williams Q. (2006) Hit-and-runplanetary collisions. Nature 439, 155–160.
Asprey L. B. (1976) The preparation of very pure fluorine gas. J.
Fluorine Chem. 7, 359–361.
Becker H., Horan M. F., Walker R. J., Gao S., Lorand J.-P. andRudnick R. L. (2006) Highly siderophile element compositionof the Earth’s primitive upper mantle: constraints on new dataon peridotite massifs and xenoliths. Geochim. Cosmochim. Acta
70, 4528–4550.
Birck J.-L., Roy-Barman M. and Capmas F. (1997) Re–Os isotopicmeasurements at the femtomole level in natural samples.Geostand. Newsl. 20, 9–27.
Blichert-Toft J., Moynier F., Lee C.-T., Telouk P. and Albarede F.(2010) The early formation of the IVA iron meteorite parentbody. Earth Planet. Sci. Lett. 296, 469–480.
Buchwald V. F. (1975) Handbook of Iron Meteorites. University ofCalifornia Press, Berkeley, CA.
Burkhardt C., Kleine T., Bourdon B., Palme H., Zipfel J., FriedrichJ. and Ebel D. (2009) Hf–W mineral isochron for Ca, Al richinclusions: age of the solar system and the timing of coreformation in planetesimals. Geochim. Cosmochim. Acta 72,
6177–6197.
Capobianco C. J., Drake M. J. and De’Aro J. (1999) Siderophilegeochemistry of Ga, Ge, and Sn: cationic oxidation states insilicate melts and the effect of composition in iron–nickel alloys.Geochim. Cosmochim. Acta 63, 2667–2677.
Chabot N. L. (2004) Sulfur contents of the parental metallic coresof magmatic iron meteorites. Geochim. Cosmochim. Acta 68,
3607–3618.
Chabot N. L. and Jones J. H. (2003) The parameterization of solidmetal–liquid metal partitioning of siderophile elements. Mete-
orit. Planet. Sci. 38, 1425–1436.
Clarke R. S. (1989) Description of some Antarctic iron meteorites.Smithsonian Contrib. Earth Sci. 28, 61–63.
Clayton R. N. and Mayeda T. K. (1996) Oxygen isotope studies ofachondrites. Geochim. Cosmochim. Acta 60, 1999–2017.
Cliff G. and Lorimer G. W. (1975) The quantitative analysis of thinspecimens. J. Microsc. 103, 203–207.
Cohen A. S. and Waters F. J. (1996) Separation of osmium fromgeological materials by solvent extraction for analysis bythermal ionisation mass spectrometry. Anal. Chim. Acta 332,
269–275.

6842 T.J. McCoy et al. / Geochimica et Cosmochimica Acta 75 (2011) 6821–6843
Cook D. L., Walker R. J., Horan M. F., Wasson J. T. andMorgan J. W. (2004) Pt–Re–Os systematics of group IIABand IIIAB iron meteorites. Geochim. Cosmochim. Acta 68,
1413–1431.
Cook D. L., Wadhwa M., Clayton R. N., Janney P. E., DauphasN. and Davis A. M. (2005) Nickel isotopic composition of Fe–Ni metal from iron meteorites and the Brenham pallasite. Lunar
Planet. Sci. Conf. (CD-ROM) 36, #1836.Creaser R. A., Chen J. H., Papanastassiou D. A. and Wasserburg
G. J. (1991) Isotopic analysis of osmium, rhenium, and iridiumby negative thermal ion mass spectrometry. Lunar Planet. Sci.
Conf. XXII, 255–256.
Goldstein J. I. and Ogilvie R. E. (1965) The growth of theWidmanstatten pattern in metallic meteorites. Geochim. Cos-
mochim. Acta 29, 893–920.
Goldstein J. I. and Short J. M. (1967) The iron meteorites, theirthermal history and parent bodies. Geochim. Cosmochim. Acta
31, 1733–1770.
Goldstein J. I., Scott E. R. D. and Chabot N. L. (2009a) Ironmeteorites: crystallization, thermal history, parent bodies, andorigin. Chem. Erde 69, 293–325.
Goldstein J. I., Yang J., Kotula P. G., Michael J. R. and Scott E.R. D. (2009b) Thermal histories of IVA iron meteorites fromtransmission electron microscopy of the cloudy zone micro-structure. Meteorit. Planet. Sci. 44, 343–358.
Haack H., Scott E. R. D., Love S. G., Brearley A. J. and McCoy T.J. (1996) Thermal histories of IVA stony-iron and ironmeteorites: evidence for asteroid fragmentation and reaccretion.Geochim. Cosmochim. Acta 60, 3103–3113.
Hamester M., Wiederin D., Wills J., Kerl W. and Douthitt C. B.(1999) Strategies for isotope ratio measurements with a doublefocusing sector field ICP-MS. Fresenius J. Anal. Chem. 364,
495–497.
Holzapfel C., Courtial P., Dingwell D. B., Chakraborty S. andPalme H. (2001) Experimental determination of partial molarvolumes of Ga2O3 and GeO2 in silicate melts: implications forthe pressure dependence of metal–silicate partition coefficients.Chem. Geol. 174, 33–49.
Horan M. F., Morgan J. W., Walker R. J. and Grossman J. N.(1992) Rhenium–osmium isotope constraints on the age of ironmeteorites. Science 255, 1118–1121.
Horan M. F., Smoliar M. I. and Walker R. J. (1998) 182W and187Re–187Os systematics of iron meteorites: chronology formelting, differentiation, and crystallization in asteroids. Geo-
chim. Cosmochim. Acta 62, 545–554.
Horan M. F., Walker R. J., Morgan J. W., Grossman J. N. andRubin A. (2003) Highly siderophile elements in chondrites.Chem. Geol. 196, 5–20.
Jaeger W. L. and Drake M. J. (2000) Metal–silicate partitioning ofCo, Ga, and W: dependence on silicate melt composition.Geochim. Cosmochim. Acta 64, 3887–3895.
Jana D. and Walker D. (1999) Core formation in the presence ofvarious C–H–O volatile species. Geochim. Cosmochim. Acta 63,
2299–2310.
Jones J. H. and Drake M. J. (1983) Experimental investigations oftrace element fractionation in iron meteorites, II: the influenceof sulfur. Geochim. Cosmochim. Acta 47, 1199–1209.
Jones J. H. and Malvin D. J. (1990) A nonmetal interaction modelfor the segregation of trace elements during solidification of Fe–Ni–S, Fe–Ni–P, and Fe–Ni–S–P alloys. Metall. Trans. B 21B,
697–706.
Jones A. M., Iacumin P. and Young E. D. (1999) High-resolutiond18O analysis of tooth enamel phosphate by isotope ratiomonitoring gas chromatography mass spectrometry and ultra-violet laser fluorination. Chem. Geol. 153, 241–248.
Kong P. and Ebihara M. (1996) Metal phases of L chondrites: theirformation and evolution in the nebula and in the parent body.Geochim. Cosmochim. Acta 60, 2667–2680.
Lodders K. (2003) Solar System abundances and condensationtemperatures of the elements. Astrophys. J. 591, 1220–1247.
Luck J.-M., Birck J.-L. and Allegre C.-J. (1980) Re-187/Os-187systematics in meteorites – early chronology of the solar systemand age of the Galaxy. Nature 283, 256–259.
Ludwig K. R. (2003) Isoplot 3.00. Berkeley Geochronology Center,Special Publication No. 4, 70pp.
Liu M. and Fleet M. E. (2001) Partitioning of siderophile elements(W, Mo, As, Ag, Ge, Ga, and Sn) and Si in the Fe–S system andtheir fractionation in iron meteorites. Geochim. Cosmochim.
Acta 65, 671–682.
McDonough W. F. (2003) Compositional model for the Earth’score. In The Mantle and Core, vol. 2 (ed. R. W. Carlson) (eds.H. D. Holland and K. K. Turekian). Elsevier-Pergamon,
Oxford, pp. 547–568.
Pernicka E. and Wasson J. T. (1987) Ru, Re, Os, Pt and Au in ironmeteorites. Geochim. Cosmochim. Acta 51, 1717–1726.
Petaev M. I. and Jacobsen S. B. (2004) Differentiation of metal-richmeteorite parent bodies: I. Measurements of PGEs, Re, Mo, W,and Au in meteoritic Fe–Ni metal. Meteorit. Planet. Sci. 39,
1685–1697.
Rasmussen K. L., Ulff-Moller F. and Haack H. (1995) The thermalevolution of IVA iron meteorites: evidence from metallographiccooling rates. Geochim. Cosmochim. Acta 59, 3049–3059.
Rehkamper M., Halliday A. N., Barfod D., Godfrey F. J. andDawson B. J. (1997) Platinum-group element abundancepatterns in different mantle environments. Science 278, 1595.
Righter K. and Drake M. J. (2000) Metal/silicate equilibrium in theearly Earth – new constraints from the volatile moderatelysiderophile elements Ga, Cu, P, and Sn. Geochim. Cosmochim.
Acta 64, 3581–3597.
Rumble D., Farquhar J., Young E. D. and Christensen C. P. (1997)In situ oxygen isotope analysis with an excimer laser using F2
and BrF5 reagents and O2 gas as analyte. Geochim. Cosmochim.
Acta 61, 4229–4234.
Rumble, III, D., Miller M. F., Franchi I. A. and Greenwood R. C.(2007) Oxygen three-isotope fractionation lines in terrestrialsilicate minerals: an inter-laboratory comparison of hydrother-mal quartz and eclogitic garnet. Geochim. Cosmochim. Acta 71,
3592–3600.
Ruzicka A. and Hutson M. (2006) Differentiation and evolution ofthe IVA meteorite parent body: clues from pyroxene geochem-istry in the Steinbach stony-iron meteorite. Meteorit. Planet.
Sci. 41, 1959–1987.
Schaudy R., Wasson J. T. and Buchwald V. F. (1972) The chemicalclassification of iron meteorites. VI. A reinvestigation of ironswith Ge concentrations lower than 1 ppm. Icarus 17, 174–192.
Schmidt W., Palme H. and Wanke H. (1989) Experimentaldetermination of metal/silicate partition coefficients for P, Co,Ni, Cu, Ga, Ge, Mo, and W and some implications for the earlyevolution of the Earth. Geochim. Cosmochim. Acta 53, 173–185.
Scott E. R. D. (1972) Chemical fractionation in iron meteorites andits interpretation. Geochim. Cosmochim. Acta 36, 1205–1236.
Scott E. R. D., Haack H. and McCoy T. J. (1996) Corecrystallization and silicate–metal mixing in the parent body ofthe IVA iron and stony-iron meteorites. Geochim. Cosmochim.
Acta 60, 1615–1631.
Sears D. W. (1978) Condensation and the composition of ironmeteorites. Earth Planet. Sci. Lett. 41, 128–138.
Selby D., Creaser R. A., Stein H. J., Markey R. J. and Hannah J.L. (2007) Assessment of the 187Re decay constant by crosscalibration of Re–Os molybdenite and U–Pb zircon chronom-
Group IVA irons: New constraints on crystallization and cooling 6843
eters in magmatic ore systems. Geochim. Cosmochim. Acta 71,
1999–2013.
Shen J. J., Papanastassiou D. A. and Wasserburg G. J. (1996)Precise Re–Os determinations and systematic of iron meteor-ites. Geochim. Cosmochim. Acta 60, 2887–2900.
Shirey S. B. and Walker R. J. (1998) The Re–Os isotope system incosmochemistry and high-temperature geochemistry. Ann. Rev.
Earth Planet. Sci. 26, 423–500.
Smoliar M. I., Walker R. J. and Morgan J. W. (1996) Re–Os agesof group IIA, IIIA, IVA, and IVB iron meteorites. Science 271,
1099–1102.
Walker R. J., Horan M. F., Morgan J. W., Becker H., Grossman J.N. and Rubin A. E. (2002) Comparative 187Re–187Os systematicof chondrites – implications regarding early solar systemprocesses. Geochim. Cosmochim. Acta 66, 4187–4201.
Walker R. J., McDonough W. F., Honesto J., Chabot N. L.,McCoy T. J., Ash R. D. and Bellucci J. J. (2008) Modelingfractional crystallization of Group IVB iron meteorites. Geo-
chim. Cosmochim. Acta 72, 2198–2216.
Wang P.-L., Rumble D. and McCoy T. J. (2004) Oxygen isotopiccompositions of IVA iron meteorites: implications for thethermal evolution derived from in situ ultraviolet laser micro-probe analyses. Geochim. Cosmochim. Acta 68, 1159–1171.
Wasson J. T. (1999) Trapped melt in IIIAB irons: solid/liquidelemental partitioning during the fractionation of the IIIABmagma. Geochim. Cosmochim. Acta 63, 2875–2889.
Wasson J. T. and Kallemeyn G. W. (1988) Compositions ofchondrites. Philos. Trans. R. Soc. Lond. Ser. A 325(1587), 535–
544, The Solar System: Chemistry as a Key to its Origin (Jul.
29, 1988).
Wasson J. T. and Richardson J. W. (2001) Fractionation trendsamong IVA iron meteorites: contrasts with IIIAB trends.Geochim. Cosmochim. Acta 65, 951–970.
Wasson J. T., Matsunami Y. and Rubin A. E. (2006) Silica andpyroxene in IVA irons; possible formation of the IVA magma
by impact melting and reduction of L–LL-chondrite materialsfollowed by crystallization and cooling. Geochim. Cosmochim.
Acta 70, 3149–3172.
Wiechert U. and Hoefs J. (1995) An excimer laser-based microanalytical preparation technique for in-situ oxygen isotopeanalysis of silicate and oxide minerals. Geochim. Cosmochim.
Acta 59, 4093–4101.
Willis J. and Goldstein J. I. (1982) The effects of C, P, and S ontrace element partitioning during solidification in Fe–Ni alloys.In Proc. Lunar Planet. Sci. Conf., 13th, Part I. J. Geophys. Res.
87 (Suppl.) A435–A445.Yang J. and Goldstein J. I. (2005) The formation mechanism of the
Widmanstatten structure in meteorites. Meteorit. Planet. Sci.
40, 239–253.
Yang J. and Goldstein J. I. (2006) Metallographic cooling rates ofthe IIIAB iron meteorites. Geochim. Cosmochim. Acta 70, 3197–
3215.
Yang J., Goldstein J. I. and Scott E. R. D. (2007) Iron meteoriteevidence for early formation and catastrophic disruption ofprotoplanets. Nature 446, 888–891.
Yang J., Goldstein J. I. and Scott E. R. D. (2008) Metallographiccooling rates of the IVA iron meteorites. Geochim. Cosmochim.
Acta 72, 3043–3061.
Yang J., Goldstein J. I., Michael J. R., Kotula P. G. and Scott E.R. D. (2010) Thermal history and origin of the IVB ironmeteorites and their parent body. Geochim. Cosmochim. Acta
74, 4493–4506.
Yang J., Goldstein J. I., Scott E. R. D., Michael J. R., Kotula P.G., Pham T. and McCoy T. J. (2011) Thermal and impacthistories of reheated group IVA, IVB and ungrouped ironmeteorites and their parent asteroids. Meteorit. Planet. Sci. 46,
1227–1252.
Associate editor: Alexander N. Krot