Embed Size (px)
Citation preview

GROUP FINANCIAL STATEMENTS113 Independent auditor’s report
to the members of Petrofac Limited121 Consolidated income statement122 Consolidated statement of other
comprehensive income123 Consolidated statement of financial position124 Consolidated statement of cash flows125 Consolidated statement of changes in equity126 Notes to the consolidated financial statements
112 / Petrofac Annual report and accounts 2016

Independent auditor’s report to the members of Petrofac Limited
This report is made solely to the Company’s members, as a body, in accordance with Article 113A of the Companies (Jersey) Law 1991 and our engagement letter dated 9 November 2015.
Our opinion on the financial statementsIn our opinion Petrofac Limited’s financial statements (the “financial statements”):
• Give a true and fair view of the state of the Group and of the Parent Company’s affairs as at 31 December 2016 and of the Group’s profit and Parent Company’s profit for the year then ended
• Have been properly prepared in accordance with International Financial Reporting Standards (IFRSs)• Have been prepared in accordance with the requirements of the Companies (Jersey) Law 1991
What we have auditedWe have audited the financial statements of Petrofac Limited which comprise:Group Parent Company
Consolidated income statement for the year then ended Company income statement for the year then ended
Consolidated statement of other comprehensive income for the year then ended
Company statement of other comprehensive income for the year then ended
Consolidated statement of financial position as at 31 December 2016 Company statement of financial position as at 31 December 2016
Consolidated statement of cash flows for the year then ended Company statement of cash flows for the year then ended
Consolidated statement of changes in equity for the year then ended Company statement of changes in equity for the year then ended
Related notes 1 to 33 to the financial statements Related notes 1 to 22 to the financial statements
We have also audited the part of the Directors’ Remuneration Report identified as being audited on pages 102 to 106
The financial reporting framework that has been applied in their preparation is applicable law and IFRSs.
Overview of our audit approach
Risks of material misstatement
• Revenue and margin recognition on the portfolio of contracts within the Group • Potential impairment and fair value change of IES assets and JSD6000• Recognition of deferred tax assets and liabilities for uncertain tax positions • Unaoil investigation and related matters
Audit scope • We performed an audit of the complete financial information of seven components and audit procedures on specific balances for a further three components.
• The components where we performed full or specific audit procedures accounted for 90% of adjusted* profit before tax, 96% of revenue and 90% of total assets.
Materiality • Overall Group materiality of US$25m which represents 5% of adjusted* profit before tax.
* For calculation of adjusted profit before tax, refer to ‘Our application of materiality’ section.
Petrofac Annual report and accounts 2016 / 113
Financial statem
ents

Independent auditor’s report to the members of Petrofac Limited continued
Our assessment of risk of material misstatementWe identified the risks of material misstatement described below as those that had the greatest effect on our overall audit strategy, the allocation of resources in the audit and the direction of the efforts of the audit team. In addressing these risks, we have performed the procedures below which were designed in the context of the financial statements as a whole and, consequently, we do not express any opinion on these individual areas.
Risk Our response to the riskKey observations communicated to the Audit Committee
Revenue and margin recognition on the portfolio of contracts within the Group
Refer to the Audit Committee report (page 88; Significant accounting policies and judgements (pages 129 and 131); and note 4 of the Consolidated financial statements (page 140).
E&C Accounting for E&C long-term contracts requires significant management judgement and estimation which increases the risk of bias or error.
Significant management judgement is required in recognising revenue on these long-term contracts and estimation is applied in recognising variation orders, project costs-to-complete and provisions for liquidated damages. These judgements are also subject to the risk of management override of controls in place.
External revenue in this segment totalled US$5.9bn in 2016 (2015: US$4.8bn).
EPSEPS operation and maintenance contracts are primarily reimbursable with a stable margin. This segment involves a high volume of sales and cost transactions which in total amount to material revenue to the Group.
External revenue in this segment totalled US$1.7bn in 2016 (2015: US$1.7bn).
IESThe majority of revenue in this segment arises from the Group’s operations in Mexico and Malaysia.
There is limited judgement involved in the determination of revenue recognition for these assets, however a residual risk remains as a result of the materiality of the amounts recorded.
External revenue in this segment totalled US$0.3bn in 2016 (2015: US$0.4bn).
The component audit team based in the United Arab Emirates (UAE) with close oversight from the Group audit engagement team performed the following procedures on the identified risk areas:
• Recognition and timing of variation orders (VOs). We verified whether VOs recognised in revenue met the conditions prescribed under IAS 11 Construction Contracts. We evaluated the judgements made in the timing of VOs being recognised. For assessed VOs still in negotiation for a significant period of time, we discussed with and challenged management on the likelihood of client approval and reversals, and obtained representations where necessary.
• Provision for liquidated damages. We analysed projects which have fallen behind schedule and assessed the reasonableness of management’s assessments in the light of correspondence with customers, past experience of negotiation with those customers and the specific events giving rise to delay on the contract. We considered the basis for contingency, if appropriate, within the cost budget and the consistency of application of these judgements across contracts.
• The adequacy of contingency provisions. We verified whether provision releases were recognised in line with Group accounting policy. We analysed contingency movements throughout the life of the contract, and discussed progress to date and identified risks and challenges on contracts with individual project directors to determine whether the remaining contingency was sufficient to cover residual risks on the project.
• Determination of the percentage of completion. We obtained an understanding of progress as agreed with the customers and systems in place to split the contracts into their component parts. We analysed the impact of VOs in establishing completion percentage.
• Assessment of costs-to-complete. We tested controls around the cost estimation process, tested the historical accuracy of previous forecasts and discussed with project directors and cost controllers. We also verified that costs were correctly accrued at period end and costs-to-complete accurately reflected productivity and latest actual cost rates.
• Accounting for consortium contracts. We obtained material contracts, tested the timing of revenue recognised and verified that correct joint arrangement accounting was applied. We investigated any legal disputes between consortium partners.
• EPS contracts – We designed procedures to gain comfort that revenue was recognised in the correct period, which primarily included vouching transactions through the year with particular focus on transactions around the balance sheet date and sales accruals.
• IES contracts – Where applicable, we reconciled barrels lifted per entitlement to revenue recognised on these assets. For tariff based remuneration structures, we vouched monthly revenue to the production data reports which determine revenue under the contract.
In our report to the Audit Committee we explained our audit procedures in response to key judgements made by management, which included meetings with project directors and senior management, and corroboration of assertions to supporting evidence.
We have also ensured the risks associated with revenue recognition have been appropriately disclosed in note 2 to the financial statements with respect to significant estimates.
114 / Petrofac Annual report and accounts 2016
Risk Our response to the riskKey observations communicated to the Audit Committee
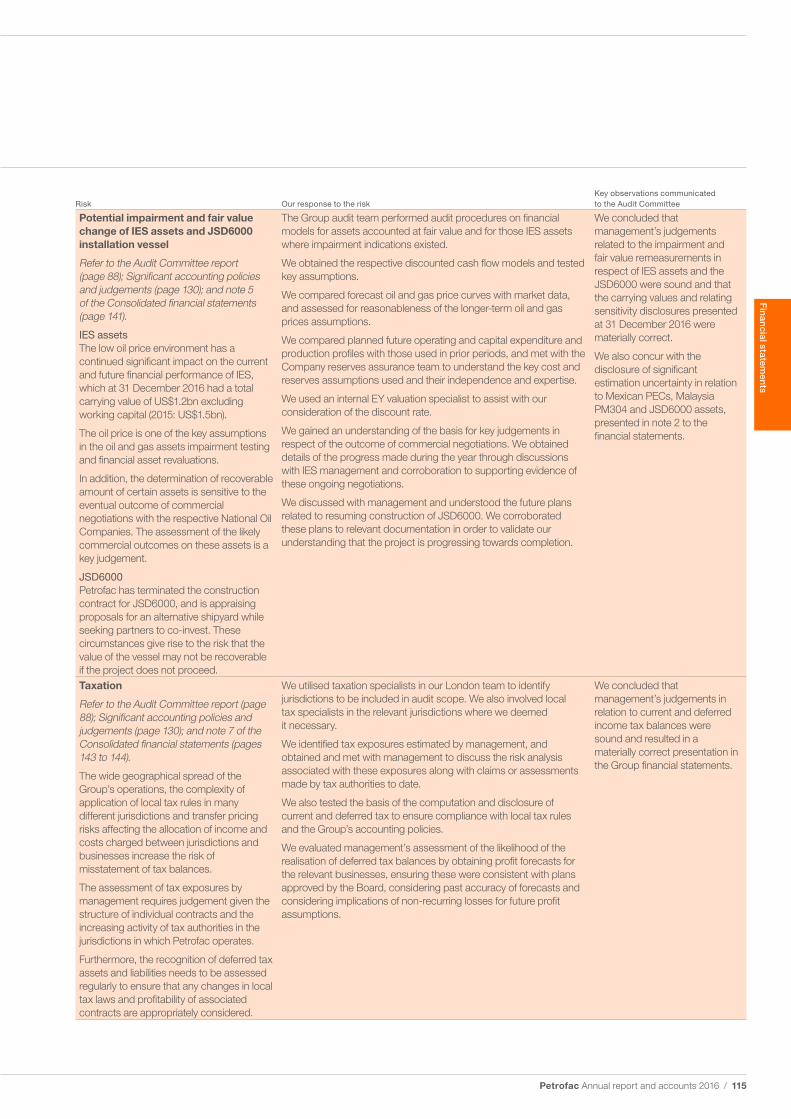
Potential impairment and fair value change of IES assets and JSD6000 installation vessel
Refer to the Audit Committee report (page 88); Significant accounting policies and judgements (page 130); and note 5 of the Consolidated financial statements (page 141).
IES assetsThe low oil price environment has a continued significant impact on the current and future financial performance of IES, which at 31 December 2016 had a total carrying value of US$1.2bn excluding working capital (2015: US$1.5bn).
The oil price is one of the key assumptions in the oil and gas assets impairment testing and financial asset revaluations.
In addition, the determination of recoverable amount of certain assets is sensitive to the eventual outcome of commercial negotiations with the respective National Oil Companies. The assessment of the likely commercial outcomes on these assets is a key judgement.
JSD6000Petrofac has terminated the construction contract for JSD6000, and is appraising proposals for an alternative shipyard while seeking partners to co-invest. These circumstances give rise to the risk that the value of the vessel may not be recoverable if the project does not proceed.
The Group audit team performed audit procedures on financial models for assets accounted at fair value and for those IES assets where impairment indications existed.
We obtained the respective discounted cash flow models and tested key assumptions.
We compared forecast oil and gas price curves with market data, and assessed for reasonableness of the longer-term oil and gas prices assumptions.
We compared planned future operating and capital expenditure and production profiles with those used in prior periods, and met with the Company reserves assurance team to understand the key cost and reserves assumptions used and their independence and expertise.
We used an internal EY valuation specialist to assist with our consideration of the discount rate.
We gained an understanding of the basis for key judgements in respect of the outcome of commercial negotiations. We obtained details of the progress made during the year through discussions with IES management and corroboration to supporting evidence of these ongoing negotiations.
We discussed with management and understood the future plans related to resuming construction of JSD6000. We corroborated these plans to relevant documentation in order to validate our understanding that the project is progressing towards completion.
We concluded that management’s judgements related to the impairment and fair value remeasurements in respect of IES assets and the JSD6000 were sound and that the carrying values and relating sensitivity disclosures presented at 31 December 2016 were materially correct.
We also concur with the disclosure of significant estimation uncertainty in relation to Mexican PECs, Malaysia PM304 and JSD6000 assets, presented in note 2 to the financial statements.
Taxation
Refer to the Audit Committee report (page 88); Significant accounting policies and judgements (page 130); and note 7 of the Consolidated financial statements (pages 143 to 144).
The wide geographical spread of the Group’s operations, the complexity of application of local tax rules in many different jurisdictions and transfer pricing risks affecting the allocation of income and costs charged between jurisdictions and businesses increase the risk of misstatement of tax balances.
The assessment of tax exposures by management requires judgement given the structure of individual contracts and the increasing activity of tax authorities in the jurisdictions in which Petrofac operates.
Furthermore, the recognition of deferred tax assets and liabilities needs to be assessed regularly to ensure that any changes in local tax laws and profitability of associated contracts are appropriately considered.
We utilised taxation specialists in our London team to identify jurisdictions to be included in audit scope. We also involved local tax specialists in the relevant jurisdictions where we deemed it necessary.
We identified tax exposures estimated by management, and obtained and met with management to discuss the risk analysis associated with these exposures along with claims or assessments made by tax authorities to date.
We also tested the basis of the computation and disclosure of current and deferred tax to ensure compliance with local tax rules and the Group’s accounting policies.
We evaluated management’s assessment of the likelihood of the realisation of deferred tax balances by obtaining profit forecasts for the relevant businesses, ensuring these were consistent with plans approved by the Board, considering past accuracy of forecasts and considering implications of non-recurring losses for future profit assumptions.
We concluded that management’s judgements in relation to current and deferred income tax balances were sound and resulted in a materially correct presentation in the Group financial statements.
Petrofac Annual report and accounts 2016 / 115
Financial statem
ents

Independent auditor’s report to the members of Petrofac Limited continued
Risk Our response to the riskKey observations communicated to the Audit Committee
Other matters
Refer to the Annual report (pages 79 to 87) and note 29 of the Consolidated financial statements (page 164).
As described by Petrofac in the pages referenced above, the Company has undertaken an internal investigation during the year in relation to press allegations involving the Company’s relationship with Unaoil.
While the Company’s investigation did not find evidence confirming the payment of bribes, the consequences of the Company’s disclosures to the SFO will be decided by the regulatory authorities and it is currently unclear if any further investigation involving the Company will be undertaken.
With assistance from our own investigation specialists, we completed a review of the results of the Company’s internal investigation performed by Freshfields and KPMG.
Our work focused on the scope and findings of the Company’s internal investigation, including the oversight provided by the Board committee. We also considered the disclosures made by the Company. Finally we considered the potential for a contingent liability arising from any future external investigation (see Note 29).
We reported to the Audit Committee that we concurred with the Company’s position that the disclosures were proportionate to the findings of the investigation.
In the prior year, our auditor’s report included a risk of material misstatement in relation to the Laggan-Tormore contract. In the current year, this risk has been removed because a commercial settlement has been reached with the customer in the first half of 2016, and the contract is closed with respect to the settlement of remaining material accruals and claims. The work performed in 2016 on this contract was consistent with the E&C section above, with particular focus on the final year-end accrual of costs and accounting for the finalisation of commercial settlements.
The scope of our auditTailoring the scopeOur assessment of audit risk, our evaluation of materiality and our allocation of performance materiality determine our audit scope for each entity within the Group. Taken together, this enables us to form an opinion on the consolidated financial statements. We take into account size, risk profile, the organisation of the Group and effectiveness of Group-wide controls, changes in the business environment and other factors when assessing the level of work to be performed at each entity.
In assessing the risk of material misstatement to the Group financial statements, and to ensure we had adequate quantitative coverage of significant accounts in the financial statements, we selected 13 components covering Jersey, Malaysia, Mexico, United Kingdom, Tunisia and the UAE, which represent the principal business units within the Group.
Of the 13 components selected, we performed an audit of the complete financial information of seven components (“full scope components”) which were selected based on their size or risk characteristics. For another three components (“specific scope components”), we performed audit procedures on specific accounts within that component that we considered had the potential for the greatest impact on the significant accounts in the financial statements either because of the size of these accounts or their risk profile. For one component (“review scope component”), we primarily performed analytical procedures and inquiries of management. For the remaining two components (“specified procedures scope components”) we performed procedures on the existence and valuation of fixed assets and financial assets balances. The audit scope for specified procedures are those where we perform procedures that address only specific account assertions rather than the account balance as a whole.
The reporting components where we performed full scope audit procedures accounted for 95% (2015: 89%) of the Group’s profit before tax, Laggan-Tormore related losses and exceptional items, 93% (2015: 90%) of the Group’s revenue and 80% (2015: 89%) of the Group’s total assets.
The Laggan-Tormore losses were subject to full scope audit procedures, and of the total exceptional items, 97% (2015: 98%) of the related impact on profit before tax was subject to either full or specific scope procedures performed by the Group audit team or component audit teams.
The audit scope of specific scope components did not include testing of all significant accounts of the component but will have contributed to the coverage of significant accounts tested for the Group. For the current year, the specific scope components accounted for 3% (2015: 3%) of the Group’s revenue and 10% of the Group’s total assets (2015: 2%).
116 / Petrofac Annual report and accounts 2016

(5)10
95
Full scope components
Specific scope components
Other procedures
3 4
93
Full scope components
Specific scope components
Other procedures
10
10
80
Full scope components
Specific scope components
Other procedures
Of the remaining components that together represent 5% of the Group’s profit before tax, Laggan-Tormore related losses and exceptional items, none are individually greater than 3% of the Group for this metric. For these components, we performed other procedures, including assessing and testing management’s Group wide controls. We also performed analytical review on a component basis and tested consolidation journals to identify the existence of, and respond to, any further risks of misstatement that could have been material to the Group financial statements.
The charts below illustrate the coverage obtained from the work performed by our audit teams.
Profit before tax, Laggan-Tormore related losses and exceptional items Revenue Total assets
Changes from the prior year Our scope allocation in the current year is broadly consistent with 2015 in terms of overall coverage of the Group and the number of full and specific scope entities. However, we have made some changes in the components subject to full and specific scope audit procedures. Changes in our scope since the 2015 audit included moving the Petrofac’s business in Mexico from a full scope to a specific scope audit component due to its decreased significance in 2016 as activities have been put on hold in anticipation for a contract migration. The Group audit team is responsible for auditing the migration of existing Mexican PEC contracts, potential impairment of oil and gas assets and recoverability of trade receivables.
Involvement with component teamsIn establishing our overall approach to the Group audit, we determined the type of work that needed to be undertaken at each of the components by us, as the Group audit engagement team, or by component auditors from other EY global network firms operating under our instruction. Audit procedures were performed on the seven full scope components by our component audit teams in Dubai (four), Malaysia (two) and Aberdeen (one). For the three specific scope and two specified procedures scope components, where the work was performed by component auditors, we determined the appropriate level of involvement to enable us to determine that sufficient audit evidence had been obtained as a basis for our opinion on the Group as a whole.
The Group audit team continued to follow a programme of planned visits that has been designed to ensure that the each location is subject to an appropriate level of senior team member oversight during key audit activities. The nature and extent of these visits were designed relative to the size of the component, and the division of responsibilities between the local and Group team on the significant risk areas applicable to the component. During the current year’s audit cycle, visits were undertaken by the Group audit team (including an audit partner) to the component teams in the UAE (four full scope and one specific scope components) and Aberdeen, UK (one full scope and one specific scope component). The Group audit team also visited the Malaysia location (two full scope components) on three occasions and the Mexico location (one specific scope component) on two occasions during the cycle to provide oversight on the execution of audit and review procedures.
The Global Team Planning Event was held in London with representatives of the teams from Aberdeen, UAE, Mexico and Malaysia all attending. In addition, dependent on the timing of our visits in the audit cycle, these involved discussion of the audit approach with the component team and any issues arising from their work, consideration of the approach to revenue recognition, reviewing key working papers, attending the audit planning meeting and attending the audit closing meeting, including the discussion of fraud and error. In concluding the year-end audit the Group audit team visited the main operating and finance location in Sharjah, UAE to perform the audit of the consolidation and financial statements and to interact closely with the local team. The Group audit team interacted regularly with the component teams where appropriate during various stages of the audit, reviewed key working papers and were responsible for the scope and direction of the audit process. This, together with the additional procedures performed at Group level, gave us appropriate evidence for our opinion on the Group financial statements.
Our application of materialityThe scope of our work is influenced by materiality. We apply the concept of materiality in planning and performing the audit, in evaluating the effect of identified misstatements on the audit and in forming our audit opinion.
Petrofac Annual report and accounts 2016 / 117
Financial statem
ents
Independent auditor’s report to the members of Petrofac Limited continued
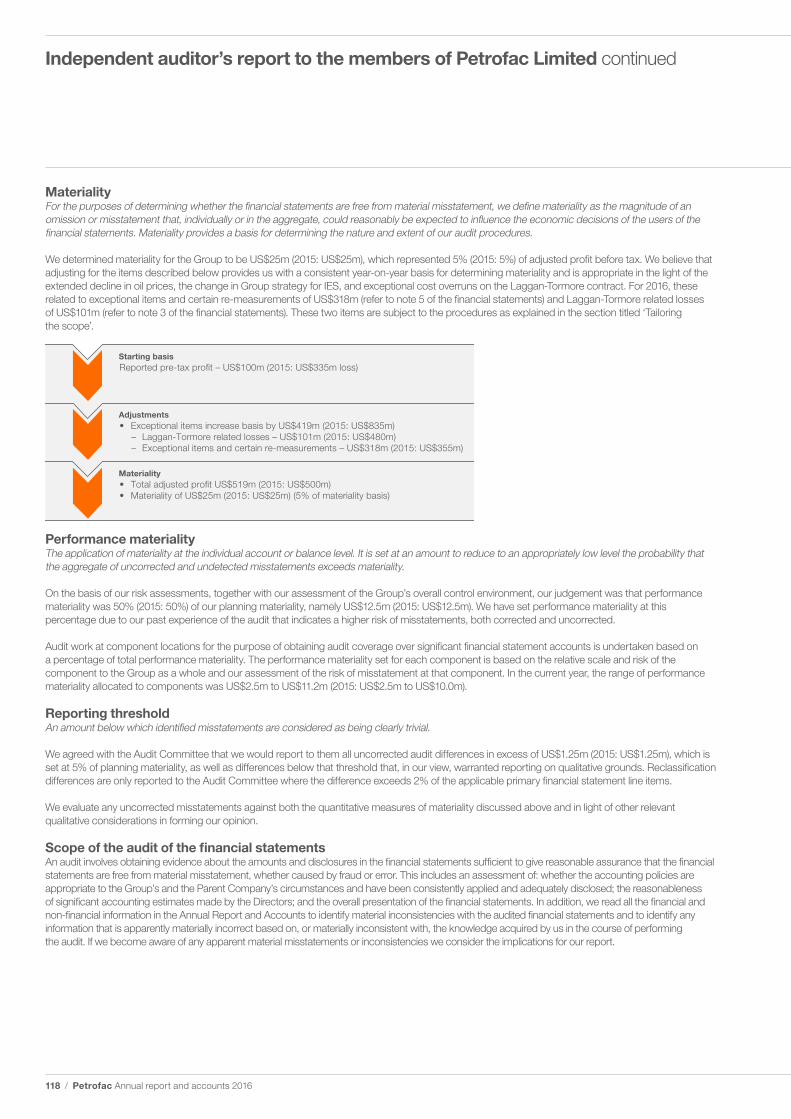
MaterialityFor the purposes of determining whether the financial statements are free from material misstatement, we define materiality as the magnitude of an omission or misstatement that, individually or in the aggregate, could reasonably be expected to influence the economic decisions of the users of the financial statements. Materiality provides a basis for determining the nature and extent of our audit procedures.
We determined materiality for the Group to be US$25m (2015: US$25m), which represented 5% (2015: 5%) of adjusted profit before tax. We believe that adjusting for the items described below provides us with a consistent year-on-year basis for determining materiality and is appropriate in the light of the extended decline in oil prices, the change in Group strategy for IES, and exceptional cost overruns on the Laggan-Tormore contract. For 2016, these related to exceptional items and certain re-measurements of US$318m (refer to note 5 of the financial statements) and Laggan-Tormore related losses of US$101m (refer to note 3 of the financial statements). These two items are subject to the procedures as explained in the section titled ‘Tailoring the scope’.
Reported pre-tax profit – US$100m (2015: US$335m loss)Starting basis
• Total adjusted profit US$519m (2015: US$500m)• Materiality of US$25m (2015: US$25m) (5% of materiality basis)
Materiality
• Exceptional items increase basis by US$419m (2015: US$835m)– Laggan-Tormore related losses – US$101m (2015: US$480m)– Exceptional items and certain re-measurements – US$318m (2015: US$355m)
Adjustments
Performance materialityThe application of materiality at the individual account or balance level. It is set at an amount to reduce to an appropriately low level the probability that the aggregate of uncorrected and undetected misstatements exceeds materiality.
On the basis of our risk assessments, together with our assessment of the Group’s overall control environment, our judgement was that performance materiality was 50% (2015: 50%) of our planning materiality, namely US$12.5m (2015: US$12.5m). We have set performance materiality at this percentage due to our past experience of the audit that indicates a higher risk of misstatements, both corrected and uncorrected.
Audit work at component locations for the purpose of obtaining audit coverage over significant financial statement accounts is undertaken based on a percentage of total performance materiality. The performance materiality set for each component is based on the relative scale and risk of the component to the Group as a whole and our assessment of the risk of misstatement at that component. In the current year, the range of performance materiality allocated to components was US$2.5m to US$11.2m (2015: US$2.5m to US$10.0m).
Reporting thresholdAn amount below which identified misstatements are considered as being clearly trivial.
We agreed with the Audit Committee that we would report to them all uncorrected audit differences in excess of US$1.25m (2015: US$1.25m), which is set at 5% of planning materiality, as well as differences below that threshold that, in our view, warranted reporting on qualitative grounds. Reclassification differences are only reported to the Audit Committee where the difference exceeds 2% of the applicable primary financial statement line items.
We evaluate any uncorrected misstatements against both the quantitative measures of materiality discussed above and in light of other relevant qualitative considerations in forming our opinion.
Scope of the audit of the financial statementsAn audit involves obtaining evidence about the amounts and disclosures in the financial statements sufficient to give reasonable assurance that the financial statements are free from material misstatement, whether caused by fraud or error. This includes an assessment of: whether the accounting policies are appropriate to the Group’s and the Parent Company’s circumstances and have been consistently applied and adequately disclosed; the reasonableness of significant accounting estimates made by the Directors; and the overall presentation of the financial statements. In addition, we read all the financial and non-financial information in the Annual Report and Accounts to identify material inconsistencies with the audited financial statements and to identify any information that is apparently materially incorrect based on, or materially inconsistent with, the knowledge acquired by us in the course of performing the audit. If we become aware of any apparent material misstatements or inconsistencies we consider the implications for our report.
118 / Petrofac Annual report and accounts 2016

Respective responsibilities of Directors and auditorAs explained more fully in the Directors’ Responsibilities Statement set out on page 111, the Directors are responsible for the preparation of the financial statements and for being satisfied that they give a true and fair view. Our responsibility is to audit and express an opinion on the financial statements in accordance with applicable law and International Standards on Auditing (UK and Ireland). Those standards require us to comply with the Auditing Practices Board’s Ethical Standards for Auditors.
In addition, the Company has also instructed us to:
• Report as to whether the information given in the Corporate Governance Statement with respect to internal control and risk management systems in relation to financial reporting processes and about share capital structures is consistent with the financial statements
• Report whether the information given in the Strategic Report is consistent with the Group financial statements• Report whether the section of the Directors’ Remuneration Report that is described as audited has been properly prepared in accordance with
the basis of preparation described therein
Our audit work has been undertaken so that we might state to the Company’s members those matters we are required to state to them in an auditor’s report and for no other purpose. To the fullest extent permitted by law, we do not accept or assume responsibility to anyone other than the Company and the Company’s members as a body, for our audit work, for this report, or for the opinions we have formed.
Opinion on other matters requested by the Group and CompanyIn our opinion:
• The information given in the Strategic Report set out on pages 2 to 67 and the Governance Report set out on pages 68 to 110 and page 79 with respect to internal control and risk management systems in relation to financial reporting processes and about share capital structures is consistent with the financial statements
• The information given in the Strategic Report is consistent with the Group financial statements• The part of the Directors’ Remuneration Report to be audited has been properly prepared in accordance with the basis of preparation as
described therein
Matters on which we are required to report by exception
ISAs (UK and Ireland) reporting
We are required to report to you if, in our opinion, financial and non-financial information in the annual report is:
• Materially inconsistent with the information in the audited financial statements; or • Apparently materially incorrect based on, or materially inconsistent with, our knowledge
of the Group acquired in the course of performing our audit; or • Otherwise misleading.
In particular, we are required to report whether we have identified any inconsistencies between our knowledge acquired in the course of performing the audit and the Directors’ statement that they consider the Annual Report and Accounts taken as a whole is fair, balanced and understandable and provides the information necessary for shareholders to assess the entity’s performance, business model and strategy; and whether the Annual Report appropriately addresses those matters that we communicated to the Audit Committee that we consider should have been disclosed.
We have no exceptions to report.
Companies (Jersey) Law 1991 reporting
Under Companies (Jersey) Law 1991 we are required to report to you if, in our opinion:
• Proper accounting records have not been kept by the Parent Company, or proper returns adequate for our audit have not been received from branches not visited by us; or
• The Parent Company’s financial statements are not in agreement with the accounting records and returns; or
• We have not received all the information and explanations we require for our audit.
We have no exceptions to report.
Listing Rules review requirements
We are required to review: • The Directors’ statement in relation to going concern, set out on page 111, and longer-term
viability, set out on page 30.
• The part of the Corporate Governance Statement relating to the Company’s compliance with the provisions of the UK Corporate Governance Code specified for our review.
We have no exceptions to report.
Petrofac Annual report and accounts 2016 / 119
Financial statem
ents

Independent auditor’s report to the members of Petrofac Limited continued
Statement on the Directors’ assessment of the principal risks that would threaten the solvency or liquidity of the entity
ISAs (UK and Ireland) reporting
We are required to give a statement as to whether we have anything material to add or to draw attention to in relation to:• The Directors’ confirmation in the Annual Report that they have carried out a robust
assessment of the principal risks facing the entity, including those that would threaten its business model, future performance, solvency or liquidity;
• The disclosures in the Annual Report that describe those risks and explain how they are being managed or mitigated;
• The Directors’ statement in the financial statements about whether they considered it appropriate to adopt the going concern basis of accounting in preparing them, and their identification of any material uncertainties to the entity’s ability to continue to do so over a period of at least twelve months from the date of approval of the financial statements; and
• The Directors’ explanation in the Annual Report as to how they have assessed the prospects of the entity, over what period they have done so and why they consider that period to be appropriate, and their statement as to whether they have a reasonable expectation that the entity will be able to continue in operation and meet its liabilities as they fall due over the period of their assessment, including any related disclosures drawing attention to any necessary qualifications or assumptions
We have no exceptions to report.
John Flahertyfor and on behalf of Ernst & Young LLPLondon21 February 2017
Notes:1. The maintenance and integrity of the Petrofac Limited website is the responsibility of the Directors; the work carried out by the auditors does not involve consideration of these matters
and, accordingly, the auditors accept no responsibility for any changes that may have occurred to the financial statements since they were initially presented on the website.2. Legislation in Jersey governing the preparation and dissemination of financial statements may differ from legislation in other jurisdictions.
120 / Petrofac Annual report and accounts 2016

Consolidated income statementFor the year ended 31 December 2016
Notes
*Business performance
US$m
Exceptional items and certain re-measurements
US$m
Total 2016
US$m
*Business performance
US$m
Exceptional items and certain re-measurements
US$m
Total2015
US$m
Revenue 4a 7,873 – 7,873 6,844 – 6,844Cost of sales 4b (7,134) – (7,134) (6,429) – (6,429)Gross profit 739 – 739 415 – 415Selling, general and administration expenses 4c (244) – (244) (328) – (328)Exceptional items and certain re-measurements 5 – (322) (322) – (354) (354)Other operating income 4f 27 – 27 24 – 24Other operating expenses 4g (14) – (14) (9) – (9)Profit/(loss) from operations before tax and finance (costs)/income 508 (322) 186 102 (354) (252)Finance costs 6 (101) – (101) (101) – (101)Finance income 6 3 – 3 9 – 9Share of profits/(losses) of associates/joint ventures 15 8 4 12 10 (1) 9Profit/(loss) before tax 418 (318) 100 20 (355) (335)Income tax expense 7a (85) (1) (86) (6) (3) (9)Profit/(loss) for the year 333 (319) 14 14 (358) (344)
Attributable to:Petrofac Limited shareholders 320 (319) 1 9 (358) (349)Non-controlling interests 11 13 – 13 5 – 5
333 (319) 14 14 (358) (344)
Earnings/(loss) per share (US cents) on profit attributable to Petrofac Limited shareholders– Basic 8 94.12 (93.83) 0.29 2.65 (105.30) (102.65)– Diluted 8 93.29 (93.00) 0.29 2.65 (105.30) (102.65)
* This measurement is shown by Petrofac as it is used as a means of measuring the underlying performance of the business, see note 2.
The attached notes 1 to 33 form part of these consolidated financial statements.
Petrofac Annual report and accounts 2016 / 121
Financial statem
ents

Consolidated statement of other comprehensive incomeFor the year ended 31 December 2016
Notes2016
US$m2015
US$m
Profit/(loss) for the year 14 (344)
Other Comprehensive Income/(Loss)Net changes in fair value of derivatives and financial assets designated as cash flow hedges 25 49 (47)Changes in fair value of available-for-sale financial asset 25, 16 – (16)Foreign currency translation gains 25 31 –Other comprehensive income/(loss) to be reclassified to consolidated income statement in subsequent periods 80 (63)
Other comprehensive income/(loss) reclassified to consolidated income statementNet gains on maturity of cash flow hedges recycled in the year 25 (3) (11)Unrealised loss on the fair value of available-for-sale investment reclassified to consolidated income statement 25, 5 16 – Foreign currency losses recycled to consolidated income statement upon disposal of a subsidiary 25 11 –Other comprehensive income/(loss) reclassified to consolidated income statement 24 (11)Total comprehensive income/(loss) for the year 118 (418)
Attributable to:
Petrofac Limited shareholders 96 (415)Non-controlling interests 11 22 (3)
118 (418)
The attached notes 1 to 33 form part of these consolidated financial statements.
122 / Petrofac Annual report and accounts 2016

Consolidated statement of financial positionAt 31 December 2016
Notes2016
US$m2015
US$m
AssetsNon-current assetsProperty, plant and equipment 10 1,418 1,775Goodwill 12 72 80Intangible assets 14 96 107Investments in associates/joint ventures 15 65 74Available-for-sale investment 16 – 169Other financial assets 17 318 752Income tax receivable – 8Deferred tax assets 7c 63 80
2,032 3,045Current assetsInventories 18 11 13Work in progress 19 2,182 1,794Trade and other receivables 20 2,162 2,124Due from related parties 30 4 2Other financial assets 17 546 455Income tax receivable 9 10Cash and short-term deposits 21 1,167 1,104
6,081 5,502Assets held for sale 13 128 –
6,209 5,502Total assets 8,241 8,547Equity and liabilities EquityShare capital 22 7 7Share premium 22 4 4Capital redemption reserve 22 11 11Treasury shares 23 (105) (111)Other reserves 25 73 (16)Retained earnings 1,107 1,335Equity attributable to Petrofac Limited shareholders 1,097 1,230Non-controlling interests 11 26 2Total equity 1,123 1,232Non-current liabilities Interest-bearing loans and borrowings 26 1,423 1,270Provisions 27 224 331Other financial liabilities 17 348 659Deferred tax liabilities 7c 94 141
2,089 2,401Current liabilitiesTrade and other payables 28 1,974 2,510Due to related parties 30 – 1Interest-bearing loans and borrowings 26 361 520Other financial liabilities 17 368 336Income tax payable 188 113Billings in excess of cost and estimated earnings 19 44 201Accrued contract expenses 31 2,060 1,233
4,995 4,914Liabilities associated with assets held for sale 13 34 –
5,029 4,914Total liabilities 7,118 7,315Total equity and liabilities 8,241 8,547
The financial statements on pages 121 to 171 were approved by the Board of Directors on 21 February 2017 and signed on its behalf by Alastair Cochran – Chief Financial Officer.
The attached notes 1 to 33 form part of these consolidated financial statements.
Petrofac Annual report and accounts 2016 / 123
Financial statem
ents

Consolidated statement of cash flowsFor the year ended 31 December 2016
Notes2016
US$m2015
US$m
Operating activities Profit/(loss) before tax 100 (335)Exceptional items and certain re-measurements 5 318 355Profit before tax, exceptional items and certain re-measurements 418 20Adjustments to reconcile profit before tax, exceptional items and certain re-measurements to net cash flows:
Depreciation, amortisation and write off 4b, 4c 188 200Share-based payments 4d 17 23Difference between other long-term employment benefits paid and amounts recognised in the consolidated income statement 27 7 15Net finance expense 6 98 92Gain arising from disposal of non-current asset 4f – (8) Provision for costs in excess of revenues on a contract 31 20 48 Share of profits of associates/joint ventures 15 (8) (10)Other non-cash items, net (1) (67)
739 313Working capital adjustments:
Trade and other receivables (112) 605Work in progress (388) (192)Due from related parties (2) (2)Inventories 2 3Other current financial assets 17 384 55Trade and other payables (441) (168)Billings in excess of cost and estimated earnings (157) (64)Accrued contract expenses 800 367Due to related parties (1) (2)
824 915Long-term receivables from customers 17 (62) (50)Other non-current items, net 44 (38)Cash generated from operations 806 827Restructuring, redundancy and migration costs paid (21) (13)Interest paid (94) (96)Income taxes paid, net (40) (49)Net cash flows from operating activities 651 669Investing activitiesPurchase of property, plant and equipment (165) (169)Payments for intangible oil and gas assets 14 (2) (17)Additional investment made to available-for-sale investment 16 (12) –Investments in associate and joint ventures 15 (5) (2)Dividend received from associates/joint ventures 15 28 8Loan in respect of the development of the Greater Stella Area 17 (119) (182)Proceeds from disposal of property, plant and equipment 6 2Proceeds from disposal of subsidiary, net of cash disposed 4f 1 41Interest received 3 1Net cash flows used in investing activities (265) (318)Financing activitiesInterest-bearing loans and borrowings obtained, net of debt acquisition cost 2,293 985Repayment of interest-bearing loans and borrowings, including finance leases (2,385) (943)Treasury shares purchased 23 (36) (39)Equity dividends paid, net (224) (223)Net cash flows used in financing activities (352) (220)Net increase in cash and cash equivalents 34 131Net foreign exchange difference (12) (7)Cash and cash equivalents at 1 January 1,101 977Cash and cash equivalents at 31 December 21 1,123 1,101
The attached notes 1 to 33 form part of these consolidated financial statements.
124 / Petrofac Annual report and accounts 2016

Consolidated statement of changes in equityFor the year ended 31 December 2016
Attributable to Petrofac Limited shareholders
Issued share
capital US$m
Share
premium US$m
Capital redemption
reserve US$m
*Treasury shares US$m
(note 23)
Other reserves
US$m (note 25)
Retained earnings
US$mTotal
US$m
Non- controlling
interests US$m
Total equity US$m
Balance at 1 January 2016 7 4 11 (111) (16) 1,335 1,230 2 1,232Profit for the year – – – – – 1 1 13 14 Other comprehensive income – – – – 95 – 95 9 104 Total comprehensive income for the year – – – – 95 1 96 22 118 Share-based payments charge (note 24) – – – – 17 – 17 – 17 Shares vested during the year (note 23) – – – 42 (39) (3) – – – Transfer to reserve for share-based payments (note 24) – – – – 17 – 17 – 17Treasury shares purchased (note 23) – – – (36) – – (36) – (36) Income tax on share-based payments reserve – – – – (1) – (1) – (1)Adjustment to non-controlling interest – – – – – (2) (2) 2 –Loan from non-controlling interest converted to equity – – – – – – – 1 1Dividends (note 9) – – – – – (224) (224) (1) (225) Balance at 31 December 2016 7 4 11 (105) 73 1,107 1,097 26 1,123
Attributable to Petrofac Limited shareholders
Issued share
capital US$m
Share premium
US$m
Capital redemption
reserve US$m
*Treasury shares US$m
(note 23)
Other reserves
US$m (note 25)
Retained earnings
US$mTotal
US$m
Non- controlling
interests US$m
Total equity US$m
Balance at 1 January 2015 7 4 11 (101) 31 1,909 1,861 10 1,871(Loss)/profit for the year – – – – – (349) (349) 5 (344)Other comprehensive loss – – – – (66) – (66) (8) (74)Total comprehensive loss for the year – – – – (66) (349) (415) (3) (418)Share-based payments charge (note 24) – – – – 23 – 23 – 23Shares vested during the year (note 23) – – – 29 (27) (2) – – –Transfer to reserve for share-based payments (note 24) – – – – 23 – 23 – 23Treasury shares purchased (note 23) – – – (39) – – (39) – (39)Dividends (note 9) – – – – – (223) (223) (5) (228)Balance at 31 December 2015 7 4 11 (111) (16) 1,335 1,230 2 1,232
* Shares held by Petrofac Employee Benefit Trust and Petrofac Joint Venture Companies Employee Benefit Trust.
The attached notes 1 to 33 form part of these consolidated financial statements.
Petrofac Annual report and accounts 2016 / 125
Financial statem
ents

Notes to the consolidated financial statementsFor the year ended 31 December 2016
1 Corporate information
The consolidated financial statements of Petrofac Limited and its subsidiaries (collectively, the Group) for the year ended 31 December 2016 were authorised for issue in accordance with a resolution of the Directors on 21 February 2017.
Petrofac Limited (the ‘Company’) is a limited liability company registered and domiciled in Jersey under the Companies (Jersey) Law 1991 and is the holding company for the international group of Petrofac subsidiaries. The Company’s 31 December 2016 financial statements are shown on pages 173 to 188. The Group’s principal activity is the provision of services to the oil and gas production and processing industry.
Information on the Group’s subsidiaries and joint ventures is contained in note 33 to these consolidated financial statements. Information on other related party relationships of the Group is provided in note 30.
2 Summary of significant accounting policies
Basis of preparationThe consolidated financial statements of the Group have been prepared in accordance with International Financial Reporting Standards (IFRS) as issued by the International Accounting Standards Board (IASB) and applicable requirements of Jersey law.
The consolidated financial statements have been prepared on a historical cost basis, except for available-for-sale (AFS) investment, derivative financial instruments, financial assets held at fair value through profit and loss and contingent consideration that have been measured at fair value. Certain items of inventory are carried at net realisable value. The consolidated financial statements are presented in United States dollars and all values are rounded to the nearest million (US$m), except when otherwise indicated.
Presentation of resultsPetrofac presents its results in the consolidated income statement to identify separately the contribution of impairments, certain re-measurements, restructuring and redundancy costs, contract migration costs, material deferred tax movements arising due to foreign exchange differences in jurisdictions where tax is computed based on the functional currency of the country, material forward rate movements in Kuwaiti dinar forward currency contracts and net costs relating to the cessation of the Berantai RSC contract in order to provide readers with a clear and consistent presentation of the underlying operating performance of the Group’s ongoing business.
New standards and interpretationsThe Group has adopted new and revised standards and interpretations issued by the International Accounting Standards Board (IASB) and the International Financial Reporting Interpretations Committee (IFRIC) of the IASB that are relevant to its operations and effective for accounting periods beginning on or after 1 January 2016.
Although these new standards and amendments apply for the first time in 2016, they do not have a material impact on the consolidated financial statements of the Group. The nature and the impact of each new standard or amendment is described below:
Amendments to IFRS 11 Joint Arrangements: Accounting for Acquisitions of InterestsThe amendments to IFRS 11 require that a joint operator accounting for the acquisition of an interest in a joint operation, in which the activity of the joint operation constitutes a business, must apply the relevant IFRS 3 Business Combinations principles for business combination accounting. The amendments also clarify that a previously held interest in a joint operation is not re-measured on the acquisition of an additional interest in the same joint operation if joint control is retained. In addition, a scope exclusion has been added to IFRS 11 to specify that the amendments do not apply when the parties sharing joint control, including the reporting entity, are under common control of the same ultimate controlling party.
The amendments apply to both the acquisition of the initial interest in a joint operation and the acquisition of any additional interests in the same joint operation and are applied prospectively. These amendments do not have any impact on the Group as there has been no interest acquired in a joint operation during the period, however will be applied in the future when applicable.
Amendments to IAS 16 and IAS 38: Clarification of Acceptable Methods of Depreciation and AmortisationThe amendments clarify the principle in IAS 16 Property, Plant and Equipment and IAS 38 Intangible Assets that revenue reflects a pattern of economic benefits that are generated from operating a business (of which the asset is a part) rather than the economic benefits that are consumed through use of the asset. As a result, a revenue-based method cannot be used to depreciate property, plant and equipment and may only be used in very limited circumstances to amortise intangible assets. The amendments are applied prospectively and impact the Group’s Production Enhancement Contracts (PECs) in Mexico. The application of this amendment resulted in an increase in pre-tax depreciation charge for the year of US$24m (post-tax US$18m).
Standards issued but not yet effectiveStandards issued but not yet effective up to the date of issuance of the Group’s consolidated financial statements are listed below and include only those standards and interpretations that are likely to have an impact on the disclosures, financial position or performance of the Group at a future date. The Group intends to adopt these standards when they become effective.
IFRS 9 Financial InstrumentsIn July 2014, the IASB issued the final version of IFRS 9 Financial Instruments that replaces IAS 39 Financial Instruments: Recognition and Measurement and all previous versions of IFRS 9. IFRS 9 brings together all three aspects of the accounting for financial instruments project: classification and measurement, impairment and hedge accounting. IFRS 9 is effective for annual periods beginning on or after 1 January 2018, with early application permitted. Except for hedge accounting, retrospective application is required but providing comparative information is not compulsory. For hedge accounting, the requirements are generally applied prospectively, with some limited exceptions. The adoption of IFRS 9 will have an effect on the classification and measurement of the Group’s financial assets and financial liabilities. The Group is currently assessing the impact of IFRS 9 and plans to adopt the new standard on the required effective date.
IFRS 15 Revenue from Contracts with CustomersIFRS 15 was issued in May 2014 and establishes a five-step model to account for revenue arising from contracts with customers. Under IFRS 15, revenue is recognised at an amount that reflects the consideration to which an entity expects to be entitled in exchange for transferring goods or services to a customer.
The new revenue standard will supersede all current revenue recognition requirements under IFRS (e.g. IAS 11 Construction Contracts, IAS 18 Revenue and IFRIC 18 Transfers of Assets from Customers). Either a full retrospective application or a modified retrospective application is required for annual periods beginning on or after 1 January 2018. Early adoption is permitted. It is the Group’s current intention to adopt IFRS 15 for the year ending 31 December 2018 and it will confirm which application it will adopt before the start of this accounting period. The Group has performed a preliminary assessment of the impact of adoption of IFRS 15 and is currently evaluating the potential impact on the Group’s revenue recognition policies. Further detailed analysis is ongoing. Furthermore, the Group is considering the clarifications issued by the IASB in April 2016 and will monitor any further developments.
126 / Petrofac Annual report and accounts 2016
Rendering of servicesThe Group provides lump-sum engineering, procurement and construction project execution services and reimbursable engineering and production services to the oil and gas industry. Currently, the Group accounts for the lump-sum engineering, procurement and construction project execution services contract as a single performance obligation and recognises service revenue by reference to the stage of completion on the overall contract (see current revenue recognition policies on page 131).
The reimbursable engineering and production services contracts are currently segregated into distinct performance obligations based on the assessment that the service is capable of being distinct both individually and within the context of the contract. Currently, the Group accounts for the reimbursable engineering and production services contracts as separate deliverables of bundled sales, allocates consideration between these deliverables using the relative fair value approach and recognises service revenue as and when the services are rendered or by reference to the stage of completion (see current revenue recognition policies on page 131).
Under IFRS 15, revenue recognition must take into account each separate performance obligation and relative stand-alone selling prices. As a result, the allocation of the consideration and, consequently, the timing of the amount of revenue recognised in relation to these services contracts may be impacted. The Group will continue its analysis during 2017 and provide an update on its progress in the 2017 interim financial statements.
In preparing to adopt IFRS 15 for its services contracts, the Group is considering the following:
Variable considerationCurrently, the Group recognises revenue from the rendering of services measured based on the fair value of the consideration received or receivable, net of any allowances. If revenue cannot be reliably measured, the Group defers revenue recognition until the uncertainty is resolved. Such provisions give rise to variable consideration under IFRS 15, and will be required to be estimated at contract inception.
IFRS 15 requires the estimated variable consideration to be constrained to prevent over-recognition of revenue. The Group continues to assess individual contracts to determine the estimated variable consideration and related constraint.
Warranty obligationsThe Group provides warranties for general repairs and does not provide extended warranties or maintenance services in its contracts with customers. As such, the Group expects that such warranties will be assurance-type warranties which will continue to be accounted for under IAS 37 Provisions, Contingent Liabilities and Contingent Assets consistent with its current practice, however further analysis is required.
Principal vs agentIFRS 15 requires that when other parties are involved in providing goods or services to an entity’s customer, the entity must determine whether its performance obligation is to provide the good or service itself (as a principal) or to arrange for another party to provide the good or service (as an agent). Currently, the Group is acting as a principal in providing goods and services to its customers for all contracts. However the Group’s Engineering, Procurement and Constructions Management (EPCm) contracts in particular are currently being reviewed in line with the requirements under IFRS 15 to identify if the Group’s procurement services under such contracts are provided to the customer as an agent. This may impact the amount of revenue to be recognised.
Sale of goodsIn addition to services described above, the Group is also engaged in the sale of crude oil to customers. Contracts with customers in which the sale of crude oil is generally expected to be the only performance obligation are not expected to have any impact on the Group’s profit or loss upon
adoption of IFRS 15. The Group expects the revenue recognition to occur at a point in time when control of the goods is transferred to the customer, generally on delivery of the goods.
Presentation and disclosure requirementsIFRS 15 provides presentation and disclosure requirements, which are more extensive than under current IFRS. The presentation requirements represent a significant change from current practice and increase the volume of disclosures required in Group’s financial statements. The Group is in the process of assessing its current systems, internal controls, and policies and procedures, and will make the necessary changes to collect and disclose the required information.
Amendments to IFRS 10 and IAS 28: Sale or Contribution of Assets between an Investor and its Associate or Joint VentureThe amendments address the conflict between IFRS 10 and IAS 28 in dealing with the loss of control of a subsidiary that is sold or contributed to an associate or joint venture. The amendments clarify that the gain or loss resulting from the sale or contribution of assets that constitute a business, as defined in IFRS 3, between an investor and its associate or joint venture, is recognised in full. Any gain or loss resulting from the sale or contribution of assets that do not constitute a business, however, is recognised only to the extent of unrelated investors’ interests in the associate or joint venture. The IASB has deferred the effective date of these amendments indefinitely, but if early adopted the amendments must be applied prospectively. These amendments will be applied in the future when applicable.
Basis of consolidationThe consolidated financial statements comprise the financial statements of Petrofac Limited and its subsidiaries as at 31 December 2016. Control is achieved when the Group is exposed, or has rights, to variable returns from its involvement with the investee and has the ability to affect those returns through its power over the investee.
Generally, there is a presumption that a majority of voting rights result in control. To support this presumption and when the Group has less than a majority of the voting or similar rights of an investee, the Group considers all relevant facts and circumstances in assessing whether it has power over an investee, including:
• The contractual arrangement with the other vote holders of the investee
• Rights arising from other contractual arrangements• The Group’s voting rights and potential voting rights
The Group re-assesses whether or not it controls an investee if facts and circumstances indicate that there are changes to one or more of the three elements of control. Consolidation of a subsidiary begins when the Group obtains control over the subsidiary and ceases when the Group loses control of the subsidiary. Assets, liabilities, income and expenses of a subsidiary acquired or disposed of during the year are included in the statement of comprehensive income from the date the Group gains control until the date the Group ceases to control the subsidiary.
Profit or loss and each component of other comprehensive income (OCI) are attributed to the Petrofac Limited shareholders and to the non-controlling interests, even if this results in the non-controlling interests having a deficit balance. When necessary, adjustments are made to the financial statements of subsidiaries to bring their accounting policies into line with the Group’s accounting policies.
All intra-group assets and liabilities, equity, income, expenses and cash flows relating to transactions between members of the Group are eliminated in full on consolidation.
Petrofac Annual report and accounts 2016 / 127
Financial statem
ents

Notes to the consolidated financial statements continuedFor the year ended 31 December 2016
2 Summary of significant accounting policies continued
A change in the ownership interest of a subsidiary, without a loss of control, is accounted for as an equity transaction.
If the Group loses control over a subsidiary, it derecognises the related assets (including goodwill), liabilities, non-controlling interest and other components of equity while any resultant gain or loss is recognised in the consolidated income statement. Any investment retained is recognised at fair value.
Business combinations and goodwillBusiness combinations are accounted for using the acquisition method. The cost of an acquisition is measured as the aggregate of the consideration transferred measured at acquisition date fair value and the amount of any non-controlling interests in the acquiree. For each business combination, the Group elects whether to measure the non-controlling interests in the acquiree at fair value or at the proportionate share of the acquiree’s identifiable net assets. Acquisition-related costs are expensed as incurred and included in administrative expenses. All transaction costs associated with business combinations are charged to the consolidated income statement in the year of such combination.
When the Group acquires a business, it assesses the financial assets and liabilities assumed for appropriate classification and designation in accordance with the contractual terms, economic circumstances and pertinent conditions as at the acquisition date. This includes the separation of embedded derivatives in host contracts by the acquiree. If the business combination is achieved in stages, any previously held equity interest is re-measured at its acquisition date fair value and any resulting gain or loss is recognised in the consolidated income statement.
Goodwill is initially measured at cost, being the excess of the aggregate of the consideration transferred and the amount recognised for non-controlling interests, and any previous interest held, over the net fair value of the identifiable assets acquired and liabilities assumed. If the fair value of the net assets acquired is in excess of the aggregate consideration transferred, the Group reassesses whether it has correctly identified all of the assets acquired and all of the liabilities assumed and reviews the procedures used to measure the amounts to be recognised at the acquisition date. If the reassessment still results in an excess of the fair value of net assets acquired over the aggregate consideration transferred, then the gain is recognised in the consolidated income statement.
Following initial recognition, goodwill is measured at cost less any accumulated impairment losses. Goodwill is reviewed for impairment annually or more frequently if events or changes in circumstances indicate that such carrying value may be impaired.
For the purpose of impairment testing, goodwill acquired is allocated to the cash-generating units that are expected to benefit from the synergies of the combination. Each unit or units to which goodwill is allocated represents the lowest level within the Group at which the goodwill is monitored for internal management purposes and is not larger than an operating segment determined in accordance with IFRS 8 ‘Operating Segments’.
Impairment is determined by assessing the recoverable amount of the cash-generating units to which the goodwill relates. Where the recoverable amount of the cash-generating units is less than the carrying amount of the cash-generating units and related goodwill, an impairment loss is recognised.
Where goodwill has been allocated to cash-generating units and part of the operation within those units is disposed of, the goodwill associated with the operation disposed of is included in the carrying amount of the operation when determining the gain or loss on disposal of the operation. Goodwill disposed of in this circumstance is measured based on the relative values of the operation disposed of and the value portion of the cash-generating units retained.
Contingent consideration payable on a business combination When, as part of a business combination, the Group defers a proportion of the total purchase consideration payable for an acquisition, the amount provided for is the acquisition date fair value of the consideration. The unwinding of the discount element is recognised as a finance cost in the consolidated income statement. Changes in estimated contingent consideration payable on acquisition are recognised in the consolidated income statement unless they are measurement period adjustments which arise as a result of additional information obtained after the acquisition date about the facts and circumstances existing at the acquisition date, which are adjusted against carried goodwill. Contingent consideration that is classified as equity is not re-measured and subsequent settlement is accounted for within equity.
Investment in associates and joint venturesAn associate is an entity over which the Group has significant influence. Significant influence is the power to participate in the financial and operating policy decisions of the investee, but is not control or joint control over those policies.
A joint venture is a type of joint arrangement whereby the parties that have joint control of the arrangement have rights to the net assets of the joint venture. A joint operation is a type of joint arrangement whereby the parties that have joint control of the arrangement have rights to the assets and obligations for the liabilities relating to the arrangement. Joint control is the contractually agreed sharing of control of an arrangement, which exists only when decisions about the relevant activities require unanimous consent of the parties sharing control.
The considerations made in determining significant influence or joint control are similar to those necessary to determine control over subsidiaries.
The Group’s investments in its associates and joint ventures are accounted for using the equity method. Under the equity method, the investment in an associate or a joint venture is initially recognised at cost. The carrying amount of the investment is adjusted to recognise changes in the Group’s share of net assets of the associate or joint venture since the acquisition date. Goodwill relating to the associate or joint venture is included in the carrying amount of the investment and is not tested for impairment separately.
The consolidated income statement reflects the Group’s share of the results of operations of the associate or joint venture. Any change in OCI of those investees is presented as part of the Group’s OCI. In addition, when there has been a change recognised directly in the equity of the associate or joint venture, the Group recognises its share of any changes, when applicable, in the statement of changes in equity.
The aggregate of the Group’s share of profit or loss of an associate and a joint venture is shown on the face of the consolidated income statement outside operating profit and represents profit or loss after tax and non-controlling interests in the subsidiaries of the associate or joint venture.
Any unrealised gains and losses resulting from transactions between the Group and the associate and joint venture are eliminated to the extent of the interest in its associates and joint ventures.
The financial statements of the associate or joint venture are prepared for the same reporting period as the Group. When necessary, adjustments are made to bring the accounting policies in line with those of the Group.
128 / Petrofac Annual report and accounts 2016

After application of the equity method, the Group determines whether it is necessary to recognise an impairment loss on its investment in its associate or joint venture. At each reporting date, the Group determines whether there is objective evidence that the investment in the associate or joint venture is impaired. If there is such evidence, the Group calculates the amount of impairment as the difference between the recoverable amount of the associate or joint venture and its carrying value and recognises any loss as an exceptional item in the consolidated income statement.
Upon loss of significant influence over the associate or joint control over the joint venture, the Group measures and recognises any retained investment at its fair value. Any difference between the carrying amount of the associate or joint venture upon loss of significant influence or joint control and the fair value of the retained investment and proceeds from disposal is recognised in the consolidated income statement.
Joint operationsThe Group’s interests in joint operations are recognised in relation to its interest in a joint operation’s:
• Assets, including its share of any assets held jointly• Liabilities, including its share of any liabilities incurred jointly• Revenue from the sale of its share of the output arising from
the joint operation• Share of the revenue from the sale of the output by the
joint operation• Expenses, including its share of any expenses incurred jointly
Under joint operations, the expenses that the Group incurs and its share of the revenue earned are recognised in the consolidated income statement. Assets controlled by the Group and liabilities incurred by it are recognised in the consolidated statement of financial position.
Foreign currency translationThe Group’s consolidated financial statements are presented in United States dollars, which is also the Parent Company’s functional currency. For each entity, the Group determines the functional currency and items included in the financial statements of each entity are measured using that functional currency. The Group uses the direct method of consolidation and on disposal of a foreign operation, the gain or loss that is reclassified to profit or loss reflects the amount that arises from using this method.
Transactions and balancesTransactions in foreign currencies are initially recorded by the Group’s entities at their respective functional currency spot rates at the date the transaction first qualifies for recognition.
Monetary assets and liabilities denominated in foreign currencies are translated at the functional currency spot rates of exchange at the reporting date.
Differences arising on settlement or translation of monetary items are recognised in profit or loss with the exception of monetary items that are designated as part of the hedge of the Group’s net investment of a foreign operation. These are recognised in OCI until the net investment is disposed of, at which time the cumulative amount is reclassified to profit or loss. Tax charges and credits attributable to exchange differences on those monetary items are also recorded in OCI.
Non-monetary items that are measured at historical cost in a foreign currency are translated using the exchange rates at the dates of the initial transactions. Non-monetary items measured at fair value in a foreign currency are translated using the exchange rates at the date when the fair value is determined. The gain or loss arising on translation of non-monetary items measured at fair value is treated in line with the recognition of the gain or loss on the change in fair value of the item (i.e. translation differences on items whose fair value gain or loss is recognised in OCI or profit or loss are also recognised in OCI or profit or loss, respectively).
Group companiesOn consolidation, the assets and liabilities of foreign operations are translated into United States dollars at the rate of exchange prevailing at the reporting date and their statements of profit or loss are translated at exchange rates prevailing at the dates of the transactions. The exchange differences arising on translation for consolidation are recognised in OCI. On disposal of a foreign operation, the component of OCI relating to that particular foreign operation is recognised in the consolidated income statement.
Any goodwill arising on the acquisition of a foreign operation and any fair value adjustments to the carrying amounts of assets and liabilities arising on the acquisition are treated as assets and liabilities of the foreign operation and translated at the spot rate of exchange at the reporting date.
Significant accounting judgements and estimatesJudgementsIn the process of applying the Group’s accounting policies, management has made the following judgements, apart from those involving estimations, which have the most significant effect on the amounts recognised in the consolidated financial statements:
• Revenue recognition on fixed-price engineering, procurement and construction contracts: the Group recognises revenue on fixed-price engineering, procurement and construction contracts using the percentage-of-completion method, based on surveys of work performed. The Group has determined this basis of revenue recognition is the best available measure of progress on such contracts
• Revenue recognition on consortium contracts: the Group recognises its share of revenue and backlog revenue from contracts agreed as part of a consortium. The Group uses the percentage-of-completion method based on surveys of work performed to recognise revenue for the period and then recognises their share of revenue and costs as per the agreed consortium contractual arrangement. In selecting the appropriate accounting treatment, the main considerations are: – Determination of whether the joint arrangement is a joint venture
or joint operation (though not directly related to revenue recognition this element has a material impact on the presentation of revenue for each project)
– At what point can the revenues, costs and margin from this type of service contract be estimated/reliably measured in accordance with IAS 11; and
– Whether there are any other remaining features unique to the contract that are relevant to the assessment
In selecting the most relevant and reliable accounting policies for IES contracts the main considerations are as follows:
• Determination of whether the joint arrangement is a joint venture or joint operation; though not directly related to revenue recognition this element has a material impact on the presentation of revenue for each project
• Whether the multiple service elements under the contract should be bifurcated such as construction phase followed by an operations and maintenance stage
• Whether the Group has legal rights to the production output and therefore is able to book reserves in respect of the project
• The nature and extent, if any, of volume and price financial exposures under the terms of the contract
• The extent to which the Group’s capital investment is at risk and the mechanism for recoverability under the terms of the contract
• At what point can the revenues from each type of contract be estimated/reliably measured in accordance with IAS 18
• Whether there are any other remaining features unique to the contract that are relevant to the assessment
Petrofac Annual report and accounts 2016 / 129
Financial statem
ents

Notes to the consolidated financial statements continuedFor the year ended 31 December 2016
2 Summary of significant accounting policies continued
Revenue recognition on Integrated Energy Services (IES) contracts:
• The Group assesses on a case by case basis the most appropriate treatment for its various commercial structures which include Risk Service Contracts (RSCs), Production Enhancement Contracts (PECs) and Equity Upstream Investments including Production Sharing Contracts (see accounting policies note on page 131 for further details)
Statement of financial position classification of Integrated Energy Services (IES) contracts:
• The Group assesses on a case by case basis the most appropriate balance sheet classification of its Risk Service Contracts, Production Enhancement Contracts and Equity Upstream Investments (see accounting policy notes on page 131)
• In selecting the most appropriate policies for IES contracts the main judgements are as follows: – The Greater Stella Area (GSA) asset is treated in the consolidated
statement of financial position as a financial asset and measured through profit and loss on the basis that there is currently a short-term loan receivable from the consortium partners to fund Petrofac’s share of the field development costs which cannot be converted to a 20% equity share in the GSA licence until the start of production from the field and DECC approval for Petrofac to acquire this interest in the asset. We believe this classification most accurately reflects the risks borne throughout the development of GSA and allows ongoing revaluation to its expected conversion value to property, plant and equipment at the date Petrofac is formally recognised on the licence
– The Mexican PEC assets are classified as tangible oil and gas assets in the consolidated statement of financial position as they have direct exposure to variable field production levels, and indirect exposure to changes in commodity prices. These exposures impact the generation of cash from the assets and any financial return thereon, including the risk of negative financial return. We believe this classification is most appropriate due to the nature of expenditure and it is aligned with our treatment in respect of PSC type arrangements where the risk/reward profile is similar
– The RSCs are treated as a financial asset receivable in the consolidated statement of financial position and measured at fair value through profit and loss – a designation made at inception. This classification is considered most appropriate due to the lower exposure to risk as would typically be the case for a greenfield hydrocarbon development. As such it was determined that classification as property, plant and equipment was not appropriate. We believe this designation also results in more relevant information than the other financial asset categories, as it recognises directly in the income statement any changes in value of the project based on our performance against the key performance indicators in the contract (see accounting policies on page 131). The Group’s only RSC contract has been terminated during the year, refer note 17 for details
Estimation uncertaintyThe key assumptions concerning the future and other key sources of estimation uncertainty at the statement of financial position date that have a significant risk of causing a material adjustment to the carrying amounts of assets and liabilities within the next financial year are discussed below:
• Provisions for liquidated damages claims (LDs): the Group provides for LD claims where there have been significant contract delays and it is considered probable that the customer will successfully pursue such a claim. This requires an estimate of the amount of LDs payable under a claim which involves a number of management judgements and assumptions regarding the amounts to recognise
• Project cost to complete estimates: at each reporting date the Group is required to estimate costs to complete on fixed-price contracts. Estimating costs to complete on such contracts requires the Group to make estimates of future costs to be incurred, based on work to be performed beyond the reporting date. This estimate will impact revenues, cost of sales, work-in-progress, billings in excess of costs and estimated earnings and accrued contract expenses
• Recognition of contract variation orders (VOs): the Group recognises revenues and margins from VOs where it is considered probable that they will be awarded by the customer and this requires management to assess the likelihood of such an award being made by reference to customer communications and other forms of documentary evidence
• Onerous contract provisions: the Group provides for future losses on long-term contracts where it is considered probable that the contract costs are likely to exceed revenues in future years. Estimating these future losses involves a number of assumptions about the achievement of contract performance targets and the likely levels of future cost escalation over time. A provision of US$38m was outstanding at 31 December 2016 (2015: US$71m). See note 31
• Impairment of goodwill: the Group determines whether goodwill is impaired at least on an annual basis. This requires an estimation of the value in use of the cash-generating units to which the goodwill is allocated. Estimating the value in use requires the Group to make an estimate of the expected future cash flows from each cash-generating unit and also to determine a suitable discount rate in order to calculate the present value of those cash flows. The carrying amount of goodwill at 31 December 2016 was US$72m (2015: US$80m). See note 12
• Deferred tax assets: the Group recognises deferred tax assets on all applicable temporary differences where it is probable that future taxable profits will be available for utilisation. This requires management to make judgements and assumptions regarding the amount of deferred tax that can be recognised based on the magnitude and likelihood of future taxable profits. The carrying amount of net deferred tax assets at 31 December 2016 was US$63m (2015: US$80m)
• Income tax: the Company and its subsidiaries are subject to routine tax audits and also a process whereby tax computations are discussed and agreed with the appropriate authorities. Whilst the ultimate outcome of such tax audits and discussions cannot be determined with certainty, management estimates the level of provisions required, for both current and deferred tax, for which it is considered probable will be payable, based on professional advice and consideration of the nature of current discussions with the tax authority concerned
• Recoverable value of property, plant and equipment, intangible oil and gas assets, other intangible assets, available-for-sale investment and other financial assets: the Group determines at each reporting date whether there is any evidence of indicators of impairment in the carrying value of its property, plant and equipment, intangible oil and gas assets, other intangible assets, available-for-sale investment and other financial assets. Where indicators exist, an impairment test is undertaken which requires management to estimate the recoverable value of its assets which is initially based on its value in use. When necessary, fair value less costs of disposal is estimated, for example by reference to quoted market values, similar arm’s length transactions involving these assets or risk adjusted discounted cash flow models. For the following specific assets, certain assumptions and estimates have been made in determining recoverable amounts. Should any changes occur in these assumptions, impairment may be required in future periods: – In relation to impairment testing performed for the Mexican PEC
assets which have a combined carrying value of US$676m at 31 December 2016 (2015: US$642m), the recoverable amount is dependent upon the outcome of ongoing contractual negotiations in respect of the planned migration to PSC type arrangements. Key assumptions include the expected working interest in the PSC and financial and fiscal terms achieved upon migration. For the asset
130 / Petrofac Annual report and accounts 2016

held for sale, an estimate was undertaken in respect of the future contingent consideration amount receivable when determining the recoverable amount for this asset, with key assumptions relating to the terms under which the asset will be migrated to a PSC type arrangement
– The determination of the recoverable amount of the JSD6000 under construction involved assumptions in respect of the remaining capital cost of the project, the ability to secure financial and/or operating partners, forecast long-term market conditions, achievable market share and the timing of re-commencement of construction
– For the PM304 oil and gas asset in Malaysia with a carrying amount of US$286m (2015: US$329m), the recoverable amount was determined with reference to the expected terms under which the current contract will be re-negotiated and extended with the concession holder
In 2016 there were pre-tax impairment charges and fair value re-measurements of US$260m (2015: US$274m) post-tax US$257m (2015: US$254m) which are explained in note 5. The key sources of estimation uncertainty for these tests are consistent with those disclosed in note 5
• Units of production depreciation: estimated proven plus probable reserves are used in determining the depreciation of oil and gas assets such that the depreciation charge is proportional to the depletion of the remaining reserves over the shorter of: life of the field or the end of the respective licence/concession period. These calculations require the use of estimates including the amount of economically recoverable reserves and future oil and gas capital expenditure
• Decommissioning costs: the recognition and measurement of decommissioning provisions involves the use of estimates and assumptions which include the existence of an obligation to dismantle and remove a facility or restore the site on which it is located, the appropriate discount and inflation rates to use in determining the net present value of the liability, the estimated costs of decommissioning based on internal and external estimates and the payment dates for expected decommissioning costs. As a result, actual costs could differ from estimated cost estimates used to provide for decommissioning obligations. The provision for decommissioning at 31 December 2016 of US$116m (2015: US$230m) represents management’s best estimate of the present value of the future decommissioning costs required
Revenue recognitionRevenue is recognised to the extent that it is probable economic benefits will flow to the Group and the revenue can be reliably measured. The following specific recognition criteria also apply:
Engineering & Construction (E&C)Revenues from fixed-price lump-sum contracts are recognised using the percentage-of-completion method, based on surveys of work performed once the outcome of a contract can be estimated reliably. In the early stages of contract completion, when the outcome of a contract cannot be estimated reliably, contract revenues are recognised only to the extent of costs incurred that are expected to be recoverable.
Revenues from cost-plus-fee contracts are recognised on the basis of costs incurred during the year plus the fee earned measured by the cost-to-cost method.
Revenues from reimbursable contracts are recognised in the period in which the services are provided based on the agreed contract schedule of rates.
Provision is made for all losses expected to arise on completion of contracts entered into at the reporting date, whether or not work has commenced on these contracts.
Incentive payments are included in revenue when the contract is sufficiently advanced that it is probable that the specified performance standards will be met or exceeded and the amount of the incentive
payments can be measured reliably. Variation orders are only included in revenue when it is probable they will be accepted and can be measured reliably and claims are only included in revenue when negotiations have reached an advanced stage such that it is probable that the claim will be accepted and can be measured reliably.
Engineering & Production Services (EPS)Revenues from reimbursable contracts are recognised in the period in which the services are provided based on the agreed contract schedule of rates.
Revenues from fixed-price contracts are recognised on the percentage-of-completion method, measured by milestones completed or earned value once the outcome of a contract can be estimated reliably. In the early stages of contract completion, when the outcome of a contract cannot be estimated reliably, contract revenues are recognised only to the extent of costs incurred that are expected to be recoverable.
Incentive payments are included in revenue when the contract is sufficiently advanced that it is probable that the specified performance standards will be met or exceeded and the amount of the incentive payments can be measured reliably. Claims are only included in revenue when negotiations have reached an advanced stage such that it is probable the claim will be accepted and can be measured reliably.
Integrated Energy Services (IES)Equity Upstream InvestmentsOil and gas revenues comprise the Group’s share of sales from the processing or sale of hydrocarbons from the Group’s Equity Upstream Investments on an entitlement basis, when the significant risks and rewards of ownership have been passed to the buyer.
Production Enhancement Contracts (PEC)Revenue from Production Enhancement Contracts is recognised based on the volume of hydrocarbons produced in the period and the agreed tariff and the reimbursement arrangement for costs incurred.
Risk Services Contracts (RSC)Revenue from the Risk Services Contracts is recognised as follows:
• The construction services element of the RSC is accounted for using a percentage-of-completion method at the end of the reporting period measured on the basis of the extent of the schedule of work completed to date. Due to uncertainties about the eventual financial outcome of the construction work no margin is recognised in the early stages of the construction and revenues are only recognised to the extent of costs until the outcome can be estimated reliably
• The operation and management activities revenues/margins are recognised on a proportionate basis over the life of the contract on the basis of the level of operating expenditure incurred each year
• The total remuneration fee is a multiple of the estimated capital expenditure (control budget agreed with the customer) with this multiple designed to deliver the contractor’s internal rate of return which is determined by the contractor’s performance against a matrix of KPIs, which include actual cost of field development vs control budget set, the time taken to achieve first gas from the field and the timing of final project completion
• Payment of cost recovery commences from first oil/gas in equal quarterly instalments over the contract period and payment of the remuneration fee commences from the quarter following completion of the construction phase of the project and concludes at the end of the RSC term. These receivable amounts under the RSC are classified as a financial asset at fair value through profit or loss as the contract is managed and the performance evaluated by management on a fair value basis. For measurement purposes, fair value principles are applied to calculate the present value of earned remuneration under the contract by discounting back to present value and then splitting between due within one year and long-term receivables within other financial assets (see note 17 on page 152)
Petrofac Annual report and accounts 2016 / 131
Financial statem
ents

Notes to the consolidated financial statements continuedFor the year ended 31 December 2016
2 Summary of significant accounting policies continued
Property, plant and equipmentProperty, plant and equipment is stated at cost less accumulated depreciation and any impairment in value. Cost comprises the purchase price or construction cost and any costs directly attributable to making that asset capable of operating as intended. The purchase price or construction cost is the aggregate amount paid and the fair value of any other consideration given to acquire the asset. Depreciation is provided on a straight-line basis, other than on oil and gas assets, at the following rates:
Oil and gas facilities 10% – 12.5%Plant and equipment 4% – 33%Buildings and leasehold improvements 5% – 33% (or lease term if shorter)Office furniture and equipment 25% – 50%Vehicles 20% – 33%
Tangible oil and gas assets are depreciated, on a field-by-field basis, using the unit-of-production method based on entitlement to proven and probable reserves, taking account of estimated future development expenditure relating to those reserves; refer to page 47 for life of these fields.
Each asset’s estimated useful life, residual value and method of depreciation are reviewed and adjusted if appropriate at each financial year end.
No depreciation is charged on land or assets under construction.
The carrying amount of an item of property, plant and equipment is derecognised on disposal or when no future economic benefits are expected from its use or disposal. The gain or loss arising from the de-recognition of an item of property, plant and equipment is included in the consolidated income statement when the item is derecognised. Gains are not classified as revenue.
Borrowing costsBorrowing costs directly attributable to the construction of qualifying assets, which are assets that necessarily take a substantial period of time to prepare for their intended use, are added to the cost of those assets, until such time as the assets are substantially ready for their intended use. All other borrowing costs are recognised as interest payable in the consolidated income statement in the period in which they are incurred.
Intangible assets – non oil and gas assetsIntangible assets acquired in a business combination are initially measured at cost being their fair values at the date of acquisition and are recognised separately from goodwill where the asset is separable or arises from a contractual or other legal right and its fair value can be measured reliably. After initial recognition, intangible assets are carried at cost less accumulated amortisation and any accumulated impairment losses. Intangible assets with a finite life are amortised over their useful economic life using a straight-line method unless a better method reflecting the pattern in which the asset’s future economic benefits are expected to be consumed can be determined. The amortisation charge in respect of intangible assets is included in the selling, general and administration expenses line of the consolidated income statement. The expected useful lives of assets are reviewed on an annual basis. Any change in the useful life or pattern of consumption of the intangible asset is treated as a change in accounting estimate and is accounted for prospectively by changing the amortisation period or method. Intangible assets are tested for impairment whenever there is an indication that the asset may be impaired.
Oil and gas assetsCapitalised costsThe Group’s activities in relation to oil and gas assets are limited to assets in the evaluation, development and production phases.
Oil and gas evaluation and development expenditure is accounted for using the successful efforts method of accounting.
Evaluation expendituresExpenditure directly associated with evaluation (or appraisal) activities is capitalised as an intangible oil and gas asset. Such costs include the costs of acquiring an interest, appraisal well drilling costs, payments to contractors and an appropriate share of directly attributable overheads incurred during the evaluation phase. For such appraisal activity, which may require drilling of further wells, costs continue to be carried as an asset whilst related hydrocarbons are considered capable of commercial development. Such costs are subject to technical, commercial and management review to confirm the continued intent to develop, or otherwise extract value. When this is no longer the case, the costs are written-off in the consolidated income statement. When such assets are declared part of a commercial development, related costs are transferred to tangible oil and gas assets. All intangible oil and gas assets are assessed for any impairment prior to transfer and any impairment loss is recognised in the consolidated income statement.
Development expendituresExpenditures relating to development of assets which includes the construction, installation and completion of infrastructure facilities such as platforms, pipelines and vessels are capitalised within property, plant and equipment as oil and gas facilities. Expenditures relating to the drilling and completion of production wells are capitalised within property, plant and equipment as oil and gas assets.
Changes in unit-of-production factorsChanges in factors which affect unit-of-production calculations are dealt with prospectively in accordance with the treatment of changes in accounting estimates, not by immediate adjustment of prior years’ amounts.
DecommissioningProvision for future decommissioning costs is made in full when the Group has an obligation to dismantle and remove a facility or an item of plant and to restore the site on which it is located, and when a reasonable estimate of that liability can be made. The amount recognised is the present value of the estimated future expenditure. An amount equivalent to the discounted initial provision for decommissioning costs is capitalised and amortised over the life of the underlying asset on a unit-of-production basis over proven and probable reserves. Any change in the present value of the estimated expenditure is reflected as an adjustment to the provision and the oil and gas asset.
The unwinding of the discount applied to future decommissioning provisions is included under finance costs in the consolidated income statement.
Impairment of assets (excluding goodwill)At each reporting date, the Group reviews the carrying amounts of its tangible and intangible assets to assess whether there is an indication that those assets may be impaired. If any such indication exists, the Group makes an estimate of the asset’s recoverable amount. An asset’s recoverable amount is the higher of its fair value less costs of disposal and its value in use. In assessing value in use, the estimated future cash flows attributable to the asset are discounted to their present value using a pre-tax discount rate that reflects current market assessments of the time value of money and the risks specific to the asset. Fair value less costs of disposal is based on the risk-adjusted discounted cash flow models and includes value attributable to contingent resources. A post-tax discount rate is used in such calculations.
132 / Petrofac Annual report and accounts 2016

If the recoverable amount of an asset is estimated to be less than its carrying amount, the carrying amount of the asset is reduced to its recoverable amount. An impairment loss is recognised immediately in the consolidated income statement, unless the relevant asset is carried at a revalued amount, in which case the impairment loss is treated as a revaluation decrease.
Where an impairment loss subsequently reverses, the carrying amount of the asset is increased to the revised estimate of its recoverable amount, but so that the increased carrying amount does not exceed the carrying amount that would have been determined had no impairment loss been recognised for the asset in prior years. A reversal of an impairment loss is recognised immediately in the consolidated income statement, unless the relevant asset is carried at a revalued amount, in which case the reversal of the impairment is treated as a revaluation increase.
Non-current assets held for saleNon-current assets or disposal groups are classified as held for sale when it is expected that the carrying amount of an asset will be recovered principally through sale rather than continuing use. Assets are not depreciated when classified as held for sale.
InventoriesInventories are valued at the lower of cost and net realisable value. Net realisable value is the estimated selling price in the ordinary course of business, less estimated costs of completion and the estimated costs necessary to make the sale. Cost comprises purchase price, cost of production, transportation and other directly allocable expenses. Costs of inventories, other than raw materials, are determined using the first-in-first-out method. Costs of raw materials are determined using the weighted average method.
Work in progress and billings in excess of cost and estimated earningsFixed-price-lump sum engineering, procurement and construction contracts are presented in the consolidated statement of financial position as follows:
• For each contract, the accumulated cost incurred, as well as the estimated earnings recognised at the contract’s percentage-of-completion less provision for any anticipated losses, after deducting the progress payments received or receivable from the customers, are shown in current assets in the consolidated statement of financial position under ‘work in progress’
• Where the payments received or receivable for any contract exceed the cost and estimated earnings less provision for any anticipated losses, the excess is shown as ‘billings in excess of cost and estimated earnings’ within current liabilities
Trade and other receivablesTrade receivables are recognised and carried at original invoice amount less an allowance for any amounts estimated to be uncollectable. An estimate for doubtful debts is made when there is objective evidence that the collection of the full amount is no longer probable under the terms of the original invoice. Impaired debts are derecognised when they are assessed as uncollectable.
Pre-contract/bid costsPre-contract/bid costs incurred are recognised as an expense until there is a high probability that the contract will be awarded, after which all further costs are recognised as assets and expensed over the life of the contract.
Cash and cash equivalentsCash and cash equivalents consist of cash at bank and in hand and short-term deposits with an original maturity of three months or less. For the purpose of the cash flow statement, cash and cash equivalents consists of cash and cash equivalents as defined above, net of outstanding bank overdrafts.
ProvisionsProvisions are recognised when the Group has a present legal or constructive obligation as a result of past events, it is probable that an outflow of resources will be required to settle the obligation and a reliable estimate can be made of the amount of the obligation. If the time value of money is material, provisions are discounted using a current pre-tax rate that reflects, where appropriate, the risks specific to the liability. Where discounting is used, the increase in the provision due to the passage of time is recognised in the consolidated income statement as a finance cost.
Fair value measurementThe Group measures financial instruments, such as derivatives, receivable from customer under Berantai RSC, available-for-sale investment and amounts receivable in respect of the development of the Greater Stella Area, at fair value at each reporting date. Fair value related disclosures for financial instruments are disclosed in note 17.
Fair value is the price that would be received to sell an asset or paid to transfer a liability in an orderly transaction between market participants at the measurement date. The fair value measurement is based on the presumption that the transaction to sell the asset or transfer the liability takes place either:
• In the principal market for the asset or liability, or• In the absence of a principal market, in the most advantageous market
for the asset or liability
The principal or the most advantageous market must be accessible by the Group.
The fair value of an asset or a liability is measured using the assumptions that market participants would use when pricing the asset or liability, assuming that market participants act in their economic best interest.
A fair value measurement of a non-financial asset takes into account a market participant’s ability to generate economic benefits by using the asset in its highest and best use or by selling it to another market participant that would use the asset in its highest and best use.
The Group uses valuation techniques that are appropriate in the circumstances and for which sufficient data is available to measure fair value, maximising the use of relevant observable inputs and minimising the use of unobservable inputs.
All assets and liabilities for which fair value is measured or disclosed in the financial statements are categorised within the fair value hierarchy, described as follows, based on the lowest level input that is significant to the fair value measurement as a whole:
• Level 1 – Quoted (unadjusted) market prices in active markets for identical assets or liabilities
• Level 2 – Valuation techniques for which the lowest level input that is significant to the fair value measurement is directly or indirectly observable
• Level 3 – Valuation techniques for which the lowest level input that is significant to the fair value measurement is unobservable
For assets and liabilities that are recognised in the consolidated financial statements on a recurring basis, the Group determines whether transfers have occurred between levels in the hierarchy by re-assessing categorisation (based on the lowest level input that is significant to the fair value measurement as a whole) at the end of each reporting period.
For the purpose of fair value disclosures, the Group has determined classes of assets and liabilities on the basis of the nature, characteristics and risks of the asset or liability and the level of the fair value hierarchy as explained above.
Petrofac Annual report and accounts 2016 / 133
Financial statem
ents

Notes to the consolidated financial statements continuedFor the year ended 31 December 2016
2 Summary of significant accounting policies continued
Financial assetsInitial recognition and measurementFinancial assets are classified, at initial recognition, as financial assets at fair value through profit or loss, loans and receivables, held-to-maturity investments, available-for-sale investments, or as derivatives designated as hedging instruments in an effective hedge, as appropriate. All financial assets are recognised initially at fair value plus, in the case of financial assets not recorded at fair value through profit or loss, transaction costs that are attributable to the acquisition of the financial asset.
Subsequent measurementFor purposes of subsequent measurement financial assets are classified in the following categories:
• Financial assets at fair value through profit or loss• Loans and receivables• Available-for-sale investments
Financial assets at fair value through profit or lossFinancial assets at fair value through profit or loss include financial assets held for trading and financial assets designated upon initial recognition at fair value through profit or loss. Financial assets are classified as held for trading if they are acquired for the purpose of selling or repurchasing in the near term. Derivatives, including separated embedded derivatives, are also classified as held for trading unless they are designated as effective hedging instruments as defined by IAS 39. Financial assets at fair value through profit or loss are carried in the consolidated statement of financial position at fair value with net changes in fair value reported in the consolidated income statement.
The fair value changes to undesignated forward currency contracts are reported within other operating income/expenses. The fair value changes relating to the internal rate of return under the Berantai RSC receivable are recognised as revenue whereas the unwinding of discount was reported as finance income until the year ended 31 December 2015. As a result of the cessation of the contract the unwinding of the discount is included in exceptional items (note 5). Negative fair value changes on the Berantai RSC as a result of changes in the expected recovery of the receivable and negative fair value changes to the amounts receivable in respect of the development of the Greater Stella Area are recorded as an exceptional item in the consolidated income statement, see note 5.
Loans and receivablesLoans and receivables are non-derivative financial assets with fixed or determinable payments that are not quoted in an active market. After initial measurement, such financial assets are subsequently measured at amortised cost using the effective interest rate (EIR) method, less impairment. Amortised cost is calculated by taking into account any discount or premium on acquisition and fees or costs that are an integral part of the EIR. The EIR amortisation is included in finance income in the consolidated income statement. This category generally applies to trade and other receivables.
Available-for-sale (AFS) investmentsAFS investments include equity investments. Equity investments classified as AFS are those that are neither classified as held-for-trading nor designated at fair value through profit or loss.
After initial measurement, AFS financial assets are subsequently measured at fair value with unrealised gains or losses recognised in other comprehensive income and credited in the available-for-sale reserve until the investment is derecognised, at which time the cumulative gain or loss is recognised in the consolidated income statement within other operating income/expenses, or the investment is determined to be impaired, when the cumulative loss is reclassified from the AFS reserve to the consolidated income statement in other operating income/expenses.
Financial liabilitiesInitial recognition and measurementFinancial liabilities are classified, at initial recognition, as financial liabilities at fair value through profit or loss, loans and borrowings, payables, or as derivatives designated as hedging instruments in an effective hedge, as appropriate.
All financial liabilities are recognised initially at fair value and, in the case of loans and borrowings and payables, net of directly attributable transaction costs.
The Group’s financial liabilities include trade and other payables, loans and borrowings including bank overdrafts, financial guarantee contracts and derivative financial instruments.
Subsequent measurementFor purposes of subsequent measurement financial liabilities are classified in the following categories:
• Financial liabilities at fair value through profit or loss• Loans and borrowings
Financial liabilities at fair value through profit or lossFinancial liabilities at fair value through profit or loss include financial liabilities held for trading and financial liabilities designated upon initial recognition as at fair value through profit or loss.
Financial liabilities are classified as held for trading if they are incurred for the purpose of repurchasing in the near term. This category also includes derivative financial instruments entered into by the Group that are not designated as hedging instruments in hedge relationships as defined by IAS 39. Separated embedded derivatives are also classified as held for trading unless they are designated as effective hedging instruments.
Gains or losses on liabilities held for trading are recognised in the consolidated income statement.
Financial liabilities designated upon initial recognition at fair value through profit or loss are designated at the initial date of recognition, and only if the criteria in IAS 39 are satisfied. The Group has not designated any financial liability as at fair value through profit or loss.
Loans and borrowingsThis is the category most relevant to the Group. After initial recognition, interest-bearing loans and borrowings are subsequently measured at amortised cost using the EIR method. Gains and losses are recognised in profit or loss when the liabilities are derecognised as well as through the EIR amortisation process.
Amortised cost is calculated by taking into account any discount or premium on acquisition and fees or costs that are an integral part of the EIR. The EIR amortisation is included as finance costs in the consolidated income statement.
This category generally applies to interest-bearing loans and borrowings. For more information, refer to note 26.
De-recognition of financial assets and liabilitiesFinancial assetsA financial asset (or, where applicable, a part of a financial asset) is de-recognised where:
• The rights to receive cash flows from the asset have expired• The Group retains the right to receive cash flows from the asset, but
has assumed an obligation to pay them in full without material delay to a third party under a ‘pass-through’ arrangement; or
• The Group has transferred its rights to receive cash flows from the asset and either (a) has transferred substantially all the risks and rewards of the asset, or (b) has neither transferred nor retained substantially all the risks and rewards of the asset, but has transferred control of the asset
134 / Petrofac Annual report and accounts 2016

Financial liabilitiesA financial liability is de-recognised when the obligation under the liability is discharged or cancelled or expires.
If an existing financial liability is replaced by another from the same lender, on substantially different terms, or the terms of an existing liability are substantially modified, such an exchange or modification is treated as a de-recognition of the original liability and the recognition of a new liability such that the difference in the respective carrying amounts together with any costs or fees incurred are recognised in the consolidated income statement.
Offsetting of financial instrumentsFinancial assets and financial liabilities are offset and the net amount is reported in the consolidated statement of financial position if there is a currently enforceable legal right to offset the recognised amounts and there is an intention to settle on a net basis, to realise the assets and settle the liabilities simultaneously.
Derivative financial instruments and hedgingThe Group uses derivative financial instruments such as forward currency contracts and oil price collars and forward contracts to hedge its risks associated with foreign currency and oil price fluctuations. Such derivative financial instruments are initially recognised at fair value on the date on which a derivative contract is entered into and are subsequently re-measured at fair value. Derivatives are carried as assets when the fair value is positive and as liabilities when the fair value is negative.
Any gains or losses arising from changes in the fair value of derivatives that do not qualify for hedge accounting are taken to the consolidated income statement.
The fair value of forward currency contracts is calculated by reference to current forward exchange rates for contracts with similar maturity profiles. The fair value of oil price collar contracts is determined by reference to market values for similar instruments.
For the purposes of hedge accounting, hedges are classified as:
• Fair value hedges when hedging the exposure to changes in the fair value of a recognised asset or liability; or
• Cash flow hedges when hedging exposure to variability in cash flows that is either attributable to a particular risk associated with a recognised asset or liability or a highly probable forecast transaction
The Group formally designates and documents the relationship between the hedging instrument and the hedged item at the inception of the transaction, as well as its risk management objectives and strategy for undertaking various hedge transactions. The documentation also includes identification of the hedging instrument, the hedged item or transaction, the nature of risk being hedged and how the Group will assess the hedging instrument’s effectiveness in offsetting the exposure to changes in the hedged item’s fair value or cash flows attributable to the hedged risk. The Group also documents its assessment, both at hedge inception and on an ongoing basis, of whether the derivatives that are used in the hedging transactions are highly effective in offsetting changes in fair values or cash flows of the hedged items.
The treatment of gains and losses arising from revaluing derivatives designated as hedging instruments depends on the nature of the hedging relationship, as follows:
Cash flow hedgesFor cash flow hedges, the effective portion of the gain or loss on the hedging instrument is recognised directly in other comprehensive income in net unrealised gains/(losses) on derivatives, while the ineffective portion is recognised in the consolidated income statement. Amounts taken to other comprehensive income are transferred to the consolidated income statement when the hedged transaction affects the consolidated income statement. The material forward rate movements in the Kuwaiti
dinar forward currency contracts are recorded as an exceptional item in the consolidated income statement.
If the hedging instrument expires or is sold, terminated or exercised without replacement or rollover, or if its designation as a hedge is revoked, any cumulative gain or loss previously recognised in other comprehensive income remains separately in equity until the forecast transaction occurs and affects the consolidated income statement. When a forecast transaction is no longer expected to occur, the cumulative gain or loss that was reported in other comprehensive income is immediately transferred to the consolidated income statement.
Embedded derivativesContracts are assessed for the existence of embedded derivatives at the date that the Group first becomes party to the contract, with reassessment only if there is a change to the contract that significantly modifies the cash flows. Embedded derivatives which are not clearly and closely related to the underlying asset, liability or transaction are separated and accounted for as standalone derivatives.
Petrofac Employee Benefit TrustsThe Petrofac Employee Benefit Trust and the Petrofac Joint Venture Companies Employee Benefit Trust warehouse ordinary shares purchased to satisfy various new share scheme awards made to the employees of the Company and its joint venture partner employees, which will be transferred to the members of the schemes on their respective vesting dates subject to satisfying any performance conditions of each scheme. The trusts continue to be included in the Group financial statements under IFRS 10.
Treasury sharesFor the purpose of making awards under the Group’s employee share schemes, shares in the Company are purchased and held by the Petrofac Employee Benefit Trust and the Petrofac Joint Venture Companies Employee Benefit Trust. All these shares have been classified in the statement of financial position as treasury shares within equity. Shares vested during the year are satisfied with these shares.
Share-based payment transactionsEmployees (including Directors) of the Group receive remuneration in the form of share-based payment transactions, whereby employees render services in exchange for shares or rights over shares (‘equity-settled transactions’).
Equity-settled transactionsThe cost of equity-settled transactions with employees is measured by reference to the fair value at the date on which they are granted. In valuing equity-settled transactions, no account is taken of any service or performance conditions, other than conditions linked to the price of the shares of Petrofac Limited (‘market conditions’), if applicable.
The cost of equity-settled transactions is recognised, together with a corresponding increase in equity, over the period in which the relevant employees become fully entitled to the award (the ‘vesting period’). The cumulative expense recognised for equity-settled transactions at each reporting date until the vesting date reflects the extent to which the vesting period has expired and the Group’s best estimate of the number of equity instruments that will ultimately vest. The income statement charge or credit for a period represents the movement in cumulative expense recognised as at the beginning and end of that period.
No expense is recognised for awards that do not ultimately vest, except for awards where vesting is conditional upon a market or non-vesting condition, which are treated as vesting irrespective of whether or not the market or non-vesting condition is satisfied, provided that all other performance conditions and service conditions are satisfied. Equity awards cancelled are treated as vesting immediately on the date of cancellation, and any expense not recognised for the award at that date is recognised in the consolidated income statement.
Petrofac Annual report and accounts 2016 / 135
Financial statem
ents

Notes to the consolidated financial statements continuedFor the year ended 31 December 2016
2 Summary of significant accounting policies continued
Pensions and other long-term employment benefitsThe Group has various defined contribution pension schemes in accordance with the local conditions and practices in the countries in which it operates. The amount charged to the consolidated income statement in respect of pension costs reflects the contributions payable in the year. Differences between contributions payable during the year and contributions actually paid are shown as either accrued liabilities or prepaid assets in the consolidated statement of financial position.
The Group’s other long-term employment benefits are provided in accordance with the labour laws of the countries in which the Group operates, further details of which are given in note 27.
Income taxesIncome tax expense represents the sum of current income tax and deferred tax.
Current income tax assets and liabilities for the current and prior periods are measured at the amount expected to be recovered from, or paid to the taxation authorities. Taxable profit differs from profit as reported in the consolidated income statement because it excludes items of income or expense that are taxable or deductible in other years and it further excludes items that are never taxable or deductible. The Group’s liability for current tax is calculated using tax rates that have been enacted or substantively enacted by the statement of financial position date.
Deferred tax is recognised on all temporary differences at the statement of financial position date between the carrying amounts of assets and liabilities in the financial statements and the corresponding tax bases used in the computation of taxable profit, with the following exceptions:
• Where the temporary difference arises from the initial recognition of goodwill or of an asset or liability in a transaction that is not a business combination that at the time of the transaction affects neither accounting nor taxable profit or loss
• In respect of taxable temporary differences associated with investments in subsidiaries, associates and joint ventures, where the timing of reversal of the temporary differences can be controlled and it is probable that the temporary differences will not reverse in the foreseeable future; and
• Deferred tax assets are recognised only to the extent that it is probable that a taxable profit will be available against which the deductible temporary differences carried forward tax credits or tax losses can be utilised
The carrying amount of deferred tax assets is reviewed at each statement of financial position date and reduced to the extent that it is no longer probable that sufficient taxable profit will be available to allow all or part of the deferred tax assets to be utilised. Unrecognised deferred tax assets are reassessed at each statement of financial position date and are recognised to the extent that it has become probable that future taxable profit will allow the deferred tax asset to be recovered.
Deferred tax assets and liabilities are measured on an undiscounted basis at the tax rates that are expected to apply when the asset is realised or the liability is settled, based on tax rates and tax laws enacted or substantively enacted at the statement of financial position date.
Current and deferred tax is charged or credited directly to other comprehensive income or equity if it relates to items that are credited or charged to, respectively, other comprehensive income or equity. Otherwise, income tax is recognised in the consolidated income statement.
LeasesThe determination of whether an arrangement is or contains a lease is based on the substance of the arrangement at inception date and whether the fulfilment of the arrangement is dependent on the use of a specific asset or assets or the arrangement conveys the right to use the asset.
Leases are classified as finance leases whenever the terms of the lease transfer substantially all the risks and rewards of ownership to the lessee. All other leases are classified as operating leases.
Assets held under finance leases are recognised as non-current assets of the Group at the lower of their fair value at the date of commencement of the lease and the present value of the minimum lease payments. These assets are depreciated on a straight-line basis over the shorter of the useful life of the asset and the lease term. The corresponding liability to the lessor is included in the consolidated statement of financial position as a finance lease obligation. Lease payments are apportioned between finance costs in the consolidated income statement and reduction of the lease obligation so as to achieve a constant rate of interest on the remaining balance of the liability. The Group has entered into various operating leases the payments for which are recognised as an expense in the consolidated income statement on a straight-line basis over the lease terms.
136 / Petrofac Annual report and accounts 2016

3 Segment information
With effect from 1 January 2016, the Group was reorganised to deliver its services through three reporting segments: Engineering & Construction, Engineering & Production Services and Integrated Energy Services. As a result the segment information has been realigned to fit the new Group organisational structure which now comprises the following three reporting segments:
• Engineering & Construction (E&C), which provides lump-sum engineering, procurement and construction project execution services to the onshore and offshore oil and gas industry
• Engineering & Production Services (EPS), which includes all reimbursable engineering and production services activities to the oil and gas industry• Integrated Energy Services (IES), business focused on delivering value from the existing asset portfolio
Management separately monitors the trading results of its three reporting segments for the purpose of making an assessment of their performance and for making decisions about how resources are allocated. Interest costs and income arising from borrowings and cash balances which are not directly attributable to individual operating segments are allocated to Corporate rather than allocated to individual segments. In addition, certain shareholder services related overheads, intra-group financing and consolidation adjustments are managed at a corporate level and are not allocated to reporting segments.
The presentation of the Group results below also separately identifies the effect of the Laggan-Tormore loss, asset impairments, certain re-measurements, restructuring and redundancy costs, contract migration costs, material deferred tax movements arising due to foreign exchange differences in jurisdictions where tax is computed based on the functional currency of the country, material forward rate movements in Kuwaiti dinar forward currency contracts and net costs relating to the cessation of the Berantai RSC contract. Results excluding these exceptional items and certain re-measurements are used by management and presented in order to provide readers with a clear and consistent presentation of the underlying operating performance of the business.
The following tables represent revenue and profit/(loss) information relating to the Group’s reporting segments for the year ended 31 December 2016 and the comparative segmental information has been restated to reflect the revised Group organisational structure.
Year ended 31 December 2016
Engineering & Construction
US$m
Engineering & Production
Services US$m
Integrated Energy
Services US$m
Corporate & others
US$m
Consolidation adjustments &
eliminations US$m
Business performance
US$m
Exceptional items and certain re-measurements
US$mTotal
US$m
RevenueExternal sales 5,895 1,707 271 – – 7,873 – 7,873Inter-segment sales 33 18 – – (51) – – –Total revenue 5,928 1,725 271 – (51) 7,873 – 7,873 Segment results 520 132 (35) 12 (1) 628 (322) 306Laggan-Tormore loss1 (101) – – – – (101) – (101)Unallocated corporate costs – – – (19) – (19) – (19)Profit/(loss) before tax and finance income/(costs) 419 132 (35) (7) (1) 508 (322) 186Share of profits ofassociates/joint ventures – 1 7 – – 8 4 12Finance costs – – (44) (57) – (101) – (101)Finance income – – – 3 – 3 – 3Profit/(loss) before income tax 419 133 (72) (61) (1) 418 (318) 100Income tax (expense)/credit (95) (22) 30 2 – (85) (1) (86)Non-controlling interests (13) – – – – (13) – (13)Profit/(loss) for the year attributable to Petrofac Limited shareholders 311 111 (42) (59) (1) 320 (319) 1EBITDA2 463 140 99 2 – 704
1 The Laggan-Tormore loss for the year comprises application of liquidated damages of US$80m and cost overruns of US$21m agreed as part of the final commercial settlement with our client in respect of the project.
2 Earnings before interest, tax, depreciation and amortisation.
Petrofac Annual report and accounts 2016 / 137
Financial statem
ents

Notes to the consolidated financial statements continuedFor the year ended 31 December 2016
3 Segment information continued
Engineering & Construction
US$m
Engineering & Production
Services US$m
Integrated Energy
Services US$m
Corporate & others
US$m
Consolidation adjustments &
eliminations US$m
Total US$m
Other segment informationCapital expenditures:Property, plant and equipment (note 10) 122 1 15 5 – 143Intangible oil and gas assets (note 14) – – *(8) – – (8)
Charges:Depreciation 44 5 123 9 1 182Amortisation and write off – 2 4 – – 6Exceptional items and certain re-measurements (pre-tax) 35 4 272 7 – 318Other long-term employment benefits 22 2 – – – 24Share-based payments 15 1 1 – – 17
* Negative capital expenditure includes reversal of excess accruals of US$11m in the current year (note 14).
Year ended 31 December 2015 (restated)
Engineering & Construction
US$m
Engineering & Production
Services US$m
Integrated Energy
Services US$m
Corporate & others
US$m
Consolidation adjustments &
eliminations US$m
Business performance
US$m
Exceptional items and certain re-measurements
US$mTotal
US$m
RevenueExternal sales 4,806 1,659 379 – – 6,844 – 6,844Inter-segment sales 15 80 – – (95) – – –Total revenue 4,821 1,739 379 – (95) 6,844 – 6,844
Segment results 492 66 36 7 (1) 600 (354) 246Laggan-Tormore loss (480) – – – – (480) – (480)Unallocated corporate costs – – – (18) – (18) – (18)Profit/(loss) before tax and finance income/(costs) 12 66 36 (11) (1) 102 (354) (252)Share of profits/(losses) of associates/joint ventures – 2 8 – – 10 (1) 9Finance costs – – (53) (48) – (101) – (101)Finance income – – 8 1 – 9 – 9Profit/(loss) before income tax 12 68 (1) (58) (1) 20 (355) (335)Income tax (expense)/credit (57) (10) 8 4 – (55) (3) (58)Laggan-Tormore tax relief 49 – – – – 49 – 49Non-controlling interests (5) – – – – (5) – (5)Profit/(loss) for the year attributable to Petrofac Limited shareholders (1) 58 7 (54) (1) 9 (358) (349)EBITDA1 60 88 166 (2) – 312
1 Earnings before interest, tax, depreciation and amortisation.
138 / Petrofac Annual report and accounts 2016

Engineering & Construction
US$m
Engineering & Production
Services US$m
Integrated Energy
Services US$m
Corporate & others
US$m
Consolidation adjustments &
eliminations US$m
Total US$m
Other segment informationCapital expenditures:Property, plant and equipment (note 10) 160 4 93 3 – 260Intangible oil and gas assets (note 14) – – 10 – – 10
Charges:Depreciation 48 17 121 9 1 196Amortisation and write off – 3 1 – – 4Exceptional items and certain re-measurements (pre-tax) 5 28 322 – – 355Other long-term employment benefits 20 2 – – – 22Share-based payments 16 4 1 2 – 23
Geographical segmentsThe following tables present revenue from external customers based on their location and non-current assets by geographical segments for the years ended 31 December 2016 and 2015.
Year ended 31 December 2016
Kuwait US$m
Oman US$m
United Arab Emirates
US$m
United Kingdom
US$mSaudi Arabia
US$m AlgeriaUS$m
Malaysia US$m
Other countries
US$mConsolidated
US$m
Revenues from external customers 2,185 1,477 1,326 668 798 463 357 599 7,873
United Kingdom
US$m
United Arab Emirates
US$mMexico US$m
Malaysia US$m
Tunisia US$m
Singapore US$m
Other countries
US$mConsolidated
US$m
Non-current assets:Property, plant and equipment 22 507 336 456 51 20 26 1,418Intangible oil and gas assets 11 – – 68 1 – – 80Other intangible assets 2 – 14 – – – – 16Goodwill 40 29 – 3 – – – 72
Year ended 31 December 2015
Oman US$m
United Arab Emirates
US$mAlgeria US$m
United Kingdom
US$mKuwait US$m
Malaysia US$m
Saudi Arabia US$m
Other countries
US$mConsolidated
US$m
Revenues from external customers 1,408 1,395 833 804 555 520 332 997 6,844
United Kingdom
US$m
United Arab Emirates
US$mMexico US$m
Romania US$m
Malaysia US$m
Tunisia US$m
Other countries
US$mConsolidated
US$m
Non-current assets:Property, plant and equipment 34 426 489 – 736 52 38 1,775Intangible oil and gas assets 11 – – – 74 1 – 86Other intangible assets 4 – 17 – – – – 21Goodwill 48 29 – – 3 – – 80
Revenues disclosed in the above tables are based on where the project is located. Revenues representing greater than 10% of Group revenues arose from two customers amounting to US$1,967m in the Engineering & Construction segment (2015: two customers, US$1,515m in the Engineering & Construction segment, formerly Onshore Engineering & Construction segment).
Petrofac Annual report and accounts 2016 / 139
Financial statem
ents
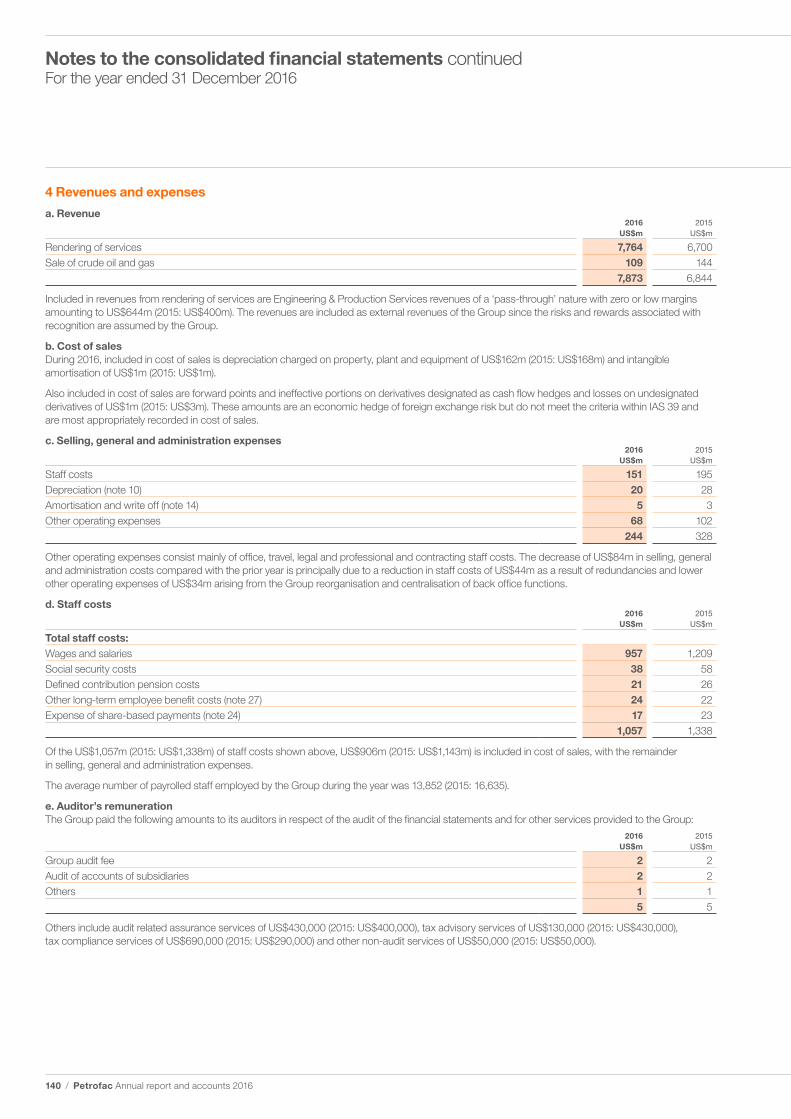
Notes to the consolidated financial statements continuedFor the year ended 31 December 2016
4 Revenues and expenses
a. Revenue2016
US$m2015
US$m
Rendering of services 7,764 6,700Sale of crude oil and gas 109 144
7,873 6,844
Included in revenues from rendering of services are Engineering & Production Services revenues of a ‘pass-through’ nature with zero or low margins amounting to US$644m (2015: US$400m). The revenues are included as external revenues of the Group since the risks and rewards associated with recognition are assumed by the Group.
b. Cost of salesDuring 2016, included in cost of sales is depreciation charged on property, plant and equipment of US$162m (2015: US$168m) and intangible amortisation of US$1m (2015: US$1m).
Also included in cost of sales are forward points and ineffective portions on derivatives designated as cash flow hedges and losses on undesignated derivatives of US$1m (2015: US$3m). These amounts are an economic hedge of foreign exchange risk but do not meet the criteria within IAS 39 and are most appropriately recorded in cost of sales.
c. Selling, general and administration expenses2016
US$m2015
US$m
Staff costs 151 195Depreciation (note 10) 20 28Amortisation and write off (note 14) 5 3Other operating expenses 68 102
244 328
Other operating expenses consist mainly of office, travel, legal and professional and contracting staff costs. The decrease of US$84m in selling, general and administration costs compared with the prior year is principally due to a reduction in staff costs of US$44m as a result of redundancies and lower other operating expenses of US$34m arising from the Group reorganisation and centralisation of back office functions.
d. Staff costs2016
US$m2015
US$m
Total staff costs: Wages and salaries 957 1,209Social security costs 38 58Defined contribution pension costs 21 26Other long-term employee benefit costs (note 27) 24 22Expense of share-based payments (note 24) 17 23
1,057 1,338
Of the US$1,057m (2015: US$1,338m) of staff costs shown above, US$906m (2015: US$1,143m) is included in cost of sales, with the remainder in selling, general and administration expenses.
The average number of payrolled staff employed by the Group during the year was 13,852 (2015: 16,635).
e. Auditor’s remunerationThe Group paid the following amounts to its auditors in respect of the audit of the financial statements and for other services provided to the Group:
2016 US$m
2015 US$m
Group audit fee 2 2Audit of accounts of subsidiaries 2 2Others 1 1
5 5
Others include audit related assurance services of US$430,000 (2015: US$400,000), tax advisory services of US$130,000 (2015: US$430,000), tax compliance services of US$690,000 (2015: US$290,000) and other non-audit services of US$50,000 (2015: US$50,000).
140 / Petrofac Annual report and accounts 2016

f. Other operating income2016
US$m2015
US$m
Gain on disposal of non-current asset – 8Foreign exchange gains 22 2Other income 5 14
27 24
Other income mainly includes US$2m gain on disposal of a subsidiary and US$1m (note 26) relating to a partial redemption of the Company’s Senior notes (2015: other income includes US$9m contractual break fee earned in Integrated Energy Services for exiting the Bowleven Etinde project and US$2m representing income from sale of scrap on projects in Engineering and Construction).
During 2015, upon final completion of the Petrofac FPSO Holding Limited disposal, the fair value of the consideration for 80% of the equity was increased by US$7m due to the receipt of the pending investment approval by PetroFirst Infrastructure Holdings Limited. Consequently, a US$1m fair value gain was recognised on the remaining 20% investment in associate.
g. Other operating expenses2016
US$m2015
US$m
Foreign exchange losses 12 4Other expenses 2 5
14 9
During 2015, other expenses mainly comprised US$2m write-off of related party receivable balances relating to Professional Mechanical Repair Services Company and PetroFirst Infrastructure Limited.
5 Exceptional items and certain re-measurements2016
US$m2015
US$m
Impairment of assets including goodwill 212 95 Fair value re-measurements and net costs relating to the cessation of the Berantai RSC contract 33 –Fair value re-measurements on receivable in respect of the development of the Greater Stella Area 3 214Forward rate movements in Kuwaiti dinar forward currency contracts in the E&C segment 35 –Group reorganisation and redundancy costs 6 17Onerous leasehold property provisions and impairments – 15Ticleni onerous contract provision and foreign currency translation losses on disposal of subsidiary 20 6Others 9 8
318 355Foreign exchange translation losses on deferred tax balances 5 25Tax relief on exceptional items and certain re-measurements (4) (22)
1 3Income statement charge for the year 319 358
Impairment of assets During the year the Group reviewed the carrying value of its assets and as a result of this review a further impairment charge of US$15m (2015: US$nil), post-tax US$15m has been recognised in the IES segment on the FPSO Opportunity reflecting the estimated realisable value of the vessel.
At 30 June 2016, the Group reviewed the carrying value of its available-for-sale investment in Seven Energy and as a result of this review management considered the significant decline in its fair value to be an indicator of impairment and recognised US$51m as an exceptional item to reflect the pricing of a recent equity fundraising by Seven Energy. At 31 December 2016, the Group again reviewed the carrying value of its available-for-sale investment in Seven Energy and concluded that despite the additional 2016 equity injection, Seven Energy’s liquidity outlook looked increasingly challenged owing to a decline in oil prices, the devaluation of the Nigerian Naira and a significant decline in production due to civil unrest in the country. As a result of these economic uncertainties and the liquidity challenges faced by Seven Energy, management has decided that the carrying value of its available-for-sale investment is unlikely to be recoverable and therefore has recognised a further impairment charge of US$130m (post-tax US$130m) at 31 December 2016. Management has also reclassified the cumulative unrealised losses that had been recognised previously through the reserve for unrealised gains/(losses) on available-for-sale investment of US$16m to the consolidated income statement as an exceptional item in the IES segment (2015: US$nil) making the total charge to the consolidated income statement US$197m.
In relation to impairment testing performed on the Mexican PEC assets which have a combined carrying value of US$676m at 31 December 2016 (2015: US$642m), assumptions were made in determining the expected outcome of ongoing contractual negotiations in respect of the planned migration to PSC type arrangements. These included the expected working interest in the PSC and financial and fiscal terms achieved. The situation remains uncertain and the assets are exposed to impairment if these assumptions are not realised. No impairment has been recorded for the year ending 31 December 2016 (2015: US$nil).
Petrofac Annual report and accounts 2016 / 141
Financial statem
ents

Notes to the consolidated financial statements continuedFor the year ended 31 December 2016
5 Exceptional items and certain re-measurements continued
During 2015, the Group recognised an impairment charge of US$33m (post-tax US$33m) in respect of IES goodwill and US$53m (post-tax US$33m) in respect of its PM304 oil and gas assets in Malaysia.
Fair value re-measurements and net costs relating to the cessation of the Berantai RSC contractAs announced on 11 July 2016, IES reached mutual agreement with PETRONAS for the cessation of the Berantai Risk Service Contract (RSC) with effect from 30 September 2016. Under the terms of the Mutual Settlement and Handover Agreement the project remuneration fees were reduced by US$45m (post-tax US$42m) net of the unwinding of discount on the long-term receivable from PETRONAS of US$10m. Also US$13m (post-tax US$13m) relating to a joint venture partner receivable (note 20) was impaired and associated contract exit costs of US$3m (post-tax US$3m) were recognised in the IES segment. Under the terms of the Agreement, the outstanding amount due from PETRONAS will be recovered by 30 June 2017. A final agreement has also been reached to transfer the ownership of the Berantai FPSO to PETRONAS which resulted in a gain of US$24m (post-tax US$24m) from de-recognition of the finance leased asset and the associated finance lease liability. The transfer of ownership of the Berantai FPSO to PETRONAS also resulted in a higher share of associate income for the Group of US$4m (post-tax US$4m). See note 15.
Fair value re-measurements on receivable in respect of the development of the Greater Stella Area As a result of a reassessment of oil and gas forward prices, capital expenditure changes and commercial settlement adjustments, the Group revalued its loan receivable from Ithaca Energy in respect of the Greater Stella Area in the UK. The revaluation exercise was carried out on a fair value basis using risk adjusted cash flow projections (a Level 3 measurement) discounted at a post-tax rate of 9.5% (2015: 9.0%) which resulted in a US$3m pre-tax impairment charge (post-tax US$3m) in the IES segment (2015: pre-tax US$214m, post-tax US$214m). Management has used forward curve oil prices of US$59 per barrel for 2017 and US$58 per barrel for 2018. For later periods, the long-term planning oil price assumptions used for the revaluation were US$70 per barrel for 2019, and US$75 per barrel for 2020 and beyond (2015: forward curve oil prices of US$41 per barrel for 2016 and US$48 per barrel for 2017 and for later periods, the long-term planning oil price assumptions used for the revaluation were US$65 per barrel for 2018, US$70 per barrel for 2019 and US$75 per barrel for 2020 and beyond).
Fair value less costs of disposal are determined by discounting the post-tax cash flows expected to be generated from oil and gas production net of selling costs taking into account assumptions that market participants would typically use in estimating fair values. Post-tax cash flows are derived from projected production profiles for each asset taking into account forward market commodity prices over the relevant period and, where external forward prices are not available, the Group’s Board-approved five-year business planning assumptions are used. As each field has different reservoir characteristics and contractual terms the post-tax cash flows for each asset are calculated using individual economic models which include assumptions around the amount of recoverable reserves, production costs, life of the field/licence period and the selling price of the commodities produced.
Group reorganisation and redundancy costsDuring the last quarter of 2015, the Group undertook a major review of how the future organisation should be structured and the costs relating to this exercise including staff redundancy costs, office closure costs and other restructuring type expenses amounted in the current year to US$6m, post-tax US$5m (2015: US$17m, post-tax US$15m).
Onerous leasehold property provisionDuring 2015, US$15m of onerous leasehold property provision represented the write-off of US$6m of leasehold property improvements and the estimated future costs of US$9m relating to vacant leasehold office buildings at Quattro House and Bridge View in Aberdeen, UK for which the leases expire in 2024 and 2026 respectively.
Ticleni onerous contract provision and foreign currency translation losses on disposal of subsidiaryA further onerous contract provision of US$9m (post-tax US$9m) was recognised in the IES segment principally to reflect the final commercial settlement in respect of the exit from the Ticleni Production Enhancement Contract in Romania (2015: US$6m, post-tax US$6m). In addition, foreign currency translation losses of US$11m (post-tax US$11m) were reclassified from other comprehensive income to exceptional items in the IES segment upon disposal of the Ticleni Production Enhancement Contract in Romania (note 25).
TaxationUS$5m of foreign exchange losses on the retranslation of deferred tax balances denominated in Malaysian Ringgits have been incurred during the year in respect of IES’s oil and gas activities in Malaysia due to an approximate 4% weakening in the Malaysian local currency versus the US dollar.
6 Finance (costs)/income2016
US$m2015
US$m
Finance costs Group borrowings (54) (48)Finance leases (37) (49) Unwinding of discount on provisions (note 27) (8) (4)Others (2) – Total finance costs (101) (101)
Finance incomeBank interest 3 1Unwinding of discount on long-term receivables from customers – 8Total finance income 3 9
142 / Petrofac Annual report and accounts 2016

7 Income tax
a. Tax on ordinary activities The major components of income tax expense are as follows:
Business performance
US$m
Exceptionalitems and certain re-measurements
US$m
Total2016
US$m
Business performance
US$m
Exceptionalitems and certain re-measurements
US$m
Total2015
US$m
Current income taxCurrent income tax charge 110 16 126 69 (2) 67 Adjustments in respect of current income tax of previous years (5) – (5) (1) – (1) Deferred taxRelating to origination and reversal of temporary differences (21) (15) (36) (49) 5 (44) Recognition of tax losses relating to prior years – – – 5 – 5Adjustments in respect of deferred tax of previous years 1 – 1 (18) – (18) Income tax expense reported in the consolidated income statement 85 1 86 6 3 9
Income tax reported in equityDeferred tax related to items charged directly to equity 1 – 1 (1) – (1) Foreign exchange movements on translation 9 – 9 1 – 1Income tax expense reported in equity 10 – 10 – – –
The split of the Group’s tax charge between current and deferred tax varies from year to year depending largely on:
• the variance between tax provided on the percentage of completion of projects versus that paid on accrued income for engineering, procurement and construction contracts; and
• the tax deductions available for expenditure on RSC and PECs, which are partially offset by the creation of losses
See 7c below for the impact on the movements in the year.
The decrease in the sterling to United States dollars exchange rate resulted in a reduction on translation of the net deferred tax asset in the UK, which principally comprises UK tax losses.
b. Reconciliation of total tax chargeA reconciliation between the income tax expense and the product of accounting profit multiplied by the Company’s domestic tax rate is as follows:
Business performance
US$m
Exceptionalitems and certain re-measurements
US$m
Total2016
US$m
Business performance
US$m
Exceptionalitems and certain re-measurements
US$m
Total2015
US$m
Accounting profit before tax 418 (318) 100 20 (355) (335)
At Jersey’s domestic income tax rate of 0% (2015: 0%) – – – – – –Expected tax charge in higher rate jurisdictions 58 (15) 43 (33) (31) (64)Expenditure not allowable for income tax purposes 21 9 30 8 – 8Income not subject to tax (8) – (8) (3) – (3)Adjustments in respect of previous years (4) – (4) (19) – (19)Adjustments in respect of losses not previously recognised/derecognised – – – (4) 9 5Unrecognised tax losses 13 1 14 50 – 50Other permanent differences 3 6 9 1 25 26Effect of change in tax rates 2 – 2 6 – 6At the effective income tax rate of 86.0% (2015: negative 2.7%) 85 1 86 6 3 9
The Group’s effective tax rate for the year ended 31 December 2016 is 86.0% (2015: negative 2.7%). The Group’s effective tax rate, excluding the impact of impairments and certain re-measurements, for the year ended 31 December 2016 is 20.3% (2015: 30.0% tax charge).
Petrofac Annual report and accounts 2016 / 143
Financial statem
ents

Notes to the consolidated financial statements continuedFor the year ended 31 December 2016
7 Income tax continued
A number of factors have impacted the overall effective tax rate, with key drivers being; impairments and certain re-measurements which are not subject to tax and the disallowance of expenditure which is not deductible for tax purposes.
In line with prior years, the effective tax rate is also driven by the mix of profits in the jurisdictions in which profits are earned.
As announced in the 2016 Budget, the main rate of UK corporation tax will be reduced by a further 1% to 17% from 1 April 2020. The change in the UK rate was substantively enacted prior to the reporting date and therefore the impact of the change is reflected within the current year charge.
Also in the 2016 Budget, the UK Government proposed changes to the carry forward tax loss relief rules, however these were not substantively enacted by the reporting date and hence any impact has not been included within the calculations. The impact, as a result of the proposed change in legislation, is estimated to be a decrease to the recognised deferred tax asset of US$22m, approximately 42%.
c. Deferred taxDeferred tax relates to the following:
Consolidated statement of financial position Consolidated income statement
2016 US$m
2015 US$m
2016 US$m
2015 US$m
Deferred tax liabilities Fair value adjustment on acquisitions 3 2 – –Accelerated depreciation 198 249 (43) (48)Profit recognition 56 68 (14) 10Overseas earnings 6 3 3 3Other temporary differences – 10 (4) 8Gross deferred tax liabilities 263 332
Deferred tax assetsLosses available for offset 170 172 (10) (66)Decelerated depreciation for tax purposes 3 5 2 (2)Share scheme 3 5 – –Profit recognition – 3 3 2Decommissioning 36 57 21 1Other temporary differences 20 29 7 35Gross deferred tax assets 232 271Net deferred tax liability/deferred tax credit 31 61 (35) (57)
Of which:Deferred tax assets 63 80Deferred tax liabilities 94 141
Included within the net deferred tax asset are UK tax losses of US$280m (2015: US$305m). This represents the losses which are expected to be utilised based on management’s projection of future taxable profits. As a result of the UK rate change noted in 7b, the effective tax rate on the loss utilisation is expected to be 17.7% (2015: 18.5%).
d. Unrecognised tax losses and tax creditsDeferred income tax assets are recognised for tax loss carry forwards and tax credits to the extent that the realisation of the related tax benefit through offset against future taxable profits is probable. The Group did not recognise deferred income tax assets of US$524m (2015: US$525m).
2016 US$m
2015 US$m
Expiration dates for tax losses No later than 2025 – 66No expiration date 512 447
512 513Tax credits (no expiration date) 12 12
524 525
During 2016, the Group has recognised the tax benefit of US$1m from the utilisation of tax losses (2015: US$nil) and there has been no recognition of previously unrecognised losses (2015: US$nil) or any de-recognition of tax losses from a prior period (2015: US$5m).
144 / Petrofac Annual report and accounts 2016

8 Earnings per share
Basic earnings per share amounts are calculated by dividing the profit for the year attributable to ordinary shareholders by the weighted average number of ordinary shares outstanding during the year.
Diluted earnings per share amounts are calculated by dividing the profit attributable to ordinary shareholders, after adjusting for any dilutive effect, by the weighted average number of ordinary shares outstanding during the year, adjusted for the effects of ordinary shares granted under the employee share award schemes which are held in trust.
The following reflects the income and share data used in calculating basic and diluted earnings per share:2016
US$m2015
US$m
Profit attributable to ordinary shareholders for basic and diluted earnings per share excluding exceptionalitems and certain re-measurements 320 9Profit/(loss) attributable to ordinary shareholders for basic and diluted earnings per share including exceptionalitems and certain re-measurements 1 (349)
2016Shares million
2015 Shares million
Weighted average number of ordinary shares for basic earnings per share 340 340Effect of dilutive potential ordinary shares granted under share-based payment schemes1 3 –Adjusted weighted average number of ordinary shares for diluted earnings per share 343 340
1 For the year ended 31 December 2015, potentially issuable ordinary shares under share-based payment schemes are excluded from the diluted earnings per ordinary share calculation, as their inclusion would decrease the loss per ordinary share.
9 Dividends paid and proposed2016
US$m2015
US$m
Declared and paid during the year Equity dividends on ordinary shares: Final dividend for 2014: 43.80 cents per share – 149Interim dividend 2015: 22.00 cents per share – 74Final dividend for 2015: 43.80 cents per share 149 –Interim dividend 2016: 22.00 cents per share 75 –
224 223
2016 US$m
2015 US$m
Proposed for approval at AGM (not recognised as a liability as at 31 December)Equity dividends on ordinary shares Final dividend for 2016: 43.80 cents per share (2015: 43.80 cents per share) 152 152
Petrofac Annual report and accounts 2016 / 145
Financial statem
ents

Notes to the consolidated financial statements continuedFor the year ended 31 December 2016
10 Property, plant and equipmentOil and
gas assets US$m
Oil and gas
facilities US$m
Land, buildings and leasehold improvements
US$m
Plant and equipment
US$mVehicles
US$m
Office furniture and
equipment US$m
Assets under
construction US$m
Total US$m
Cost At 1 January 2015 1,256 625 374 47 24 180 222 2,728Additions/(adjustments) 97 (4) 4 – 2 15 146 260Disposals – – (44) (4) (1) (6) – (55)Transfer from intangible oil and gas assets (note 14) 73 – – – – – – 73Transfers – – 34 8 – 8 (50) –Exchange difference – – (4) (1) – (4) – (9)At 1 January 2016 1,426 621 364 50 25 193 318 2,997Additions 15 – 37 1 1 9 80 143Revision to decommissioning estimates (note 27) (101) – – – – – – (101)Disposals (103) (201) (45) (8) (2) (17) (29) (405)Transfer from intangible oil and gas assets (note 14) (5) – – – – – – (5)Transfers – – 10 – – – (10) –Transfer to assets held for sale (note 13) (86) – – – – – – (86)Write off – – (1) – – (1) – (2)Exchange difference – – (4) (3) – (11) – (18)At 31 December 2016 1,146 420 361 40 24 173 359 2,523Depreciation & impairmentAt 1 January 2015 (415) (197) (211) (31) (21) (126) (29) (1,030)Charge for the year (78) (42) (40) (4) (2) (30) – (196)Charge for impairment (note 5) (32) (15) (6) – – – – (53)Disposals – – 44 2 1 6 – 53Transfers – – – (6) – 6 – –Exchange difference – – 2 1 – 1 – 4At 1 January 2016 (525) (254) (211) (38) (22) (143) (29) (1,222)Charge for the year (82) (38) (35) (3) (2) (22) – (182)Charge for impairment (note 5) – (15) – – – – – (15)Disposals 103 62 41 8 2 16 29 261Transfer to assets held for sale (note 13) 38 – – – – – – 38Write off – – 1 – – 1 – 2Exchange difference – – 3 2 – 8 – 13At 31 December 2016 (466) (245) (201) (31) (22) (140) – (1,105)Net carrying amount: At 31 December 2016 680 175 160 9 2 33 359 1,418At 31 December 2015 901 367 153 12 3 50 289 1,775
Additions to oil and gas assets mainly comprise Santuario, Magallanes and Arenque PECs of US$12m (2015: Santuario, Magallanes and Arenque PECs of US$61m, Pánuco PEC of US$26m and US$18m relating to block PM304 in Malaysia which is offset by change in estimates for decommissioning provision relating to block PM304 in Malaysia of US$8m). Additions to land, buildings and leasehold improvements mainly comprise project camps and temporary facilities in Engineering & Construction projects.
Disposal of oil and gas assets with a net book value of US$nil relates to the disposal of Ticleni PEC during the year and disposal of oil and gas facilities with a net book value of US$139m relates to the cancellation of the Berantai FPSO finance lease and the subsequent transfer of ownership of the vessel to the customer (note 17).
Negative transfer from intangible oil and gas assets of US$5m relating to block PM304 in Malaysia is due to reversal of excess capital expenditure accruals recorded in the prior year (2015: field development costs on block PM304 in Malaysia of US$73m).
Of the total charge for depreciation in the income statement, US$162m (2015: US$168m) is included in cost of sales and US$20m (2015: US$28m) in selling, general and administration expenses.
Assets under construction mainly represent expenditures incurred in relation to construction of the JSD6000 installation vessel. The interest capitalised on construction of the JSD6000 installation vessel in 2016 amounted to US$2m (2015: US$2m).
146 / Petrofac Annual report and accounts 2016

Included in ‘oil and gas facilities’ and ‘plant and equipment’ is property, plant and equipment under finance lease agreements, for which net book values are as follows:
Net book value2016
US$m2015
US$m
At 1 January 351 401Disposal (note 17) (139) –Additions/(adjustments) – (4)Depreciation (38) (46)At 31 December 174 351
Disposal of finance lease assets relates to the cancellation of Berantai FPSO finance lease and subsequent transfer of ownership of the vessel to the customer (note 17).
11 Material partly-owned subsidiaries
Petrofac Emirates LLC is the only material partly-owned subsidiary in the Group and the proportion of the nominal value of issued shares controlled by the Group is disclosed in note 33.
Movement of non-controlling interest in Petrofac Emirates LLC2016
US$m2015
US$m
At 1 January 4 12Profit for the year 13 5Net unrealised gains/(losses) on derivatives 9 (8)Dividend paid (1) (5)At 31 December 25 4
The balance of non-controlling interests relate to other partly-owned subsidiaries that are not material to the Group.
Financial information of Petrofac Emirates LLC that has material non-controlling interests is provided below:
Summarised income statement2016
US$m2015
US$m
Revenue 1,194 1,320Cost of sales (1,095) (1,247)Gross profit 99 73Selling, general and administration expenses (41) (56)Finance (expense)/income (6) 1Profit for the year 52 18Attributable to non-controlling interest 13 5
Net unrealised losses on derivativesNet unrealised losses on derivatives at 1 January (83) (52)Other comprehensive income/(loss) during the year 35 (31)Net unrealised losses on derivatives at 31 December (48) (83)Net unrealised losses on derivatives attributable to non-controlling interest (note 25) (12) (21)Total comprehensive income/(loss) attributable to non-controlling interest 22 (3)
Summarised statement of financial position Current assets 715 526Non-current assets 221 240Total assets 936 766Current liabilities 832 738Non-current liabilities 4 10Total liabilities 836 748Total equity 100 18Attributable to non-controlling interest 25 4
Summarised cash flow informationOperating 80 90Investing (10) (65)
Dividends of US$4m were declared during 2016, of which US$1m is attributable to non-controlling interest (2015: US$20m). These dividends were adjusted against related party balances in the standalone books.
Petrofac Annual report and accounts 2016 / 147
Financial statem
ents

Notes to the consolidated financial statements continuedFor the year ended 31 December 2016
12 Goodwill
A summary of the movements in goodwill is presented below:2016
US$m2015
US$m
At 1 January 80 115Impairment (note 5) – (33)Exchange difference (8) (2)At 31 December 72 80
During 2015 US$33m relating to the Integrated Energy Services cash-generating unit was impaired (note 5).
Goodwill acquired through business combinations has been allocated to two groups of cash-generating units, for impairment testing as follows:
• Engineering & Construction• Engineering & Production Services
These represent the lowest level within the Group at which the goodwill is monitored for internal management purposes. The Group considers cash-generating units to be individually significant where they represent greater than 25% of the total goodwill balance.
Engineering & Construction and Engineering & Production Services cash-generating unitsRecoverable amounts have been determined based on value in use calculations, using discounted pre-tax cash flow projections. Management have adopted projection periods appropriate to each unit’s value in use. For Engineering & Construction and Engineering & Production Services cash-generating units the cash flow projections are based on financial budgets approved by the Board covering a five-year period.
Carrying amount of goodwill allocated to each group of cash-generating units2016
US$m2015
US$m
Engineering & Construction unit 32 33Engineering & Production Services unit 40 47
72 80
Key assumptions used in value in use calculations for the Engineering & Construction and the Engineering & Production Services unitsMarket share: the key management assumptions relate to continuing to maintain existing levels of business and grow organically in international markets.
Discount rate: management has used a pre-tax discount rate of 11.6% per annum (2015: 11.6% per annum) derived from the estimated weighted average cost of capital of the Group. A 100 basis point increase in the pre-tax discount rate to 12.6% would result in no additional impairment charges.
13 Assets held for sale
During 2016, the Group signed a sale and purchase agreement (SPA) for the sale of one of its businesses in Mexico. The disposal is expected to be completed in 2017, once all the conditions precedent to completion under the SPA are satisfied. The below assets and liabilities are classified as held for sale at 31 December and relate to the IES segment:
2016 US$m
2015 US$m
Assets held for saleProperty, plant and equipment (note 10) 48 –Other intangible assets (note 14) 2 –Trade and other receivables (note 20) 78 –
128 –
2016 US$m
2015 US$m
Liabilities associated with assets held for saleProvision for decommissioning (note 27) 21 –Trade and other payables (note 28) 13 –
34 –
No gain or loss was recognised on the reclassification of these assets and liabilities as held for sale.
148 / Petrofac Annual report and accounts 2016

14 Intangible assets2016
US$m2015
US$m
Intangible oil and gas assets Cost: At 1 January 86 156Additions 3 10Accrual adjustment (11) –Transfer to oil and gas assets (note 10) 5 (73)Impairments (note 5) – (7)Write off (note 4b and note 4c) (3) –Net book value of intangible oil and gas assets at 31 December 80 86
Other intangible assets Cost: At 1 January 48 53Disposal (2) –Transfer to receivables – (5)Transfer to assets held for sale (note 13) (2) –Exchange difference (3) –At 31 December 41 48Accumulated amortisation: At 1 January (27) (23)Amortisation (3) (4)Disposal 2 –Exchange difference 3 –At 31 December (25) (27)Net book value of other intangible assets at 31 December 16 21Total intangible assets 96 107
Intangible oil and gas assetsOil and gas assets (part of the Integrated Energy Services segment) additions comprise US$3m (2015: US$10m) of capitalised expenditure on the Group’s assets in Malaysia.
Accrual adjustment of US$11m represents reversal of excess capital expenditure accruals in the prior year.
There were investing cash outflows relating to capitalised intangible oil and gas assets of US$2m (2015: US$17m) in the current year arising from pre-development activities.
Transfer within intangible oil and gas assets represents a negative transfer to oil and gas assets relating to block PM304 in Malaysia of US$5m due to reversal of excess capital expenditure accruals recorded in prior years (2015: US$73m) (note 10).
Other intangible assetsOther intangible assets comprising project development expenditure, customer contracts, proprietary software and patent technology are being amortised over their estimated economic useful life on a straight-line basis and the related amortisation charges included in cost of sales and selling, general and administration expenses (note 4b and 4c).
Petrofac Annual report and accounts 2016 / 149
Financial statem
ents

Notes to the consolidated financial statements continuedFor the year ended 31 December 2016
15 Investments in associates/joint venturesAssociates
US$mJoint ventures
US$mTotal
US$m
As at 1 January 2015 66 5 71Additions – 1 1Loan made to Petrofac FPF1 Limited 1 – 1Share of profits 7 2 9Fair valuation gain on initial recognition of investment in associate (note 4f) 1 – 1Dividends received (6) (3) (9)As at 1 January 2016 69 5 74Additions 7 – 7Share of profits 11 1 12Dividends received (27) (1) (28)As at 31 December 2016 60 5 65
During 2016, the Company acquired 10% of the share capital of PetroFirst Infrastructure 2 Limited amounting to US$7m out of which US$5m was paid in cash and the balance of US$2m representing deferred consideration is included within other payables. The investment is classified as an associate due to the Company’s representation on the board of directors and ability to exercise significant influence over the investee.
Dividends received include US$24m received from PetroFirst Infrastructure Limited, US$2m received from PetroFirst Infrastructure 2 Limited, US$1m received from TTE Petrofac Limited and US$1m is receivable from PetroFirst Infrastructure Limited at 31 December 2016 (2015: US$5m received from PetroFirst Infrastructure Limited, US$3m received from TTE Petrofac Limited and US$1m receivable from PetroFirst Infrastructure Limited).
The transfer of ownership of the Berantai FPSO to PETRONAS resulted in a higher Group share of associate income of US$4m which has been reported as an exceptional item in the IES segment (note 5). During 2015 included in share of profits was an impairment loss of US$1m relating to a reduction in scope of construction work at a training centre in Oman (note 5).
Associates2016
US$m2015
US$m
PetroFirst Infrastructure Limited 15 29Petrofac FPF1 Limited 40 40PetroFirst Infrastructure 2 Limited 5 –
60 69
Interest in associatesSummarised financial information of associates1, based on their IFRS financial statements, and reconciliation with the carrying amount of the investment in consolidated financial statements are set out below:
2016 US$m
2015 US$m
Revenue 118 68Cost of sales (40) (17)Gross profit 78 51Finance expense, net (19) (14)Profit 59 37Group’s share of profit for the year 11 7
Current assets 71 25Non-current assets 444 562Total assets 515 587
Current liabilities 63 17Non-current liabilities 161 264Total liabilities 224 281Net assets 291 306Group’s share of net assets 60 69Carrying amount of the investment 60 69
1 A list of these associates is disclosed in note 33.
The associates had no contingent liabilities or capital commitments as at 31 December 2016 and 2015.
150 / Petrofac Annual report and accounts 2016
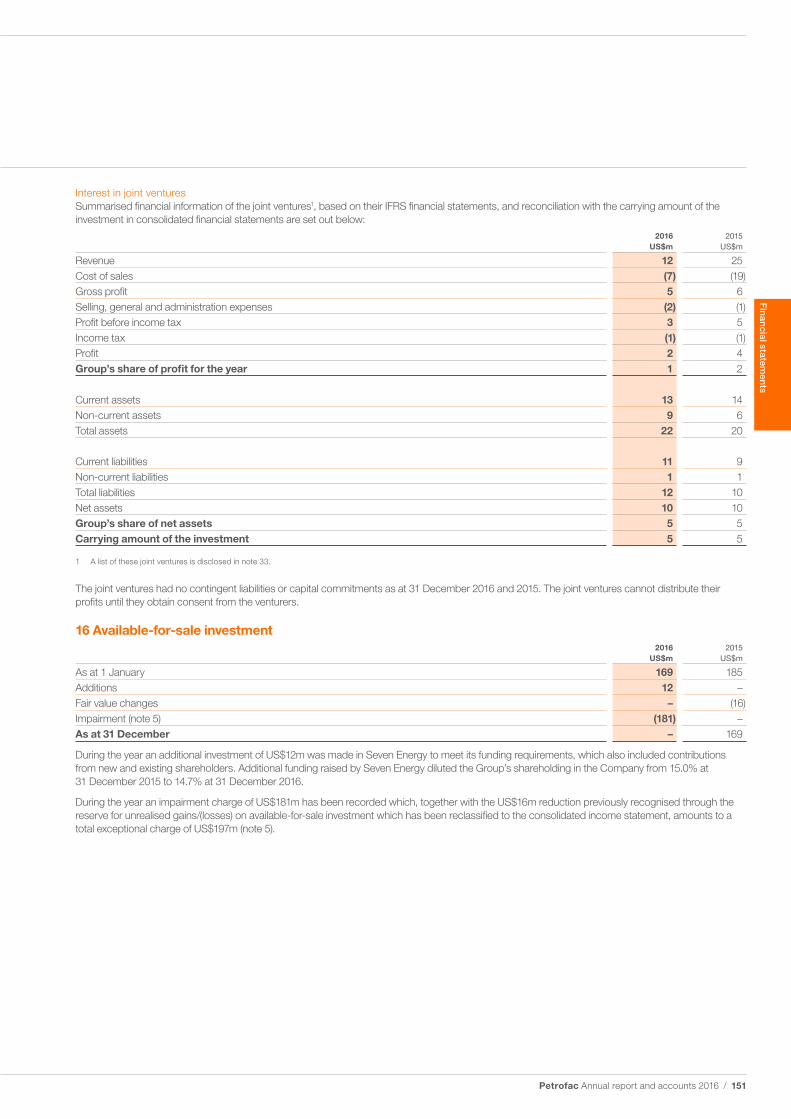
Interest in joint venturesSummarised financial information of the joint ventures1, based on their IFRS financial statements, and reconciliation with the carrying amount of the investment in consolidated financial statements are set out below:
2016 US$m
2015 US$m
Revenue 12 25Cost of sales (7) (19)Gross profit 5 6Selling, general and administration expenses (2) (1)Profit before income tax 3 5Income tax (1) (1)Profit 2 4Group’s share of profit for the year 1 2
Current assets 13 14Non-current assets 9 6Total assets 22 20
Current liabilities 11 9Non-current liabilities 1 1Total liabilities 12 10Net assets 10 10Group’s share of net assets 5 5Carrying amount of the investment 5 5
1 A list of these joint ventures is disclosed in note 33.
The joint ventures had no contingent liabilities or capital commitments as at 31 December 2016 and 2015. The joint ventures cannot distribute their profits until they obtain consent from the venturers.
16 Available-for-sale investment 2016
US$m2015
US$m
As at 1 January 169 185Additions 12 –Fair value changes – (16)Impairment (note 5) (181) – As at 31 December – 169
During the year an additional investment of US$12m was made in Seven Energy to meet its funding requirements, which also included contributions from new and existing shareholders. Additional funding raised by Seven Energy diluted the Group’s shareholding in the Company from 15.0% at 31 December 2015 to 14.7% at 31 December 2016.
During the year an impairment charge of US$181m has been recorded which, together with the US$16m reduction previously recognised through the reserve for unrealised gains/(losses) on available-for-sale investment which has been reclassified to the consolidated income statement, amounts to a total exceptional charge of US$197m (note 5).
Petrofac Annual report and accounts 2016 / 151
Financial statem
ents

Notes to the consolidated financial statements continuedFor the year ended 31 December 2016
17 Other financial assets and other financial liabilities
Other financial assets Classification2016
US$m2015
US$m
Non-currentReceivable under the Berantai RSC Fair value through profit and loss – 303Receivable from joint venture partners Loans and receivables 235 330Forward currency contracts designated as hedges (note 32) Designated as cash flow hedges 42 78Restricted cash Loans and receivables 41 41
318 752
CurrentReceivable under the Berantai RSC Fair value through profit and loss 71 54Receivable in respect of the development of the Greater Stella Area Fair value through profit and loss 276 160Receivable from joint venture partners Loans and receivables 179 155Forward currency contracts designated as hedges (note 32) Designated as cash flow hedges 9 26Forward currency contracts undesignated (note 32) Fair value through profit and loss 5 12Oil derivative (note 32) Designated as cash flow hedges – 12Restricted cash Loans and receivables 6 36
546 455
Other financial liabilitiesNon-currentFinance lease creditors (note 29) Loans and borrowings 336 631Forward currency contracts designated as hedges (note 32) Designated as cash flow hedges 12 28
348 659
CurrentFinance lease creditors (note 29) Loans and borrowings 260 239Forward currency contracts designated as hedges (note 32) Designated as cash flow hedges 88 66Forward currency contracts undesignated (note 32) Fair value through profit and loss 4 1Oil derivative (note 32) Designated as cash flow hedges 2 –Interest payable Fair value through profit and loss 14 30
368 336
Due to the cessation of the Berantai RSC agreed with PETRONAS, the outstanding Berantai RSC receivable is classified as a short-term receivable at 31 December 2016. The short-term receivable under the Berantai RSC now represents the amounts agreed to be recovered over a period of six months from the reporting date in line with the Mutual Settlement and Handover Agreement with the customer (note 5). As part of this arrangement the Berantai FPSO, that was held as an asset under finance lease and having an outstanding finance lease payable of US$163m at the time of transfer, has also been transferred to PETRONAS. De-recognition of the finance lease asset of US$139m (note 10) with an associated liability attached of US$163m resulted in a profit of US$24m being recorded as an exceptional item in the IES segment (note 5).
Reconciliation of fair value measurement of the receivable under Berantai RSC is presented below:
2016US$m
2015US$m
As at 1 January 357 381Billings during the year 62 55Fair value (loss)/gain included in revenue (45) 4Receipts during the year *(303) (83)As at 31 December 71 357
*US$303m includes US$257m being receipts from non-recourse factoring.
During the year, amounts receivable in respect of the Berantai RSC were transferred from Level 3 to Level 2 fair value measurement hierarchy due to the final agreement being reached with the customer and as a result no use of unobservable inputs for its valuation.
The short-term receivable in respect of the development of the Greater Stella Area represents a loan made to the consortium partners to fund Petrofac’s share of the development costs of the field.
The short-term and long-term receivable from joint venture partners represents the 70% gross up on the finance lease liability in respect of oil and gas facilities relating to block PM304 in Malaysia that are included 100% in the Group’s consolidated statement of financial position. This treatment is necessary to reflect the legal position of the Group as the contracting entity for this lease. The Group’s 30% share of this liability is US$177m (2015: US$208m).
Restricted cash comprises deposits with financial institutions and joint venture partners securing various guarantees and performance bonds associated with the Group’s trading activities (note 29). This cash will be released on the maturity of these guarantees and performance bonds.
152 / Petrofac Annual report and accounts 2016

Fair value measurementThe following financial instruments are measured at fair value using the hierarchy below for determination and disclosure of their respective fair values:
Level 1: Unadjusted quoted prices in active markets for identical financial assets or liabilitiesLevel 2: Other valuation techniques where the inputs are based on significant observable factorsLevel 3: Other valuation techniques where the inputs are based on significant unobservable market data
Set out below is a comparison of the carrying amounts and fair values of financial instruments as at 31 December:
Level Carrying amount Fair value
2016 US$m
2015 US$m
2016 US$m
2015 US$m
Financial assetsCash and short-term deposits Level 2 1,167 1,104 1,167 1,104Restricted cash Level 2 47 77 47 77Available-for-sale investment Level 3 – 169 – 169Receivable under Berantai RSC Level 2 71 357 71 357Receivable in respect of the development of the Greater Stella Area Level 3 276 160 276 160Oil derivative Level 2 – 12 – 12Euro forward currency contracts – designated as cash flow hedge Level 2 47 99 47 99Kuwaiti dinar forward currency contracts – designated as cash flow hedge Level 2 1 3 1 3Sterling forward currency contracts – designated as cash flow hedge Level 2 3 2 3 2Sterling forward currency contracts – undesignated Level 2 5 12 5 12
Financial liabilitiesInterest-bearing loans and borrowingsSenior Notes Level 2 674 745 677 750Term loans Level 2 300 499 300 500Revolving Credit Facility Level 2 637 530 645 540Export Credit Agency funding Level 2 129 13 140 17Bank overdrafts Level 2 44 3 44 3Finance lease creditors Level 2 596 870 596 870Interest payable Level 2 14 30 14 30Oil derivative Level 2 2 – 2 –Euro forward currency contracts – designated as cash flow hedge Level 2 45 72 45 72Malaysian ringgit forward currency contracts – designated as cash flow hedge Level 2 15 18 15 18Kuwaiti dinar forward currency contracts – designated as cash flow hedge Level 2 30 1 30 1Japanese yen forward currency contracts – designated as cash flow hedge Level 2 5 – 5 –Sterling forward currency contracts – designated as cash flow hedge Level 2 5 3 5 3Sterling forward currency contracts – undesignated Level 2 1 1 1 1Euro forward currency contracts – undesignated Level 2 2 – 2 –Kuwaiti dinar forward currency contracts – undesignated Level 2 1 – 1 –
The Group considers that the carrying amounts of trade and other receivables, work-in-progress, trade and other payables, other current and non-current financial assets and liabilities approximate their fair values and are therefore excluded from the above table.
The fair value of the financial assets and liabilities is included at the amount at which the instrument could be exchanged in a current transaction between willing parties, other than in a forced or liquidation sale.
The following methods and assumptions were used to estimate the fair values:
• The Group enters into derivative financial instruments with various counterparties, principally financial institutions with investment grade credit ratings. Derivatives valued using valuation techniques with market observable inputs are mainly foreign exchange forward contracts and oil derivatives. Externally provided sources of quoted market prices have been used to determine the fair values of forward currency contracts and oil derivatives.
• The fair values of long-term interest-bearing loans and borrowings and finance lease creditors are equivalent to their amortised costs determined as the present value of discounted future cash flows using the effective interest rate.
• The fair value of the amounts receivable in respect of the development of the Greater Stella Area has been calculated using a discounted cash flow model that represents the value which management expects would be converted to oil and gas assets upon transfer of legal title of the licence on achieving first oil. The oil price assumptions used are the same as disclosed in note 5; the risk adjusted cash flow projections are discounted at a post-tax rate of 9.5% (2015: 9.0%).
Petrofac Annual report and accounts 2016 / 153
Financial statem
ents

Notes to the consolidated financial statements continuedFor the year ended 31 December 2016
17 Other financial assets and other financial liabilities continued
The table below explains the impact on the fair value of the amounts receivable in respect of the development of the Greater Stella Area as a result of changes to these inputs:
2016US$m
2015US$m
10% decrease in the oil price (per barrel) (22) (22)10% increase in the oil price (per barrel) 23 2210% decrease in the gas price (per mcf) (23) (26)10% increase in the gas price (per mcf) 26 271 month delay in production (2015: 6 months) (6) (45)100 basis points decrease in the discount rate 12 16100 basis points increase in the discount rate (12) (15)
Reconciliation of fair value measurement of the amounts receivable in respect of the development of the Greater Stella Area:2016
US$m2015
US$m
As at 1 January 160 192Advances during the year to the partners 119 182Fair value loss (note 5) (3) (214)As at 31 December 276 160
18 Inventories2016
US$m2015
US$m
Crude oil 2 4Stores and raw materials 9 9
11 13
Included in the consolidated income statement are costs of inventories expensed of US$115m (2015: US$106m).
19 Work in progress and billings in excess of cost and estimated earnings2016
US$m2015
US$m
Cost and estimated earnings 25,161 19,517Less: billings (22,979) (17,723)Work in progress 2,182 1,794
Billings 288 1,589Less: cost and estimated earnings (244) (1,388)Billings in excess of cost and estimated earnings 44 201
Total cost and estimated earnings 25,405 20,905Total billings 23,267 19,312
154 / Petrofac Annual report and accounts 2016

20 Trade and other receivables2016
US$m2015
US$m
Trade receivables 1,377 1,224Retentions receivables 305 349Advances 293 262Prepayments and deposits 28 38Receivables from joint venture partners 50 100Other receivables 109 151
2,162 2,124
Trade receivables are non-interest bearing and are generally on 30 to 60 days’ terms. Trade receivables are reported net of provision for impairment. The movements in the provision for impairment against trade receivables totalling US$1,390m (2015: US$1,236m) are as follows:
2016 2015Specific
impairment US$m
General impairment
US$mTotal
US$m
Specific impairment
US$m
General impairment
US$mTotal
US$m
At 1 January 11 1 12 2 2 4Charge/(reversal) for the year – 1 1 10 (1) 9Amounts written off – – – (1) – (1)At 31 December 11 2 13 11 1 12
At 31 December, the analysis of trade receivables is as follows:
Neither past due nor
impaired US$m
Number of days past due
< 30 days
US$m
31–60 days
US$m
61–90 days
US$m
91–120 days
US$m
121–360*days
US$m
> 360* days
US$mTotal
US$m
Unimpaired 1,049 78 55 21 25 64 70 1,362Impaired – 1 – – 1 16 10 28
1,049 79 55 21 26 80 80 1,390Less: impairment provision – (1) – – – (3) (9) (13)Net trade receivables 2016 1,049 78 55 21 26 77 71 1,377 Unimpaired 832 156 129 18 12 46 22 1,215Impaired – – – – 6 9 6 21
832 156 129 18 18 55 28 1,236Less: impairment provision – – – – (3) (5) (4) (12)Net trade receivables 2015 832 156 129 18 15 50 24 1,224
* Included within these aged trade receivables are US$122m in the Engineering & Construction segment which will be recovered from the customers as part of the final settlement on the projects. The management has reviewed the recoverability of these receivables and concluded that these will be recovered in full and no impairment provision is necessary as of 31 December 2016.
The credit quality of trade receivables that are neither past due nor impaired is assessed by management with reference to externally prepared customer credit reports and the historic payment track records of the counterparties.
At 31 December 2016, trade and other receivables of US$78m were reclassified to assets held for sale (note 13).
Advances represent payments made to certain of the Group’s subcontractors for projects in progress, on which the related work had not been performed at the statement of financial position date.
Receivables from joint venture partners are amounts recoverable from venture partners on the Block PM304, Berantai RSC and on consortium contracts in the E&C segment. During the year, joint venture partner receivables amounting to US$13m were impaired due to the cessation of the Berantai RSC contract (note 5).
Other receivables mainly consist of Value Added Tax recoverable of US$66m (2015: US$65m).
All trade and other receivables are expected to be settled in cash. Certain trade and other receivables will be settled in cash using currencies other than the reporting currency of the Group, and will be largely paid in sterling, euros and Kuwaiti dinars.
Petrofac Annual report and accounts 2016 / 155
Financial statem
ents

Notes to the consolidated financial statements continuedFor the year ended 31 December 2016
21 Cash and short-term deposits2016
US$m2015
US$m
Cash at bank and in hand 1,009 1,102Short-term deposits 158 2Total cash and bank balances 1,167 1,104
Short-term deposits are made for varying periods of between one day and three months depending on the immediate cash requirements of the Group, and earn interest at respective short-term deposit rates. The fair value of cash and bank balances is US$1,167m (2015: US$1,104m).
For the purposes of the consolidated statement of cash flows, cash and cash equivalents comprise the following:2016
US$m2015
US$m
Cash at bank and in hand 1,009 1,102Short-term deposits 158 2Bank overdrafts (note 26) (44) (3)
1,123 1,101
22 Share capital
The share capital of the Company as at 31 December was as follows:2016
US$m2015
US$m
Authorised750,000,000 ordinary shares of US$0.020 each (2015: 750,000,000 ordinary shares of US$0.020 each) 15 15
Issued and fully paid345,912,747 ordinary shares of US$0.020 each (2015: 345,912,747 ordinary shares of US$0.020 each) 7 7
There was no movement in the number of issued and fully paid ordinary shares during the year.
The share capital comprises only one class of ordinary shares. The ordinary shares carry a voting right and the right to a dividend.
Share premium: The balance on the share premium account represents the amount received in excess of the nominal value of the ordinary shares.
Capital redemption reserve: The balance on the capital redemption reserve represents the aggregated nominal value of the ordinary shares repurchased and cancelled.
23 Treasury shares
For the purpose of making awards under the Group’s employee share schemes, shares in the Company are purchased and held by the Petrofac Employee Benefit Trust and the Petrofac Joint Venture Companies Employee Benefit Trust. All these shares have been classified in the consolidated statement of financial position as treasury shares within equity.
The movements in total treasury shares are shown below:2016 2015
Number US$m Number US$m
At 1 January 6,015,520 111 4,985,937 101Acquired during the year 2,673,796 36 2,800,000 39Vested during the year (2,756,842) (42) (1,770,417) (29)At 31 December 5,932,474 105 6,015,520 111
Shares vested during the year include dividend shares of 186,369 shares (2015: 105,365 shares).
156 / Petrofac Annual report and accounts 2016

24 Share-based payment plans
Performance Share Plan (PSP)Under the PSP, share awards are granted to Executive Directors and a restricted number of other senior executives of the Group. The shares vest at the end of three years subject to continued employment and the achievement of certain pre-defined market and non-market-based performance conditions. The 50% market performance based part of these awards is dependent on the total shareholder return (TSR) of the Group compared with an index composed of selected relevant companies. The fair value of the shares vesting under this portion of the award is determined by an independent valuer using a Monte Carlo simulation model taking into account the terms and conditions of the plan rules and using the following assumptions at the date of grant:
2016 awards
2015 awards
2014 awards
22 Mar 2013 awards
18 Apr 2013 awards
24 May 2013 awards
Expected share price volatility (based on median of comparator group’s three-year volatilities) 31.9% 28.5% 32.7% 34.6% 34.7% 33.9%Share price correlation with comparator group 28.9% 26.4% 40.4% 44.0% 44.3% 42.0%Risk-free interest rate 0.6% 0.7% 1.2% 0.4% 0.4% 0.5%Expected life of share award 3 years 3 years 3 years 3 years 3 years 3 yearsFair value of TSR portion 747p 562p 827p 692p 492p 571p
The non-market-based condition governing the vesting of the remaining 50% of the total award is subject to achieving between 0.0% and 7.5% earnings per share (EPS) growth targets over a three-year period. The fair values of the equity-settled award relating to the EPS part of the scheme are estimated, based on the quoted closing market price per Company share at the date of grant with an assumed vesting rate per annum built into the calculation (subsequently trued up at year end based on the actual leaver rate during the period from award date to year end) over the three-year vesting period of the plan. At 31 December 2016, the vesting conditions attached to PSP are not expected to be met, therefore the vesting rate is assumed to be 0.0%.
Deferred Bonus Share Plan (DBSP)Under the DBSP selected employees are required to defer a proportion of their annual cash bonus into Company shares (‘Invested Award’). Following such an award, the Company will generally grant the participant an additional award of a number of shares bearing a specified ratio to the number of his or her invested shares (‘Matching Shares’), typically using a 1:1 ratio. Subject to a participant’s continued employment, Invested and Matching Share awards may either vest 100% on the third anniversary of grant; or alternatively, vest one-third on the first anniversary of the grant, one-third on the second anniversary and the final proportion on the third anniversary.
At the year end the values of the bonuses settled by shares cannot be determined until the Remuneration Committee has approved the portion of the employee bonuses to be settled in shares. Once the portion of the bonus to be settled in shares is determined, the final bonus liability to be settled in shares is transferred to the reserve for share-based payments. The costs relating to the Matching Shares are recognised over the corresponding vesting period and the fair values of the equity-settled Matching Shares granted to employees are based on the quoted closing market price at the date of grant with the charge adjusted to reflect the expected vesting rate of the plan.
Share Incentive Plan (SIP)All UK employees, including UK Executive Directors, are eligible to participate in the SIP. Employees may invest up to sterling £1,800 per tax year of gross salary (or, if lower, 10% of salary) to purchase ordinary shares in the Company. There is no holding period for these shares.
Restricted Share Plan (RSP)Under the RSP, selected employees are made grants of shares on an ad hoc basis. The RSP is used primarily, but not exclusively, to make awards to individuals who join the Group part way through the year, having left accrued benefits with a previous employer. The fair values of the awards granted under the RSP at various grant dates during the year are based on the quoted market price at the date of grant adjusted for an assumed vesting rate over the relevant vesting period.
Value Creation Plan (VCP)During 2012 the Company introduced a one-off Value Creation Plan (VCP) which is a share option scheme for Executive Directors and key senior executives within the Company. VCP is a premium priced share option scheme with options granted with an exercise price set at a 10% premium to the grant date price. Options will only vest to the extent of satisfying Group and divisional profit after tax targets, together with various other performance underpins and risk/malus provisions that can be imposed at the discretion of the Remuneration Committee. The share options would vest in equal tranches on the fourth, fifth and sixth anniversaries of the original grant date but may be exercised up to eight years from the date of grant. During 2016, the vesting conditions attached to VCP were not met, therefore all outstanding shares under the plan were forfeited.
Petrofac Annual report and accounts 2016 / 157
Financial statem
ents

Notes to the consolidated financial statements continuedFor the year ended 31 December 2016
24 Share-based payment plans continued
Share-based payment plans informationThe details of the fair values and assumed vesting rates of the share-based payment plans are below:
PSP (EPS portion) DBSP RSP
6 March/22 March 18 April 6 October/24 May
Fair value per share
Assumed vesting rate
Fair value per share
Assumed vesting rate
Fair value per share
Assumed vesting rate
Fair value per share
Assumed vesting rate
Fair value per share
Assumed vesting rate
2016 awards 982p 0.0% – – 911p 0.0% 982p 93.2% 859p 95.0%2015 awards 890p 0.0% – – – – 890p 87.4% 927p 95.0%2014 awards 1,376p 0.0% – – – – 1,376p 80.1% 1,157p 76.5%2013 awards 1,446p 0.0% 1,266p 0.0% 1,340p 0.0% 1,446p 78.4% 1,366p 87.0%
The following table shows the movements in the number of shares held under the share-based payment plans outstanding but not exercisable:PSP DBSP RSP VCP Total
2016 Number
2015 Number
2016 *Number
2015 *Number
2016 Number
2015 Number
2016 Number
2015 Number
2016 Number
2015 Number
Outstanding at 1 January 1,484,976 1,139,931 5,352,633 3,822,196 268,345 357,363 839,495 1,354,828 7,945,449 6,674,318Granted during the year 751,664 775,188 2,560,678 3,460,960 312,262 67,719 – – 3,624,604 4,303,867Vested during the year – – (2,469,065) (1,579,408) (163,393) (123,213) – – (2,632,458) (1,702,621)Forfeited during the year (779,334) (430,143) (389,012) (351,115) (19,323) (33,524) (839,495) (515,333) (2,027,164) (1,330,115)Outstanding at 31 December 1,457,306 1,484,976 5,055,234 5,352,633 397,891 268,345 – 839,495 6,910,431 7,945,449
*Includes Invested and Matching Shares.
The number of shares still outstanding but not exercisable at 31 December 2016 for each award is as follows:
PSP DBSP RSP VCP Total
2016 Number
2015 Number
2016 *Number
2015 *Number
2016 Number
2015 Number
2016 Number
2015 Number
2016 Number
2015 Number
2016 awards 623,237 – 2,362,804 – 312,262 – – – 3,298,303 –2015 awards 567,548 735,364 1,848,146 3,235,692 45,154 67,719 – – 2,460,848 4,038,7752014 awards 266,521 368,627 844,284 1,391,665 40,475 68,273 – – 1,151,280 1,828,5652013 awards – 380,985 – 725,276 – 119,035 – – – 1,225,2962012 awards – – – – – 13,318 – 839,495 – 852,813Total awards 1,457,306 1,484,976 5,055,234 5,352,633 397,891 268,345 – 839,495 6,910,431 7,945,449
* Includes Invested and Matching Shares.
The average share price of the Company shares during 2016 was US$11.03, sterling equivalent of £8.18 (2015: US$12.84, sterling equivalent of £8.39).
The number of outstanding shares excludes the 8% uplift adjustment made in respect of the EnQuest demerger and dividend shares shown below:PSP DBSP RSP Total
2016 Number
2015 Number
2016 *Number
2015 *Number
2016 Number
2015 Number
2016 Number
2015 Number
EnQuest 8% uplift – – 318 318 83 83 401 401
Dividend shares 134,947 105,633 471,745 358,476 14,405 13,527 621,097 477,636Outstanding at 31 December 134,947 105,633 472,063 358,794 14,488 13,610 621,498 478,037
* Includes Invested and Matching Shares.
158 / Petrofac Annual report and accounts 2016
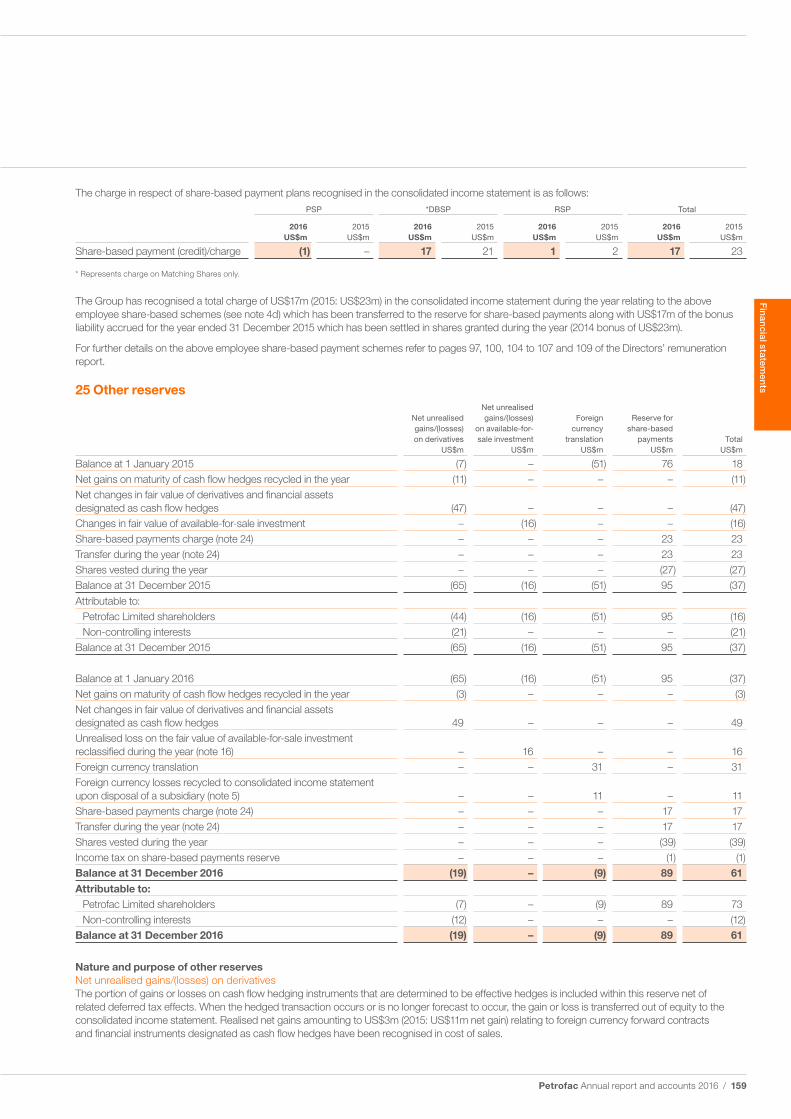
The charge in respect of share-based payment plans recognised in the consolidated income statement is as follows:PSP *DBSP RSP Total
2016 US$m
2015 US$m
2016 US$m
2015 US$m
2016 US$m
2015 US$m
2016 US$m
2015 US$m
Share-based payment (credit)/charge (1) – 17 21 1 2 17 23
* Represents charge on Matching Shares only.
The Group has recognised a total charge of US$17m (2015: US$23m) in the consolidated income statement during the year relating to the above employee share-based schemes (see note 4d) which has been transferred to the reserve for share-based payments along with US$17m of the bonus liability accrued for the year ended 31 December 2015 which has been settled in shares granted during the year (2014 bonus of US$23m).
For further details on the above employee share-based payment schemes refer to pages 97, 100, 104 to 107 and 109 of the Directors’ remuneration report.
25 Other reserves
Net unrealised gains/(losses) on derivatives
US$m
Net unrealised gains/(losses)
on available-for-sale investment
US$m
Foreign currency
translation US$m
Reserve for share-based
payments US$m
Total US$m
Balance at 1 January 2015 (7) – (51) 76 18Net gains on maturity of cash flow hedges recycled in the year (11) – – – (11)Net changes in fair value of derivatives and financial assets designated as cash flow hedges (47) – – – (47)Changes in fair value of available-for-sale investment – (16) – – (16)Share-based payments charge (note 24) – – – 23 23Transfer during the year (note 24) – – – 23 23Shares vested during the year – – – (27) (27)Balance at 31 December 2015 (65) (16) (51) 95 (37)
Attributable to:Petrofac Limited shareholders (44) (16) (51) 95 (16)Non-controlling interests (21) – – – (21)
Balance at 31 December 2015 (65) (16) (51) 95 (37)
Balance at 1 January 2016 (65) (16) (51) 95 (37)Net gains on maturity of cash flow hedges recycled in the year (3) – – – (3)Net changes in fair value of derivatives and financial assets designated as cash flow hedges 49 – – – 49Unrealised loss on the fair value of available-for-sale investment reclassified during the year (note 16) – 16 – – 16Foreign currency translation – – 31 – 31Foreign currency losses recycled to consolidated income statement upon disposal of a subsidiary (note 5) – – 11 – 11Share-based payments charge (note 24) – – – 17 17Transfer during the year (note 24) – – – 17 17Shares vested during the year – – – (39) (39)Income tax on share-based payments reserve – – – (1) (1)Balance at 31 December 2016 (19) – (9) 89 61Attributable to:
Petrofac Limited shareholders (7) – (9) 89 73Non-controlling interests (12) – – – (12)
Balance at 31 December 2016 (19) – (9) 89 61
Nature and purpose of other reservesNet unrealised gains/(losses) on derivativesThe portion of gains or losses on cash flow hedging instruments that are determined to be effective hedges is included within this reserve net of related deferred tax effects. When the hedged transaction occurs or is no longer forecast to occur, the gain or loss is transferred out of equity to the consolidated income statement. Realised net gains amounting to US$3m (2015: US$11m net gain) relating to foreign currency forward contracts and financial instruments designated as cash flow hedges have been recognised in cost of sales.
Petrofac Annual report and accounts 2016 / 159
Financial statem
ents

Notes to the consolidated financial statements continuedFor the year ended 31 December 2016
25 Other reserves continued
The forward currency points element and ineffective portion of derivative financial instruments relating to forward currency contracts and losses on undesignated derivatives amounting to US$1m (2015: US$3m) have been recognised in cost of sales.
Net unrealised gains/(losses) on available-for-sale investmentThis reserve records fair value changes on available-for-sale investment held by the Group, net of deferred tax effects. Realised gains and losses on the sale of available-for-sale investment are recognised as other operating income or other operating expenses in the consolidated income statement. Unrealised losses that are considered to be impairment are recognised as exceptional items in the consolidated income statement.
Foreign currency translation reserveThe foreign currency translation reserve is used to record exchange differences arising from the translation of the financial statements in foreign subsidiaries. It is also used to record exchange differences arising on monetary items that form part of the Group’s net investment in subsidiaries.
Reserve for share-based paymentsThe reserve for share-based payments is used to record the value of equity-settled share-based payments awarded to employees and transfers out of this reserve are made upon vesting of the original share awards.
The transfer during the year reflects the transfer from accrued expenses within trade and other payables of the bonus liability relating to the year ended 2015 of US$17m (2014 bonus of US$23m) which has been voluntarily elected or mandatorily obliged to be settled in shares during the year (note 24).
26 Interest-bearing loans and borrowings
The Group had the following interest-bearing loans and borrowings outstanding:31 December 2016
Actual interest rate %31 December 2015
Actual interest rate %Effective interest
rate % Maturity1
2016 US$m
2015 US$m
CurrentBank overdrafts (i) US/UK LIBOR +
1.50%US/UK LIBOR +
1.50%US/UK LIBOR +
1.50%on demand 44 3
Term loans (iii) US LIBOR + 1.25%EIBOR + 1.25%
US LIBOR + 0.85% US LIBOR + 1.25%EIBOR + 1.25%
August 2017 300 500
Export Credit Agency funding(SACE and UKEF Facility)
(v) US LIBOR + 1.50%US LIBOR + 0.70%
US LIBOR + 1.50% US LIBOR + 1.50%US LIBOR + 0.70%
Refer note (v) 17 17
361 520
Non-currentSenior Notes (ii) 3.40% 3.40% 3.68% 2 years 677 750Revolving Credit Facility (RCF) (iv) US LIBOR + 1.00% US LIBOR + 0.95% US LIBOR + 1.00% 4 years 645 540Export Credit Agency funding (SACE and UKEF Facility)
(v) US LIBOR + 1.50%US LIBOR + 0.70%
US LIBOR + 1.50% US LIBOR + 1.50%US LIBOR + 0.70%
Refer note (v) 123 –
1,445 1,290Less:Debt acquisition costs net of accumulated amortisation and effective interest rate adjustments (22) (20)
1,423 1,270Total interest-bearing loans and borrowings 1,784 1,790
1 As at 31 December 2016.
160 / Petrofac Annual report and accounts 2016

Details of the Group’s interest-bearing loans and borrowings are as follows:
(i) Bank overdraftsBank overdrafts are drawn down in United States dollar and sterling denominations to meet the Group’s working capital requirements. These are repayable on demand.
(ii) Senior NotesPetrofac has an outstanding aggregate principal amount of US$677m Senior Notes due in 2018 (Notes). During the year the Company redeemed US$73m of its Notes and recognised a gain thereon of US$1m (2015: US$nil). The Group pays interest on the Notes at an annual rate equal to 3.40% of the outstanding principal amount. Interest on the Notes is payable semi-annually in arrears in April and October each year. The Notes are senior unsecured obligations of the Company and will rank equally in right of payment with the Company’s other existing and future unsecured and unsubordinated indebtedness. Petrofac International Ltd and Petrofac International (UAE) LLC irrevocably and unconditionally guarantee, jointly and severally, the due and prompt payment of all amounts at any time becoming due and payable in respect of the Notes. The Guarantees are senior unsecured obligations of each Guarantor and will rank equally in right of payment with all existing and future senior unsecured and unsubordinated obligations of each Guarantor.
(iii) Term loansOn 31 August 2014, Petrofac entered into a US$500m two-year term loan facility with a syndicate of five international banks. The facility matured on 31 August 2016 and was repaid in full on 15 August 2016. The repayment was partly financed with the proceeds of two new term loans of US$200m and AED368m. These two new facilities will mature in August 2017. The loans were fully drawn as of 31 December 2016 (2015: US$500m).
Interest is payable on the US$200m facility at US LIBOR + 1.25%.
Interest payable on the AED368m facility at EIBOR + 1.25%.
(iv) Revolving Credit FacilityPetrofac has a US$1,200m five-year committed Revolving Credit Facility with a syndicate of international banks, which is available for general corporate purposes. The facility, which was signed on 11 September 2012, was amended and extended in June 2015 and will now mature on 2 June 2020. The facility is unsecured and is subject to two financial covenants relating to leverage and interest cover. Petrofac was in compliance with these covenants for the year ending 31 December 2016. As at 31 December 2016, US$645m was drawn under this facility (2015: US$540m).
Interest is payable on the drawn balance of the facility at US LIBOR + 1.00% and in addition utilisation fees are payable depending on the level of utilisation.
Petrofac signed another Revolving Credit Facility for US$50m on 7 November 2016 on substantially the same terms and conditions as the US$1,200m facility. As at 31 December 2016, the facility was fully unutilised. Interest is payable on the drawn balance of the facility at US LIBOR + 1.25% and in addition utilisation fees are payable on the amounts utilised.
(v) Export Credit Agency fundingOn 26 February 2015, Petrofac entered into a US$58m, term loan facility guaranteed by the Italian Export Credit Agency SACE. On 30 July 2015, Petrofac entered into a US$108m term loan facility guaranteed by the UK Export Credit Agency UKEF, on substantially the same terms as the SACE facility. The two facilities were linked to the procurement of certain goods and services from Italian and UK exporters, respectively, in connection with the construction of the Petrofac JSD6000 vessel. Both facilities were amended in 2016 to remove references to the Petrofac JSD6000 vessel. Each facility amortises over eight and a half years from 2017. As at 31 December 2016, US$54m was drawn under the SACE facility (2015: US$17m) and US$86m was drawn under the UKEF facility (2015: US$nil).
Interest is payable on the SACE Facility and UKEF Facility at US LIBOR + 1.50% and US LIBOR + 0.70%, respectively.
Petrofac Annual report and accounts 2016 / 161
Financial statem
ents

Notes to the consolidated financial statements continuedFor the year ended 31 December 2016
27 Provisions Other long-term
employment benefits provision
US$m
Provision for decommissioning
US$m
Other provisions
US$mTotal
US$m
At 1 January 2015 79 189 5 273Additions during the year 22 45 2 69Paid during the year (7) – – (7)Revision of estimates – (8) – (8)Unwinding of discount – 4 – 4At 1 January 2016 94 230 7 331Additions during the year 24 – 1 25Paid during the year (17) – – (17)Revision of estimates – (101) – (101)Unwinding of discount – 8 – 8Transfer to liabilities associated with assets held for sale (note 13) – (21) – (21)Exchange difference – – (1) (1)At 31 December 2016 101 116 7 224
Other long-term employment benefits provisionLabour laws in the United Arab Emirates require employers to provide for other long-term employment benefits. These benefits are payable to employees on being transferred to another jurisdiction or on cessation of employment based on their final salary and number of years’ service. All amounts are unfunded. The long-term employment benefits provision is based on an internally produced end of service benefits valuation model with the key underlying assumptions being as follows:
Senior employees
Other employees
Average number of years of future service 5 3Average annual % salary increases 6% 4%Discount factor 5% 5%
Senior employees are those earning a base of salary of over US$96,000 per annum.
Discount factor used is the local Dubai five-year Sukuk rate.
Provision for decommissioningThe decommissioning provision primarily relates to the Group’s obligation for the removal of facilities and restoration of the sites at the PM304 field in Malaysia, Chergui in Tunisia and Santuario, Magallanes, Arenque and Pánuco Production Enhancement Contracts in Mexico. Revision to decommissioning cost estimates of US$101m (note 10) were made during the year in respect of Santuario, Magallanes, Arenque and Pánuco Production Enhancement Contracts in Mexico of US$97m and PM304 field in Malaysia of US$4m (2015: additions of US$40m in relation to Santuario, Magallanes, Arenque and Pánuco Production Enhancement Contracts in Mexico). The liability is discounted at the rate of 4.45% on PM304 (2015: 4.28%), 6.0% on Chergui (2015: 6.00%) and 6.18% on Santuario, Magallanes, Arenque and Pánuco Production Enhancement Contracts (2015: 6.18%). The unwinding of the discount is classified as a finance cost (note 6). The Group estimates that the cash outflows against these provisions will arise in 2026 on PM304, 2031 on Chergui, 2033 on Santuario and Magallanes, 2040 on Arenque and 2039 on Pánuco Production Enhancement Contracts.
Other provisionsThis represents amounts set aside to cover claims against the Group which will be settled via the captive insurance company Jermyn Insurance Company Limited.
162 / Petrofac Annual report and accounts 2016

28 Trade and other payables2016
US$m2015
US$m
Trade payables 538 485Advances received from customers 703 1,102Accrued expenses 546 772Other taxes payable 30 34Other payables 157 117
1,974 2,510
At 31 December 2016, trade and other payables of US$13m were reclassified to liabilities associated with assets held for sale (note 13).
Advances received from customers represent payments received for contracts on which the related work had not been performed at the statement of financial position date.
Other payables mainly consist of retentions held against subcontractors of US$88m (2015: US$71m) and amounts payable to joint venture partners of US$27m (2015: US$23m).
Certain trade and other payables will be settled in currencies other than the reporting currency of the Group, mainly in sterling, euros and Kuwaiti dinars.
29 Commitments and contingencies
CommitmentsIn the normal course of business the Group will obtain surety bonds, letters of credit and guarantees, which are contractually required to secure performance, advance payment or in lieu of retentions being withheld. Some of these facilities are secured by issue of corporate guarantees by the Company in favour of the issuing banks.
At 31 December 2016, the Group had no outstanding letters of credit (2015: US$7m) and had outstanding letters of guarantee, including performance, advance payments and bid bonds of US$4,862m (2015: US$4,974m) against which the Group had pledged or restricted cash balances of, in aggregate, US$47m (2015: US$37m).
At 31 December 2016, the Group had outstanding forward exchange contracts amounting to US$3,754m (2015: US$3,592m). These commitments consist of future obligations either to acquire or to sell designated amounts of foreign currency at agreed rates and value dates (note 32).
LeasesThe Group has financial commitments in respect of non-cancellable operating leases for office space and equipment. These non-cancellable leases have remaining non-cancellable lease terms of between one and 16 years and, for certain property leases, are subject to renegotiation at various intervals as specified in the lease agreements. The future minimum rental commitments under these non-cancellable leases are as follows:
2016 US$m
2015 US$m
Within one year 14 29After one year but not more than five years 21 56More than five years 76 60
111 145
Included in the above are commitments relating to the lease of office buildings in Aberdeen, United Kingdom of US$70m (2015: US$86m).
Minimum lease payments recognised as an operating lease expense during the year amounted to US$53m (2015: US$47m).
Long-term finance lease commitments are as follows:Future minimum lease payments
US$mFinance cost
US$mPresent value
US$m
Oil and gas facilities and plant and equipmentThe commitments are as follows:Within one year 305 45 260After one year but not more than five years 379 70 309More than five years 37 10 27
721 125 596
The finance lease assets mainly comprise oil and gas facilities in Block PM304 in Malaysia and the lease terms for these leases range between two to eight years. The above finance lease commitments include 70% gross up of US$414m (2015: US$485m) on finance leases in respect of oil and gas facilities relating to block PM304 in Malaysia, which is necessary to reflect the legal position of the Group as the contracting entity for these leases.
Petrofac Annual report and accounts 2016 / 163
Financial statem
ents

Notes to the consolidated financial statements continuedFor the year ended 31 December 2016
29 Commitments and contingencies continued
Capital commitmentsAt 31 December 2016, the Group had capital commitments of US$264m (2015: US$500m) excluding the above lease commitments.
Included in the US$264m of commitments are:2016
US$m2015
US$m
Building of the Petrofac JSD6000 installation vessel 50 93Production Enhancement Contracts in Mexico 7 3Further appraisal and development of wells as part of Block PM304 in Malaysia 38 240Costs in respect of Ithaca Greater Stella Field development in the North Sea 163 164Commitments in respect of the construction of a new training centre in Oman 6 –
Other matterAs described in pages 68, 79 and 87 of the Annual Report, the Company has undertaken an internal investigation during the year in relation to press allegations involving the Company’s relationship with Unaoil. While the Company’s investigation did not find evidence confirming the payment of bribes, the consequences of the Company’s disclosures to the SFO will be decided by the Regulatory authorities and it is currently unclear if any further investigation involving the Company will be undertaken. Therefore, at the date of this report, no liability has been recorded in relation to this matter. The existence of a future obligation, and the timing and amount of any future financial effect, are unable to be determined.
30 Related party transactions
The consolidated financial statements include the financial statements of Petrofac Limited and the subsidiaries listed in note 33. Petrofac Limited is the ultimate parent entity of the Group.
The following table provides the total amount of transactions which have been entered into with related parties:Amounts owed
by related parties US$m
Amounts owed to related
parties US$m
Joint ventures 2016 3 –2015 – –
Associates 2016 1 –2015 2 1
All sales to and purchases from related parties are made at normal market prices and the pricing policies and terms of these transactions are approved by the Group’s management. There were no sales to and purchases from related parties during the year (2015: US$nil).
All related party balances will be settled in cash.
Compensation of key management personnelThe following details remuneration of key management personnel of the Group comprising Executive and Non-executive Directors of the Company and other senior personnel. Further information relating to the individual Directors is provided in the Directors’ remuneration report on pages 91 to 110.
2016 US$m
2015 US$m
Short-term employee benefits 12 9Share-based payments 1 1Fees paid to Non-executive Directors 1 1
14 11
31 Accrued contract expenses2016
US$m2015
US$m
Accrued contract expenses 2,022 1,162Reserve for contract losses 38 71
2,060 1,233
At 31 December 2016, the reserve for contract losses mainly includes US$20m relating to the Laggan-Tormore contract, US$5m relating to the Ticleni Production Enhancement Contract in Romania and onerous leasehold property provision of US$9m relating to vacant leasehold office buildings at Quattro House and Bridge View in Aberdeen, UK (2015: US$48m relating to the Laggan-Tormore contract, US$12m relating to Ticleni Production Enhancement Contract in Romania, US$2m relating to reduction in scope of construction work at a training centre in Oman in IES segment and an onerous leasehold property provision of US$9m relating to vacant leasehold office buildings at Quattro House and Bridge View in Aberdeen, UK in Engineering & Production Services).
164 / Petrofac Annual report and accounts 2016

32 Risk management and financial instruments
Risk management objectives and policiesThe Group’s principal financial assets and liabilities, other than derivatives, comprise available-for-sale investment, trade and other receivables, amounts due from/to related parties, cash and short-term deposits, work-in-progress, interest-bearing loans and borrowings, trade and other payables and contingent consideration.
The Group’s activities expose it to various financial risks particularly associated with interest rate risk on its variable rate cash and short-term deposits, loans and borrowings and foreign currency risk on conducting business in currencies other than reporting currency as well as translation of the assets and liabilities of foreign operations to the reporting currency. These risks are managed from time to time by using a combination of various derivative instruments, principally forward currency contracts in line with the Group’s hedging policies. The Group has a policy not to enter into speculative trading of financial derivatives.
The Board of Directors of the Company has established an Audit Committee to help identify, evaluate and manage the significant financial risks faced by the Group and its activities are discussed in detail on pages 84 to 90.
The other main risks besides interest rate and foreign currency risk arising from the Group’s financial instruments are credit risk, liquidity risk and commodity price risk and the policies relating to these risks are discussed in detail below:
Interest rate riskInterest rate risk arises from the possibility that changes in interest rates will affect the value of the Group’s interest-bearing financial liabilities and assets.
The Group’s exposure to market risk arising from changes in interest rates relates primarily to the Group’s long-term variable rate debt obligations and its cash and bank balances. The Group’s policy is to manage its interest cost using a mix of fixed and variable rate debt. The Group’s cash and bank balances are at floating rates of interest.
Interest rate sensitivity analysisThe impact on the Group’s pre-tax profit and equity due to a reasonably possible change in interest rates on loans and borrowings at the reporting date is demonstrated in the table below. The analysis assumes that all other variables remain constant.
Pre-tax profit Equity
100 basis point increase
US$m
100 basis point decrease
US$m
100 basis point increase
US$m
100 basis point decrease
US$m
31 December 2016 (18) 18 – –31 December 2015 (7) 7 – –
The following table reflects the maturity profile of these financial liabilities and assets that are subject to interest rate risk:
Year ended 31 December 2016Within 1 year US$m
1–2 years
US$m
2–3 years
US$m
3–4 years
US$m
4–5 years
US$m
More than 5 years US$m
Total
US$m
Financial liabilitiesFloating rates Bank overdrafts (note 26) 44 – – – – – 44Interest-bearing loans and borrowings (note 26) 317 16 16 661 16 59 1,085
361 16 16 661 16 59 1,129Financial assetsFloating ratesCash and short-term deposits (note 21) 1,167 – – – – – 1,167Restricted cash balances (note 17) 6 40 – – 1 – 47
1,173 40 – – 1 – 1,214
Petrofac Annual report and accounts 2016 / 165
Financial statem
ents

Notes to the consolidated financial statements continuedFor the year ended 31 December 2016
32 Risk management and financial instruments continued
Year ended 31 December 2015Within 1 year US$m
1–2 years
US$m
2–3 years
US$m
3–4 years
US$m
4–5 years
US$m
More than 5 years US$m
Total
US$m
Financial liabilitiesFloating rates Bank overdrafts (note 26) 3 – – – – – 3Interest-bearing loans and borrowings (note 26) 517 – – – 540 – 1,057
520 – – – 540 – 1,060
Financial assetsFloating ratesCash and short-term deposits (note 21) 1,104 – – – – – 1,104Restricted cash balances (note 17) 36 – 41 – – – 77
1,140 – 41 – – – 1,181
Financial liabilities in the above table are disclosed gross of debt acquisition costs, effective interest rate adjustments and discount on Senior Notes of US$22m (2015: US$20m).
Interest on financial instruments classified as floating rate is re-priced at intervals of less than one year. The other financial instruments of the Group that are not included in the above tables are non-interest bearing and are therefore not subject to interest rate risk.
Foreign currency riskThe Group is exposed to foreign currency risk on sales, purchases, and translation of assets and liabilities that are in a currency other than the functional currency of its operating units. The Group is also exposed to the translation of the functional currencies of its units to the United States dollar reporting currency of the Group. The following table summarises the percentage of foreign currency denominated revenues, costs, financial assets and financial liabilities, expressed in United States dollar terms, of the Group totals.
2016 % of foreign
currency denominated
items
2015 % of foreign
currency denominated
items
Revenues 17.1% 19.4%Costs 28.0% 47.8%Current financial assets 18.8% 18.0%Non-current financial assets 13.1% 0.0%Current financial liabilities 30.2% 24.9%Non-current financial liabilities 0.0% 0.0%
The Group uses forward currency contracts to manage the currency exposure on transactions significant to its operations. It is the Group’s policy not to enter into forward contracts until a highly probable forecast transaction is in place and to negotiate the terms of the derivative instruments used for hedging to match the terms of the hedged item to maximise hedge effectiveness.
Foreign currency sensitivity analysisThe income statements of foreign operations are translated into the reporting currency using a weighted average exchange rate of conversion. Foreign currency monetary items are translated using the closing rate at the reporting date. Revenues and costs in currencies other than the functional currency of an operating unit are recorded at the prevailing rate at the date of the transaction. The following significant exchange rates applied during the year in relation to United States dollars:
2016 2015
Average rate Closing rate Average rate Closing rate
Sterling 1.35 1.23 1.53 1.47Kuwaiti dinar 3.30 3.27 3.32 3.29Euro 1.10 1.05 1.11 1.09
The following table summarises the impact on the Group’s pre-tax profit and equity (due to change in the fair value of monetary assets, liabilities and derivative instruments) of a reasonably possible change in United States dollar exchange rates with respect to different currencies:
Pre-tax profit Equity
+10% US dollar rate
increase US$m
−10% US dollar rate
decrease US$m
+10% US dollar rate
increase US$m
−10% US dollar rate decrease
US$m
31 December 2016 (6) 6 (29) 2931 December 2015 (24) 24 53 (53)
166 / Petrofac Annual report and accounts 2016

Derivative instruments designated as cash flow hedgesAt 31 December, the Group had foreign exchange forward contracts as follows:
Contract value Fair value (undesignated) Fair value (designated) Net unrealised gain/(loss)
2016 US$m
2015 US$m
2016 US$m
2015 US$m
2016 US$m
2015 US$m
2016 US$m
2015 US$m
Euro purchases 241 997 (2) – 2 27 11 (31)Sterling sales (278) (225) 4 11 (2) (1) (16) (10)Kuwaiti dinar sales (1,966) (1,095) (1) – (29) 2 24 8Malaysia ringgit purchases 85 115 – – (15) (18) (18) (22)Japanese yen purchases/(sales) 59 (3) – – (5) – (4) –Arab Emirates dirham purchases 102 – – – – – – –Indian rupee purchases 7 – – – – – – – Saudi riyal purchases – 38 – – – – – –
1 11 (49) 10 (3) (55)
The above foreign exchange contracts mature and will affect income between January 2017 and June 2019 (2015: between January 2016 and June 2019).
At 31 December 2016, the Group had cash and short-term deposits designated as cash flow hedges with net unrealised losses of US$2m (2015: US$3m loss) as follows:
Fair value Net unrealised loss
2016 US$m
2015 US$m
2016 US$m
2015 US$m
Euro cash and short-term deposits 18 17 (1) (3)Sterling cash and short-term deposits 6 – (1) –
During 2016, changes in fair value gain of US$54m (2015: loss of US$64m) relating to these derivative instruments and financial assets were taken to equity and loss of US$7m (2015: losses of US$13m) were recycled from equity into cost of sales in the consolidated income statement. The forward points and ineffective portions of the above foreign exchange forward contracts and loss on undesignated derivatives of US$1m (2015: US$3m) were recognised in the consolidated income statement (note 4b).
Commodity price risk – oil pricesThe Group is exposed to the impact of changes in oil and gas prices on its revenues and profits generated from sales of crude oil and gas. The Group’s policy is to manage its exposure to the impact of changes in oil and gas prices using derivative instruments, primarily swaps and collars. Hedging is only undertaken once sufficiently reliable and regular long-term forecast production data is available.
During the year the Group entered into various crude oil swaps hedging oil production of 174,875 barrels (bbl) (2015: 754,097 bbl) with maturities ranging from January 2017 to March 2017. No fuel oil swaps contracts were outstanding at 31 December 2016 (2015: 39,292 metric tonnes).
The fair value of oil derivatives at 31 December 2016 was a liability of US$2m (2015: US$12m asset) with net unrealised gains deferred in equity of US$2m (2015: US$12m gain). During the year, a US$10m gain (2015: US$24m gain) was recycled from equity into the consolidated income statement on the occurrence of the hedged transactions and a loss in the fair value recognised in equity of US$5m (2015: US$17m gain).
The following table summarises the impact on the Group’s pre-tax profit and equity (due to a change in the fair value of oil derivative instruments and the underlifting asset/overlifting liability) of a reasonably possible change in the oil price:
Pre-tax profit Equity
+30 US$/bbl increase
US$m
−30 US$/bbl
decrease US$m
+30 US$/bbl
increase US$m
−30 US$/bbl
decrease US$m
31 December 2016 – – (5) 531 December 2015 – – (24) 24
For sensitivity relating to the impact of changes in the oil price on other financial assets, refer to pages 152 and 154.
Petrofac Annual report and accounts 2016 / 167
Financial statem
ents

Notes to the consolidated financial statements continuedFor the year ended 31 December 2016
Credit riskThe Group trades only with recognised, creditworthy third parties. Business Unit Risk Review Committees (BURRC) evaluate the creditworthiness of each individual third party at the time of entering into new contracts. Limits have been placed on the approval authority of the BURRC above which the approval of the Board of Directors of the Company is required. Receivable balances are monitored on an ongoing basis with appropriate follow-up action taken where necessary. At 31 December 2016, the Group’s five largest customers accounted for 56.9% of outstanding trade receivables, retention receivables, work in progress, receivable under Berantai RSC and receivable in respect of the development of the Greater Stella Area (2015: 46.5%).
With respect to credit risk arising from the other financial assets of the Group, which comprise cash and cash equivalents, short and long-term receivables from customers (including the Berantai RSC and Greater Stella Area projects), available-for-sale investment and certain derivative instruments, the Group’s exposure to credit risk arises from default of the counterparty, with a maximum exposure equal to the carrying amount of these instruments.
Liquidity riskThe Group’s objective is to ensure sufficient liquidity is available to support future growth. Our strategy includes the provision of financial capital and the potential impact on the Group’s capital structure is reviewed regularly. The Group is not exposed to any external capital constraints. The maturity profiles of the Group’s financial liabilities at 31 December are as follows:
Year ended 31 December 2016
6 months or less US$m
6–12 months US$m
1–2 years
US$m
2–5 years
US$mMore than
5 years US$m
Contractual undiscounted
cash flows US$m
Carrying amount
US$m
Financial liabilitiesInterest-bearing loans and borrowings 21 340 693 693 59 1,806 1,784Finance lease creditors 221 84 238 141 37 721 596Trade and other payables (excluding advances from customers and other taxes payable) 1,200 41 – – – 1,241 1,241Derivative instruments 60 34 12 – – 106 106Interest payments 22 22 49 33 9 135 –
1,524 521 992 867 105 4,009 3,727
Year ended 31 December 2015
6 months or less US$m
6–12 months
US$m
1–2 years
US$m
2–5 years
US$m
More than 5 years US$m
Contractual undiscounted
cash flows US$m
Carrying amount
US$m
Financial liabilitiesInterest-bearing loans and borrowings 20 500 – 1,290 – 1,810 1,790Finance lease creditors 237 113 214 439 233 1,236 870Trade and other payables (excluding advances from customers and other taxes payable) 1,323 51 – – – 1,374 1,374Due to related parties 1 – – – – 1 1Derivative instruments 53 14 21 7 – 95 95Interest payments 24 23 29 33 – 109 –
1,658 701 264 1,769 233 4,625 4,130
The Group uses various funded facilities provided by banks and its own financial assets to fund the above mentioned financial liabilities.
Capital managementThe Group’s policy is to maintain a healthy capital base to sustain future growth and maximise shareholder value.
The Group seeks to optimise shareholder returns by maintaining a balance between debt and equity attributable to Petrofac Limited shareholders (capital) and monitors the efficiency of its capital structure on a regular basis. The gearing ratio and return on shareholders’ equity is as follows:
2016 US$m
2015 US$m
Cash and short-term deposits 1,167 1,104Interest-bearing loans and borrowings (A) (1,784) (1,790)Net debt (B) (617) (686)
Equity attributable to Petrofac Limited shareholders (C) 1,097 1,230Profit/(loss) for the year attributable to Petrofac Limited shareholders (D) 1 (349)Gross gearing ratio (A/C) 162.6% 145.5%Net gearing ratio (B/C) 56.2% 55.8%Shareholders’ return on investment (D/C) 0.1% (28.4%)
168 / Petrofac Annual report and accounts 2016

33 Subsidiaries, associates and joint arrangements
At 31 December 2016, the Group had investments in the following active subsidiaries, associates and joint arrangements:Proportion of nominal value of issued shares
controlled by the GroupName of company Country of incorporation 2016 2015
Active subsidiariesPetrofac Algeria EURL Algeria 100 100Petrofac International (Bahrain) S.P.C. Bahrain 100 –Petrofac (Cyprus) Limited Cyprus 100 100Eclipse Petroleum Technology Limited England 100 100K W Limited England 100 100Oilennium Limited England 100 100Petrofac (Malaysia-PM304) Limited England 100 100Petrofac Contracting Limited England 100 100Petrofac Engineering Limited England 100 100Petrofac Services Limited England 1100 1100PetroHealth Limited England 100 –Petrofac Treasury UK Limited England 1100 –Petrofac UK Holdings Limited England 1100 1100The New Energy Industries Limited England – 100Caltec Limited England 100 100Petrofac Energy Developments UK Limited England 1100 1100Petrofac Deutschland GmbH Germany 100 100Jermyn Insurance Company Limited Guernsey 1100 1100Petrofac Engineering India Private Limited India 100 100Petrofac Engineering Services India Private Limited India 100 100Petrofac Information Services Private Limited India 100 100PT. Petrofac IKPT International Indonesia 72 51Petrofac Integrated Energy Services Limited Jersey 1100 1100Petrofac Energy Developments (Ohanet) Jersey Limited Jersey 100 100Petrofac Energy Developments International Limited Jersey 1100 1100Petrofac Facilities Management International Limited Jersey 1100 1100Petrofac FPF004 Limited Jersey 100 100Petrofac GSA Holdings Limited (formerly Petrofac Energy Development West Africa Limited) Jersey 1100 1100Petrofac GSA Limited Jersey 100 100Petrofac International Ltd Jersey 1100 1100Petrofac Offshore Management Limited Jersey 100 100Petrofac Platform Management Services Limited Jersey 100 100Petrofac Training International Limited Jersey 1100 1100Petroleum Facilities E & C Limited Jersey 1100 1100Petrofac (JSD 6000) Limited Jersey 100 100Petrofac E&C Sdn Bhd Malaysia 100 100Petrofac Energy Developments Sdn Bhd Malaysia 100 100Petrofac Engineering Services (Malaysia) Sdn Bhd Malaysia 70 70PFMAP Sdn Bhd Malaysia 100 100SPD Well Engineering Sdn Bhd Malaysia 249 249
Petrofac Annual report and accounts 2016 / 169
Financial statem
ents
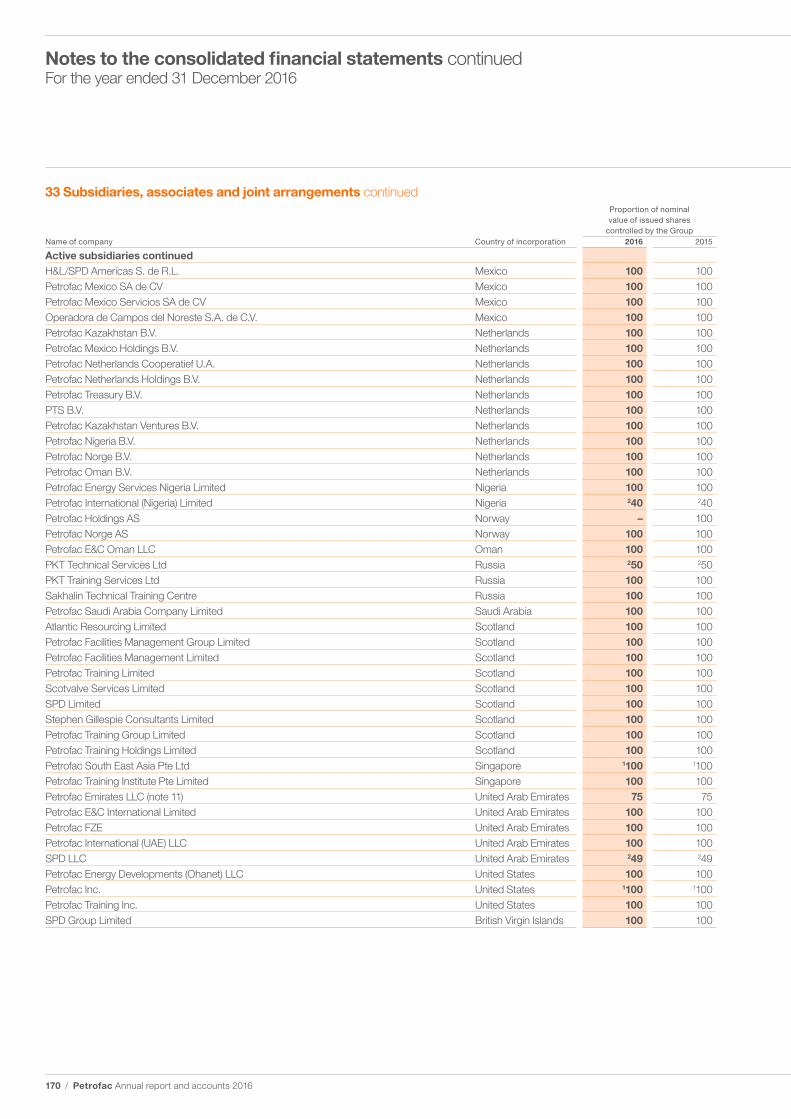
Notes to the consolidated financial statements continuedFor the year ended 31 December 2016
33 Subsidiaries, associates and joint arrangements continuedProportion of nominal value of issued shares
controlled by the GroupName of company Country of incorporation 2016 2015
Active subsidiaries continuedH&L/SPD Americas S. de R.L. Mexico 100 100Petrofac Mexico SA de CV Mexico 100 100Petrofac Mexico Servicios SA de CV Mexico 100 100Operadora de Campos del Noreste S.A. de C.V. Mexico 100 100Petrofac Kazakhstan B.V. Netherlands 100 100Petrofac Mexico Holdings B.V. Netherlands 100 100Petrofac Netherlands Cooperatief U.A. Netherlands 100 100Petrofac Netherlands Holdings B.V. Netherlands 100 100Petrofac Treasury B.V. Netherlands 100 100PTS B.V. Netherlands 100 100Petrofac Kazakhstan Ventures B.V. Netherlands 100 100Petrofac Nigeria B.V. Netherlands 100 100Petrofac Norge B.V. Netherlands 100 100Petrofac Oman B.V. Netherlands 100 100Petrofac Energy Services Nigeria Limited Nigeria 100 100Petrofac International (Nigeria) Limited Nigeria 240 240Petrofac Holdings AS Norway – 100Petrofac Norge AS Norway 100 100Petrofac E&C Oman LLC Oman 100 100PKT Technical Services Ltd Russia 250 250PKT Training Services Ltd Russia 100 100Sakhalin Technical Training Centre Russia 100 100Petrofac Saudi Arabia Company Limited Saudi Arabia 100 100Atlantic Resourcing Limited Scotland 100 100Petrofac Facilities Management Group Limited Scotland 100 100Petrofac Facilities Management Limited Scotland 100 100Petrofac Training Limited Scotland 100 100Scotvalve Services Limited Scotland 100 100SPD Limited Scotland 100 100Stephen Gillespie Consultants Limited Scotland 100 100Petrofac Training Group Limited Scotland 100 100Petrofac Training Holdings Limited Scotland 100 100Petrofac South East Asia Pte Ltd Singapore 1100 1100Petrofac Training Institute Pte Limited Singapore 100 100Petrofac Emirates LLC (note 11) United Arab Emirates 75 75Petrofac E&C International Limited United Arab Emirates 100 100Petrofac FZE United Arab Emirates 100 100Petrofac International (UAE) LLC United Arab Emirates 100 100SPD LLC United Arab Emirates 249 249Petrofac Energy Developments (Ohanet) LLC United States 100 100Petrofac Inc. United States 1100 1100Petrofac Training Inc. United States 100 100SPD Group Limited British Virgin Islands 100 100
170 / Petrofac Annual report and accounts 2016

AssociatesCountry of incorporation
Proportion of nominal value of issued shares
controlled by the GroupName of associate Principal activities 2016 2015
PetroFirst Infrastructure Limited Leasing of floating platforms to oil and gas industry Jersey 20 20Petrofac FPF1 Limited Leasing of floating platforms to oil and gas industry Jersey 25 25PetroFirst Infrastructure 2 Limited Leasing of floating platforms to oil and gas industry Jersey 10 –
Joint ArrangementsJoint venturesCostain Petrofac Limited Engineering, procurement and construction
management servicesEngland – 50
Spie Capag – Petrofac International Limited
Engineering, procurement and construction management services
Jersey 50 50
TTE Petrofac Limited Operation and management of a training centre Jersey 50 50China Petroleum Petrofac Engineering Services Cooperatief U.A.
Consultancy for Petroleum and chemical engineering Netherlands 49 49
Takatuf Petrofac Oman LLC Construction, operation and management of a training centre
Oman 40 40
Professional Mechanical Repair Services Company
Operation of service centre providing mechanical services to oil and gas industry
Saudi Arabia – 50
Joint operationsPetroAlfa Servicios Integrados de Energia SAPI de CV
Services to oil and gas industry Mexico 350 350
Petro-SPM Integrated Services S.A. de C.V.
Production enhancement for Pánuco Mexico 450 450
Bechtel Petrofac JV Engineering, procurement and construction management of a project in UAE
Unincorporated 535 535
NGL 4 JV EPC for a project in UAE Unincorporated 545 545Petrofac/Black & Veatch JV Tendering and execution of a project in Kazakhstan Unincorporated 580 580Petrofac/Bonatti JV EPC for a project in Algeria Unincorporated 570 570Petrofac/Daelim JV EPC for a project in Oman Unincorporated 550 550Petrofac/ETAP JV Oil and gas exploration and production
from Chergui concessionUnincorporated 545 545
PM304 JV Oil and gas exploration and production in Malaysia Unincorporated 530 530Petrofac/Samsung/CB&I CFP EPC for a project in Kuwait Unincorporated 547 547
Please note that only active companies are shown in the above tables. All dormant companies have been omitted.1 Directly held by Petrofac Limited.2 Companies consolidated as subsidiaries on the basis of control.3 Joint arrangement classified as joint operation on the basis of contractual arrangement, whereby the activities of the arrangement are primarily designed for the provision of output
to the venturers, this indicates that the venturers have rights to substantially all the economic benefits of the assets of the arrangement.4 Joint arrangement classified as joint operation on the basis of contractual arrangement between the joint venturers to be jointly and severally liable for performance under Pánuco ISC.5 The unincorporated arrangement between the venturers is a joint arrangement as, contractually, all the decisions about the relevant activities require unanimous consent by the
venturers and all unincorporated joint arrangements are included in the Group’s results as joint operations.
The Company’s interest in associates and joint ventures is disclosed on page 150 and page 151 respectively.
Petrofac Annual report and accounts 2016 / 171
Financial statem
ents

COMPANY FINANCIAL STATEMENTS173 Company income statement173 Company statement of other
comprehensive income174 Company statement of financial position175 Company statement of cash flows176 Company statement of changes in equity177 Notes to the Company financial statements189 Shareholder information190 Glossary
172 / Petrofac Annual report and accounts 2016

Company income statementFor the year ended 31 December 2016
Notes2016
US$m2015
US$m
Revenue 3 386 1,324General and administration expenses 4 (16) (17)Other operating income 5 10 7Other operating expenses 6 (300) (769)Profit before tax and finance (costs)/income 80 545Finance costs 7 (51) (39)Finance income 7 32 14Profit before tax 61 520Income tax expense – –Profit for the year 61 520
Company statement of other comprehensive incomeFor the year ended 31 December 2016
2016 US$m
2015 US$m
Profit for the year 61 520
Other comprehensive lossUnrealised losses on the fair value of available-for-sale investment reclassified to income statement (note 11) 16 –Changes in fair value of available-for-sale investment (note 11) – (16)Total comprehensive income for the year 77 504
The attached notes 1 to 22 form part of these Company financial statements.
Petrofac Annual report and accounts 2016 / 173
Financial statem
ents

Company statement of financial positionAt 31 December 2016
Notes2016
US$m2015
US$m
Assets Non-current assetsProperty, plant and equipment – 1Investments in subsidiaries 9 535 389Investments in associates 10 7 –Available-for-sale investment 11 – 169Other financial assets 18 42 –Other non-current assets – 10
584 569Current assetsTrade and other receivables 1 1Amounts due from subsidiaries 12 2,140 1,685Other financial assets 18 14 14Cash and short-term deposits 13 54 4
2,209 1,704Total assets 2,793 2,273
Equity and liabilities Equity attributable to Petrofac Limited shareholdersShare capital 22 7 7Share premium 22 4 4Capital redemption reserve 22 11 11Treasury shares 14 (105) (111)Other reserves 15 84 73Retained earnings 516 682Total equity 517 666
Non-current liabilities Interest-bearing loans and borrowings 17 1,423 740Other financial liabilities 18 12 –Long-term employee benefit provisions 1 1
1,436 741Current liabilitiesInterest-bearing loans and borrowings 17 317 517Trade and other payables 3 1Other financial liabilities 18 55 19Amounts due to subsidiaries 12 465 329
840 866Total liabilities 2,276 1,607Total equity and liabilities 2,793 2,273
The financial statements on pages 173 to 188 were approved by the Board of Directors on 21 February 2017 and signed on its behalf by
Alastair Cochran – Chief Financial Officer.
The attached notes 1 to 22 form part of these Company financial statements.
174 / Petrofac Annual report and accounts 2016

Company statement of cash flowsFor the year ended 31 December 2016
Notes2016
US$m2015
US$m
Operating activities Profit before tax 61 520
Adjustments for:Net finance expense 7 19 25Gain on disposal 5 – (7)Unrealised losses on the fair value of available-for-sale investment reclassified to income statement 11 16 –Impairment of available-for-sale investment 11 181 –Provision for doubtful debts on amounts due from subsidiaries, net 6 89 465Impairment of investment in a subsidiary 6 – 294Other non-cash items, net 4 (7)
Operating profit before working capital changes 370 1,290Amounts due from subsidiaries (544) (740)Trade and other receivables 1 –Trade and other payables 1 –Amounts due to subsidiaries 133 118
Cash (used in)/generated from operations (39) 668Interest paid (47) (36)Net cash flows (used in)/generated from operating activities (86) 632
Investing activities Investment in a subsidiary 9 (77) (464)Additional investment in available-for sale investment 11 (12) –Investment in an associate 10 (5) –Proceeds from disposal of subsidiary, net of transaction costs 5 – 41Purchase of property, plant and equipment – (1)Net cash flows used in investing activities (94) (424)
Financing activitiesInterest-bearing loans and borrowings obtained, net of debt acquisition cost 1,687 12Repayment of interest-bearing loans and borrowings (1,200) –Debt financing fees paid relating to Group borrowings – (5)Treasury shares purchased 14 (36) (39)Equity dividends paid* (221) (220)Net cash flows generated from/(used in) financing activities 230 (252)
Net increase/(decrease) in cash and cash equivalents 50 (44)Cash and cash equivalents at 1 January 4 48Cash and cash equivalents at 31 December 13 54 4
* Dividend payments have been made by both the Company and subsidiary entities.
The attached notes 1 to 22 form part of these Company financial statements.
Petrofac Annual report and accounts 2016 / 175
Financial statem
ents

Company statement of changes in equityFor the year ended 31 December 2016
Issued share capital US$m
(note 22)
Share premium
US$m
Capital redemption
reserve US$m
*Treasury shares US$m
(note 14)
Other reserves
US$m (note 15)
Retained earnings
US$m
Total equity US$m
Balance at 1 January 2015 7 4 11 (101) 70 387 378Net profit for the year – – – – – 520 520Other comprehensive income – – – – (16) – (16)Total comprehensive income – – – – (16) 520 504Shares vested during the year (note 15) – – – 29 (27) (2) –Treasury shares purchased (note 14) – – – (39) – – (39)Transfer to reserve for share-based payments (note 15) – – – – 46 – 46Dividends (note 8) – – – – – (223) (223)Balance at 1 January 2016 7 4 11 (111) 73 682 666Net profit for the year – – – – – 61 61Other comprehensive income – – – – 16 – 16Total comprehensive income for the year – – – – 16 61 77Shares vested during the year (note 15) – – – 42 (39) (3) –Treasury shares purchased (note 14) – – – (36) – – (36)Transfer to reserve for share-based payments (note 15) – – – – 34 – 34Dividends (note 8) – – – – – (224) (224)Balance at 31 December 2016 7 4 11 (105) 84 516 517
* Shares held by Petrofac Employee Benefit Trust and Petrofac Joint Venture Companies Employee Benefit Trust.
The attached notes 1 to 22 form part of these Company financial statements.
176 / Petrofac Annual report and accounts 2016

Notes to the Company financial statementsFor the year ended 31 December 2016
1 Corporate information
The financial statements of Petrofac Limited (the ‘Company’) referred to as the Company financial statements for the year ended 31 December 2016 were authorised for issue in accordance with a resolution of the Directors on 21 February 2016.
Petrofac Limited is a limited liability company registered in Jersey under the Companies (Jersey) Law 1991 and is the holding company for the international Group of Petrofac subsidiaries (together the ‘Group’). The Group’s principal activity is the provision of facilities solutions to the oil and gas production and processing industry.
2 Summary of significant accounting policies
Basis of preparationThe separate financial statements have been prepared on a historical cost basis, except for derivative financial instruments and available-for-sale financial investments that have been measured at fair value. The functional and presentation currency of the separate financial statements is US dollars and all values in the separate financial statements are rounded to the nearest million (US$m) except where otherwise stated.
Statement of complianceThe separate financial statements have been prepared in accordance with International Financial Reporting Standards (IFRS) and applicable requirements of Jersey law.
New standards and interpretationsThe Company has adopted new and revised standards and interpretations issued by the International Accounting Standards Board (IASB) and the International Financial Reporting Interpretations Committee (IFRIC) of the IASB that are relevant to its operations and effective for accounting periods beginning on or after 1 January 2016.
Although these new standards and amendments apply for the first time in 2016, they do not have a material impact on the financial statements of the Company. The nature and the impact of each new standard or amendment is described below:
Amendments to IAS 27: Equity Method in Separate Financial StatementsThe amendments allow entities to use the equity method to account for investments in subsidiaries, joint ventures and associates in their separate financial statements. Entities already applying IFRS and electing to change to the equity method in their separate financial statements have to apply that change retrospectively. These amendments do not have any impact on the Company’s financial statements, since the Company continues to account for its investments in subsidiaries and associates at cost.
Standards issued not yet effectiveStandards issued but not yet effective up to the date of issuance of the Company’s financial statements are listed below and include only those standards and interpretations that are likely to have an impact on the disclosures, financial position or performance of the Company at a future date. The Company intends to adopt these standards when they become effective.
IFRS 9 Financial InstrumentsIn July 2014, the IASB issued the final version of IFRS 9 Financial Instruments that replaces IAS 39 Financial Instruments: Recognition and Measurement and all previous versions of IFRS 9. IFRS 9 brings together all three aspects of the accounting for financial instruments project: classification and measurement, impairment and hedge accounting. IFRS 9 is effective for annual periods beginning on or after 1 January 2018, with early application permitted. Except for hedge accounting, retrospective application is required but providing comparative information is not compulsory. For hedge accounting, the requirements are generally applied prospectively, with some limited exceptions. The adoption of IFRS 9 will have an effect on the classification and measurement of the Company’s financial assets and
financial liabilities. The Company is currently assessing the impact of IFRS 9 and plans to adopt the new standard on the required effective date.
Investments in subsidiariesInvestments in subsidiaries are stated at cost less any provision for impairment.
Investments in associatesInvestments in associates are stated at cost less any provision for impairment.
Financial assets
Initial recognition and measurementFinancial assets are classified, at initial recognition, as financial assets at fair value through profit or loss, loans and receivables, held-to-maturity investments, available-for-sale financial assets, or as derivatives designated as hedging instruments in an effective hedge, as appropriate. All financial assets are recognised initially at fair value plus, in the case of financial assets not recorded at fair value through profit or loss, transaction costs that are attributable to the acquisition of the financial asset.
Subsequent measurementFor purposes of subsequent measurement financial assets are classified in the following categories:
• Financial assets at fair value through profit or loss• Loans and receivables• Available-for-sale financial assets
Financial assets at fair value through profit or lossFinancial assets at fair value through profit or loss include financial assets held for trading and financial assets designated upon initial recognition at fair value through profit or loss. Financial assets are classified as held for trading if they are acquired for the purpose of selling or repurchasing in the near term. Derivatives, including separated embedded derivatives, are also classified as held for trading unless they are designated as effective hedging instruments as defined by IAS 39.
Loans and receivablesLoans and receivables are non-derivative financial assets with fixed or determinable payments that are not quoted in an active market. After initial measurement, such financial assets are subsequently measured at amortised cost using the effective interest rate (EIR) method, less impairment. Amortised cost is calculated by taking into account any discount or premium on acquisition and fees or costs that are an integral part of the EIR. The EIR amortisation is included in finance income in the income statement. This category generally applies to trade and other receivables and amounts due from subsidiaries.
Available-for-sale (AFS) financial assetsAFS financial assets include equity investments. Equity investments classified as AFS are those that are neither classified as held-for-trading nor designated at fair value through profit or loss.
After initial measurement, AFS financial assets are subsequently measured at fair value with unrealised gains or losses recognised in other comprehensive income and credited in the available-for-sale reserve until the investment is derecognised, at which time the cumulative gain or loss is recognised in the income statement within other operating income/expenses, or the investment is determined to be impaired, when the cumulative loss is reclassified from the AFS reserve to the income statement in other operating income/expenses.
Financial liabilities
Initial recognition and measurementFinancial liabilities are classified, at initial recognition, as financial liabilities at fair value through profit or loss, loans and borrowings, payables, or as derivatives designated as hedging instruments in an effective hedge, as appropriate.
Petrofac Annual report and accounts 2016 / 177
Financial statem
ents

Notes to the Company financial statements continuedFor the year ended 31 December 2016
2 Summary of significant accounting policies continued
All financial liabilities are recognised initially at fair value and, in the case of loans and borrowings and payables, net of directly attributable transaction costs.
The Company’s financial liabilities include trade and other payables, loans and borrowings, amounts due to subsidiaries and derivative financial instruments.
Subsequent measurementFor purposes of subsequent measurement financial assets are classified in the following categories:
• Financial liabilities at fair value through profit or loss• Loans and borrowings
Financial liabilities at fair value through profit or lossFinancial liabilities at fair value through profit or loss include financial liabilities held for trading and financial liabilities designated upon initial recognition as at fair value through profit or loss.
Financial liabilities are classified as held for trading if they are incurred for the purpose of repurchasing in the near term. This category also includes derivative financial instruments entered into by the Company that are not designated as hedging instruments in hedge relationships as defined by IAS 39. Separated embedded derivatives are also classified as held for trading unless they are designated as effective hedging instruments.
Gains or losses on liabilities held for trading are recognised in the statement of profit or loss.
Financial liabilities designated upon initial recognition at fair value through profit or loss are designated at the initial date of recognition, and only if the criteria in IAS 39 are satisfied.
Loans and borrowingsAfter initial recognition, interest-bearing loans and borrowings are subsequently measured at amortised cost using the effective interest rate (EIR) method. Gains and losses are recognised in profit or loss when the liabilities are derecognised as well as through the EIR amortisation process.
Amortised cost is calculated by taking into account any discount or premium on acquisition and fees or costs that are an integral part of the EIR. The EIR amortisation is included as finance costs in the statement of profit or loss.
This category generally applies to interest-bearing loans and borrowings. For more information, see note 17.
Cash and cash equivalentsCash and cash equivalents consist of cash at bank and in hand and short-term deposits with an original maturity of three months or less. For the purpose of the cash flow statement, cash and cash equivalents consists of cash and cash equivalents as defined above, net of any outstanding bank overdrafts.
Employee Benefit TrustsThe Petrofac Employee Benefit Trust and the Petrofac Joint Venture Companies Employee Benefit Trust (EBTs) are treated as extensions of the activities of the Company and accordingly the Company financial statements include all transactions and balances of the EBTs except for transaction and balances between the Company and the EBTs.
Share-based payment transactionsEmployees (including Directors) of the Group receive remuneration in the form of share-based payment transactions, whereby employees render services in exchange for shares or rights over shares (‘equity-settled transactions’).
Equity-settled transactionsThe cost of equity-settled transactions with employees is measured by reference to the fair value at the date on which they are granted. In valuing equity-settled transactions, no account is taken of any service or performance conditions, other than conditions linked to the price of the shares of Petrofac Limited (‘market conditions’), if applicable.
The cost of equity-settled transactions is recognised, together with a corresponding increase in equity, over the period in which the relevant employees become fully entitled to the award (the ‘vesting period’). The cumulative expense recognised for equity-settled transactions at each reporting date until the vesting date reflects the extent to which the vesting period has expired and the Group’s best estimate of the number of equity instruments that will ultimately vest. The income statement charge or credit for a period represents the movement in cumulative expense recognised as at the beginning and end of that period.
No expense is recognised for awards that do not ultimately vest, except for awards where vesting is conditional upon a market or non-vesting condition, which are treated as vesting irrespective of whether or not the market or non-vesting condition is satisfied, provided that all other performance conditions are satisfied. Equity awards cancelled are treated as vesting immediately on the date of cancellation, and any expense not recognised for the award at that date is recognised in the income statement.
The Company operates a number of share award schemes on behalf of the employees of the Group which are described in detail in note 23 of the consolidated financial statements of the Group.
The reserve for share-based payments is used to record the value of equity-settled share-based payments awarded to employees and transfers out of this reserve are made upon vesting of the original share awards. The share-based payments charges pertaining to fellow Group companies are recharged to them and shown as investment in subsidiaries. Subsequently they are transferred to due from subsidiaries and settled in cash.
Significant accounting estimates
Sources of estimation uncertaintyThe key assumptions concerning the future and other key sources of estimation uncertainty at the statement of financial position date that have a significant risk of causing a material adjustment to the carrying amounts of assets and liabilities within the next financial year are discussed below:
• Recoverable value of investments in subsidiaries and provision for losses on amounts due from subsidiaries: the Company determines at each reporting date whether there is any evidence of indicators of impairment in the carrying value of its investments in subsidiaries. Where indicators exist, an impairment test is undertaken which requires management to estimate the recoverable value of its assets which is based on its value in use. The value in use calculation is based on management’s business planning process which involves assumptions relating to future profitability, discount rate and inflation. A similar exercise is undertaken to determine the recoverability of amounts due from subsidiaries, after initially assessing the net assets of the subsidiary. The carrying value of investments in and amounts due from subsidiaries was US$535m and US$2,140m respectively (2015: US$389m and US$1,685m respectively).
Taxation
Profits arising in the Company for the 2016 year of assessment will be subject to Jersey tax at the standard corporate income tax rate of 0%.
178 / Petrofac Annual report and accounts 2016
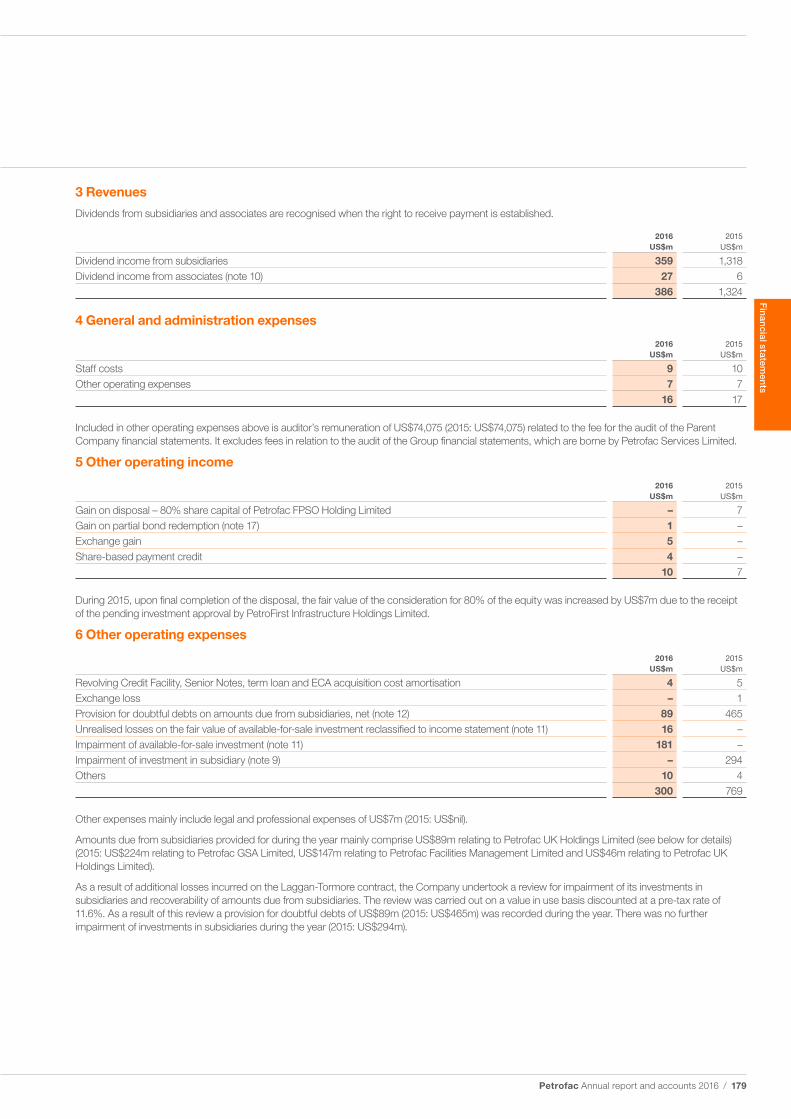
3 Revenues
Dividends from subsidiaries and associates are recognised when the right to receive payment is established.
2016 US$m
2015 US$m
Dividend income from subsidiaries 359 1,318Dividend income from associates (note 10) 27 6
386 1,324
4 General and administration expenses
2016 US$m
2015 US$m
Staff costs 9 10Other operating expenses 7 7
16 17
Included in other operating expenses above is auditor’s remuneration of US$74,075 (2015: US$74,075) related to the fee for the audit of the Parent Company financial statements. It excludes fees in relation to the audit of the Group financial statements, which are borne by Petrofac Services Limited.
5 Other operating income
2016 US$m
2015 US$m
Gain on disposal – 80% share capital of Petrofac FPSO Holding Limited – 7Gain on partial bond redemption (note 17) 1 –Exchange gain 5 –Share-based payment credit 4 –
10 7
During 2015, upon final completion of the disposal, the fair value of the consideration for 80% of the equity was increased by US$7m due to the receipt of the pending investment approval by PetroFirst Infrastructure Holdings Limited.
6 Other operating expenses
2016 US$m
2015 US$m
Revolving Credit Facility, Senior Notes, term loan and ECA acquisition cost amortisation 4 5Exchange loss – 1Provision for doubtful debts on amounts due from subsidiaries, net (note 12) 89 465Unrealised losses on the fair value of available-for-sale investment reclassified to income statement (note 11) 16 –Impairment of available-for-sale investment (note 11) 181 –Impairment of investment in subsidiary (note 9) – 294Others 10 4
300 769
Other expenses mainly include legal and professional expenses of US$7m (2015: US$nil).
Amounts due from subsidiaries provided for during the year mainly comprise US$89m relating to Petrofac UK Holdings Limited (see below for details) (2015: US$224m relating to Petrofac GSA Limited, US$147m relating to Petrofac Facilities Management Limited and US$46m relating to Petrofac UK Holdings Limited).
As a result of additional losses incurred on the Laggan-Tormore contract, the Company undertook a review for impairment of its investments in subsidiaries and recoverability of amounts due from subsidiaries. The review was carried out on a value in use basis discounted at a pre-tax rate of 11.6%. As a result of this review a provision for doubtful debts of US$89m (2015: US$465m) was recorded during the year. There was no further impairment of investments in subsidiaries during the year (2015: US$294m).
Petrofac Annual report and accounts 2016 / 179
Financial statem
ents

Notes to the Company financial statements continuedFor the year ended 31 December 2016
7 Finance (costs)/income
2016 US$m
2015 US$m
Finance costsLong-term borrowings (47) (35)On amounts due to subsidiaries (4) (4)Total finance costs (51) (39)
Finance incomeOn amounts due from subsidiaries 32 14Total finance income 32 14
8 Dividends paid and proposed
2016 US$m
2015 US$m
Declared and paid during the yearEquity dividends on ordinary shares:
Final dividend for 2014: 43.80 cents per share – 149Interim dividend 2015: 22.00 cents per share – 74Final dividend for 2015: 43.80 cents per share 149 –Interim dividend 2016: 22.00 cents per share 75 –
224 223
2016 US$m
2015 US$m
Proposed for approval at AGM (not recognised as a liability as at 31 December)Equity dividends on ordinary sharesFinal dividend for 2016: 43.80 cents per share (2015: 43.80 cents per share) 152 152
180 / Petrofac Annual report and accounts 2016

9 Investments in subsidiaries
At 31 December, the Company had investments in the following active subsidiaries:
Proportion of nominal value of issued shares controlled
by the Company
Name of company Country of incorporation 2016 2015
Trading subsidiariesPetrofac Energy Developments UK Limited England 100 100Petrofac Services Limited England 100 100Petrofac UK Holdings Limited England 100 100Jermyn Insurance Company Limited Guernsey 100 100Petrofac International Limited Jersey 100 100Petrofac Energy Developments International Limited Jersey 100 100Petrofac Facilities Management International Limited Jersey 100 100Petrofac GSA Holdings Limited (formerly Petrofac Energy Development West Africa Limited) Jersey 100 100Petrofac Integrated Energy Services Limited Jersey 100 100Petrofac Training International Limited Jersey 100 100Petroleum Facilities E & C Limited Jersey 100 100Petrofac South East Asia Pte Limited Singapore 99 99Petrofac Inc. USA 100 100
10 Investment in associates
2016 US$m
2015 US$m
At 1 January – –Additions 7 –At 31 December 7 –
During 2016, the Company acquired 10% of the share capital of PetroFirst Infrastructure 2 Limited amounting to US$7m, of which US$5m was paid in cash and the balance of US$2m, representing deferred consideration, is included within other payables. The investment is classified as an associate due to the Company’s representation on the board of directors and its ability to exercise significant influence over the investee.
During the year, the Company received dividend income of US$24m from PetroFirst Infrastructure Limited, US$2m from PetroFirst Infrastructure 2 Limited and US$1m is receivable from PetroFirst Infrastructure Limited at 31 December 2016 (2015: US$5m received from PetroFirst infrastructure Limited and US$1m receivable from PetroFirst Infrastructure Limited) see note 3.
Associates Country of incorporationPercentage
holding2016
US$m2015
US$m
PetroFirst Infrastructure Limited Jersey 20.0% – –PetroFirst Infrastructure 2 Limited Jersey 10.0% 7 –
7 –
11 Available-for-sale investment
2016 US$m
2015 US$m
As at 1 January 169 185Additions 12 –Impairments (181) –Fair value changes (note 5) – (16)As at 31 December – 169
During the year an additional investment of US$12m was made in Seven Energy to meet its funding requirements, which also included contributions from new and existing shareholders. Additional funding raised by Seven Energy diluted the Group’s shareholding in the Company from 15.0% at 31 December 2015 to 14.7% at 31 December 2016.
Petrofac Annual report and accounts 2016 / 181
Financial statem
ents

Notes to the Company financial statements continuedFor the year ended 31 December 2016
11 Available-for-sale investment continued
At 30 June 2016, the Company reviewed the carrying value of its available-for-sale investment in Seven Energy and as a result of this review management considered the significant decline in its fair value to be an indicator of impairment and recognised US$51m as an impairment expense to reflect the pricing of a recent equity fundraising by Seven Energy. At 31 December 2016, the Company again reviewed the carrying value of its available-for-sale investment in Seven Energy and concluded that despite the additional 2016 equity injection, Seven Energy’s liquidity outlook looked increasingly challenged owing to a decline in oil prices, the devaluation of the Nigerian Naira and a significant decline in production due to civil unrest in the country. As a result of these economic uncertainties and the liquidity challenges faced by Seven Energy, management has decided that the carrying value of its available-for-sale investment is unlikely to be recoverable and therefore has recognised a further impairment charge of US$130m at 31 December 2016. Management has also reclassified the cumulative unrealised losses that had been recognised previously through the reserve for unrealised gains/(losses) on available-for-sale investment of US$16m to the income statement making the total charge to the income statement US$197m (note 6).
12 Amounts due from/due to subsidiaries
Amounts due from/due to subsidiaries comprise both interest and non-interest bearing short-term loans provided to/received from subsidiaries listed in note 9.
13 Cash and short-term deposits
2016 US$m
2015 US$m
Cash at bank and in hand 21 4Short-term deposits 33 –
54 4
The fair value of cash and bank balances is US$54m (2015: US$4m).
14 Treasury shares
For the purpose of making awards under the Group’s employee share schemes, shares in the Company are purchased and held by the Petrofac Employee Benefit Trust and the Petrofac Joint Venture Companies Employee Benefit Trust. All these shares have been classified in the statement of financial position as treasury shares within equity.
The movements in total treasury shares are shown below:
2016 2015
Number US$m Number US$m
At 1 January 6,015,520 111 4,985,937 101Acquired during the year 2,673,796 36 2,800,000 39Vested during the year (2,756,842) (42) (1,770,417) (29)At 31 December 5,932,474 105 6,015,520 111
Shares vested during the year include dividend shares of 186,369 shares (2015: 105,365 shares).
15 Other reserves
Net unrealised gains/(losses)
on available-for-sale financial
asset US$m
Reserve for share-based
payments US$m
Total US$m
Balance at 1 January 2015 – 70 70Changes in fair value of available-for-sale financial asset (16) – (16)Shares vested during the year – (27) (27) Transfer to reserve for share-based payments – 46 46Balance at 1 January 2016 (16) 89 73Unrealised loss on the fair value of available-for-sale investment reclassified during the year (note 6) 16 – 16Shares vested during the year – (39) (39)Transfer to reserve for share-based payments – 34 34Balance at 31 December 2016 – 84 84
182 / Petrofac Annual report and accounts 2016

Nature and purpose of other reservesNet unrealised gains/(losses) on available-for-sale investmentThis reserve records fair value changes on available-for-sale investment held by the Company. Realised gains and losses on the sale of available-for-sale investment are recognised as other operating income or other operating expenses in the income statement. Unrealised losses that are considered to be impaired are recognised as an expense in the income statement.
Reserve for share-based paymentsThe reserve for share-based payments is used to record the value of equity-settled share-based payments awarded to employees and transfers out of this reserve are made upon vesting of the original share awards. The transfer during the year of US$33m (2015: US$46m) represents the charge for share-based payments awards by the Company to its own employees as well as employees of subsidiaries, including bonus amounts converted into shares.
16 Share-based payment plans
Share-based payment chargeShare-based payment plan information is disclosed in note 24 of the consolidated financial statements of the Group. The following table shows the movements in the number of shares held under the Group employee schemes for the employees of the Company:
Deferred Bonus Share Plan
Number
Performance Share Plan
Number
Outstanding at 1 January 2015 28,152 39,639Granted during the year 22,406 8,460Transferred from subsidiaries 640 –Transferred to subsidiaries (220) –Vested during the year (12,619) –Forfeited during the year (1,313) (28,324)Outstanding at 1 January 2016 37,046 19,775Granted during the year 15,286 8,888Transferred from subsidiaries 696 –Transferred to subsidiaries (3,614) –Vested during the year (20,948) –Forfeited during the year (2,510) (10,176)Outstanding but not exercisable at 31 December 2016 25,956 18,487
Year ended 31 December 2016Deferred Bonus
Share Plan Number
Performance Share Plan
Number
Made up of following awards:2014 3,910 4,5932015 9,780 7,1732016 12,266 6,721
25,956 18,487
Year ended 31 December 2015Deferred Bonus
Share Plan Number
Performance Share Plan
Number
Made up of following awards:2013 3,812 6,2922014 11,620 5,0232015 21,614 8,460
37,046 19,775
Petrofac Annual report and accounts 2016 / 183
Financial statem
ents

Notes to the Company financial statements continuedFor the year ended 31 December 2016
17 Interest-bearing loans and borrowings
The Group had the following interest-bearing loans and borrowings outstanding:
31 December 2016 Actual interest rate %
31 December 2015 Actual interest rate % Effective interest rate % Maturity1
2016 US$m
2015 US$m
CurrentTerm loan (ii) US LIBOR + 1.25%
EIBOR + 1.25%US LIBOR + 0.85% US LIBOR + 1.25%
EIBOR + 1.25%August 2017 300 500
Export Credit Agency funding (SACE and UKEF facility)
(iv) US LIBOR + 1.50% US LIBOR + 0.70%
US LIBOR + 1.50% US LIBOR + 1.50% US LIBOR + 0.70%
Refer note (iv) below
17 17
317 517
Non-currentSenior Notes (i) 3.40% 3.40% 3.68% 2 years 677 750Revolving Credit Facility (RCF) (iii) US LIBOR + 1.00% US LIBOR + 0.95% US LIBOR + 1.00% 4 years 645 –Export Credit Agency funding (SACE and UKEF facility)
(iv) US LIBOR + 1.50% US LIBOR + 0.70%
US LIBOR + 1.50% US LIBOR + 1.50% US LIBOR + 0.70%
Refer note (iv) below
123 –
1,445 750Less:Debt acquisition costs net of accumulated amortisation and effective interest rate adjustments
(22) (10)
1,423 740Total interest-bearing loans and borrowings 1,740 1,257
1 As at 31 December 2016.
Details of the Company’s interest-bearing loans and borrowings are as follows:
(i) Senior NotesPetrofac has an outstanding aggregate principal amount of US$677m Senior Notes due in 2018 (Notes). During the year the Company redeemed US$73m of its Notes and recognised a gain thereon of US$1m (2015: US$nil). The Group pays interest on the Notes at an annual rate equal to 3.40% of the outstanding principal amount. Interest on the Notes is payable semi-annually in arrears in April and October each year. The Notes are senior unsecured obligations of the Company and will rank equally in right of payment with the Company’s other existing and future unsecured and unsubordinated indebtedness. Petrofac International Limited and Petrofac International (UAE) LLC irrevocably and unconditionally guarantee, jointly and severally, the due and prompt payment of all amounts at any time becoming due and payable in respect of the Notes. The Guarantees are senior unsecured obligations of each Guarantor and will rank equally in right of payment with all existing and future senior unsecured and unsubordinated obligations of each Guarantor.
(ii) Term loanOn 31 August 2014, Petrofac entered into a US$500m two-year term loan facility with a syndicate of five international banks. The facility matured on 31 August 2016 and was repaid in full on 15 August 2016. The repayment was partly financed with the proceeds of two new term loans of US$200m and AED368m. These two new facilities will mature in August 2017. The loan was fully drawn as of 31 December 2016 (31 December 2015: US$500m).
Interest is payable on the US$200m facility at US LIBOR + 1.25%.
Interest payable on the AED368m facility at EIBOR + 1.25%
(iii) Revolving Credit FacilityPetrofac has a US$1,200m five-year committed Revolving Credit Facility with a syndicate of international banks, which is available for general corporate purposes. The facility, which was signed on 11 September 2012, was amended and extended in June 2015 and will now mature on 2 June 2020. The facility is unsecured and is subject to two financial covenants relating to leverage and interest cover. Petrofac was in compliance with these covenants for the year ending 31 December 2016. As at 31 December 2016, US$645m was drawn under this facility (2015: US$540m).
Interest is payable on the drawn balance of the facility at US LIBOR + 1.00% and in addition utilisation fees are payable depending on the level of utilisation.
Petrofac signed another Revolving Credit Facility for US$50m on 7 November 2016 on substantially the same terms and conditions as the US$1,200m facility. As at 31 December 2016, the facility was fully unutilised. Interest is payable on the drawn balance of the facility at US LIBOR + 1.25% and in addition utilisation fees are payable on the amounts utilised.
(iv) Export Credit Agency fundingOn 26 February 2015, Petrofac entered into a US$58m, term loan facility guaranteed by the Italian Export Credit Agency SACE. On 30 July 2015, Petrofac entered into a US$108m term loan facility guaranteed by the UK Export Credit Agency UKEF, on substantially the same terms as the SACE facility. The two facilities were linked to the procurement of certain goods and services from Italian and UK exporters, respectively, in connection with the construction of the Petrofac JSD6000 vessel. Both facilities were amended in 2016 to remove references to the Petrofac JSD6000 vessel. Each facility amortises over eight and a half years from 2017. As at 31 December 2016, US$53m was drawn under the SACE facility (2015: US$17m) and US$86m was drawn under the UKEF facility (2015: US$nil).
Interest is payable on the SACE Facility and UKEF Facility at US LIBOR + 1.50% and US LIBOR + 0.70%, respectively.
184 / Petrofac Annual report and accounts 2016

18 Other financial assets and other financial liabilities
Classification2016
US$m2015
US$m
Other financial assetsNon-currentForward currency contracts on behalf of subsidiaries Fair value through profit and loss 42 –
42 –
CurrentForward currency contracts on behalf of subsidiaries Fair value through profit and loss 9 2Forward currency contracts undesignated Fair value through profit and loss 5 12
14 14
Other financial liabilitiesNon-currentForward currency contracts on behalf of subsidiaries Fair value through profit and loss 12 –
12 –
CurrentForward currency contracts on behalf of subsidiaries Fair value through profit and loss 46 13Forward currency contracts undesignated Fair value through profit and loss 1 –Oil derivative on behalf of subsidiaries Fair value through profit and loss 2 –Interest payable Fair value through profit and loss 6 6
55 19
Fair value measurementThe following financial instruments are measured at fair value using the hierarchy below for determination and disclosure of their respective fair values:
Level 1: Unadjusted quoted prices in active markets for identical financial assets or liabilities
Level 2: Other valuation techniques where the inputs are based on significant observation factors
Level 3: Other valuation techniques where the inputs are based on significant unobservable market data
The fair value of the Company’s financial instruments and their carrying amounts included within the Company’s statement of financial position are set out below:
Carrying amount Fair value
Level 2016
US$m2015
US$m2016
US$m2015
US$m
Financial assetsAvailable-for-sale investment (note 11) Level 3 – 169 – 169Forward currency contracts on behalf of subsidiaries Level 2 51 2 51 2Forward currency contracts undesignated Level 2 5 12 5 12Cash and short-term deposits (note 13) Level 2 54 4 54 4
Financial liabilitiesInterest-bearing loans and borrowings (note 17) Level 2 1,740 1,257 1,762 1,267Forward currency contracts on behalf of subsidiaries Level 2 58 13 58 13Forward currency contracts undesignated Level 2 1 – 1 –Oil derivative on behalf of subsidiaries Level 2 2 – 2 –Interest payable Level 2 6 6 6 13
The Company considers that the carrying amounts of trade and other receivables, amounts due from/due to subsidiaries and trade and other payables to approximate their fair values and are therefore excluded from the above table.
The fair value of the financial assets and liabilities is included at the amount at which the instrument could be exchanged in a current transaction between willing parties, other than in a forced or liquidation sale.
Petrofac Annual report and accounts 2016 / 185
Financial statem
ents

Notes to the Company financial statements continuedFor the year ended 31 December 2016
19 Commitments and contingencies
CommitmentsIn the normal course of business the Group will obtain surety bonds, letters of credit and guarantees, which are contractually required to secure performance, advance payment or in lieu of retentions being withheld. Some of these facilities are secured by issue of corporate guarantees on behalf of its subsidiaries by the Company in favour of the issuing banks.
At 31 December 2016, the Company had outstanding letters of guarantee, including performance, advance payments and bid bonds, of US$455m (2015: US$nil).
At 31 December 2016, the Company had outstanding forward exchange contracts amounting to US$2,843m (2015: US$1,448m). These commitments consist of future obligations either to acquire or to sell designated amounts of foreign currency at agreed rates and value dates (note 20).
Other matterAs described in pages 68, 79 and 87 of the Annual Report, the Company has undertaken an internal investigation during the year in relation to press allegations involving the Company’s relationship with Unaoil. While the Company’s investigation did not find evidence confirming the payment of bribes, the consequences of the Company’s disclosures to the SFO will be decided by the Regulatory authorities and it is currently unclear if any further investigation involving the Company will be undertaken. Therefore, at the date of this report, no liability has been recorded in relation to this matter. The existence of a future obligation, and the timing and amount of any future financial effect, are unable to be determined.
20 Risk management and financial instruments
Risk management objectives and policiesThe Company’s principal financial assets and liabilities are amounts due from and due to subsidiaries, available-for-sale investment, forward currency contracts, cash and short-term deposits and interest-bearing loans and borrowings.
The Company’s activities expose it to various financial risks particularly associated with interest rate risks on its external variable rate loans and borrowings. The Company has a policy not to enter into speculative trading of financial derivatives.
The other main risks besides interest rate are foreign currency risk, credit risk and liquidity risk and the policies relating to these risks are discussed in detail below:
Interest rate riskInterest rate risk arises from the possibility that changes in interest rates will affect the value of the Company’s interest-bearing financial liabilities and assets. The Company does not hedge its exposure on its interest-bearing funding to/from subsidiaries.
Interest rate sensitivity analysisThe impact on the Company’s pre-tax profit and equity due to a reasonably possible change in interest rates is demonstrated in the table below. The analysis assumes that all other variables remain constant.
Pre-tax profit Equity
100 basis point
increase US$m
100 basis point
decrease US$m
100 basis point
increase US$m
100 basis point
decrease US$m
31 December 2016 3 (3) – –31 December 2015 2 (2) – –
The following table reflects the maturity profile of interest-bearing financial assets and liabilities that are subject to interest rate risk:
Year ended 31 December 2016
Within 1 year US$m
1–2 years US$m
2–3 years US$m
3–4 years US$m
4–5 years US$m
More than 5 years
US$mTotal
US$m
Financial liabilitiesFloating ratesRCF – – – 645 – – 645Term loan 300 – – – – – 300Export Credit Agency funding 17 16 16 16 16 59 140Amount due to subsidiaries (interest-bearing) 462 – – – – – 462
779 16 16 661 16 59 1,547Financial assetsFloating rates Cash and short-term deposits (note 13) 54 – – – – – 54Amount due from subsidiaries (interest-bearing) 1,179 – – – – – 1,179
1,233 – – – – – 1,233
186 / Petrofac Annual report and accounts 2016

Year ended 31 December 2015
Within 1 year US$m
1–2 years US$m
2–3 years US$m
3–4 years US$m
4–5 years US$m
More than 5 years
US$mTotal
US$m
Financial liabilitiesFloating ratesTerm loan 500 – – – – – 500Export Credit Agency funding 17 – – – – – 17Amount due to subsidiaries (interest-bearing) 324 – – – – – 324
841 – – – – – 841
Financial assetsFloating rates Cash and short-term deposits (note 13) 4 – – – – – 4Amount due from subsidiaries (interest-bearing) 1,190 – – – – – 1,190
1,194 – – – – – 1,194
Financial liabilities in the above table are disclosed gross of debt acquisition costs and effective interest rate adjustments of US$22m (2015: US$10m).
Interest on financial instruments classified as floating rate is repriced at intervals of less than one year.
Foreign currency riskAlmost all of the financial assets and liabilities of the Company are denominated in US dollars. The foreign currency exposure at 31 December 2016 is limited to sterling £315m with an equivalent value of US$389m (2015: sterling £190m equivalent US$280m).
The following table summarises the impact on the Company’s pre-tax profit and equity (due to change in the fair value of monetary assets, liabilities and derivative instruments) of a reasonably possible change in US dollar exchange rates with respect to different currencies:
Pre-tax profit Equity
+10% US dollar rate increase
US$m
–10% US dollar rate decrease
US$m
+10% US dollar rate increase
US$m
–10% US dollar rate decrease
US$m
31 December 2016 39 (39) – – 31 December 2015 28 (28) – –
At 31 December 2016, the Company had foreign exchange forward contracts as follows:
Contract value Fair value (undesignated)
2016 US$m
2015 US$m
2016 US$m
2015 S$m
Sterling (sales)/purchases (315) 410 5 14Kuwaiti dinar sales (1,464) – (24) –Malaysia Ringgit purchases 33 – (4) –Indian Rupee purchases 7 – – –Yen purchases 62 – (4) –Dirham purchases 102 – – –Euro sales (61) (254) 24 (13)
(3) 1
The above foreign exchange contracts mature and will affect income between January 2017 and June 2019 (2015: between January 2016 and August 2018).
Credit riskThe Company’s principal financial assets are cash and short-term deposits and amounts due from subsidiaries.
The Company manages its credit risk in relation to cash and short-term deposits by only depositing cash with financial institutions that have high credit ratings provided by international credit rating agencies.
Petrofac Annual report and accounts 2016 / 187
Financial statem
ents
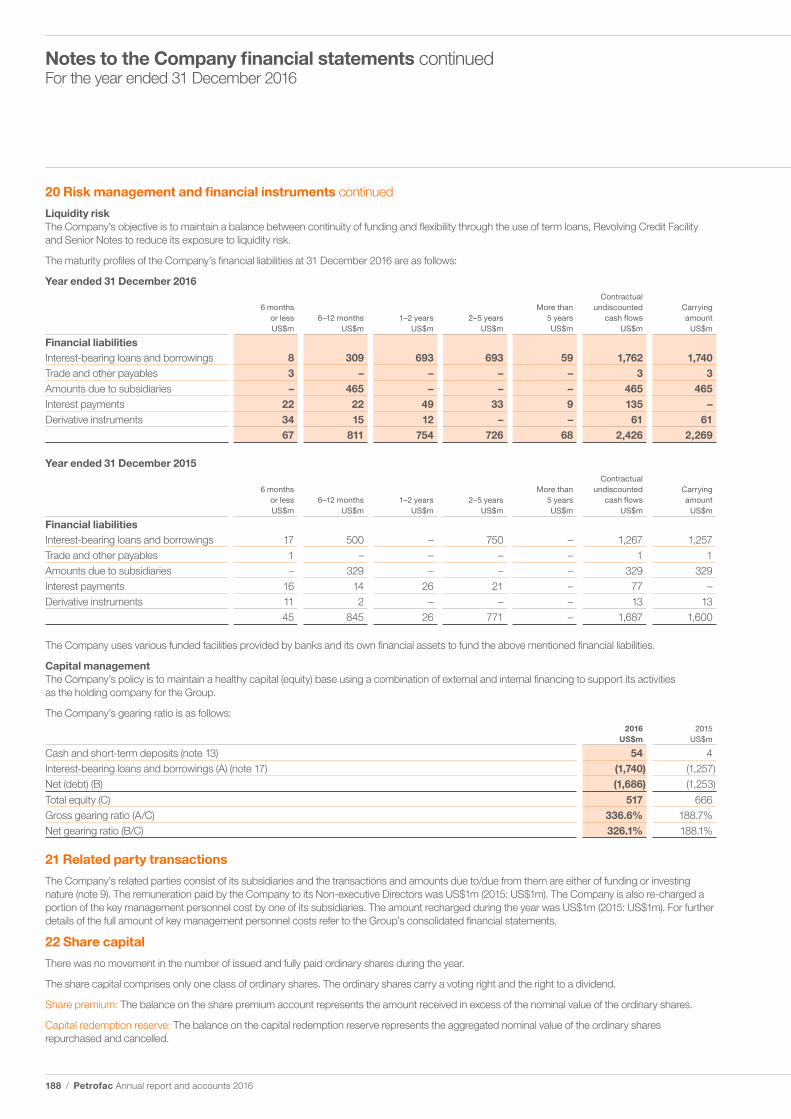
Notes to the Company financial statements continuedFor the year ended 31 December 2016
20 Risk management and financial instruments continued
Liquidity riskThe Company’s objective is to maintain a balance between continuity of funding and flexibility through the use of term loans, Revolving Credit Facility and Senior Notes to reduce its exposure to liquidity risk.
The maturity profiles of the Company’s financial liabilities at 31 December 2016 are as follows:
Year ended 31 December 2016
6 months or less US$m
6–12 monthsUS$m
1–2 yearsUS$m
2–5 years US$m
More than 5 years US$m
Contractual undiscounted
cash flows US$m
Carrying amount
US$m
Financial liabilitiesInterest-bearing loans and borrowings 8 309 693 693 59 1,762 1,740Trade and other payables 3 – – – – 3 3Amounts due to subsidiaries – 465 – – – 465 465Interest payments 22 22 49 33 9 135 –Derivative instruments 34 15 12 – – 61 61
67 811 754 726 68 2,426 2,269
Year ended 31 December 2015
6 months or less US$m
6–12 months US$m
1–2 yearsUS$m
2–5 years US$m
More than 5 years US$m
Contractual undiscounted
cash flows US$m
Carrying amount
US$m
Financial liabilitiesInterest-bearing loans and borrowings 17 500 – 750 – 1,267 1,257Trade and other payables 1 – – – – 1 1Amounts due to subsidiaries – 329 – – – 329 329Interest payments 16 14 26 21 – 77 –Derivative instruments 11 2 – – – 13 13
45 845 26 771 – 1,687 1,600
The Company uses various funded facilities provided by banks and its own financial assets to fund the above mentioned financial liabilities.
Capital managementThe Company’s policy is to maintain a healthy capital (equity) base using a combination of external and internal financing to support its activities as the holding company for the Group.
The Company’s gearing ratio is as follows:2016
US$m2015
US$m
Cash and short-term deposits (note 13) 54 4Interest-bearing loans and borrowings (A) (note 17) (1,740) (1,257)Net (debt) (B) (1,686) (1,253)
Total equity (C) 517 666Gross gearing ratio (A/C) 336.6% 188.7%Net gearing ratio (B/C) 326.1% 188.1%
21 Related party transactions
The Company’s related parties consist of its subsidiaries and the transactions and amounts due to/due from them are either of funding or investing nature (note 9). The remuneration paid by the Company to its Non-executive Directors was US$1m (2015: US$1m). The Company is also re-charged a portion of the key management personnel cost by one of its subsidiaries. The amount recharged during the year was US$1m (2015: US$1m). For further details of the full amount of key management personnel costs refer to the Group’s consolidated financial statements.
22 Share capital
There was no movement in the number of issued and fully paid ordinary shares during the year.
The share capital comprises only one class of ordinary shares. The ordinary shares carry a voting right and the right to a dividend.
Share premium: The balance on the share premium account represents the amount received in excess of the nominal value of the ordinary shares.
Capital redemption reserve: The balance on the capital redemption reserve represents the aggregated nominal value of the ordinary shares repurchased and cancelled.
188 / Petrofac Annual report and accounts 2016