Embed Size (px)
Citation preview
Group 5
Brad Maryman
Cristina Matthews
Todd Duncan
Tom Tran
Sean Rose

Agenda
Chapter 2 Overview Case 2-3
– SWOT analysis
Reading 2-1– Value chain analysis
Reading 2-3, Case 2-1– Value chain analysis– The balanced scorecard
Chapter 2 Overview
Important management tools for implementing strategy:
SWOT analysis Value chain analysis The balanced scorecard
SWOT Analysis
SWOT analysis is a procedure for identifying a firm’s critical success factors: its internal strengths and weaknesses and its external opportunities and threats.
Critical Success Factors (CSFs) are measures of those aspects of the firm’s performance that are essential to its competitive advantage.
Value-Chain Analysis
Firms use this tool to identify the specific steps required to provide a competitive product or service. It is specifically used to:
Better understand a firm’s competitive advantage Identify where to add value or reduce costs Better understand external connections to the
firm (suppliers, customers, competitors)
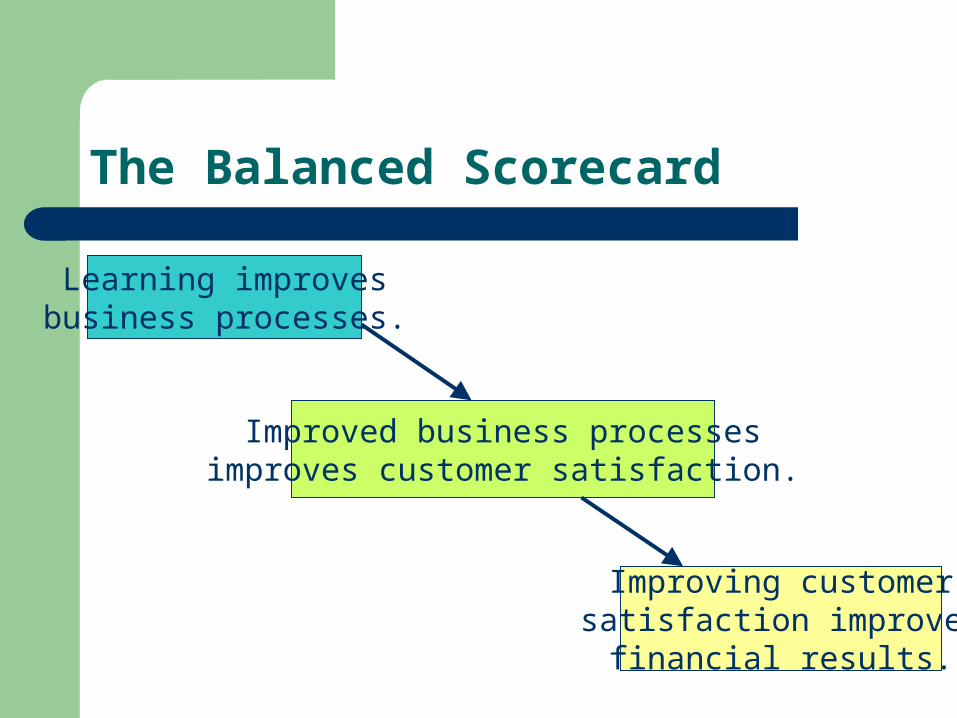
The Balanced Scorecard
Learning improvesbusiness processes.
Improved business processesimproves customer satisfaction.
Improving customersatisfaction improves
financial results.
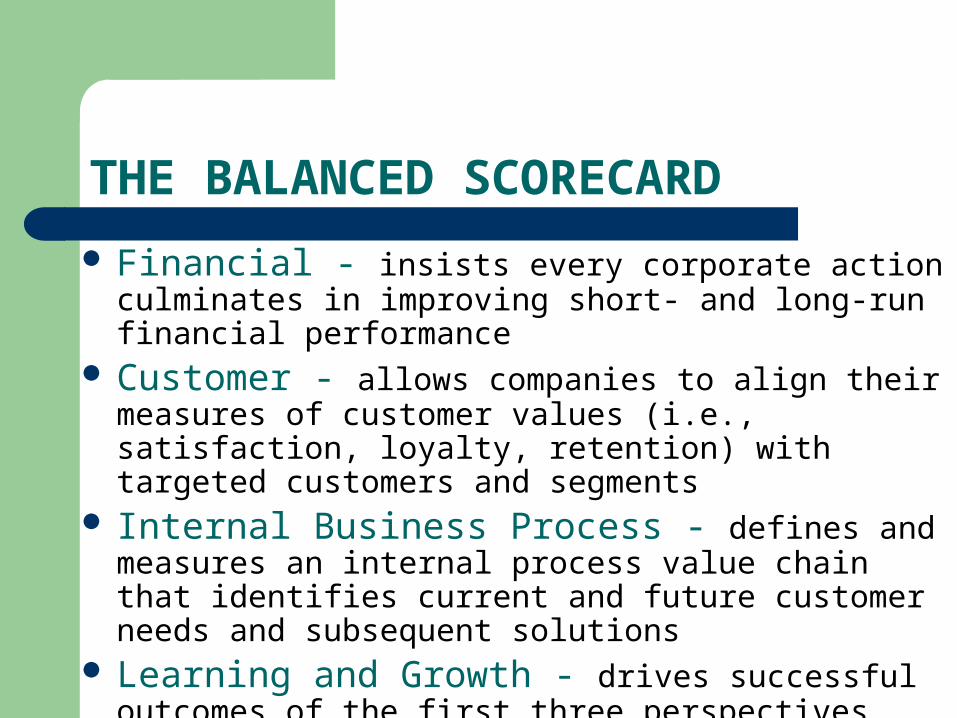
THE BALANCED SCORECARD
Financial - insists every corporate action culminates in improving short- and long-run financial performance
Customer - allows companies to align their measures of customer values (i.e., satisfaction, loyalty, retention) with targeted customers and segments
Internal Business Process - defines and measures an internal process value chain that identifies current and future customer needs and subsequent solutions
Learning and Growth - drives successful outcomes of the first three perspectives
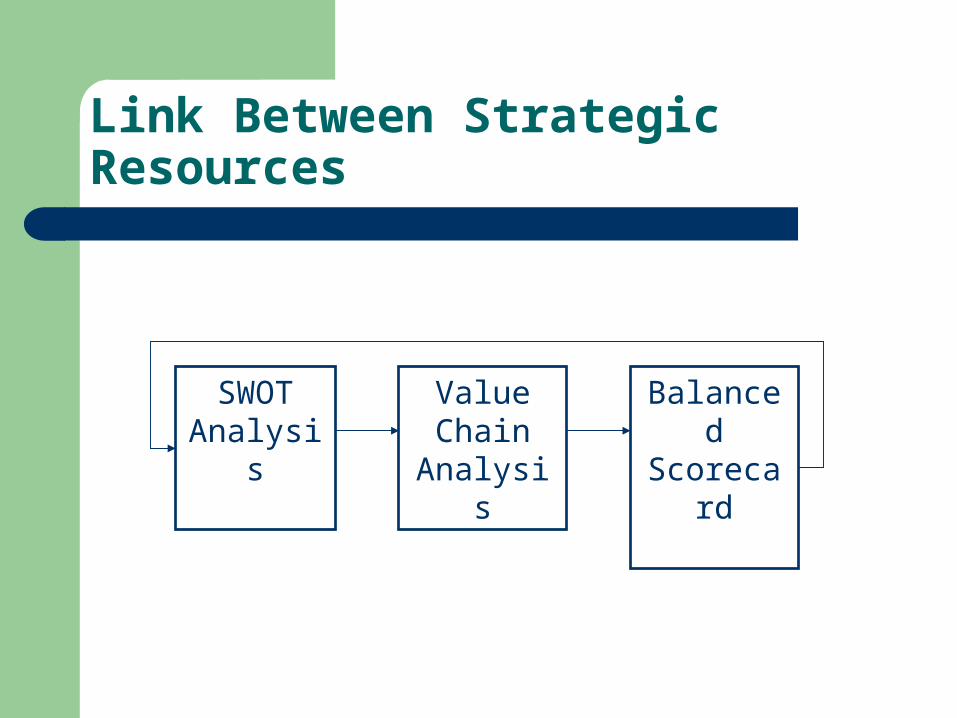
Link Between Strategic Resources
SWOTAnalysis
ValueChain
Analysis
BalancedScorecard

Case 2-3: Accounting & Tax Practice
Background on Terry Merton– CPA, controller for small manufacturing firm– Dreams of owning her own business
Who should be her target market?– Tax practice = cost leadership– Tax and accounting practice = differentiation
Bill Anderson, the loan officer– Maximum loan of $8,000– Annual payments of $2,110
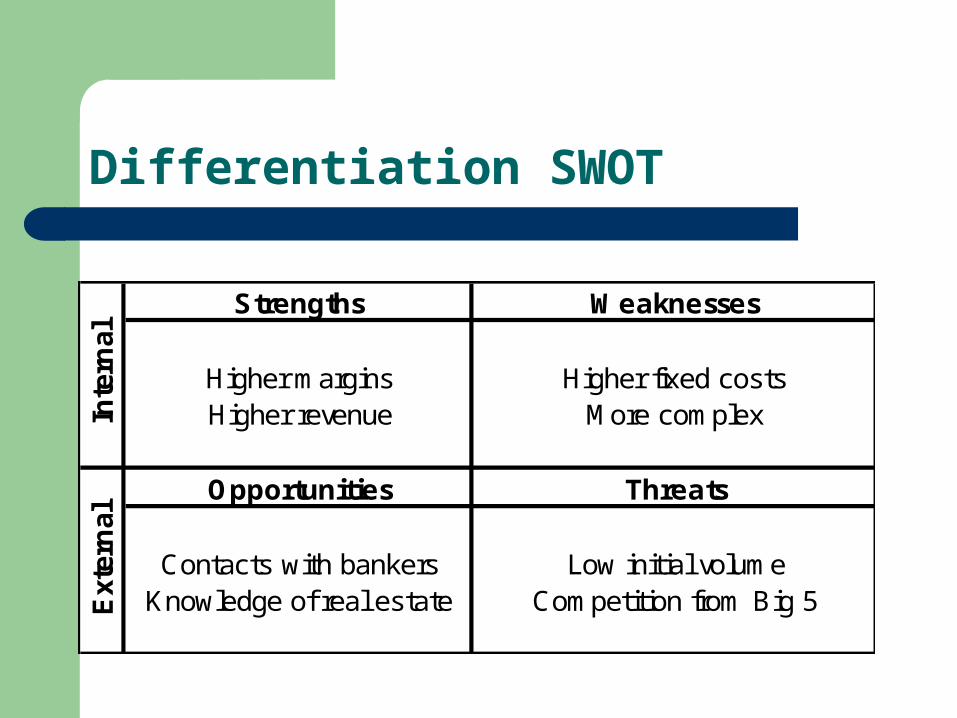
Differentiation SWOT
Strengths Weaknesses
Higher margins Higher fixed costsHigher revenue More complex
Opportunities Threats
Contacts with bankers Low initial volumeKnowledge of real estate Competition from Big 5E
xter
nal
Inte
rnal
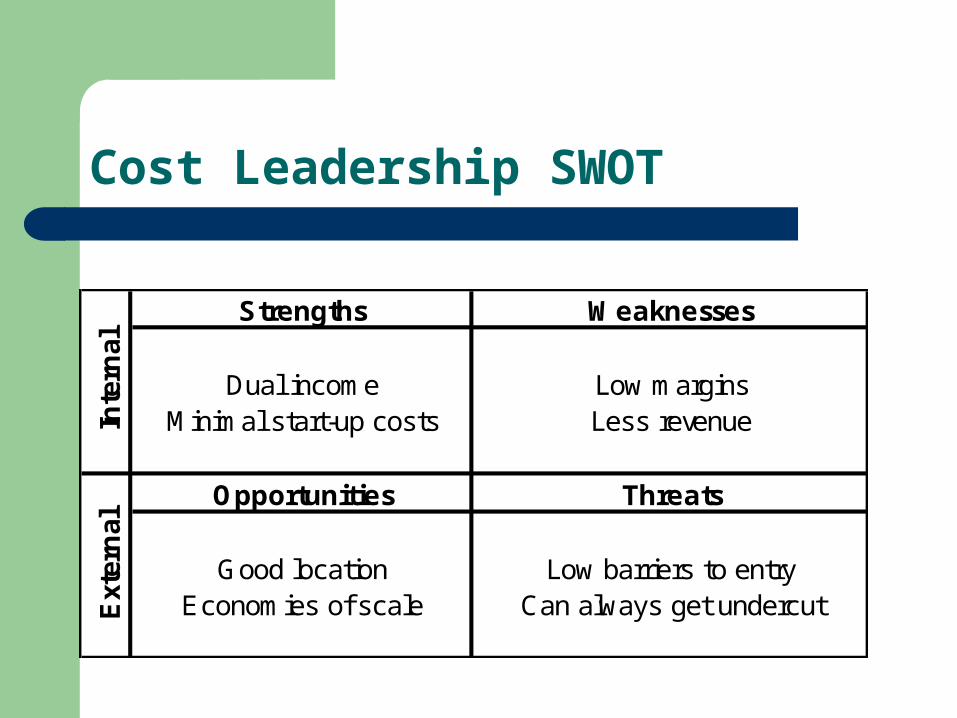
Cost Leadership SWOT
Strengths Weaknesses
Dual income Low marginsMinimal start-up costs Less revenue
Opportunities Threats
Good location Low barriers to entryEconomies of scale Can always get undercut
Inte
rnal
Ext
ern
al
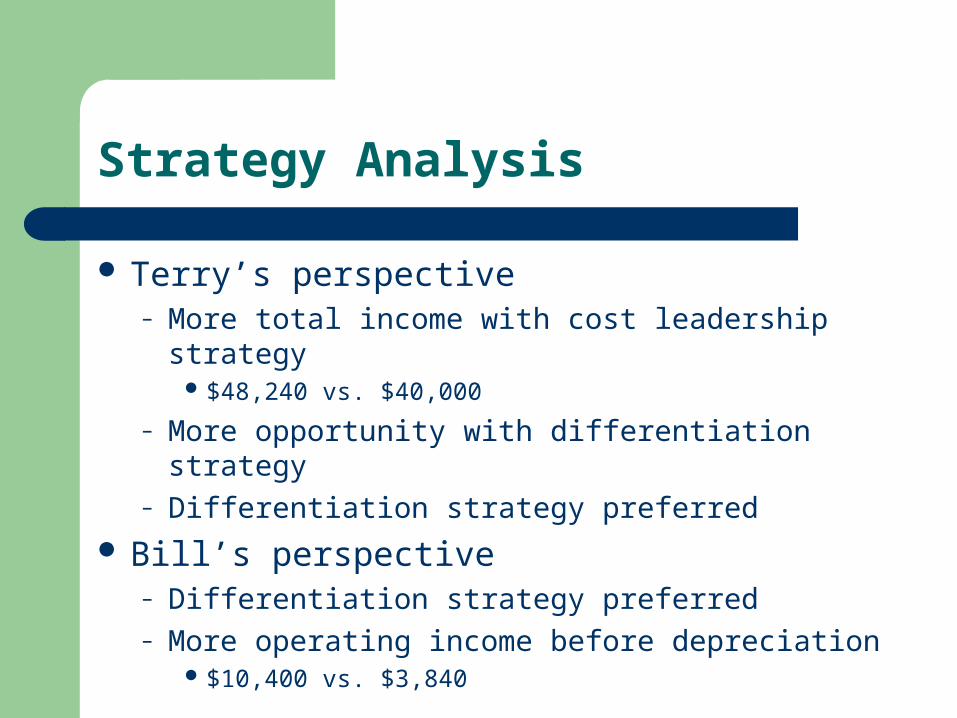
Strategy Analysis
Terry’s perspective– More total income with cost leadership strategy
$48,240 vs. $40,000
– More opportunity with differentiation strategy– Differentiation strategy preferred
Bill’s perspective– Differentiation strategy preferred– More operating income before depreciation
$10,400 vs. $3,840
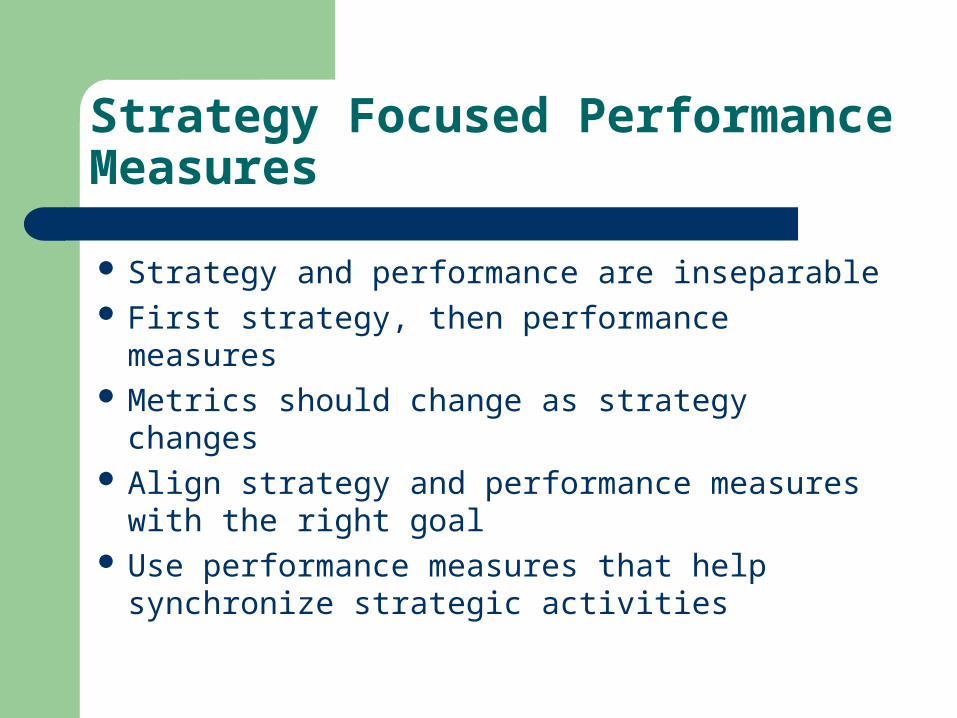
Strategy Focused Performance Measures
Strategy and performance are inseparable First strategy, then performance measures Metrics should change as strategy changes Align strategy and performance measures
with the right goal Use performance measures that help
synchronize strategic activities
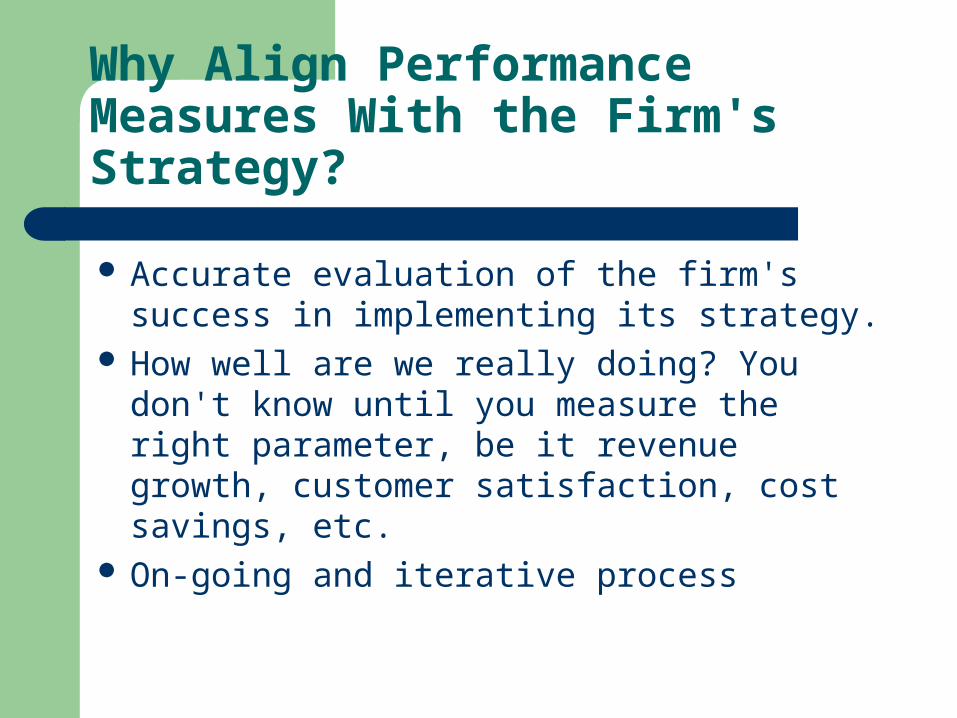
Why Align Performance Measures With the Firm's Strategy?
Accurate evaluation of the firm's success in implementing its strategy.
How well are we really doing? You don't know until you measure the right parameter, be it revenue growth, customer satisfaction, cost savings, etc.
On-going and iterative process
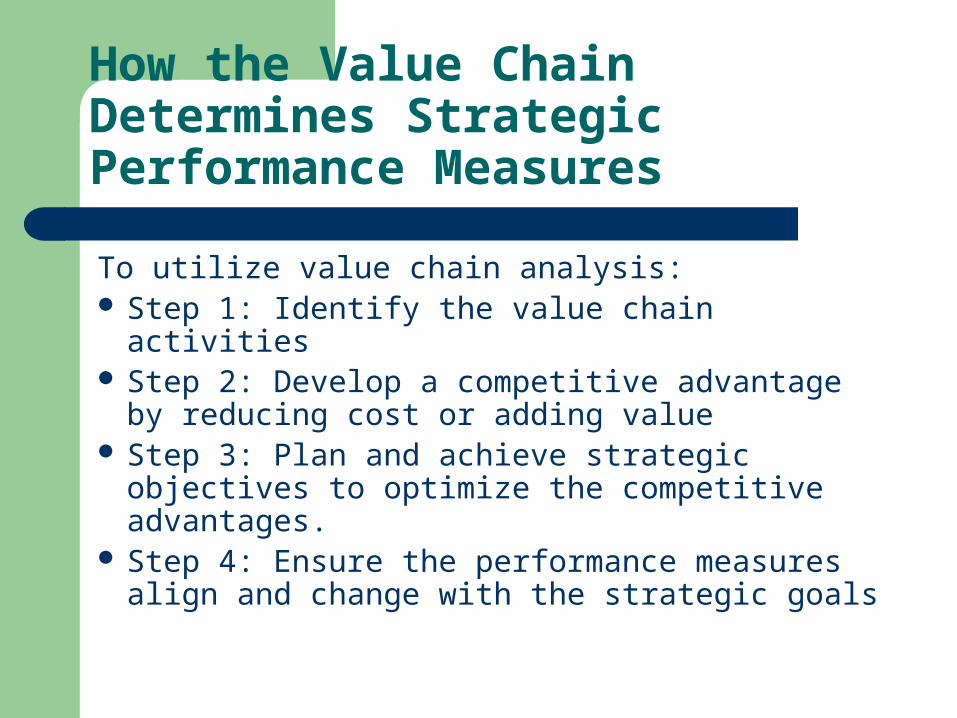
How the Value Chain Determines Strategic Performance Measures
To utilize value chain analysis: Step 1: Identify the value chain activities Step 2: Develop a competitive advantage by
reducing cost or adding value Step 3: Plan and achieve strategic objectives
to optimize the competitive advantages. Step 4: Ensure the performance measures
align and change with the strategic goals
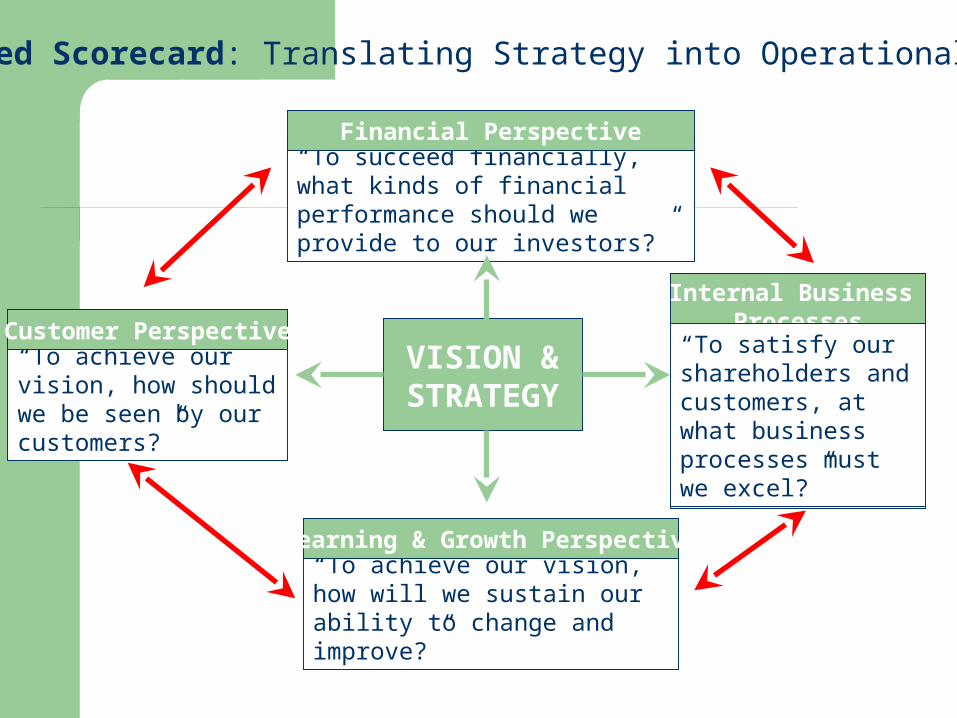
Balanced Scorecard: Translating Strategy into Operational Terms
VISION &STRATEGY
“To achieve our vision, how should we be seen by our customers?”
Customer Perspective
“To achieve our vision, how will we sustain our ability to change and improve?”
Learning & Growth Perspective
“To succeed financially, what kinds of financial performance should we provide to our investors?”
Financial Perspective
“To satisfy our shareholders and customers, at what business processes must we excel?”
Internal Business Processes
“To satisfy our shareholders and customers, at what business processes must we excel?”
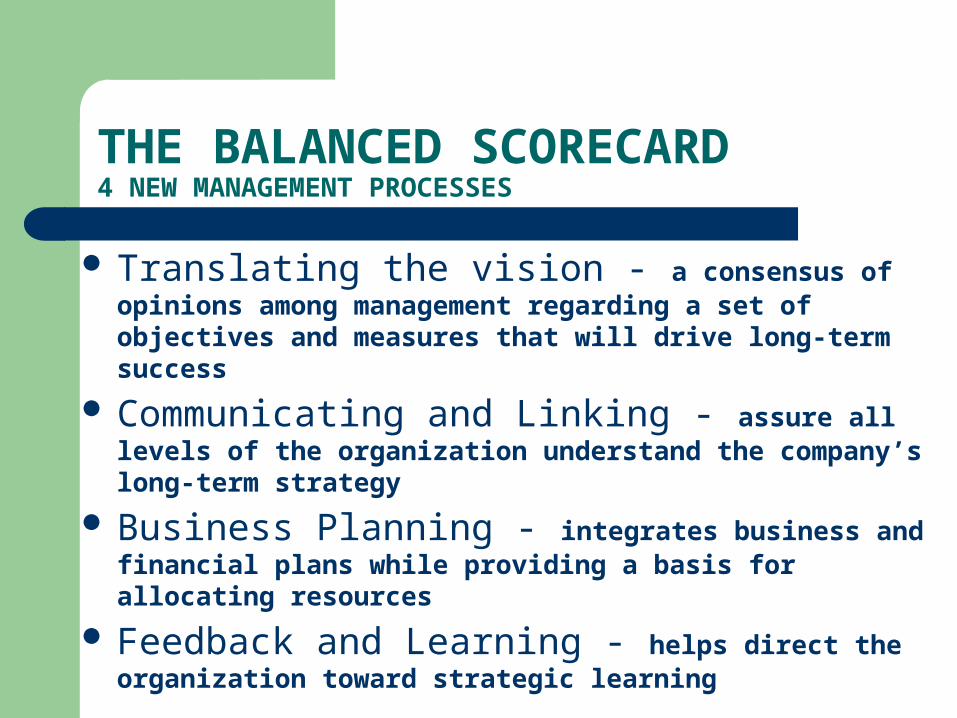
THE BALANCED SCORECARD 4 NEW MANAGEMENT PROCESSES
Translating the vision - a consensus of opinions among management regarding a set of objectives and measures that will drive long-term success
Communicating and Linking - assure all levels of the organization understand the company’s long-term strategy
Business Planning - integrates business and financial plans while providing a basis for allocating resources
Feedback and Learning - helps direct the organization toward strategic learning
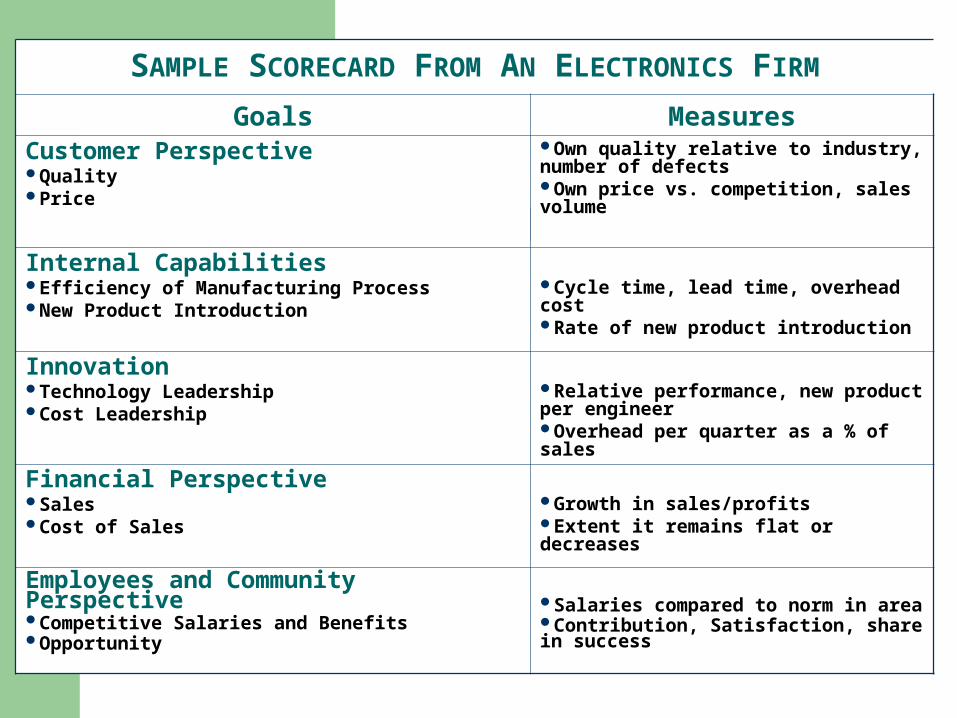
SAMPLE SCORECARD FROM AN ELECTRONICS FIRM
Goals MeasuresCustomer PerspectiveQualityPrice
Own quality relative to industry, number of defectsOwn price vs. competition, sales volume
Internal CapabilitiesEfficiency of Manufacturing ProcessNew Product Introduction
Cycle time, lead time, overhead costRate of new product introduction
InnovationTechnology LeadershipCost Leadership
Relative performance, new product per engineerOverhead per quarter as a % of sales
Financial PerspectiveSalesCost of Sales
Growth in sales/profitsExtent it remains flat or decreases
Employees and Community PerspectiveCompetitive Salaries and BenefitsOpportunity
Salaries compared to norm in areaContribution, Satisfaction, share in success
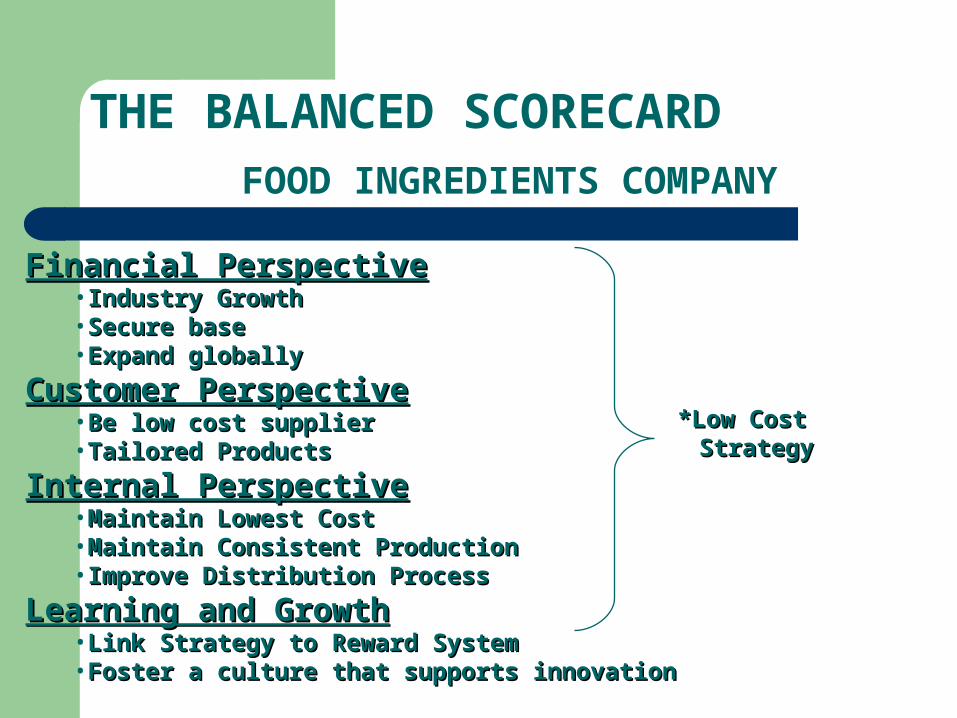
THE BALANCED SCORECARDFOOD INGREDIENTS COMPANY
Financial PerspectiveFinancial Perspective•Industry GrowthIndustry Growth•Secure baseSecure base•Expand globallyExpand globally
Customer PerspectiveCustomer Perspective•Be low cost supplierBe low cost supplier•Tailored ProductsTailored Products
Internal PerspectiveInternal Perspective•Maintain Lowest CostMaintain Lowest Cost•Maintain Consistent ProductionMaintain Consistent Production•Improve Distribution ProcessImprove Distribution Process
Learning and GrowthLearning and Growth•Link Strategy to Reward SystemLink Strategy to Reward System•Foster a culture that supports innovationFoster a culture that supports innovation
*Low Cost *Low Cost StrategyStrategy
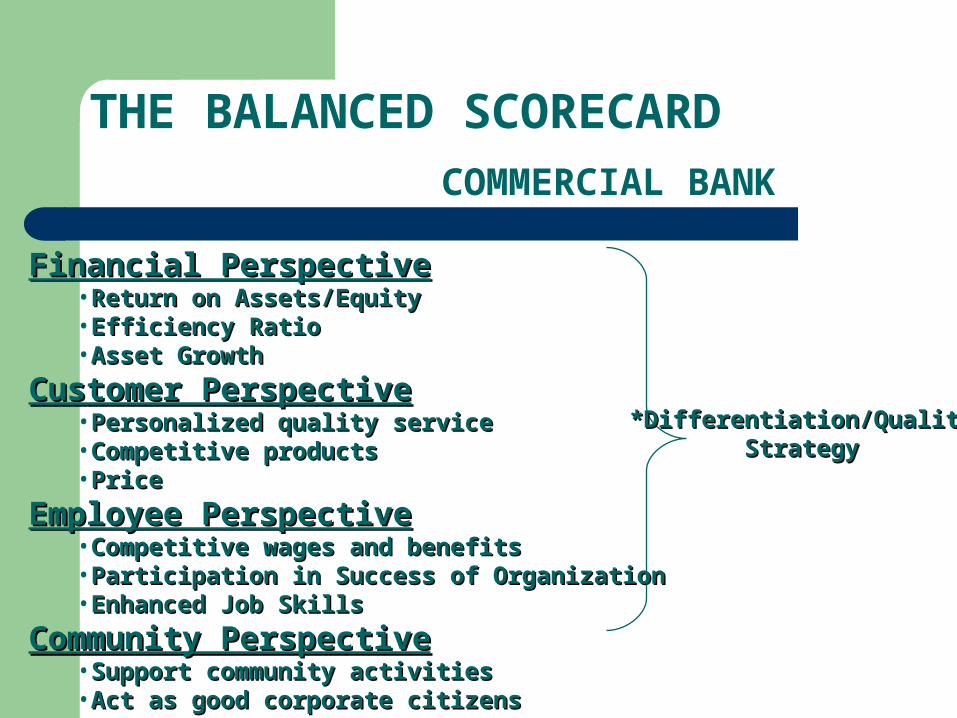
THE BALANCED SCORECARD
COMMERCIAL BANK
Financial PerspectiveFinancial Perspective•Return on Assets/EquityReturn on Assets/Equity•Efficiency RatioEfficiency Ratio•Asset GrowthAsset Growth
Customer PerspectiveCustomer Perspective•Personalized quality servicePersonalized quality service•Competitive productsCompetitive products•PricePrice
Employee PerspectiveEmployee Perspective•Competitive wages and benefitsCompetitive wages and benefits•Participation in Success of OrganizationParticipation in Success of Organization•Enhanced Job SkillsEnhanced Job Skills
Community PerspectiveCommunity Perspective•Support community activitiesSupport community activities•Act as good corporate citizensAct as good corporate citizens
*Differentiation/Quality*Differentiation/QualityStrategyStrategy

THE BALANCED SCORECARD
BIOTECHNOLOGY FIRM
Customer PerspectiveCustomer Perspective•New ProductsNew Products•Early purchase of seasonal productsEarly purchase of seasonal products•Accurate invoicesAccurate invoices
Internal Business PerspectiveInternal Business Perspective•Low Cost ProducerLow Cost Producer•Reduce InventoryReduce Inventory•New ProductsNew Products
Innovation PerspectiveInnovation Perspective•New Active IngredientsNew Active Ingredients•Proprietary positionsProprietary positions
Financial PerspectiveFinancial Perspective•GrowthGrowth•ProfitabilityProfitability•Industry leadershipIndustry leadership
*Differentiation/Quality*Differentiation/QualityStrategyStrategy

Case 2-1: Atlantic City Casino
Background– HCA purchased LV casino, constructed another– Casino is an independent operating unit – Low ROI (better return in CDs)– Casino located several blocks off of main strip– Proposal for new entertainment center at casino– Management is cautious

Value Chain Analysis For HCA
Value chain analysis– Casino operations (4th)– Hotel operations (5th)– Food/beverage operations (1st)
Casinos with similar revenues have greater net income Casino has been profitable from day one Cost reduction ideas
– Need more information Value-added ideas
– Improve access to the casino– Carry carnival theme into casino– Headline attractions to draw customers– Complimentary gaming chips for theme park customers
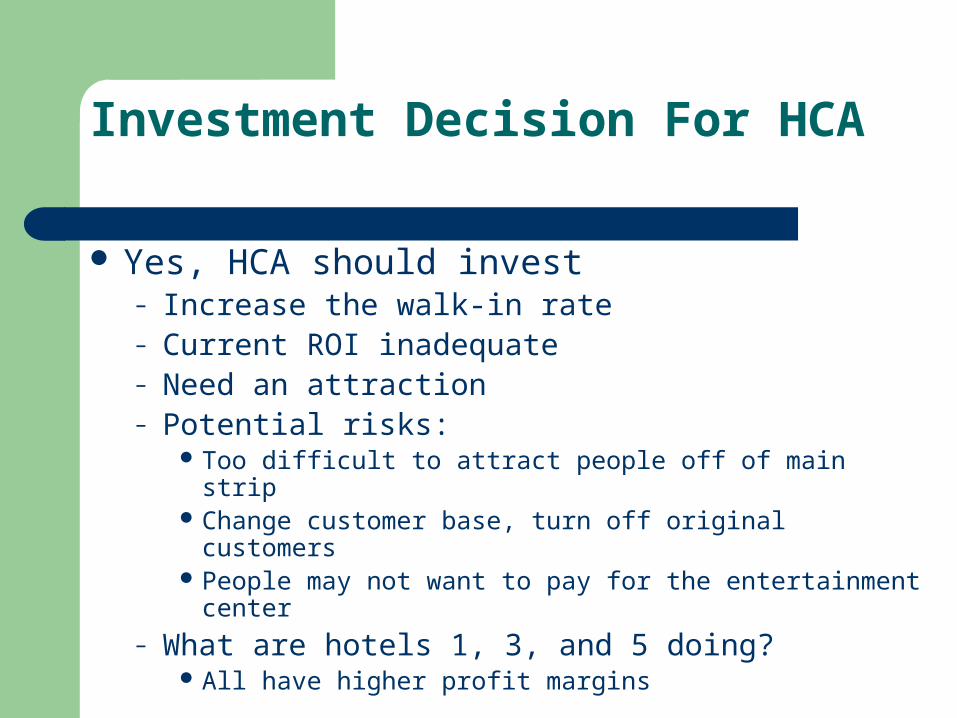
Investment Decision For HCA
Yes, HCA should invest – Increase the walk-in rate– Current ROI inadequate– Need an attraction – Potential risks:
Too difficult to attract people off of main strip Change customer base, turn off original customers People may not want to pay for the entertainment center
– What are hotels 1, 3, and 5 doing? All have higher profit margins
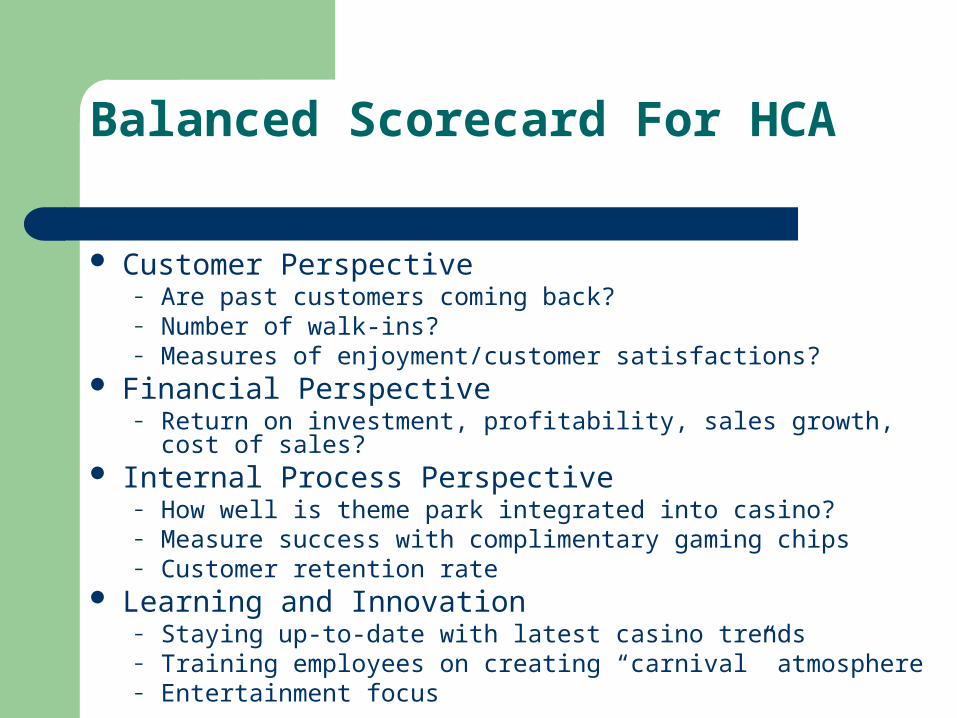
Balanced Scorecard For HCA
Customer Perspective– Are past customers coming back?– Number of walk-ins?– Measures of enjoyment/customer satisfactions?
Financial Perspective– Return on investment, profitability, sales growth, cost of sales?
Internal Process Perspective– How well is theme park integrated into casino?– Measure success with complimentary gaming chips– Customer retention rate
Learning and Innovation– Staying up-to-date with latest casino trends– Training employees on creating “carnival” atmosphere– Entertainment focus