Embed Size (px)
Citation preview

Group 1.4
Effect of Magnesium Aspartate Dihydrate on the Permeability of Escitalopram in the Colon
using Caco-2 Cells By Aya Alaouie, Israa Alshara, Matthew Baldock, Quang Hoai Trang Betty Nguyen & Michael Stephens
Abbreviations Introduction Hypothesis and Expected Results Method
Materials Stock Solution Production Development of 12 Well Plate Generation of Standard Curve for Measurement of Escitalopram
Results Discussion & Conclusion References Appendix
Appendix A Escitalopram Oxalate Monograph References for Appendix A
Appendix B Caco2 Cell Culture Method Performed by Susan Manners Appendix B References
Appendix C Calculations for Concentration of Escitalopram, Magnesium Aspartate Dihydrate and Magnesium ions as ideal concentrations and stock solutions
Appendix C References Appendix D Calculations of Escitalopram Concentrations in Table 5
Abbreviations MADH Magnesium Aspartate DiHydrate SSRI Selective Serotonin Reuptake Inhibitor BBB Blood Brain Barrier DMSO DiMethyl SulphOxide HBSS Hank’s Balanced Salt Solution EOSS Escitalopram oxalate stock solution MGSS Magnesium Stock Solution
Introduction Depression affects around 1 million people in any one year in Australia and is the leading
cause of disability worldwide (Beyondblue pilot2015). Escitalopram is a commonly prescribed serotonin selective reuptake inhibitor (SSRI) used predominantly to treat major depressive
1

Group 1.4
disorder and generalised anxiety (eTG 2015, AMH 2015, Kaplan et al. 2012). Dosing ranges from 5mg to 20mg with the most common steady dosing being 10mg through an oral route of administration with a bioavailability of 80% (FDA 2015). Escitalopram, unlike other SSRIs follows linear pharmacokinetics, with minimal drug interaction potential. Additionally, it is actively transported by Pgp as a substrate. Pgp is extensively expressed in the intestinal epithelium and is responsible for pumping drugs back into the intestinal lumen (Alleret al,2009) and is inducible in the caco2 cells used in this experiment. As escitalopram is highly lipophilic with a logP of 3.5 which allows it to cross the blood brain barrier (BBB) (Konig, et al, 2013) and perform the desired pharmacological and therapeutic effect for the treatment of depression. Its lipophilicity also allows it to be easily absorbed through the intestinal wall which allows for the successful study of the drug in a caco2 cell. Escitalopram monograph is included as Appendix A.
Recent studies have emphasised the important role of trace elements in the function of the nervous system. Magnesium is an important biological coenzyme involved in more than 300 intracellular and biochemical reactions within the body. In 2010 it was proposed that hypomagnesaemia might be associated with significant adverse impacts on the central nervous system, leading to depression (Haensch, 2010). According to the literature, approximately 7% (JCI) of ingested magnesium will be absorbed via the oral route through the gut. Magnesium supplements are commonly bought by people suffering depression to help with the social anxiety, to be used within combination of an antidepressant medication such as Escitalopram (Camardese et al. 2012)
Magnesium salts and SSRI antidepressants, such as escitalopram, play roles in many different biological pathways in the body with significant overlap between them. As both are taken orally, absorption would take place via the gut together, if taken at the same time. While generally the dose of escitalopram stays the same longterm once the patient has found the desired effects, while, given that magnesium is a nonprescription, complementary item, dosage can be determined by the patient but studies have suggested that a does between 125300 mg daily to be most effective (Eby & Eby, 2006). This can lead to varying dosages of magnesium taken in the patient population. Given that there is a present knowledge gap in the literature to determine the effect of varying concentrations of magnesium on the absorption of escitalopram in the gut, this pilot study was designed to determine whether there could be any significant effect.
The aim of our study is to determine if supplementing with magnesium will have an effect on the intestinal absorption of Escitalopram using a caco2 cell assay. Further study from this might examine what sort of effect, and what concentration causes it. Then examination for the mechanism behind the effect should be explored.
2

Group 1.4
Hypothesis and Expected Results There are a lack of studies present that have explored the effect of increasing
concentrations of magnesium on the absorption of escitalopram, despite limited absorption of magnesium from oral administration. With this experiment we hypothesise that increasing magnesium concentration will reduce escitalopram absorption in caco2 cells. Hence, our expected results should show that as magnesium concentration increases, amount of absorbed escitalopram will decrease. this will be shown by increasing UV absorbance values of escitalopram on the apical side of the caco2 cell and an increase in absorbance on the apical side, using UV spectrophotometry at 238 nm (Kakde et al. 2009) with increasing concentrations of magnesium.
Method
Materials Magnesium aspartate dihydrate powder Escitalopram powder Dimethyl Sulfoxide (DMSO) Hank’s Balanced Salt Solution (HBSS) UV 24well microtitre plate 24well Caco2 cell monolayer with culture medium 10 uL, 100 uL and 1000uL Pipette and tips 100 mL and 10 mL measuring cylinder Spatula & Stirring rod Incubator UV spectrophotometer
Stock Solution Production Caco2 cells were acquired from the University of Technology Sydney and were cultured
by Susan Manners using a method in Appendix B. 20mg of escitalopram oxalate powder, equivalent to two tablets, was used to develop the stock solution for this experiment. An initial stock solution of 3.2μmol/mL escitalopram oxalate was prepared by dissolving 20 mg escitalopram in 0.15mL of 99% DMSO (FDA Lexapro) and then diluted to 1.0% DMSO with 14.85mL of HBSS buffer to achieve a stock solution with 3.2uM of escitalopram oxalate (Hubatsch 2011). Stock solutions of 410.84 μmol/mL magnesium were prepared by dissolving 2000 mg of magnesium aspartate dihydrate powder in 15 mL of HBSS. Four serial dilutions of the magnesium aspartate dihydrate stock solution was conducted to achieve 1:1, 1:3, 1:7 and 1:9 concentrations. This is to provide a spectrum which we anticipate to best reflect the relative concentrations of escitalopram and magnesium in the gut. For references for how the stock solution and ideal concentrations were calculated refer to Appendix C.
3

Group 1.4
Development of 12 Well Plate Using 24well transwell, 12 wells will contain a caco2 cell monolayer grown on a
permeable filter with culture medium. Table 1 documents the drug concentration of escitalopram and magnesium in the donor compartment.
Well No.
Escitalopram Oxalate Concentration (μmol/mL)
MADH Concentration (μmol/mL)
Proportion of EOSS, MGSS & HBSS Respectively
EOSS volume (mL)
MGSS volume (mL)
HbSS volume (mL)
1 1.609 0 1:0:1 0.100 0.000 0.100
2 1.609 0 1:0:1 0.100 0.000 0.100
3 1.609 10.27 10:1:9 0.100 0.010 0.090
4 1.609 10.27 10:1:9 0.100 0.010 0.090
5 1.609 25.68 8:1:7 0.100 0.0125 0.0875
6 1.609 25.68 8:1:7 0.100 0.0125 0.0875
7 1.609 51.36 4:1:3 0.100 0.025 0.075
8 1.609 51.36 4:1:3 0.100 0.025 0.075
9 1.609 102.71 2:1:1 0.100 0.050 0.050
10 1.609 102.71 2:1:1 0.100 0.050 0.050
11 1.609 205.43 1:1:0 0.100 0.100 0.000
12 1.609 205.43 1:1:0 0.100 0.100 0.000
Table 1 Concentrations of escitalopram oxalate and magnesium aspartate dihydrate in the donor compartments of the 12 wells containing caco2 cells with proportions of stock solutions of escitalopram oxalate, magnesium aspartate dihydrate and HBSS.
After addition of the respective components into the designated wells from Table 1 using a pipette, the 12well microtitre plate is incubated at 37oC for 3 hours. After 3 hours 0.2 mL of solution is extracted from the donor compartment of each well using a pipette and transferred to a UV 24well microtitre plate. The absorbance of escitalopram was measured in a UV spectrophotometer at 238 nm and recorded. The calculation of the concentration of the drug in each well was discerned using the BeerLambert equation (Hubatsch 2007).
4
Group 1.4
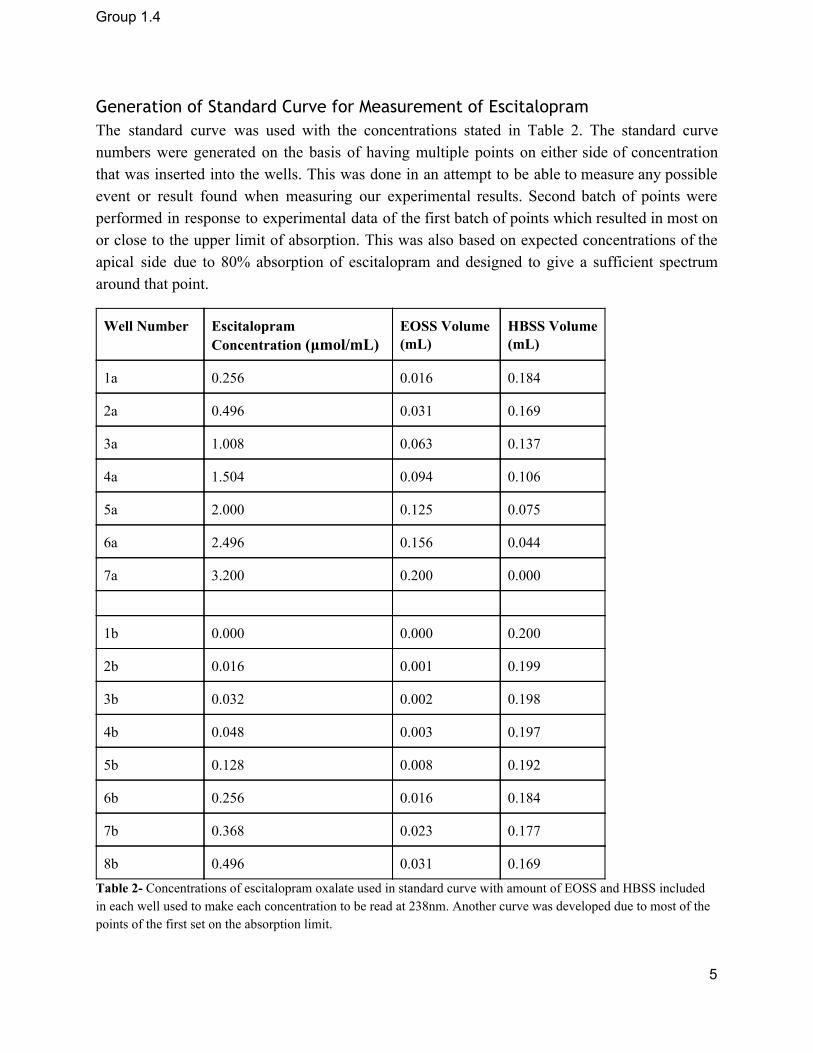
Generation of Standard Curve for Measurement of Escitalopram The standard curve was used with the concentrations stated in Table 2. The standard curve numbers were generated on the basis of having multiple points on either side of concentration that was inserted into the wells. This was done in an attempt to be able to measure any possible event or result found when measuring our experimental results. Second batch of points were performed in response to experimental data of the first batch of points which resulted in most on or close to the upper limit of absorption. This was also based on expected concentrations of the apical side due to 80% absorption of escitalopram and designed to give a sufficient spectrum around that point.
Well Number Escitalopram Concentration (μmol/mL)
EOSS Volume (mL)
HBSS Volume (mL)
1a 0.256 0.016 0.184
2a 0.496 0.031 0.169
3a 1.008 0.063 0.137
4a 1.504 0.094 0.106
5a 2.000 0.125 0.075
6a 2.496 0.156 0.044
7a 3.200 0.200 0.000
1b 0.000 0.000 0.200
2b 0.016 0.001 0.199
3b 0.032 0.002 0.198
4b 0.048 0.003 0.197
5b 0.128 0.008 0.192
6b 0.256 0.016 0.184
7b 0.368 0.023 0.177
8b 0.496 0.031 0.169 Table 2 Concentrations of escitalopram oxalate used in standard curve with amount of EOSS and HBSS included in each well used to make each concentration to be read at 238nm. Another curve was developed due to most of the points of the first set on the absorption limit.
5

Group 1.4
Once the absorbance of the standard curve points are collected, they will be examined using the BeerLambert equation to calculate the experimental concentrations. The standard curve will be plotted using a scatter plot and linear trendline added. This will be the basis of the escitalopram measurements and determination of the final concentrations of escitalopram in the Caco2 wells after the 3 hour incubation.
Results Well Number Escitalopram Concentration
(μmol/mL) Absorbance (238nm)
1 0.256 2.272500038
2 0.496 3.475199938
3 1.008 3.58739996
4 1.504 3.618700027
5 2.000 3.646600008
6 2.496 3.655100107
7 3.2 3.634299994 Table 3 This table depicts the absorbance of the points used of the initial standard curve in Figure 1. This includes the initial concentrations used and its respective absorbance.
Well Number Escitalopram Concentration (μmol/mL)
Absorbance (238nm) Adjusted Absorbance (238nm)
1 0 0.089900002 0
2 0.016 0.193900004 0.104000002
3 0.032 0.097999997 0.008099996
4 0.048 0.499199986 0.409299985
5 0.128 1.333899975 1.243999973
6 0.256 2.390899897 2.300999895
7 0.368 3.067699909 2.977799907
8 0.496 3.566800117 3.476900116 Table 4 This table depicts the concentrations and adjusted absorbance values used in Figure 2. The adjusted absorbance was calculated by subtracting the absorbance of the control data point at zero escitalopram concentration from all data points to depict absorbance purely due to presence of escitalopram.
6

Group 1.4
Figure 1 Standard curve using the initial standard curve points which were decided upon at the start of the experiment. Compares absorbance of Escitalopram Oxalate with concentration of values from 0.256 to 3.2μmol/mL. Reference values are in Table 3.
Figure 2 Standard curve using the adjusted standard curve points which were decided upon after examination of the standard curve using the initial set. Compares absorbance of Escitalopram Oxalate with concentration of values from 0 to 0.496μmol/mL. Reference values are presented in Table 4 using adjusted absorbance. Given R2 value is close to 1, the trendline can be seen to be representative of the data.
Figures 1 & 2 present with the graphed standard curve data from the results attained in tables 3 & 4. Given that Figure 3 shows that data obtained at the time had the data as it was reaching peak absorbance of escitalopram oxalate at 238 nm with only 1 point to give a good standard curve, this data is primarily ignored only to incite adjustments in our data. This resulted in the recording of the absorbance of points at and below concentration of 0.496μmol/mL to obtain a standard curve to better reflect absorbance of escitalopram oxalate. The concentrations used and their respective absorbances and adjusted absorbances are listed in Table 4 and graphed in Figure 2. This resulted in a better standard curve encompassing and offering a better reflection of absorbance change over variations of escitalopram oxalate concentrations.
7

Group 1.4
Well No.
MADH Concentration (μmol/mL) Absorbance
Average Absorbance
Adjusted Absorbance
Escitalopram Concentration
TTest pvalue Vs control
1
0 (control)
3.661000013
3.63259995 3.542699948 0.4154644606
N/A
2 3.604199886
3
10.27
3.620300055
3.616600037 3.526700035 0.4135880965 0.6340678135 4 3.612900019
5
25.68
3.62590003
3.612949967 3.523049965 0.4131600404 0.4241840545 6 3.599999905
7
51.36
3.661000013
3.631450057 3.541550055 0.4153296088 0.5 8 3.601900101
9
102.71
3.697299957
3.654049993 3.564149991 0.4179799801 0.3854991224 10 3.610800028
11
205.43
3.650399923
3.658450007 3.568550005 0.4184959847 0.6072904314 12 3.666500092
Table 5 Depicts the effects of the concentrations used in the experiment in the absorbance, calculated concentration of escitalopram and pvalue using the student's ttest of each concentration compared with the zero concentration control. All wells had 1.602umol/mL of escitalopram oxalate. Concentration calculation shown in Appendix D. Concentrations also suggest bioavailability of ~75%.
Figure 3 This figure depicts the absorption of escitalopram with the variable concentrations of magnesium. Error bars included in the columns provide the variation of 2 standard deviations. This uses the data in Table 5 of the adjusted absorbance and MADH concentration. As can be demonstrated by Figure 3 and Table 5, there is no significant difference between the absorbance of any of the varying MADH concentrations compared with the control with no magnesium. As can be demonstrated in Table 5, all pvalue results of the Student’s ttests comparing against control all values are vastly greater than 0.05 indicating no significant
8

Group 1.4
difference between the results. This suggests that there is no significant change in the permeability of escitalopram with the presence of magnesium.
Discussion & Conclusion After performing this experiment, there have been issues which should be addressed. Given the constraints of lacking amount of resources for the experiment, we could not provide additional data points when measuring the absorbances of varying magnesium. The data could have been pooled to provide a better mean and more accurate standard curve to determine whether magnesium does hold significance. In an ideal circumstance, more than 2 data points for each magnesium concentration would have been measured. However, given how comparable the data seemed to be and how they were so close, it would be unlikely that more data points would have significantly changed our result or conclusions. Another potential issue, would be the measurement of the data and standard curve. Given that the experimental absorbances observed were already close to the leveling off point and absorbance maximum, it would be beneficial to possibly use another source of measurement or wavelength for future experiments. Another alternative would be to use lowered concentrations, however they might not accurately affect the actual concentrations and reflect the real life scenario in the gut, thereby possibly not giving overtly significant result. This is especially given the fact the experimental bioavailability found in this study of 75% is close to the bioavailability found in the research of 80%. While there is nothing to possibly suggest that using a different source of measurement would affect end results, it would be beneficial to consider as a factor for other research. However, given our results, there doesn’t seem to be any other significant evidence to suggest that it would change significantly if measured differently or used more data points. In the view of the researchers, these results would be reflective and significant enough results to provide a reasonable answer to our original question. Therefore, as per our results, the permeability of escitalopram in the colon is not significantly affected by magnesium at concentrations potentially found in the body. Given that magnesium, at least in the MADH form, does not significantly affect the absorption of escitalopram, there is no clinical need to separate the doses of either from the other for the reason of poor permeability. Given that our study suggests that the magnesium does not affect the permeability of escitalopram, further studies should be used to determine the therapeutic place of magnesium in depression. In further studies, it might be beneficial to further examine the therapeutic effect of magnesium in depression and further examined in clinical trials to determine proper dosage. This will help give magnesium added credibility as a therapy or adjunct therapy in depression. Further clinical trials should also be examined in depressed people comparing efficacy of depression medications such as escitalopram with and without magnesium adjunct therapy. If positive results come from further studies, it could be anticipated to combine antidepressants with
9

Group 1.4
magnesium in one tablet as a combination therapy to improve adherence, reduced tablet burden and reduce cost to the patient to further improve health outcomes. References
1. Australian Medicine Handbook 2015, ‘Escitalopram Dosage Adult’, viewed: 11/09/15 <https://amhonlineamhnetau.ezproxy.lib.uts.edu.au/chapters/chap18/antidepressants/ssris/escitalopram>
2. Beyond Blue 2015, ‘The Facts’, viewed: 11/09/15 <https://www.beyondblue.org.au/thefacts>
3. Camardese G, De Risio L, Pizi G, Mattioli B, Buccelletti F, Serrani R et al. Plasma magnesium levels and treatment outcome in depressed patients. Nutr Neurosci2012;15: 78–84.
4. Eby. G, and Eby. K., 2006, Rapid recovery from major depression using magnesium treatment. Medical Hypotheses 67(2) pp. 360370
5. Electronic Therapeutic Guidelines (eTG) 2015, ‘Table 8.13 Initial Treatment Options for Major Depression’, viewed: 11/09/2015, <http://online.tg.org.au.ezproxy.lib.uts.edu.au/ip/desktop/index.htm>
6. FDA, ‘Lexapro Description’ viewed: 27/08/15 <http://www.fda.gov/ohrms/dockets/ac/04/briefing/20044065b122tab11CLexaproTabsSLR015.pdf>
7. Fine K.D., Santa Ana C.A., Porter J.L. & Fordtran J.S., 1991, ‘Intestinal absorption of magnesium from food and supplements’, The Journal of Clinical Investigation, vol. 88(2), pp. 396402.
8. Haensch CA. Cerebrospinal fluid magnesium level in different neurological disorders. Neurosci Med 2010; 1: 60.
9. Hubatsch, I., Ragnarsson, E. G., & Artursson, P. (2007). Determination of drug permeability and prediction of drug absorption in Caco2 monolayers. Nature protocols, 2(9), 21112119.
10. Kakde, R. B., & Satone, D. D. (2009). Spectrophotometric method for simultaneous estimation of escitalopram oxalate and clonazepam in tablet dosage form.Indian journal of pharmaceutical sciences, 71(6), 702.
11. Kaplan C, Zhang Y. Assessing the comparativeeffectiveness of antidepressants commonly prescribed for depression in the US Medicare population. J Ment Health Policy Econ. 2012 Dec;15(4):1718.
12. Konig J, Muller F, Fromm MF. Transporters and drugdrug interactions: Important determinants of drug disposition and effects. Pharmacol Rev 2013;65:94466
13. National Institute of Health 2013, ‘Magnesiumfact sheet for health professionals’, viewed 27 Aug. 15, https://ods.od.nih.gov/factsheets/MagnesiumHealthProfessional/
10

Group 1.4
14. Stephen Aller; Jodie Yu, Andrew Ward, Yue Weng, Srinivas Chittaboina, Rupeng Zhuo, Patina M. Harrell, Yenphuong T. Trinh,Qinghai Zhang, Ina L. Urbatsch, Geoffrey Chang (2009). "Structure of Pglycoprotein Reveals a Molecular Basis for PolySpecific Drug Binding". Science (Science) 323 (5922): 1718–1722
15. Yary T., Aazami S., and Soleimannejad K., 2013, ‘Dietary Intake of Magnesium May Modulate Depression’, Biological Trace Element Research, vol. 151 (3), pp. 324329.
Appendix
Appendix A- Escitalopram Oxalate Monograph ESCITALOPRAM MONOGRAPH
(Pubchem.ncbi.nlm.nih.gov, 2015)
Drug class
Antianxiety and Antidepressant. Active ingredient Escitalopram oxalate Pharmacology
Indications
11

Group 1.4
Escitalopram oxalate indicated for various psychological conditions including: major depression, generalised anxiety disorders (including panic disorders), social phobia, obsessive compulsive disorder (OCD) (AMH Online, 2015).
Mode of Action
Escitalopram inhibits the CNS neuronal reuptake of serotonin. This occurs at the serotonin reuptake pump of the neuronal membrane, which enhances the actions of serotonin on 5HT1A autoreceptors (Pubchem.ncbi.nlm.nih.gov, 2015).
Receptor binding
High affinity for the serotonin transporter and very low affinity for a number of receptors such as 5HT1A, 5HT2, dopamine D1 and D2 receptors, histamine H1, muscarine cholinergic, benzodiazepine, and opioid receptors. http://www.medsafe.govt.nz/profs/datasheet/l/Lexaprotab.pdf
Pharmacokinetics
Metabolism Hepatic metabolism. Enzymes: CYP3A4, CYP2C19 and CYP2D6
Metabolites Sdemethylcitalopram (SDCT) and Sdidemethylcitalopram (SDDCT)
Absolute Bioavailability ~ 80% (relative to an IV dose) after 4 hours
Route of Elimination Urine: escitalopram about 8% & Sdemethylcitalopram (SDCT) about 10%
Clearance 600mL/min (approx. 7% is due to renal clearance)
Biological Halflife 2732 hours
LogP 3.5
Volume of Distribution 1226L/kg
Protein Binding About 56%
Hydrogen Bond Acceptor count Hydrogen Bond Donor count Rotatable Bond count
4 0 5
12
Group 1.4
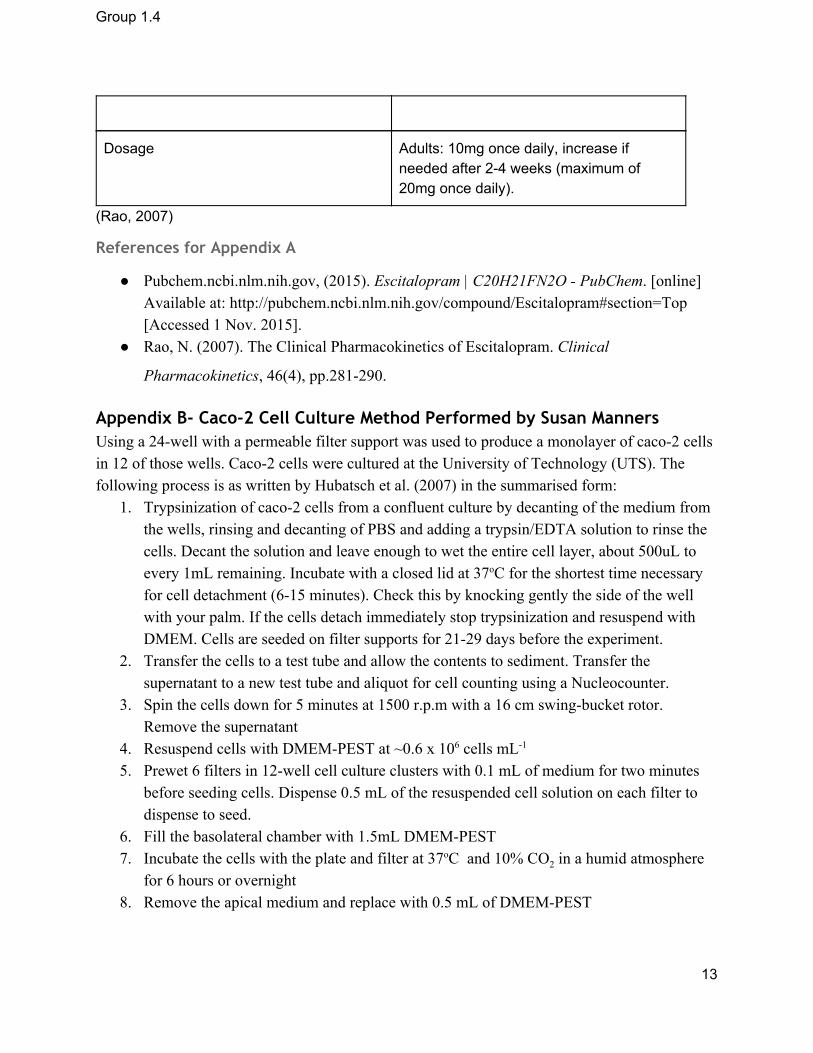
Dosage Adults: 10mg once daily, increase if needed after 24 weeks (maximum of 20mg once daily).
(Rao, 2007)
References for Appendix A
Pubchem.ncbi.nlm.nih.gov, (2015). Escitalopram | C20H21FN2O PubChem. [online] Available at: http://pubchem.ncbi.nlm.nih.gov/compound/Escitalopram#section=Top [Accessed 1 Nov. 2015].
Rao, N. (2007). The Clinical Pharmacokinetics of Escitalopram. Clinical
Pharmacokinetics, 46(4), pp.281290.
Appendix B- Caco-2 Cell Culture Method Performed by Susan Manners Using a 24well with a permeable filter support was used to produce a monolayer of caco2 cells in 12 of those wells. Caco2 cells were cultured at the University of Technology (UTS). The following process is as written by Hubatsch et al. (2007) in the summarised form:
1. Trypsinization of caco2 cells from a confluent culture by decanting of the medium from the wells, rinsing and decanting of PBS and adding a trypsin/EDTA solution to rinse the cells. Decant the solution and leave enough to wet the entire cell layer, about 500uL to every 1mL remaining. Incubate with a closed lid at 37oC for the shortest time necessary for cell detachment (615 minutes). Check this by knocking gently the side of the well with your palm. If the cells detach immediately stop trypsinization and resuspend with DMEM. Cells are seeded on filter supports for 2129 days before the experiment.
2. Transfer the cells to a test tube and allow the contents to sediment. Transfer the supernatant to a new test tube and aliquot for cell counting using a Nucleocounter.
3. Spin the cells down for 5 minutes at 1500 r.p.m with a 16 cm swingbucket rotor. Remove the supernatant
4. Resuspend cells with DMEMPEST at ~0.6 x 10⁶ cells mL1 5. Prewet 6 filters in 12well cell culture clusters with 0.1 mL of medium for two minutes
before seeding cells. Dispense 0.5 mL of the resuspended cell solution on each filter to dispense to seed.
6. Fill the basolateral chamber with 1.5mL DMEMPEST 7. Incubate the cells with the plate and filter at 37oC and 10% CO2 in a humid atmosphere
for 6 hours or overnight 8. Remove the apical medium and replace with 0.5 mL of DMEMPEST
13

Group 1.4
9. Maintain cells every second day via aspiring the medium from the basolateral side of all wells, and then, slowly, from the apical side. Replace the aspirated medium with DMEMPEST in the basolateral (1.5 mL) and apical (0.5 mL) side respectively.
10. Repeat step 9 for 2129 days 11. For the final preparations, change the cell culture medium 1224 hours before the
experiment.
Appendix B References Hubatsch, I., Ragnarsson, E. G., & Artursson, P. (2007). Determination of drug
permeability and prediction of drug absorption in Caco2 monolayers. Nature protocols, 2(9), 21112119.
Appendix C- Calculations for Concentration of Escitalopram, Magnesium Aspartate Dihydrate and Magnesium ions as ideal concentrations and stock solutions
These calculations are based on the assumption of that neither escitalopram or magnesium are absorbed before reaching the colon and all contents of each tablet reach the colon unharmed. Volume of colon liquid contents assumed to be 15 mL based on study performed by C. Schiller et al1 and found the mean of the liquid contents between the participants who had food previously and fasting participants. Both groups were found to have no significant difference between the mean liquid contents, so values are taken to be the same and mean was found to be 15 mL.
Given that volume (V) has been determined to be 15 mL and dosage of escitalopram that is being used in this experiment is 10 mg (m), the concentration (C) was determined through the following equation.
C=m/V
Through substitution, the concentration of escitalopram determined was determined to be 0.667 mg/mL. The magnesium aspartate dihydrate and magnesium ion concentrations was found through the same way, with masses of 500 mg and 37.4 mg, respectively, based on the values given by Blackmore’s Magmin and their website2. The concentrations were found to be 33.33 mg/mL/tablet and 2.49 mg/mL/tablet, respectively. Concentrations were then translated into molar concentrations (M) using the following equation.
M=C/(MW)
Conversions into molar concentrations were then performed using molecular weights (MW) of 414.43g for escitalopram oxalate, 324.53 for magnesium aspartate dihydrate and
14

Group 1.4
24.305 for magnesium ions. Concentrations were found to be 1.6086μmol/mL, 102.71μmol/mL and 102.53μmol/mL respectively.
As the method requires that half of the volume in each well is dedicated to either the escitalopram solution or magnesium solution, stock solutions must be made up of double the concentrations listed previously. This is due to the solution will be diluted by a factor of 2 which will not necessarily give the required concentration to best reflect concentrations in the gut. Therefore, in order to give ideal concentrations, double the previously listed concentrations must be used. Therapeutically, 10 mg of Escitalopram can be increased to 20 mg by prescribers for patients if required after 24 weeks of the lower dose (AMH 2015).
Appendix C References Australian Medicine Handbook 2015, ‘Escitalopram Dosage Adult’, viewed: 11/09/15
<https://amhonlineamhnetau.ezproxy.lib.uts.edu.au/chapters/chap18/antidepressants/ssris/escitalopram>
Blackmores. 2014. MagMin® Blackmores. [ONLINE] Available at: http://www.blackmores.com.au/products/magmin. [Accessed 27 August 15].
Schiller, C., 2005. Intestinal fluid volumes and transit of dosage forms as assessed by magnetic resonance imaging. Alimentary Pharmacology & Therapeutics, 22, 971979.
Appendix D- Calculations of Escitalopram Concentrations in Table 5 The concentration of the escitalopram oxalate in Table 5 was calculated from the use of the Beerlambert Law as follows. A = β * l * c This is where A is the absorbance, c is the concentration, l is the path length taken as 1 and is β the absorptivity coefficient. Initially, the standard curve in Figure 2 was used to calculate the absorptivity coefficient for Escitalopram. The point used was where 0.048μmol/mL as moles per litre (4.8*105M) has the absorbance of 0.409299985 due to the point lying on the line in Figure 2. However, one assumption made is that the concentration of 0 should pass through the 0 absorption point. Given this point, the absorptivity coefficient ( ) was found to be 8527.083021.β Upon finding the absorptivity coefficient, the concentrations of the experimental escitalopram was calculated were determined from their respective concentrations. This was done through the division of the absorption by the absorptivity coefficient, then converted back from molarity (mol/L) to μmol/mL and inserted into Table 5.
15