Embed Size (px)
Citation preview

7 Groundwater 7 GROUNDWATER .......................................................................................................................... 115
7.1 GROUNDWATER: MAIN POINTS...................................................................................................... 116 7.2 INTRODUCTION TO GROUNDWATER IN NORTHLAND ...................................................................... 117 7.3 REGIONAL POLICY STATEMENT OBJECTIVES ................................................................................. 117 7.4 GROUNDWATER ISSUES.................................................................................................................. 117 7.5 PRESSURES AFFECTING GROUNDWATER QUALITY AND QUANTITY............................................... 118
7.5.1 Groundwater Takes .............................................................................................................. 118 7.5.2 Installation/Construction of Bores........................................................................................ 121 7.5.3 Land Use Change ................................................................................................................. 122
7.6 STATE OF GROUNDWATER IN NORTHLAND .................................................................................... 123 7.6.1 Assessment of Groundwater Resource Characteristics ........................................................ 123 7.6.2 Groundwater Quantity.......................................................................................................... 126 7.6.3 Groundwater Quality............................................................................................................ 130
7.7 RESPONSE TO GROUNDWATER ISSUES ........................................................................................... 134 7.7.1 Northland Regional Council................................................................................................. 134
7.8 CASE STUDY: AUPOURI AQUIFER SUSTAINABLE YIELD GROUNDWATER MODELLING STUDY ...... 137
Northland Regional Council State of the Environment Report 2002
115

7.1 Groundwater: Main Points Pressures Changing land use from traditional farming to orcharding and market gardening,
together with an increase in tourism has resulted in increasing pressure on many of Northland’s aquifers.
The largest user of groundwater in Northland is agriculture, particularly horticultural irrigation.
Changes in land use have the potential to alter the recharge rates of underlying aquifers.
Northland’s many coastal aquifers are at risk from saltwater intrusion and contamination from poorly maintained effluent disposal systems.
State Northland’s variable geology has a major influence on surface water flow regimes
and degree of groundwater recharge. Groundwater quality at all sites monitored meets the Ministry of Health 1995 National
Drinking Water Standards. Pesticide residue surveys have shown concentrations well below the maximum
acceptable value for drinking water in the aquifers sampled. Response The Regional Water and Soil Plan contains rules covering groundwater takes, use,
diversions, and drilling activities that have the potential to affect groundwater resources.
State of the Environment groundwater monitoring programme gathers baseline information on the quantity and quality of different aquifers in Northland. The groundwater quality network is soon to be extended.
A number of investigations of aquifers have been carried out as the result of specific issues arising in different areas.
Northland Regional Council State of the Environment Report 2002
116

7.2 Introduction to Groundwater in Northland Groundwater is water that is found under the ground in geological structures called aquifers. Aquifers store, transmit and release water that seeps into the ground. Groundwater in Northland is highly variable in both quantity and quality depending on the geology of the aquifer and overlying land use. The main aquifers in the region exist in the Kerikeri/Kaikohe and Whangarei basalts, and the Aupouri sands. There are also many smaller coastal sand aquifers, and generally less productive greywacke aquifers throughout the region. The main source of the water that seeps into the aquifers (recharge) in Northland is directly from rainfall, as opposed to recharge from rivers or lakes. Groundwater is predominantly used in areas where there is a productive aquifer system and the surface water quality and/or quantity does not meet the needs of the resource users. Groundwater is now taken from an estimated 1200 bores throughout Northland for domestic and farm requirements, horticultural irrigation, industrial needs and numerous public water supplies. 7.3 Regional Policy Statement Objectives The Northland Regional Council’s prime environmental objective for the management of Northland’s groundwater resources is to: Maintain groundwater quantity and quality to the extent that the use of the
groundwater resources is sustainable. 7.4 Groundwater Issues The key issues relating to groundwater in Northland are: • Groundwater Quantity
• Effects of taking groundwater Groundwater resources need to be allocated fairly and the effects of taking groundwater need to be managed so as to avoid, remedy or mitigate adverse effects on the groundwater resources and groundwater users.
• Water quality • Influence of surface activities • Effects of taking • Bore construction • Saline Intrusion
• Changes in land use
• Groundwater and surface water interaction
Northland Regional Council State of the Environment Report 2002
117

Although groundwater and surface water are generally viewed as separate resources, in many cases throughout Northland groundwater emerges as springs and contributes to the flows of many streams and rivers in the region.
7.5 Pressures Affecting Groundwater Quality and Quantity 7.5.1 Groundwater Takes Changing land use from traditional farming to orcharding and market gardening during the last two decades, together with a steady increase in tourism has resulted in an increasing pressure on many of Northland’s aquifers. Prior to 1980 groundwater water abstraction in Northland was relatively minor as water was predominantly obtained from surface water supplies. The result has been an increase in groundwater abstraction from many aquifers. Groundwater in Northland is used for agricultural, horticultural, public water supply, industry, and a variety of other purposes. Groundwater takes that meet the permitted activity take rules set out in the Revised Proposed Regional Water and Soil Plan do not require resource consents. The majority of these takes are for domestic and stock requirements. Resource Consents to take groundwater are monitored to provide information on the cumulative allocation in the region. A summary of the bores registered with the Council, resource consents to take groundwater, and volumes allocated in the principal groundwater resources are shown in Table 14. The distribution of the consented groundwater takes and registered bores are also shown in Map 11.
Northland Regional Council State of the Environment Report 2002
118

Table 14: Consents and wells survey information held by the Northland Regional Council for principal aquifers in Northland. Aquifer/ Basin Consents to Take
groundwater Number of wells or bores registered with the NRC
Maximum Quantity of water allocated by Consents (m3/day)
Aupouri
42 362 8774
Kerikeri Basalts (including Kaikohe)
21 622 2593
Whangarei Glenbervie
15 76 799
Whangarei Matarau
2 25 45
Whangarei Maungakaramea
6 30 679
Whangarei Maunu- Whatitiri – Maungatapere
28 149 3144
Whangarei Three Mile Bush
15 93 1018
Mangawhai 10 46 590
Tara 4 10 630
Eastern Coastal Aquifers
32 681 3993
Other aquifers
48 706 14517
TOTAL 223 2800 36782
Northland Regional Council State of the Environment Report 2002
119
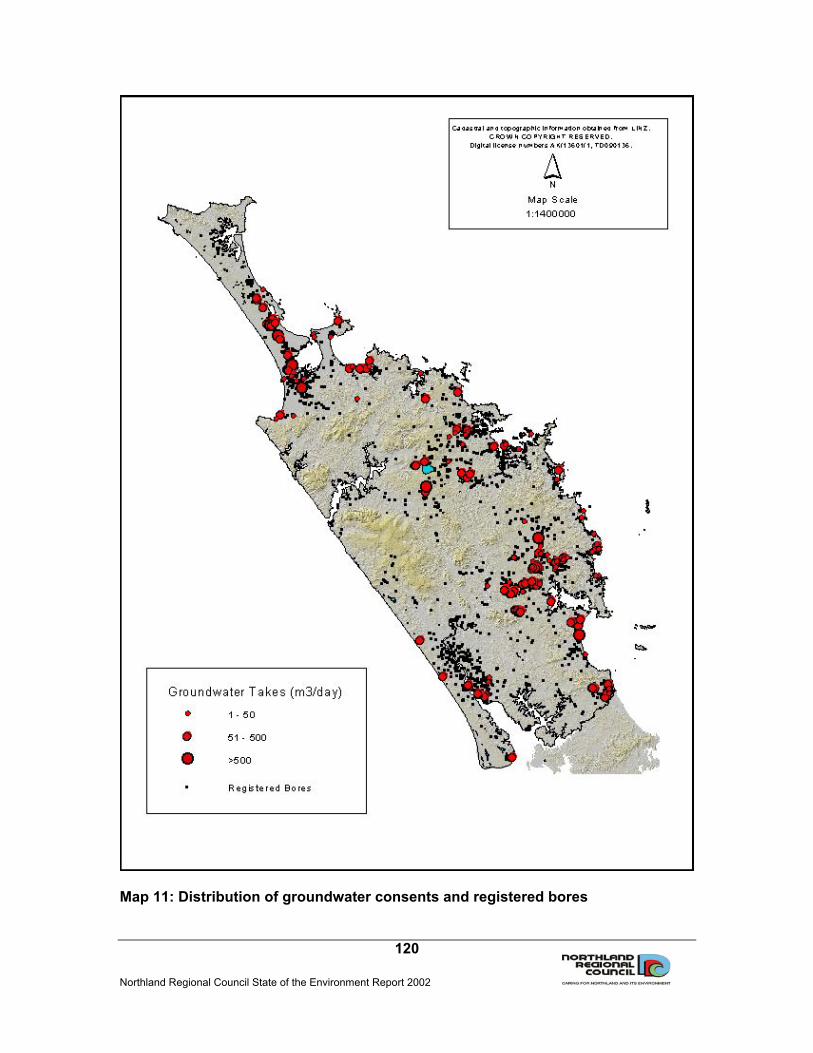
Map 11: Distribution of groundwater consents and registered bores
Northland Regional Council State of the Environment Report 2002
120

Up until recently not all existing bores have been registered with the Northland Regional Council, due to an informal relationship with the drillers operating in the region. A summary of the use of the resource consents to take groundwater in Northland is shown in Figure 23. The largest water allocation is for horticultural irrigation. However, although only 5% of consents granted are for the taking of groundwater for industry the volume actually allocated for industrial use equates to 36 % of the total volume of groundwater allocated. The majority of the industrial groundwater takes are outside the principal aquifers.
Figure 23: Groundwater allocation in Northland The distribution of the takes can identify areas where additional groundwater monitoring may be required to ensure the allocation is sustainable. 7.5.2 Installation/Construction of Bores Poorly constructed bores can result in groundwater contamination. This can occur in a variety of ways including: Surface contaminants flowing down the bore into the aquifer due to inadequate
grouting and sealing of the bore. Mixing of aquifers of different water quality as a result of poor bore design and
construction.
Volume Allocated
3%
44%
36%
2%15%
Agriculture
Industry
Water Supply
Horticulture
Other
Horticulture
Other
Consents
3%
58%5%
31%
3%
Agriculture
Industry
Water Supply
Northland Regional Council State of the Environment Report 2002
121

7.5.3 Land Use Change Changes in land use can not only result in an increase in the quantity of water taken from an aquifer but can also influence the amount of rainfall infiltrating into the aquifer (recharge) and groundwater quality. Development of forestry can result in interception of the rainfall via the tree roots and therefore reduces the recharge of an underlying aquifer. This can lead to a decline in the groundwater level and the amount of water flowing through the aquifer. Land use changes into more intensive farming practices, including dairying and horticulture, can result in increased abstraction from aquifers. Intensifying land use can also potentially lead to groundwater contamination, due to the substances applied to the ground surface over laying an aquifer. Housing developments can also reduce the amount of recharge into an aquifer, as the rainfall is intercepted via paved areas and roofing and the water is diverted as surface stormwater flows. The east coast of Northland has a large number of small coastal aquifers. Housing development in these areas can result in saltwater intrusion into the aquifer, due to reduced recharge and increased use. Housing developments above aquifers can also increase the risk of groundwater contamination due to inappropriate or poorly maintained effluent disposal systems (septic tanks). Groundwater quality pressures can also include discharges from farming activities, domestic wastewater, closed and existing landfills and industrial activities. Accidental spillages from underground storage tanks and road transported products may also result in contaminants entering groundwater.
Northland Regional Council State of the Environment Report 2002
122

7.6 State of Groundwater in Northland Monitoring and investigation is required to gain an understanding of the extent, quality and quantity of Northland’s groundwater resources. This is in order to identify environmental issues and trends and promote informed environmental decision-making. The state of the groundwater resource in Northland can be investigated by a number of methods. These include: Assessment of groundwater resource characteristics – drilling investigations and
pump tests. Monitoring quantity in a groundwater resource – Monitoring taking and drilling activities Monitoring recharge Monitoring groundwater levels
Monitoring water quality in a groundwater resource. Specific issue based investigations.
7.6.1 Assessment of Groundwater Resource Characteristics Drilling investigations and pump testing has been carried out throughout Northland to identify the basic characteristics of the groundwater resources. A summary of the aquifer characteristics for the principal groundwater resources is shown in the Table 15. The location of the principal groundwater resources is shown in Map 12.
Northland Regional Council State of the Environment Report 2002
123

Table 15: Summary of the aquifer characteristics for principal aquifers in Northland Aquifer Aquifer unit or
zone Broad lithologic description
Status eg. confined/semi-confined or unconfined
Saturated thickness in metres
Transmissivity in m2/day
Storativity %
Aupouri
Lower Aupouri Peninsula
Predominantly quartz and feldspar sands overlying limestone/ sandstone/mudstone
Semi unconfined to confined
12-90 12-850 0.07-0.00002
Kerikeri/Kaikohe Basalt overlying cretaceous siltstone
Semi-confined 50 70-170 0.020-0.072
Whangarei Matarau
Basalt flows, cones and dikes overlying sandstone/mudstone
Semi unconfined 8-20 108-3660
Whangarei Glenbervie Taheke Basalt overlying greywacke/ interbeded sandstone and mud stones
Semi confined 20-83
1 –36.78 0.002
Whangarei Maunu Taheke Basalt overlying sandstone/mudstone
Semi unconfined 8-58
30 – 89 0.002-0.0006
Whangarei Maungatapere Basalt with scoria overlying sandstone/mudstone
Semi confined 11-58 25-45
Whangarei Whatitiri
Taheke basalt overlying sandstone
Confined 4-30 25-4000 0.00004-0.0003
Whangarei Maungakaramea Basalt overlying Micaceous sandstone
Semi unconfined 45-55 3-400 0.03
Whangarei Three Mile Bush Basalt with scoria overlying sandstone/mudstone
Semi unconfined 8-55 3 – 80 0.04
Mangawhai Consolidated unweathered sands with quarts alluvial mud and gravel
Unconfined 8-50 5-440 0.00015-0.08
Taipa Sand feldspathic with some quartz
Unconfined 6 to 7 90 – 150 0.085-0.2
Tara Basalt flow with underlying sedimentary rocks
Semi unconfined 4-20 38-66
Russell Gravels overlying Waipapa group greywacke
Unconfined to semi unconfined
148-176
Other shallow coastal aquifers
Predominantly Sands / alluvial mud and gravel.
Unconfined
Northland Regional Council State of the Environment Report 2002
124

Map 12: Principle groundwater aquifers in Northland
Northland Regional Council State of the Environment Report 2002
125

7.6.2 Groundwater Quantity Groundwater Recharge and Discharge The main source of recharge for the aquifers in the region is rainfall. Lake water loss has been identified as a minor source of groundwater recharge in some areas of Northland (eg. Pakaraka, Aupouri). Groundwater recharge tends to occur in winter months due to higher seasonal rainfall and decreased evapotranspiration. Generally dryer summer conditions cause minimal effect on groundwater levels, but drier than normal winter rainfall conditions result in reduced groundwater recharge and low groundwater levels at the start of the following summer. Northland’s variable geology has a major influence on surface water flow regimes and degree of groundwater recharge. In permeable unconfined sand aquifers, a high percentage of rainfall infiltrates quickly into the ground recharging the groundwater. In these areas there is minimal rainfall runoff contributing to stream flow. On the Aupouri Peninsula, the sand aquifer contributes little to stream baseflow as the groundwater level is typically below the stream bed level. The sand aquifers predominantly discharge at or near the coast. The basalt aquifers have relatively rapid infiltration due to the fractured nature of the geology, and the existence of scoria cones. The predominant discharge from the basalt aquifers is spring flow originating on the edge of the basalt fields. This type of aquifer has considerable storage and the spring flow is generally maintained during dry periods. Spring flow is a major contribution to stream baseflow in the basalt areas. Catchments with a significant component of relatively low permeability greywacke sediment allow less infiltration of rainfall and have relatively low aquifer storage volumes. Stream flows in these catchments tend to recede quickly during dry summer periods.
Northland Regional Council State of the Environment Report 2002
126

Groundwater Level Monitoring Groundwater level is an important indicator for groundwater quantity. The groundwater level at different sites can vary significant over time and seasons. The main influences on groundwater levels are the recharge of the aquifer, groundwater abstraction and the discharge from the aquifer to surface waters. Decreases in groundwater levels can occur as a result of natural climatic conditions, changes in land use, or as a result of over abstraction. The locations of current and historic (closed) groundwater level monitoring sites are shown in Map 13. General Trends in Aquifer Systems Kaikohe and Whangarei Basalts Due to the rapid infiltration of rainfall through fractured basalt, groundwater levels in basalt aquifers increase rapidly in early winter, as a result of winter rains. The groundwater levels peak in the early summer and decline to their lowest level in late summer. The Whangarei basalts groundwater levels peaked in 1989, and were at the lowest during 1992 and 1994. In the winter of 2000 the groundwater levels had returned to a similar level to 1989. The seasonal variations in groundwater levels in the Whangarei Basalt are a direct result of the rainfall variations. The groundwater levels in the Whangarei Basalts measured at Puriri Park, Maunu, varies from the lowest recorded level of 12.8 metres below ground level (bgl) to 8.3 metres bgl. Several groundwater level monitoring sites in the Whangarei Basalts also show the influence of pumping of neighbouring bores. The monitoring indicates the in the Whangarei Basalts recovers reasonably quickly after a rainfall event, or when the pumping has ceased. Groundwater level in the Kaikohe Basalt Aquifer, with the exception of the Memorial Hill site, has a seasonal trend of lower groundwater levels in the late summer to early autumn and higher groundwater levels in the winter and early spring. The seasonal fluctuation in groundwater level in the Kaikohe Basalt at State Highway 12 ranges from approximately 4.0 m bgl to 8.9 m bgl. The results of monitoring the groundwater level at Memorial Hill site significantly differ to the trends shown at other sites monitored in the Kaikohe Basalt. The groundwater level in the Kaikohe Hill generally peaks in December with the minimum level recorded around June. The groundwater level at the Memorial Hill has varied from 49.0 m bgl to 59.1 m bgl. This variation in groundwater level and the differing seasonal trend at Memorial Hill is likely to be a direct result of groundwater abstraction from the site for the Kaikohe public water supply.
Northland Regional Council State of the Environment Report 2002
127

Map 13: Groundwater level monitoring sites
Northland Regional Council State of the Environment Report 2002
128

Mangawhai Sand Aquifer The Mangawhai Aquifer has a seasonal trend of lower groundwater levels in the late autumn (May, June and July) and higher groundwater water levels in the spring (October and November). The highest and lowest groundwater levels at Mangawhai Medical Centre are 3.5 m bgl and 6.6 m bgl, respectively. A general decrease in the groundwater levels at the site occurred from 1990 to 1995 due to below average rainfall, particularly in the summer months. A recovery in groundwater level occurred from 1995 to 1999 due to an increase in rainfall during this period. Aupouri Sand Aquifer Groundwater levels in Huketere forest area show less seasonal fluctuations than in the non forested areas on the Aupouri Peninsula. Groundwater levels peaked in 1989 and declined steadily until 1998, when they increased dramatically (as shown in Figure 24). The groundwater levels are now close to the 1989 level. The period 1991 to 1994 was a period of intense El Nino weather conditions that caused dry weather conditions for much of the Northland region (see case study: review of Aupouri aquifer sustainable yield groundwater modelling study).
28
-13800
-13500
-13000
-12500
-12000
-11500
-11300
-JAN-87 12:00 JAN-89 JAN-90 JAN-91 JAN-92 JAN-93 JAN-94 JAN-95 JAN-96 JAN-97 JAN-98 JAN-99 JAN-00
Depth below ground level (mm)
Figure 24: Groundwater Level at Hukatere Monitoring Bore, Aupouri Aquifer 1987– 2001
Northland Regional Council State of the Environment Report 2002
129

The variation in the groundwater levels in forested areas and non forested areas, and the decline in the groundwater level until 1998 suggest the afforestation in the area has had a noticeable effect on the groundwater levels and recharge into the aquifer. 7.6.3 Groundwater Quality The usefulness of groundwater is limited by its quality. The suitability of groundwater for drinking and other uses can be assessed through sampling for key indicators. These indicators include: General parameters, (electric conductivity, pH, alkalinity) Major cations (calcium, magnesium, sodium, potassium, iron, and manganese) Major anions (chloride, sulphate, nitrate, and phosphorus) Biological indicators (Faecal coliforms) Biocides (pesticides, herbicides and insecticides)
Generally when a groundwater system is contaminated as a result of human activities it is more costly and complex to clean up when compared to surface water contamination. It is therefore important to prevent contaminants entering aquifers. Northland Regional Council monitors seven groundwater sites at three-monthly intervals for major anions and cations. Groundwater quality at all monitored sites meets New Zealand Drinking Water Guidelines and does not require treatment for potable water supply (groundwater quality results are summarised in Table 16). The hydrochemistry of Northland’s groundwater is variable and reflects the aquifer geology from which the water is drawn. Table 16: Groundwater quality characteristics for Northland sites Parameter (average)
Ahipara (Aupouri)
Colville (Aupouri)
Far North (Aupouri)
Glenbervie Kaikohe Tara Tutukaka
Alkalinity 36
54 150 168 57 34 189
Br (mg/L) 0.10 0.35 0.18 0.07 0.06 0.08 0.65 Ca (mg/L) 4.1 5.7 34.1 40.7 10.4 5.8 7.4 Cl (mg/L) 32 31 52 15 12 18 172 Cond (mS/cm)
0.18 0.20 0.41 0.35 0.15 0.14 1.33
F (mg/L) 0.03 0.08 0.07 0.07 0.05 0.05 0.75 Fe (mg/L) 1.37 1.49 0.08 0.06 0.01 0.23 0.77 K (mg/L) 1.7 1.4 2.8 1.5 1.6 1.5 15.7 Mg (mg/L) 3.3 3.8 5.7 6.0 5.1 4.3 9.6 Mn (mg/L) 0.037 0.055 0.113 0.005 0.005 0.005 0.015 Na (mg/L) 26 30 45 19 14 14 279 NH4-N (mg/L)
0.041 0.006 0.047 0.006 0.005 0.005 0.009
NO3-N (mg/L)
0.192 0.004 0.019 1.014 3.475 2.374 0.124
pH 6.41 6.95 7.72 7.54 6.81 6.4 7.0 PO4-P (mg/L)
0.02 0.02 0.06 0.02 0.09 0.06 0.06
SiO2 (mg/L)
35 40 41 25 47 30 23
SO4 (mg/L)
7 9 9 11 2 3 259
Northland Regional Council State of the Environment Report 2002
130

Saltwater Intrusion The Aupouri aquifer is elevated in sodium and chloride concentrations above inland basalt aquifers reflecting the close proximity of the Aupouri aquifer to the coast and the leaching of these elements from marine sediments. There is potential for seawater contamination of coastal sand aquifers (for example at Taipa, Ngunguru, and Russell) during summer when groundwater levels decline due to increased groundwater abstraction and/or due to decreased groundwater recharge caused by below average rainfall. Groundwater level measurements, and sampling for groundwater chloride concentrations and electrical conductivity are undertaken in coastal bores in the Taipa aquifer to monitor for seawater intrusion. Electrical conductivity levels in the Taipa Sand Aquifer are elevated above inland basalt aquifer levels due to the seawater influence, this is also shown at Tutukaka (Figure 25). In addition to the saltwater intrusion, a number of small unconfined coastal aquifers are also at risk of bacterial contamination from septic tank and effluent disposal fields. (for example Russell and Matapouri).
Figure 25: Electrical conductivity in Northland Aquifers (1996-2001)
Northland Regional Council State of the Environment Report 2002
131

Nitrate Nitrate-nitrogen concentrations in all Northland aquifers are below New Zealand Drinking water guidelines (11.3 mg/L NO3-N). Nitrate-nitrogen measured in the Kaikohe Basalt aquifer range between approximately 3 and 4 mg/L (Figure 26).
Figure 26: Nitrate-nitrogen concentrations in Northland aquifers (1996-2001) Nitrate-nitrogen concentration in Glenbervie Aquifer fluctuates seasonally. Higher nitrate–nitrogen concentrations occur during winter when higher seasonal rainfall causes leaching of the nitrogen to the water table. Nitrate-nitrogen concentrations in Aupouri Aquifer are low (< 0.05 mg/L) but mean ammonia concentration is 9.8 mg/L reflecting the reducing conditions in the semi-confined to confined aquifer. A primary source of nitrogen is considered to be from animal waste and the discharge of dairy effluent to land. Other potential nitrogen sources include fertilisers and septic tank discharges. Table 17: Potential water quality limitations in reported aquifers
Aquifer/ Basin Potential Water Quality Problem
Source of problem Mitigation Measures
Shallow coastal aquifers
Salt water intrusion, bacterial contamination.
Proximity to coast and increased abstraction, old septic tanks
Regulated abstraction, effluent discharge, and maintenance of
effluent disposal systems Other Northland
Aquifers Nitrate leaching Dairy effluent application to land Regulated application
Northland Regional Council State of the Environment Report 2002
132

Iron Iron occurs naturally in groundwater depending on the geology. The results of groundwater quality monitoring indicate the iron levels at sites in Northland are acceptable. However it is noted that in some areas, such as shallow groundwater in the Aupouri area, iron content is elevated and causes discolouration of the groundwater. Excessive iron concentrations in groundwater gives water a rusty brown appearance, and can result in staining, irrigation system blockages and a general bad taste. Pesticides Surveys of Groundwater The Institute of Environmental Science and Research carried out a national survey of pesticides in groundwater in December 1998 (Close and Rosen, 2001). In Northland samples were taken at Ahipara, Taipa, Kaikohe, Whangarei, and Tara. The samples were analysed for forty-two pesticides. Tara was the only site at which pesticides were detected. Terbuthylazine was present at a concentration of 0.28 mg/m3, well below the maximum acceptable value for drinking water of 8.0 mg/m3 (Ministry of Health, 2000). A 1994 survey detected no pesticides at the five Northland sites tested. These were Houhora, Kaitaia, Kaikohe, Whangarei, and Tara. The detection limits for the 1998 survey were significantly lower than the limits for the 1994 survey Pesticide Movement through Soils Landcare Research, ESR and GNS are collaborating on studies examining contaminant movement through soils. Field trials on pesticide movement through soils have been carried out in Hawkes Bay and the Waikato. The aim of the study is to assess the contamination risk to groundwater from the application of pesticides to different soil types around New Zealand. A study site on basalt soil at Maungatapere near Whangarei was set up in November 1999. Selected pesticides were applied to the site, and both soil and soil water samples were taken 1 day, 1 month, and three months after application. Sampling will continue every three months until the trial is ended, in about a year, however chemical movement is relatively quick at the site and the trial may finish earlier than planned.
Northland Regional Council State of the Environment Report 2002
133

7.7 Response to Groundwater Issues 7.7.1 Northland Regional Council Policies and Plans The (Revised Proposed) Regional Soil and Water Plan for Northland details the objectives, policies and rules associated with groundwater management in the region. One of the main objectives for groundwater management in Northland is the sustainable use and development of Northland’s groundwater resources while avoiding, remedying or mitigating adverse effects on groundwater quantity and quality. The Plan recognises 36 basalt and coastal aquifers, and a geothermal aquifer as potentially ‘at risk’ due to the surrounding land use, surface water interaction, proximity to seawater and septic tank discharges. The rules in the Plan restrict groundwater takes, use, diversions and drilling activities depending on the potential effects of the activities. The rules permit groundwater takes for reasonable stock and domestic requirements provided specific criteria are met. The criteria, amongst other things, limits the daily permitted groundwater take depending on the location and the potential for adverse effects as a result of the take. For example smaller volumes are permitted to be taken from ‘at risk’ aquifers. In the event the permitted criteria specified in the rules can not be met then a resource consent to take groundwater is required from the Regional Council. Drilling activities are also permitted in Northland provided the activity is outside the ‘at risk’ aquifers identified in the Plan, and specific drilling standards and criteria are met. In the event that a drilling activity is within an ‘at risk’ aquifer or bore construction standards and criteria can not be met, then a resource consent to drill the bore is required. All bore construction and drilling information associated with any drilling activity in Northland is required to be forwarded to the Council. Resource consents to take groundwater, and drill a bore are subject to specific conditions. These conditions are imposed to avoid and/or minimise the potential adverse effects as a result of the activity. Monitoring the exercise of resource consents is carried out to ensure the conditions are complied with and the bore construction activities do not result in adverse effects on the environment. Monitoring of the general state of the groundwater resources in Northland also occurs. The primary aims of the state of the environment groundwater monitoring is to gain a regional perspective on: Baseline information on water quantity and quality of different aquifers. Determine any trends in groundwater quantity and quality over time as a result of the
climate, land use and groundwater abstraction. Ensure the management of the groundwater resources in Northland is sustainable
and consistent with the objectives and policies of the Northland Regional Plans.
Northland Regional Council State of the Environment Report 2002
134

The results of the monitoring resource consents and the general state of the groundwater resource can provide information on which to base future management decisions. In the event groundwater monitoring highlights issues in particular aquifers, specific investigations are initiated. State of Environment Groundwater Level Monitoring Groundwater level monitoring has been undertaken in the Northland region since the mid 1970s. Since that time the network has been developed in response to the identification of groundwater issues. Groundwater level monitoring is currently undertaken in all of the principal aquifer systems in the Northland area. Levels are monitored at six sites by automatic recorder and at 40 sites at monthly interval. The monitoring wells have been selected to provide regional coverage and target specific environmental concerns. Northland Regional Council is currently increasing the groundwater monitoring network to obtain more comprehensive information on the state of regional groundwater quality and quantity. State of Environment Groundwater Quality Monitoring To gain an understanding of seasonal and long term groundwater quality variation a groundwater quality network was established in 1996. This network consists of sampling seven sites on a quarterly basis. These sites are located in the areas of Houhora, Paparore, Ahipara, Kaikohe, Tutukaka, Whangarei and Tara. The samples are analysed for major cations, anions, nutrients and minor elements such as iron and magnesium. The groundwater quality network is to be extended 2001-2002 to gain a greater knowledge of groundwater quality throughout the region. It is anticipated the network will include at least 11 additional sites to specifically monitor for saltwater intrusion in coastal aquifers, and 5 sites to provide additional information on water quality in the principal groundwater resources. Specific Groundwater Investigations A number of investigations of aquifers have been carried out as a result of specific issues arising in an area. These investigations include the hydrogeology of the Whangarei and Kaikohe Basalts, Russell water resources, Aupouri groundwater resources, and the Managwhai saline intrusion study. Due to lack of recent groundwater information for the Ruawai and Russell areas, specific groundwater investigations are proposed for the 2001-2002. These investigations will gain information on the current sustainable allocation for these groundwater resources and the current groundwater quantity and quality information.
Northland Regional Council State of the Environment Report 2002
135

Recent Specific Investigations Aupouri Aquifer A groundwater flow model was developed in 2000 for the Aupouri Aquifer following noticeable decline in groundwater level since 1990 at Northland Regional Council monitoring wells in this aquifer. The model was developed to assess sustainable yields from the aquifer. Results of the model indicate that the aquifer is not over allocated. The observed decline in groundwater level was considered to be caused by periods of below average rainfall. The planting of Pinus Radiata forest is also considered to have caused a reduction in groundwater recharge over some of the modeled area. Further study in the effects of afforestation will be considered in the 2002 financial year. Review of Aquifer Management Extents Nine aquifers in Northland have recently been reviewed to identify appropriate management boundaries which are to be incorporated into the Revised Proposed Regional Water and Soil Plan for Northland. These aquifers are Mangawhai, Aupouri, Maunu, Bland Bay, Coopers Beach, Taipa, Oakura, and Ruawai. Taipa Taipa is a small coastal settlement located on an sand spit in Doubtless Bay. A small aquifer exists in the sand spit. The aquifer has saltwater bodies on the northern and western boundaries. The aquifer has a small recharge area and is highly at risk from saline intrusion. Dewatering to enable the installation of sewer pipelines occurred in the early 1990s. This dewatering resulted in saline contamination of several bores along the western boundary of the estuary. A further incident occurred in 1999 as a result a leaking underground petrol tank. Specific groundwater monitoring has been undertaken in the area. Although the monitoring indicates the groundwater quality at the sampling sites meets the New Zealand drinking water standards, due to the sensitivity of the system long term water quality and quantity monitoring will continue. Russell The Russell aquifer is potentially at risk of saltwater intrusion from overuse and the effects of urbanisation and land use changes. An investigation is being carried out to determine the current water quality in area, a safe yield for the aquifer and to identify appropriate management options to ensure the sustainable use of the aquifer.
Northland Regional Council State of the Environment Report 2002
136

7.8 Case Study: Aupouri Aquifer Sustainable Yield Groundwater Modelling Study The Aupouri Aquifer System is a valuable water resource for residents and property owners on the Aupouri Peninsula. The land on the Aupouri Peninsula is suitable for water intensive land uses such as horticulture. There are several areas on the Peninsula with high actual and potential groundwater abstraction. Concern has been raised regarding the effects of the current groundwater abstraction and the quantity of water available in the Aupouri Aquifer System for future allocations. The Council commissioned HydroGeo Solutions to complete a study on the sustainable yield of the Aupouri Aquifer and develop a groundwater model of the Aupouri Aquifer. The sustainable yield of an aquifer is the amount of groundwater that can be withdrawn annually without producing any undesirable results. Assessment of the sustainable yield requires consideration of technical, social and economical factors affecting the aquifer, aquifer users and the surrounding environment. The following is a brief summary of the study, findings and recommendations detailed in the consultant's, and prioritised steps that are recommended to be initiated by the Council. Background of Model Construction and Simulation A two layer regional model of the Aupouri aquifer was developed in “Visual MODFLOW”, using data provided by the Regional Council. The model was calibrated and sensitivity analysis was carried out. This assessment showed that the model provides an acceptable simulation to measured field conditions, and the model is most sensitive to recharge and hydraulic conductivity and least sensitive to storage. The average error range was estimated at approximately 3 to 10 % of the average difference in groundwater elevation across the aquifer. Once the calibrations and sensitivity analysis were completed, the model was used to simulate the performance of the aquifer under varying groundwater abstraction rates. The simulations involved 105 year runs using groundwater recharge estimates based on rainfall records from 1890’s to present day and five abstraction scenarios. The abstraction scenarios were: zero groundwater abstraction, 50%, 100%, 250% and 500% of currently allocated allowable abstraction. Findings of the Modelling There is negligible difference in the response of the aquifer after 105 years from the zero abstraction to the current abstraction scenarios. This indicates the current groundwater allocation is having negligible impact on the regional water table over the long term. Results for the 500 % abstraction scenarios indicates localised depressurisation in the area of the pumping bores, but little difference elsewhere in the aquifer.
Northland Regional Council State of the Environment Report 2002
137

Localised decrease in groundwater levels may occur during below average rainfall periods, but the high sensitivity of the aquifer to rainfall recharge suggests that the aquifer will recover rapidly during subsequent wet periods. Over the long-term, the groundwater levels were shown to fluctuate significantly depending on prevailing climatic conditions. The planting of large areas of pine forest has had a marked effect on water levels in the middle forest over the last 20 years in the Hukatere-Houhora transect. The study provides the Council with a preliminary model that has increased the level of understanding of the aquifer and will assist in future management and decision making. The model is limited in a number of areas, however, the model may be refined when additional data information becomes available. The report details a number of recommendations as a result of the study and modeling exercise. These recommendations have been reviewed and acted on in accordance to current priority.
Northland Regional Council State of the Environment Report 2002
138