Embed Size (px)
Citation preview

i
DISTRICT GROUND WATER BROCHURE
GOVERNMENT OF INDIA
MINISTRY OF WATER RESOURCES
CENTRAL GROUND WATER BOARD
GROUND WATER SCENARIO OF KOTA DISTRICT
WESTERN REGION JAIPUR
2013
i
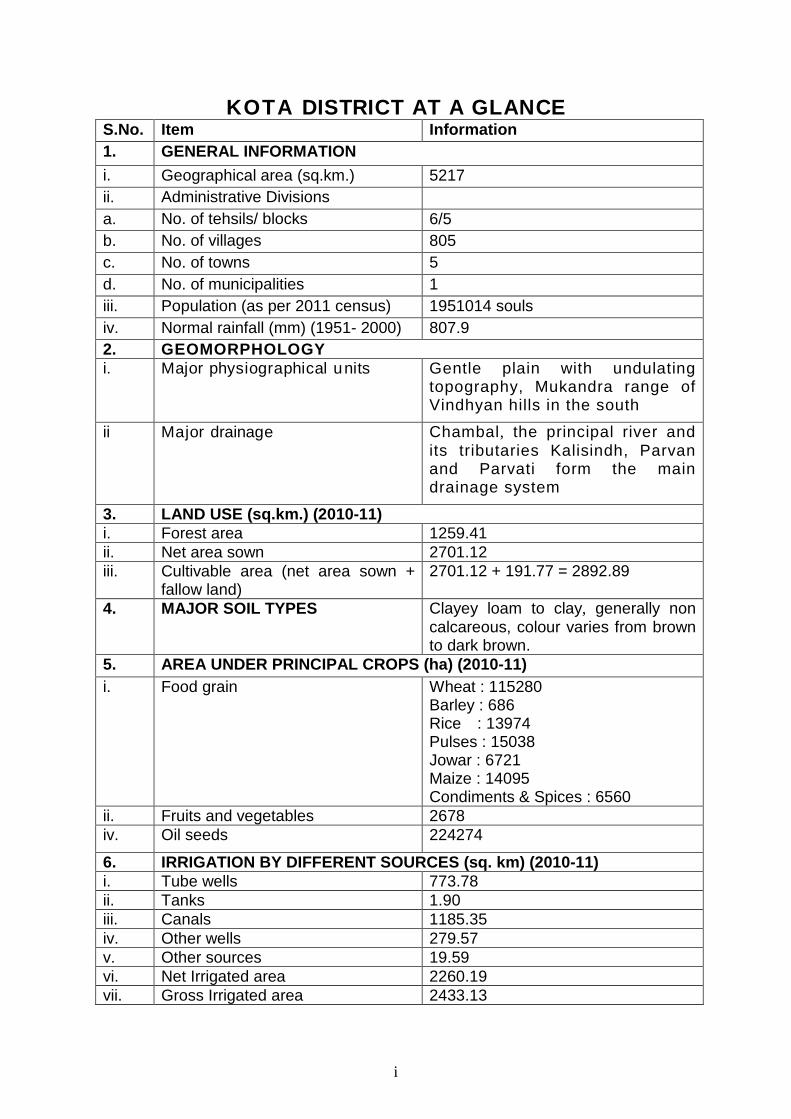
KOTA DISTRICT AT A GLANCE S.No. Item Information 1. GENERAL INFORMATION
i. Geographical area (sq.km.) 5217 ii. Administrative Divisions a. No. of tehsils/ blocks 6/5 b. No. of villages 805 c. No. of towns 5 d. No. of municipalities 1 iii. Population (as per 2011 census) 1951014 souls iv. Normal rainfall (mm) (1951- 2000) 807.9 2. GEOMORPHOLOGY i. Major physiographical units Gentle plain with undulating
topography, Mukandra range of Vindhyan hills in the south
ii Major drainage Chambal, the principal river and its tributaries Kalisindh, Parvan and Parvati form the main drainage system
3. LAND USE (sq.km.) (2010-11) i. Forest area 1259.41 ii. Net area sown 2701.12 iii. Cultivable area (net area sown +
fallow land) 2701.12 + 191.77 = 2892.89
4. MAJOR SOIL TYPES Clayey loam to clay, generally non calcareous, colour varies from brown to dark brown.
5. AREA UNDER PRINCIPAL CROPS (ha) (2010-11) i. Food grain Wheat : 115280
Barley : 686 Rice : 13974 Pulses : 15038 Jowar : 6721 Maize : 14095 Condiments & Spices : 6560
ii. Fruits and vegetables 2678 iv. Oil seeds 224274
6. IRRIGATION BY DIFFERENT SOURCES (sq. km) (2010-11) i. Tube wells 773.78 ii. Tanks 1.90 iii. Canals 1185.35 iv. Other wells 279.57 v. Other sources 19.59 vi. Net Irrigated area 2260.19 vii. Gross Irrigated area 2433.13
ii
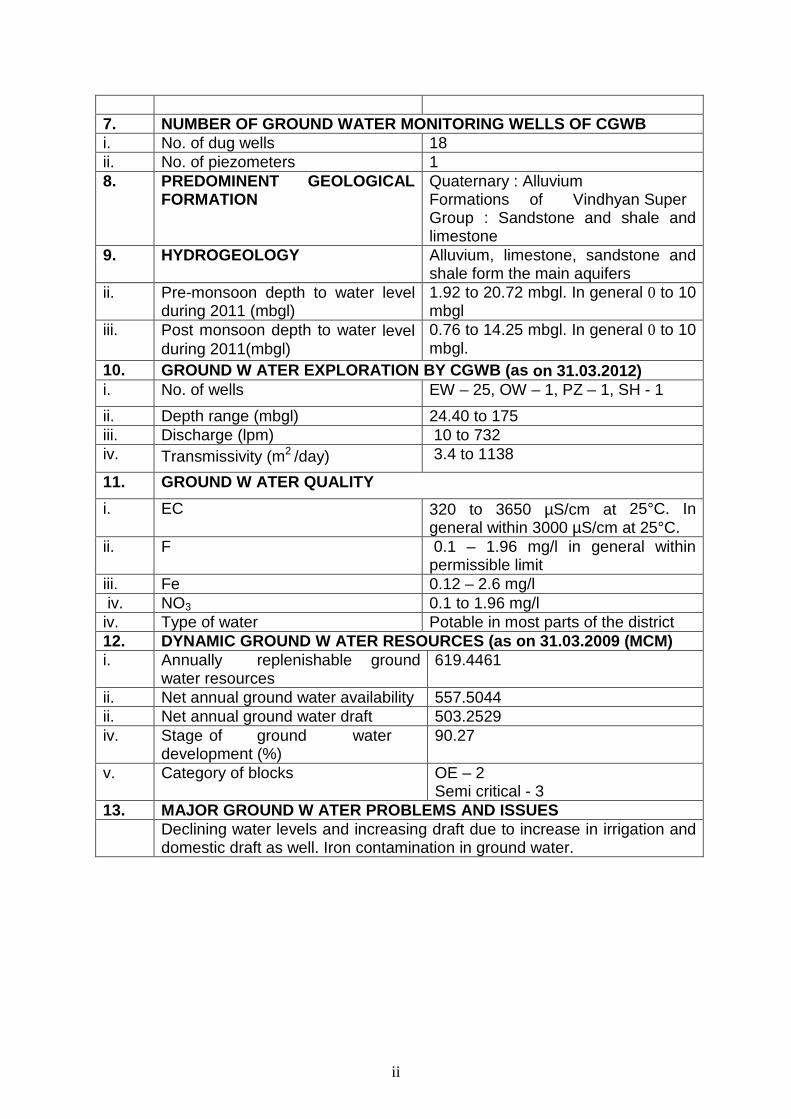
7. NUMBER OF GROUND WATER MONITORING WELLS OF CGWB i. No. of dug wells 18 ii. No. of piezometers 1 8. PREDOMINENT GEOLOGICAL
FORMATION Quaternary : Alluvium Formations of Vindhyan Super Group : Sandstone and shale and limestone
9. HYDROGEOLOGY Alluvium, limestone, sandstone and shale form the main aquifers
ii. Pre-monsoon depth to water level during 2011 (mbgl)
1.92 to 20.72 mbgl. In general 0 to 10 mbgl
iii. Post monsoon depth to water level during 2011(mbgl)
0.76 to 14.25 mbgl. In general 0 to 10 mbgl.
10. GROUND W ATER EXPLORATION BY CGWB (as on 31.03.2012) i. No. of wells EW – 25, OW – 1, PZ – 1, SH - 1
ii. Depth range (mbgl) 24.40 to 175 iii. Discharge (lpm) 10 to 732 iv. Transmissivity (m2 /day) 3.4 to 1138
11. GROUND W ATER QUALITY
i. EC 320 to 3650 µS/cm at 25°C. In general within 3000 µS/cm at 25°C.
ii. F 0.1 – 1.96 mg/l in general within permissible limit
iii. Fe 0.12 – 2.6 mg/l iv. NO3 0.1 to 1.96 mg/l iv. Type of water Potable in most parts of the district 12. DYNAMIC GROUND W ATER RESOURCES (as on 31.03.2009 (MCM) i. Annually replenishable ground
water resources 619.4461
ii. Net annual ground water availability 557.5044 ii. Net annual ground water draft 503.2529 iv. Stage of ground water
development (%) 90.27
v. Category of blocks OE – 2 Semi critical - 3
13. MAJOR GROUND W ATER PROBLEMS AND ISSUES Declining water levels and increasing draft due to increase in irrigation and
domestic draft as well. Iron contamination in ground water.
i
DISTRICT GROUND W ATER BROCHURE
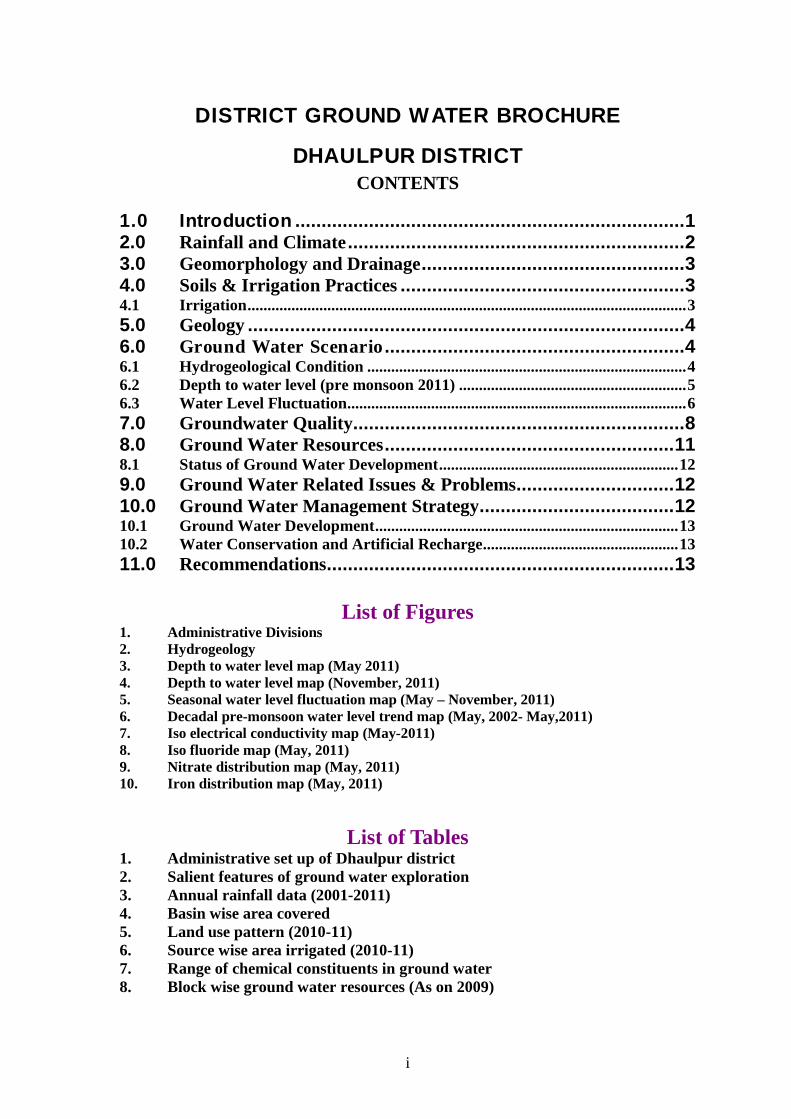
DHAULPUR DISTRICT CONTENTS
1.0 Introduction ..........................................................................1 2.0 Rainfall and Climate................................................................2 3.0 Geomorphology and Drainage..................................................3 4.0 Soils & Irrigation Practices ......................................................3 4.1 Irrigation..............................................................................................................3 5.0 Geology...................................................................................4 6.0 Ground Water Scenario.........................................................4 6.1 Hydrogeological Condition ................................................................................4 6.2 Depth to water level (pre monsoon 2011) .........................................................5 6.3 Water Level Fluctuation.....................................................................................6 7.0 Groundwater Quality ...............................................................8 8.0 Ground Water Resources.......................................................11 8.1 Status of Ground Water Development............................................................12 9.0 Ground Water Related Issues & Problems..............................12 10.0 Ground Water Management Strategy.....................................12 10.1 Ground Water Development............................................................................13 10.2 Water Conservation and Artificial Recharge.................................................13 11.0 Recommendations..................................................................13
List of Figures
1. Administrative Divisions 2. Hydrogeology 3. Depth to water level map (May 2011) 4. Depth to water level map (November, 2011) 5. Seasonal water level fluctuation map (May – November, 2011) 6. Decadal pre-monsoon water level trend map (May, 2002- May,2011) 7. Iso electrical conductivity map (May-2011) 8. Iso fluoride map (May, 2011) 9. Nitrate distribution map (May, 2011) 10. Iron distribution map (May, 2011)
List of Tables 1. Administrative set up of Dhaulpur district 2. Salient features of ground water exploration 3. Annual rainfall data (2001-2011) 4. Basin wise area covered 5. Land use pattern (2010-11) 6. Source wise area irrigated (2010-11) 7. Range of chemical constituents in ground water 8. Block wise ground water resources (As on 2009)
1
DISTRICT GROUND W ATER BROCHURE KOTA DISTRICT
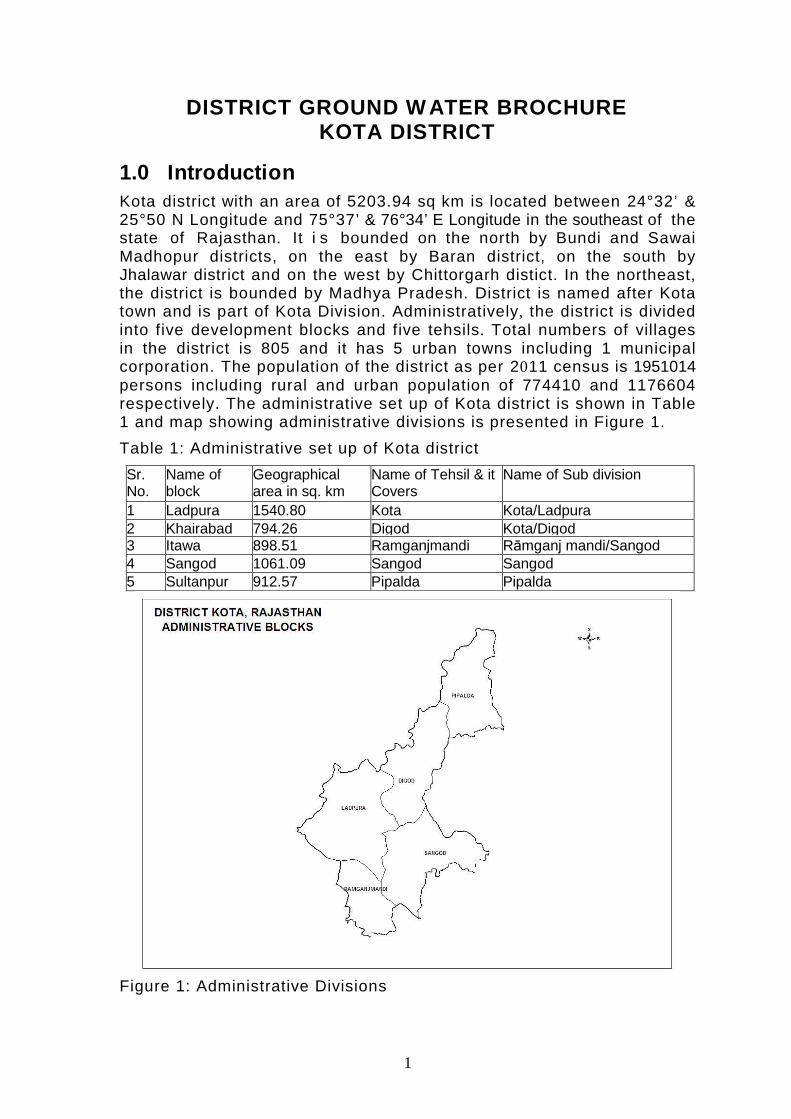
1.0 Introduction Kota district with an area of 5203.94 sq km is located between 24°32’ & 25°50 N Longitude and 75°37’ & 76°34’ E Longitude in the southeast of the state of Rajasthan. It i s bounded on the north by Bundi and Sawai Madhopur districts, on the east by Baran district, on the south by Jhalawar district and on the west by Chittorgarh distict. In the northeast, the district is bounded by Madhya Pradesh. District is named after Kota town and is part of Kota Division. Administratively, the district is divided into five development blocks and five tehsils. Total numbers of villages in the district is 805 and it has 5 urban towns including 1 municipal corporation. The population of the district as per 2011 census is 1951014 persons including rural and urban population of 774410 and 1176604 respectively. The administrative set up of Kota district is shown in Table 1 and map showing administrative divisions is presented in Figure 1.
Table 1: Administrative set up of Kota district
Sr. No.
Name of block
Geographical area in sq. km
Name of Tehsil & it Covers
Name of Sub division
1 Ladpura 1540.80 Kota Kota/Ladpura 2 Khairabad 794.26 Digod Kota/Digod 3 Itawa 898.51 Ramganjmandi Rāmganj mandi/Sangod 4 Sangod 1061.09 Sangod Sangod 5 Sultanpur 912.57 Pipalda Pipalda
Figure 1: Administrative Divisions
2
The ground water investigation in the district was carried out by GSI in 1969-70. Systematic hydrogeological surveys in parts of the district were carried out by Central Ground Water Board during the period 1975-78 (Misra 1975-76, Lal 1976-77 and Vaid 1977-78). Detailed hydrogeological studies including exploratory drilling, testing, hydrological/ hydrometeorological studies and borehole geophysical logging etc. were carried out in Kali Sindh river basin during 1979-82 and in the other parts of the district during 1983 - 85. A total of 25 exploratory wells and 1 each observation well, slim hole and piezometer have been drilled in the district. Salient features of ground water exploration in the district are given in Table 2.
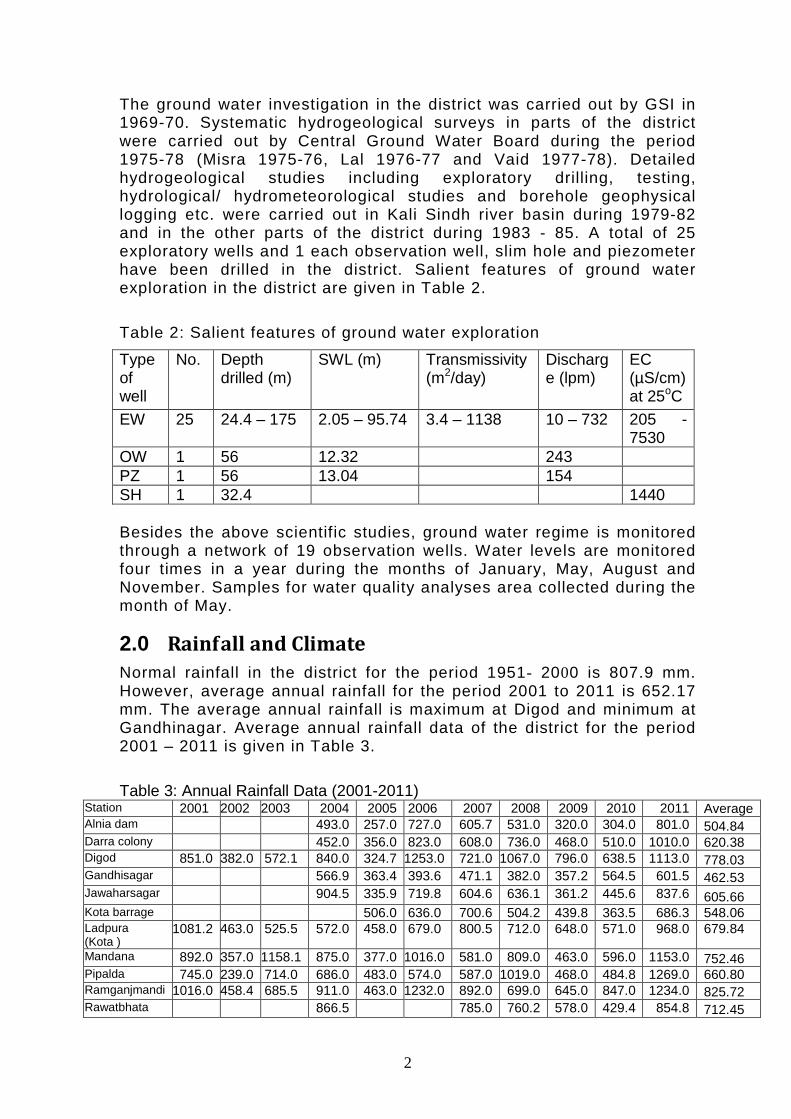
Table 2: Salient features of ground water exploration
Type of well
No. Depth drilled (m)
SWL (m) Transmissivity (m2/day)
Discharge (lpm)
EC (µS/cm) at 25oC
EW 25 24.4 – 175 2.05 – 95.74 3.4 – 1138 10 – 732 205 - 7530
OW 1 56 12.32 243 PZ 1 56 13.04 154 SH 1 32.4 1440 Besides the above scientific studies, ground water regime is monitored through a network of 19 observation wells. Water levels are monitored four times in a year during the months of January, May, August and November. Samples for water quality analyses area collected during the month of May.
2.0 Rainfall and Climate Normal rainfall in the district for the period 1951- 2000 is 807.9 mm. However, average annual rainfall for the period 2001 to 2011 is 652.17 mm. The average annual rainfall is maximum at Digod and minimum at Gandhinagar. Average annual rainfall data of the district for the period 2001 – 2011 is given in Table 3.
Table 3: Annual Rainfall Data (2001-2011)
Station 2001 2002 2003 2004 2005 2006 2007 2008 2009 2010 2011 Average Alnia dam 493.0 257.0 727.0 605.7 531.0 320.0 304.0 801.0 504.84 Darra colony 452.0 356.0 823.0 608.0 736.0 468.0 510.0 1010.0 620.38 Digod 851.0 382.0 572.1 840.0 324.7 1253.0 721.0 1067.0 796.0 638.5 1113.0 778.03 Gandhisagar 566.9 363.4 393.6 471.1 382.0 357.2 564.5 601.5 462.53 Jawaharsagar 904.5 335.9 719.8 604.6 636.1 361.2 445.6 837.6 605.66 Kota barrage 506.0 636.0 700.6 504.2 439.8 363.5 686.3 548.06 Ladpura (Kota )
1081.2 463.0 525.5 572.0 458.0 679.0 800.5 712.0 648.0 571.0 968.0 679.84
Mandana 892.0 357.0 1158.1 875.0 377.0 1016.0 581.0 809.0 463.0 596.0 1153.0 752.46 Pipalda 745.0 239.0 714.0 686.0 483.0 574.0 587.0 1019.0 468.0 484.8 1269.0 660.80 Ramganjmandi 1016.0 458.4 685.5 911.0 463.0 1232.0 892.0 699.0 645.0 847.0 1234.0 825.72 Rawatbhata 866.5 785.0 760.2 578.0 429.4 854.8 712.45

3
Station 2001 2002 2003 2004 2005 2006 2007 2008 2009 2010 2011 Average Sangod 1232.0 438.2 557.0 841.0 477.0 989.0 650.0 567.0 473.0 415.1 1634.0 752.12 Sawanbhado 500.0 726.0 577.0 584.0 292.0 481.0 867.0 575.29
Climate of the district can be classified as semi arid type. The summers are hot and dry and winters are cold. The cold season prevails from December to February followed by hot season from March to mid of June. After summers the rainy season starts with the onset of monsoon rains lasting till the end of September. The period September to November constitutes post monsoon period. January is the coldest month with mean daily maximum temperature at 24.3°C and a mean daily minimum temperature at 10.6°C. Mean daily maximum temperature during summers is 46.2°C and mean daily minimum temperature is 29.7°C.
3.0 Geomorphology and Drainage Physiographically, the district is characterized by undulating topography with gentle plains. The land slopes from south to north and is drained by the river Chambal and its tributaries. In the south there is 145 km long Mumundra range of Vindhyan hills. The physiography is rugged and the tributaries of Chambal river drain through undulating plains which slope from SSE to NNW. The maximum height of the hills in the district is 517 m amsl at village Borabas, block Ladpura and minimum height is 207mamsl at Khatoli in block Itawa. Chambal is the principal perennial river in the district. Its tributaries are Kalisindh, Parvan and Parvati, which are all perennial in nature.
4.0 Soils & Irrigation Practices The soils of the district are alluvial in nature. Soils are generally deep to very deep with texture varying from clayey loam to clay and are generally non-calcareous. Colour of the soil varies from brown to dark brown. This type of soil generally occurs in plains.
4.1 Irrigation The principal means of irrigation in the district are canals and wells/ tube wells. Ground water is abstracted through tubewells, dug wells and dug cum bore wells. Net irrigated area in the district is 226019 ha which is about 93% of the gross irrigated area (243313 ha). The details of the area irrigated by different sources are given in Table 4.
Table 4: Source wise area irrigated (2010-11)
Source Net irrigated area (ha) Gross irrigated area (ha) Canal 118535 129855 Tank 190 202 Tubewells 77378 82854 Other wells 27957 28441 Other sources 1959 1961 Total 226019 243313
4
Agriculture activity is spread over both Kharif and Rabi cultivation. Kharif cultivation is rain fed and Rabi cultivation is mostly based on ground water. During the Kharif cultivation only 10.10 sq.km area is under irrigation, whereas during Rabi cultivation 1012.41 sq.km areas is under cultivation (including area under double crops). The main Kharif crops grown in the area are rice(13974 ha), oil seeds (224274ha), Jowar (6721ha), whereas principal Rabi crop is wheat (115280ha). The total cropped area in the district is 458857ha (including area sown more than once).
5.0 Geology The rock formations exposed in Kota district are sedimentary in nature and belong to Vindhyan Super Group. These are overlain in most part of the district by the Quaternary alluvium. The stratigraphic succession in the district is as follows:
Quaternary Recent to
sub recent Alluvium Clay, silt, sand, kankar,
gravel and rock fragments
Upper Proterozoic
Vindhyan Super Group
Bhander Group Upper Bhander sandstone. Sirbhu shale with bands of siltstone and limestone
6.0 Ground Water Scenario In Kota district, ground water occurs in mainly four hydrogeological formations. These hydrogeological formations are alluvium, sandstone, shale and limestone and among these formations alluvium is the most important formation as it covers the maximum area and also it is the most potential among different hydrogeological formations.
6.1 Hydrogeological Condition Occurrence of ground water depends upon topography, physiography and structural features of the geological formations. The movement of the ground water in hard rock areas is governed by size, openness, interconnection and continuity of structurally weak planes while in unconsolidated rocks, ground water movement takes place through pore spaces between grains. In the district, ground water occurs under water table condition both in unconsolidated and consolidated formations.
The main hydrogeological units are alluvium, limestones, sandstones and shales. Shale also occurs as intercalations with both limestone and sandstone. Limestone, sandstone and shale cover an area of 5123.17 sq.km out of which 2111.77 sq.km area falls under command area. Most of the command area is irrigated by Chambal Canal and comparatively small area by canals of Alniya, Sawan Bhadon and Harish Chandra Sagar Dams.

5
6.2 Depth to water level (pre monsoon 2011) The depth to water level varies widely depending upon topography, drainage, bedrock geology etc. The depth to water level during pre-monsoon (May, 2011) varied form 1.92 m to 20.72 mbgl In major part of the district water levels were between 2 and 10 mbgl (Figure 2). Depth to water level in the range of 10 to 20 mbgl were observed in southern half of Khairabad block, major parts of Sangod and Itawa blocks and some parts of Sultanpur block. Deeper water levels (20 -40 mbgl) have been observed in localised pocket along the eastern border of Itawa block.
Figure 2: Depth to Water Level Map (May, 2011)
6
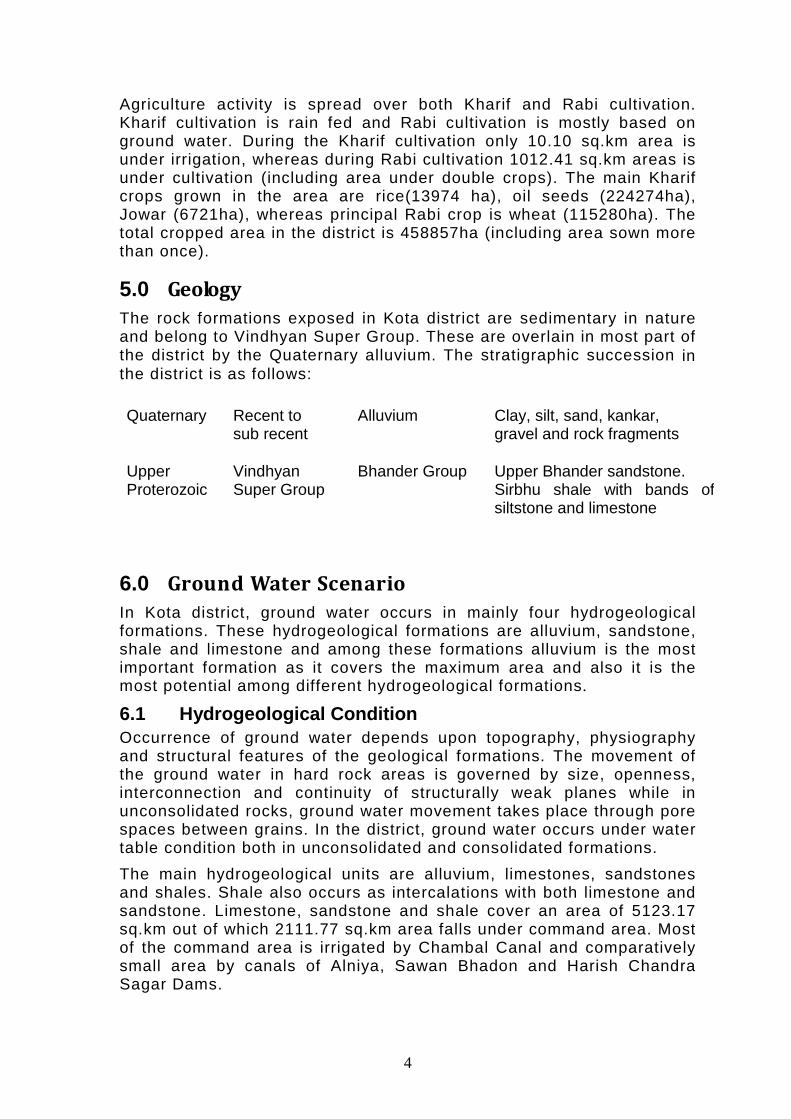
Figure 3: Depth to Water Level Map (November, 2011)
During post-monsoon period (November, 201), the depth to water level varied from 0.76 m to 14.25 m (post- monsoon). In major part of the district water levels were shallow ranging between 0 and 10 mbgl (Figure 3). Water levels in the range of 0 to 2 mbgl have been observed in parts of Ladpura, Khairanad and Sultanpur blocks. Depth to water levels between 10 and 20 mbgl have been reported from parts of Sangod, Sultanpur and Itawa blocks.
6.3 Water Level Fluctuation Seasonal fluctuation in water level based on Pre and Post-monsoon’ 2011 indicates that there has been exceptionally rise in water level in entire district (Figure 4). Perusal of the fluctuation data indicates that extent of rise in water levels varies from 0.2 to 14.4 m. Majority of wells (75%) in the district have registered rise in water level in the range of 0 to 4 m (75%) and the remaining wells (25%) have registered rise of more than 4 m.

7
Figure 4: Seasonal water level fluctuation map (May – November, 2011)
Analysis of decadal pre-monsoon water level data indicates that there has been rising trend of upto 25cm/year in water levels in major parts of Ladpura, Khairabad, Sangod and Sultanpurt blocks and some parts of Itawa block (Figure 5). Declining trend of upto 25cm/year has been registered in water levels in major part of Itawa block and some parts of Ladpura and Sangod blocks.

8
Figure 5: Decadal Pre-monsoon water level trend map (May, 2002 – May, 2011)
7.0 Groundwater Quality
The range of chemical constituents of ground water in Kota district during pre-monsoon’ 2011 is given in Table 5.
Table 5: Range of chemical constituents in ground water
S.No. Chemical constituent Range 1 pH 7.35 - 8.5 2 Chloride 25 - 740 ppm 3 Electrical conductivity at 25°C 320 - 3650 µS/cm at 25°C 4 Total hardness as CaCo3 90 - 710 mg/l 5 Calcium 16 - 192 mg/l 6 Magnesium 12 - 95 mg/l 7 Iron 0.12 - 2.6 mg/l 8 NO3 9 - 125 mg/l 9 F 0.10 - 1.96 mg/l
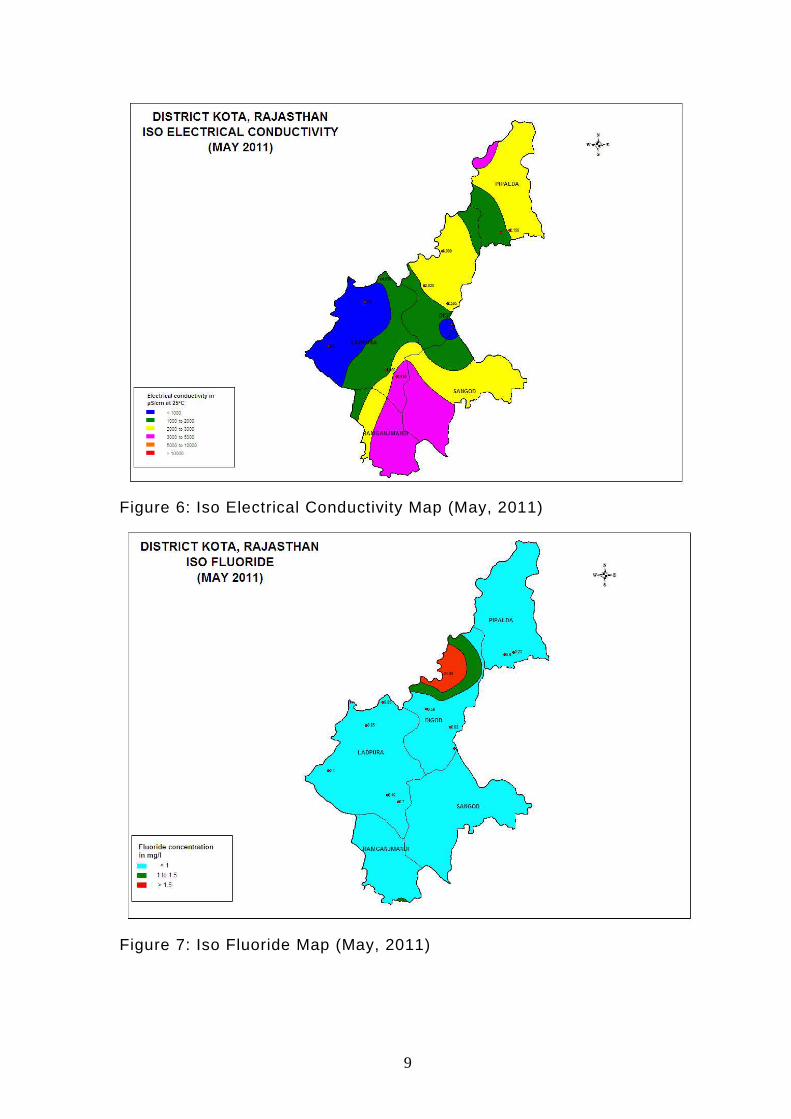
Shallow ground water of dug well zone is alkaline in nature with pH ranging from 7.4 to 8.5. Electrical Conductivity (EC) varies from 320 to 3650 µS/cm at 25°C. EC is within 3000 µS/cm at 25°C in majority of wells. EC above 3000 µS/cm at 25°C has been observed in the southern part of the district along the adjoining borders of Sangod, Khairabad and Ladpura blocks (Figure 6). The Chloride content varies from 25 to 740 mg/l.
9
Figure 6: Iso Electrical Conductivity Map (May, 2011)
Figure 7: Iso Fluoride Map (May, 2011)

10
The fluoride content in ground water in the district is generally within 1.5 mg/l, the maximum permissible limit in drinking water as prescribed by the BIS. Excess fluoride has been reported from northwestern part of Sultanpur block. Iso fluoride map of Kota district is presented in Figure 7.
The concentration of Nitrate ranges from 9.0 mg/l to 125 mg/l. Nitrate values in major part of the district are within 45 mg/l, the maximum permissible limit in drinking water as prescribed by BIS (Figure 8). Higher concentration of nitrate in ground water has been reported from parts of Sultanpur and Itawa blocks.
Figure 8: Nitrate Distribution Map (May, 2011) The concentration of iron in ground water has been found to vary from 0.12 to 2.6 mg/l. High iron concentration (exceeding maximum permissible limit of 1 mg/l) in substantial part of the district covering entire Itawa block, major part of Ladpura block, northern part of Khairabad block and eastern part of Sultanpur block is a matter of concern. In the remaining parts of the district, iron content is well within the permissible limit (Figure 9).

11
*
Figure 9: Iso Iron Map (May, 2011)
8.0 Ground Water Resources
Central Ground Water Board and Rajasthan Ground Water Department (RGWD) have jointly estimated the ground water resources of Kota district (as on 2009) based on GEC-97 methodology. Ground Water Resource estimation was carried out for 5123.17 sq km area, out of which 1410.25 sq km (27.5) is comprised of alluvium and remaining area is comprised of sedimentary formations with sandstone occupying the largest area of 2380.89 sq km (46.5%) followed by limestone covering 1180.53 sq km (23%) and shale covering 151.50 sq km (3%). The potential zone of command area in the district is around 2111.77 sq km and the rest of the area falls under non-command area.
The total annually replenishable resource of the district has been assessed to be 619.4461 MCM and net annual ground water availability has been estimated to be 557.5014 MCM. Gross annual ground water draft for all uses has been estimated to be 503.2529 MCM. The overall stage of ground water development in the district is 90.27%. Out of five blocks, two blocks fall under Overexploited category and the remaining blocks fall under Semicritical category. The block wise details of replenishable ground water resource assessment in the district are given in Table 6.

12
Table 6: Block wise replenishable ground water resources (As on 2009)
Block Annually replenishable Ground Water Resource (MCM)
Net Annual Ground Water Availability (MCM)
Annual gross ground water draft for irrigation (MCM)
Annual gross ground water draft for domestic and industry (MCM)
Annual Gross Ground Water Draft (MCM)
Stage of Ground Water Develop-ment (%)
Category
Itawa 131.7617 118.5856 84.7811 5.7616 90.5427 76.35 Semicritical Khairabad 56.1431 50.5288 55.1957 8.8568 64.0525 126.76 OE Ladpura 146.7295 132.0565 93.8767 12.2623 106.1390 80.37 Semicritical Sangod 97.1389 87.4249 96.7827 6.1648 102.9475 117.76 OE Sultanpur 187.6729 168.9056 131.3203 8.2509 139.5712 82.63 Semicritical Total 619.4461 557.5014 461.9565 41.2964 503.2529 90.27 Critical
8.1 Status of Ground Water Development Rainfall in the district is the main source of ground water recharge. Due to less rainfall and increased ground water withdrawals, ground water levels are declining in some parts of the district particularly in the northern part. Increasing urbanization and change in lifestyle have led to increased demand of water. Increasing urbanization also leads to reduced recharge. Further ground water is also an important source for irrigation in the district. The stage of ground water development for the district as a whole has reached 90% as on 31.03.2009. Out of five blocks in the district, two blocks viz. Khairabad and Sangod are over-exploited and the remaining three blocks viz. Itawa, Ladpura and Sultanpur fall under Semicritical category. There is practically no scope left for further ground water development in over-exploited blocks in the district.
9.0 Ground Water Related Issues & Problems
Two blocks in the district are over-exploited, where stage of ground water development has exceeded 100 % leaving no further scope for ground water development. These blocks require judicious development of ground water. Quality of ground water is generally potable, except for a few pockets, where high Electrical Conductivity, Nitrate and Iron have been reported.
10.0 Ground Water Management Strategy
Due to pressure of population and improvement in the standard of living, the demand of fresh water for both agriculture and domestic use has substantially increased. This has led to a sharp increase in ground water withdrawal. The top layer of fresh ground water is also reducing every year. Artificial recharge serves as a means for restoring the depleted ground water storage, slow down the quality deterioration and put back into operation many ground water abstraction structures.

13
10.1 Ground Water Development Stage of ground water development in two out of five blocks in the district has exceeded 100%, which indicates that the scope of ground water development is already exhausted in these blocks and the blocks have been categorized as “Over-exploited”. There is no scope for further development of ground water in these blocks for irrigation or industrial use. However, exploratory drilling can be taken up in unexplored area for estimation of aquifer parameters. There is need to control and regulate ground water development in over-exploited blocks in the district. In the semi-critical blocks, caution needs to be exercised so as not to further deplete the resource.
10.2 Water Conservation and Artificial Recharge Precious ground water resources have to be conserved for sustainable availability. There is need to reduce/ avoid wastage of water in various uses. Ground water should be used judiciously taking into account modern agriculture water management techniques by cultivating crops needing less watering and use of sprinkler system & drip irrigation should be encouraged.
Sandstone is the most important aquifer in the district. Extraction of ground water in this aquifer is through large diameter dug wells and dug cum bore wells and tube wells. The draft is mainly for agriculture in most of the area. The stage of ground water development in this aquifer varies from 70.61 to 141.88 %. Over-exploitation of ground water resources has led to declining trend in ground water levels. Moreover, ground water storage capacity in this hard rock aquifer is very less hence during summer season, dug wells either go dry or yield is reduced. Therefore, it is recommended that deepening of dug wells should be carried out to have good storage during pumping so that these don’t go dry during lean period. Alluvial aquifer is the next important aquifer in the district, which supports ground water extraction through dug wells, dug cum bore wells and tube wells. Stage of ground water development in this aquifer varies from 82.15 to 84.67. There is need to regulate ground water abstraction so as not to further deteriorate the ground water situation.
It is recommended that increasing number of ground water structures should not be encouraged and artificial ground water recharge schemes like check dams, bunds, anicuts etc., should be constructed at appropriate hydrogeological locations. Surface water reservoirs like ponds/ tanks etc. should be constructed, which would serve dual purpose of supply of water during lean period and recharge to the ground water body. Also watershed development and soil conservation projects should be encouraged.
11.0 Recommendations • Large diameter (5-8 m) dug wells should be constructed in hard rock
area with sufficient depth 30-40 mbgl so as to have good storage during pumping and also during the lean period. Horizontal drilling

14
can be done to tap the lateral fractures for enhancing the yield of the wells in hard rock areas.
• Areas showing potential aquifer should be developed with careful monitoring of water levels by increasing the monitoring stations in blocks which have been categorized as semicritical.
• Ground water should be used judiciously taking into account modern agriculture water management techniques by cultivating crops that need less watering.
• Use of sprinkler system & drip irrigation should be encouraged. • Small farmers in the area should be encouraged to use common ground
water structures for optimum use of ground water resources for irrigation purposes.
• Cultivators should also be made aware and encouraged to adopt suitable cropping pattern using modern techniques by extension services for getting maximum agriculture production through minimum withdrawal.
• Suitable artificial recharge structures like subsurface barriers across the river beds should be constructed so that the ground water runoff can be arrested and impounded in the subsurface reservoir for meeting various sectoral demands.
• There is need for regulation of ground water development in overexploited areas.
• Awareness about the consequences in the near future caused by the impact of sharply declining water levels and need and ways of judicious use of water and rain water harvesting and artificial recharge needs to be created among the users.
• Lift irrigation projects and on-going construction of dams, anicuts should be speeded up particularly Chambal lift irrigation scheme and surface water reservoir projects, which will irrigate the large area reducing the ground water draft and increasing the ground water recharge.
• The quality of ground water in most parts of the district is good for irrigation and domestic/ drinking purpose except at a few places where nitrate and iron problems need to be tackled by the concerned state agencies by tapping alternate sources of water supply.