Embed Size (px)
Citation preview

Ground Water in the Eola-Amity Hills Area Northern Willamette Valley, Oregon
GEOLOGICAL SURVEY WATER-SUPPLY PAPER 1847
Prepared in cooperation with the Oregon State Engineer

Ground Water in the Eola-Amity Hills Area Northern Willamette Valley, OregonBy DON PRICE
GEOLOGICAL SURVEY WATER-SUPPLY PAPER 1847
Prepared in cooperation with the Oregon State Engineer
Report describes geologic features and their relation to the occurrence, quality, and availability of ground water on the west side of the fVillamette Valley between Salem and McMinnville, Oreg.
UNITED STATES GOVERNMENT PRINTING OFFICE, WASHINGTON : 1967

UNITED STATES DEPARTMENT OF THE INTERIOR
STEWART L. UDALL, Secretary
GEOLOGICAL SURVEY
William T. Pecora, Director
Library of Congress catalog-card No. GS 67-274
For sale by the Superintendent of Documents, U.S. Government Printing Office Washington, D.C. 20402

CONTENTS
PageAbstract________________________________________________________ 1Introduction._____________________________________________________ 2
Purpose and scope of the investigation.__________________________ 2Location and extent of the area.________________________________ 3Previous investigations.________________________________________ 3Acknowledgments___________________________________________ 5Well- and spring-numbering system._____________________________ 5
Geography__ ____________________________________________________ 7Climate_ _____________________________________________________ 7Physiographic features.__-_________--___-__---__-_--____-_-___- 9
Eola-Amity Hills____-___________________________________ 10East valley plain._________________________________________ 10West valley plain._________________________________________ 11Willamette River flood plain___--____-_-_-___-------------_- 11
Drainage _____________________________________________________ 11Stream discharge._________________________________________ 12
Culture and industry.__________________________________________ 14Geologic setting.__________________________________________________ 15
Rock units and their water-bearing properties._____--______-____-_ 16Marine sedimentary rocks_____________-_____----__-_-_-__-_ 16Intrusive rocks______-_----_----_--_----_--_------__------- 17Columbia River Group.____________________________________ 17Troutdale Formation_____________________________________ 19WUlamette Silt___ __--- -- ----- ~ 21Landslide debris____-_-------------_-------------_--------- 24Alluvium. _ ___-_____-_______-______-_-_-____-______--.-_-- 24
Ground water.___-_____--___-______-----___-_______-_---___---_--- 25General features of occurrence________________________________ 25Springs and seeps_______________-______--_-___-_-_-_-_---___- 29Water-level fluctuations.______________-__________---_-_------__ 29Chemical quality of the ground water.___________________________ 33
Iron.__-_____-____-__________-_-__-___-_-_-_-_--_-------- 34Chloride_______-___----____-------_--------------_-------- 35Fluoride____--___-_------__-----------------------------_- 36Hardness of water_______________________________________ 36Suitability of the ground water for irrigation___________-----__ 37
Temperature of the ground water._________________-____-----___ 40Utilization of ground water.______-_-____-_-_________-___---_-_- 40
Irrigation supplies.________________________________________ 40Domestic supplies.__________________________-_-____---_--- 41Public supplies._______-______-_____________------_-------- 41Industrial supplies.-_______________________________________ 42
in

IV CONTENTS
Ground-water conditions and availability by subareas. Eola-Amity Hills.____________________________East valley plain.____________________________West valley plain______________________________Willamette River flood plain._________________
Summary_ _ _ ___________________________________Basic ground-water data._________________________Selected references..._____________________________
Page4243444748495064
ILLUSTKATIONS
Page PLATE 1. Geohydrologic map of the Eola-Amity Hills area, northern
Willamette valley, Oreg-___----__-_-___-_----__--In pocketFIGURE 1. Map showing extent and general cultural and physiographic
features of report area_____________________________ 42. Diagram showing well- and spring-numbering system. _ _ __ 6
3-7. Graph showing 3. Annual precipitation and cumulative departure
from the 1900-63 average precipitation at Mc- Minnville. __________________________________ 8
4. Average monthly precipitation and temperature atMcMinnville_ ___-____--______-_-__---_______ 9
5. Annual runoff of the South Yamhill River nearWhiteson (water years 1941-64)-___-______-___ 13
6. Average monthly runoff of the South Yamhill Rivernear Whiteson (water years 1941-64)___________ 14
7. Particle-size distribution of four samples of Wil lamette Silt.-------------------------.------ 22
8. Sketch illustrating hydrologic system and various occur rences of ground water._____________________________ 26
9. Graphs showing water-level fluctuations in wells in the Eola-Amity Hills area and monthly precipitation at McMinnville during the period 1962-65______--____--_ 30
10. Hydrograph showing water-level fluctuations in well 5/5W-13B1 during the period 1928-65______-_______-_.__.-_ 32
11. Graphs showing chemical character of ground water. _____ 3412. Diagram for the classification of irrigation waters._______ 3913. Graph showing time-drawdown relation during test pumping
of well7/4W-24Gl--__-__-_-------_-------__----_-_ 45
TABLES
Page TABLE 1. Records of representative wells.._______--__--______-_._ 51
2. Drillers' logs of representative wells.__-__--__________-_- 583. Records of representative springs in the Eola-Amity Hills
and Red Hills of Dundee_____--____---_-_--___------ 624. Chemical analyses of ground waters___________________ 64

GROUND WATER IN THE EOLA-AMITY HILLS AREA NORTHERN WILLAMETTE VALLEY, OREGON
By DON PRICE
ABSTRACT
The Eola-Amity Hills area comprises about 230 square miles on the west side of the Willamette Valley between Salem and McMinnville, Oreg. The area is largely rural, and agriculture is the principal occupation.
Rocks ranging in age from Eocene to Recent underlie the area. The oldest rocks are a sequence more than 5,000 feet thick of marine-deposited shale and silt- stone strata, with thin interbeds of sandstone that range in age from Eocene to middle Oligocene. They are widely exposed in and west of the Eola-Amity Hills and underlie younger sedimentary and volcanic rocks throughout the study area. In the Eola-Amity Hills and Red Hills of Dundee, the Columbia River Group, a series of eastward-dipping basaltic lava flows locally of Miocene age, uncon- formably overlies the marine sedimentary rocks. The Columbia River Group ranges in thickness from less than 1 foot to about 900 feet and has an average thickness of about 200 feet. The formation is exposed in the Eola-Amity Hills and Red Hills of Dundee and, at places, extends to the east beneath younger rocks.
Overlying the Columbia River Group and marine sedimentary rocks are non- marine sedimentary deposits that range in thickness from less than 1 foot, where they lap up (to an altitude of about 200 ft) on the flanks of the higher hills, to several hundred feet along the east margin of the study area. These deposits in clude the Troutdale Formation of Pliocene age, the Willamette Silt of late Pleisto cene age, and alluvium of the Willamette River and its tributaries.
The Troutdale Formation and the alluvium of the Willamette River contain the most productive aquifers in the Eola-Amity Hills area. These aquifers, which consist mainly of sand and gravel, generally yield moderate to large quantities of water to properly constructed wells. Basalt of the Columbia River Group yields small to moderate quantities of water to wells, and the marine sedimen tary rocks and Willamette Silt generally yield small but adeqtiate quantities of water for domestic and stock supplies.
Ground water from the Columbia River Group and nonmarine sedimentary rocks is chemically suitable for irrigation and other uses, as is the water from shallow depths in the marine sedimentary rocks. However, water from depths of more than several hundred feet in the marine sedimentary rocks contains large amounts of chloride and other dissolved mineral constitutents that make it un suitable for most uses. Samples from three fairly closely spaced wells obtaining water from depth zones of 50 to 77, 191 to 201, and about 2,000 feet contained 172, 1,160, and 26,000 ppm (parts per million) of chloride, respectively.

2 GROUND WATER, EOLA-AMITY HILLS AREA, OREGON
About 6,100 acre-feet of ground water was pumped from wells and withdrawn from springs for various uses during 1964; of this amount about 4,800 acre-feet was used for irrigation. The total volume of ground water withdrawn and put to beneficial use each year is small compared with the amount that discharges naturally by evapotranspiration and through undeveloped seeps and springs. Much of the natural discharge could be intercepted and put to beneficial use by pumping from wells.
Major problems affecting the development of ground water in the area include (a) uneven areal distribution of permeable rocks, (b) undesirable chemical quality of the ground water locally in the marine sedimentary rocks, and (c) fine sand entering wells that tap the Troutdale Formation and thereby causing loss of well efficiency and costly wear on pumps and water-supply systems.
INTRODUCTION
PURPOSE AND SCOPE OF THE INVESTIGATION
The Eola-Amity Hills area is one of highly diversified geologic and hydrologic conditions which make the occurrence, quality, and availability of ground water vary considerably from place to place. The area is also one where withdrawals of ground water for irrigation, domestic, and public supplies have increased progressively in recent years. Approximately 400 wells have been drilled in the area since 1955, including about 50 large-yield irrigation wells, about 10 public- supply wells, and more than 340 domestic wells.
The largest increases in ground-water withdrawals have been for irrigation. This trend is expected to continue because there is a grow ing need for water in this area for the types of crops (such as truck crops and pasture) that require considerably more water than is gen erally available from precipitation during the dry summer months. In 1964 about 5,000 acres of land in the area was irrigated with ground water. This is only a small part of the arable land that could be irri gated by the available ground water in the area.
Ground-water withdrawals for public and domestic supplies are also expected to continue to increase to keep pace with the growing rural and suburban population of the study area. Also, the growing population is likely to attract industries that require considerable \vater. The more populated areas (West Salem and McMinnville) obtain water from streams outside the study area; however, the smaller towns and cities in the area rely entirely on ground water developed from wells and springs. Most of these smaller towns and cities, as well as water districts utilizing ground water to serve suburban areas, an ticipate enlarging their water systems to meet the needs of a growing population.
The purpose of this investigation, therefore, is to present sufficient geologic and hydrologic data so that ground-water conditions in any

INTRODUCTION 3
given part of the area can be predicted with reasonable accuracy and be used as a guide to future development of ground-water sup plies. To this end, records of several hundred wells were examined to determine the types and thicknesses of rocks penetrated and the ade quacy and dependability of the ground-water supply. Water samples were collected from 13 representative wells and 1 spring and were analyzed by the U.S. Geological Survey to determine the chemical character of the water. Periodic water-level measurements were made in 15 selected wells to determine seasonal and long-term water-level fluctuations and any effects that present ground-water development has had on the water levels. The hydrographs of the eight most repre sentative of these wells are included in this report. A geologic map and geologic sections were compiled to show the extent and thickness of the principal geologic units. Contours depicting the top of the water table beneath the main valley plain were drawn to show the depth to the main zone of saturation and the general directions of ground-water movement.
Most of the fieldwork for this investigation was done during June and December of 1963, but periodic trips were made into the area throughout 1963 and early in 1964 to collect water-level measure ments and pumpage records and to check the geologic map for accuracy.
This investigation is part of a continuing cooperative program of the Oregon State Engineer and the U.S. Geological Survey to evaluate the ground-water resources of Oregon. The work was under the direct supervision of E. R. Hampton, acting district geologist in charge of ground-water investigations in Oregon.
LOCATION AND EXTENT OF THE AREA
The Eola-Amity Hills area lies between lat 44°53' and 45° 15' N., and long 123°00/ and 123° 15' W., in northwestern Oregon. It includes that part of the northern Willamette Valley west of the Willamette River between Salem and McMinnville, Oreg., and covers approxi mately 230 square miles. The boundaries and general cultural and physiographic features of the Eola-Amity Hills are shown in figure 1.
PREVIOUS INVESTIGATIONS
The general geology and the occurrence and availability of ground water in the Eola-Amity Hills area were described in a report of the ground-water resources of the Willamette Valley (Piper, 1942). Ground-water-level records have been collected in a number of wells in the study area by the Oregon State Engineer. Some of these records are published in that agency's ground-water report series (Sceva and DeBow, 1964,1965).

4 GROUND WATE.R, E.OLA-AMITY HILLS AREA, OREGON
oI____L
8 MILES I
EXPLANATION
Boundary of report area Boundary of subarea Stream-gaging station
FIGTJBE 1. Extent and general cultural and physiographie features ofthe report area.

INTRODUCTION 5
A brief description of ground-water conditions and availability in the Eola-Amity Hills area is given in a report that presents much of the ground-water data collected during this investigation (Price and Johnson, 1965).
The geology of parts of the study area has been described in several previous reports, which are included in the list of references on page 64. Recent geologic studies include a geologic map (with text) of the McMinnville and Sheridan 15-minute quadrangles (Baldwin and others, 1955). That map covers approximately the northern three- fourths of the study area.
ACKNOWLEDGMENTS
Many of the data for this investigation were supplied by well owners, operators, and drillers. The helpful cooperation of these people and the well owners who permitted access to their wells to collect ground- water data is gratefully acknowledged.
Special thanks are extended to Mr. Frank G. Mackaness, manager of rural services, and other officials of the Portland General Electric Co. who provided data needed to estimate the amount of ground water pumped for irrigation.
WELL- AND SPRING-NUMBERING SYSTEM
In this report wells and springs are designated by symbols that indi cate their location according to the official rectangular subdivision of public lands. For example, in the symbol for well 6/4W-1H1, the part preceding the hyphen indicates respectively the township and range (T. 6 S., R. 4 W.) south and west of the Willamette base line and meridian. Because most of the State lies south of the Willamette base line and east of the Willamette meridian, the letters indicating the directions south and east are omitted, but the letters "N" and "W" are included in the well numbers of wells north and west of the Wil lamette base line and meridian. The first digits following the hyphen indicate the section (sec. 1), and the letter indicates the 40-acre sub division of that section, as shown in figure 2. The final digit is the serial number for that particular well. Thus, well 6/4W-1H1 is in the SEi^NEi^ sec. 1, T. 6 S., R. 4 W., and was the first well in that tract to be listed.
Springs are numbered in the same manner as the wells except that the letter "s" is added following the final digit. For example, the first spring recorded in the NW^SE^ sec. 4, T. 4 S., R. 4 W., has the number 4/4W-4Kls.
2165-947 0 6,7-

GROUND WATER, ElOLA-AMITY HILLS AREA, OREGON
5 4 3 2R.1WR. IE. 2 3 4 5
o
Wl
\
LLAME"',<Q CCUJ:>
UJ
Ei1_i$
BAS E LINI
6/4W-1H1
6
7
18
19
30
31
5
8
17
20
29
32
4
9
16
21
28
33
3
10
15
22
27
34
2
11
14
23
26
35
1 c
12
13
24
25
36
R. 4W Sec.1
FIGURE 2. Well- and spring-numbering system.
In the table of well records (table 1), only those parts of the well numbers following the hyphen (1H1, for example) are shown; sub heads indicate the appropriate townships and ranges. In tables 3 and 4 (records of springs and chemical analyses of ground water, respec tively), the first well or spring listed under a given township and range is shown with its full number, and the part following the 'hyphen is given for all other wells or springs listed under that township and range.
On plate 1, the map showing locations of wells and springs, the parts of the numbers following the hyphen are shown near the appropriate symbols; this shows at a glance the section and part of the section in which the well or spring is located.

GROUND WATER, EOLA-AMITY HILLS AREA, OREGON 7
GEOGRAPHY
CLIMATE
The climate of the Eola-Amity Hills area is transitional between the relatively humid marine-type climate west of the Coast Range and a drier inland-type climate. It is characterized by cool, moist winters and warm, dry summers. The wettest months are generally November to March, and the driest months are July and August. Precipitation usually occurs as gentle rain throughout the year; however, some snow and some freezing rain fall during the midwinter, and occasional thundershowers occur during the summer.
Climatological data have been collected at McMinnville by the U.S. Weather Bureau since 1888. These records are believed to be fairly representative of the entire study area. The wettest year at McMinn ville during the period 1888 to 1964 was 1896, when 64.92 inches of precipitation was recorded (20.47 inches was recorded during Novem ber of that year). The driest year during that same period was 1929, when only 24.52 inches of precipitation was recorded. Average monthly precipitation ranged from less than half an inch in July and August to more than 6 inches in January, November, and December. Figure 3 shows the annual precipitation and cumulative departure from the 1900-63 average during the period 1900-64, and figure 4 shows the average monthly precipitation and temperature at McMinnville for approximately that same period.
The temperature of the Eola-Amity Hills area is fairly equable throughout the year. The average monthly temperature for July, the warmest month, is about 68° F. for the period of record, whereas the average monthly temperature for January, the coldest month, is about 39° F. (fig. 4). In July, the average daily maximum temperature is about 78° F., and the average daily minimum midsummer tempera ture is about 48° F. In January, the average daily maximum tempera ture is about 42° F., and the average daily minimum temperature is about 27° F. The warmest summer temperature recorded at McMinn ville was 110° F. (1924,1925, and 1926), and the coldest winter temp erature recorded was 24° F. (1919).
Evaporation data have not been collected in the Eola-Amity Hills area, but such data are collected at a Weather Bureau class A land pan at Corvallis (in the Willamette Valley about 30 miles southwest of Salem). Corvallis is an area climatologically similar to the study area; therefore, the evaporation data collected at Corvallis are probably representative of the study area.
At Corvallis the average evaporation is about 27 inches during the period April to September and only about 5 inches during the period October to March.

CUMULATIVE DEPARTURE FROM 1900-1963 AVERAGE ANNUAL PRECIPITATION, IN INCHES
'vanv sniH jtuwv-vroa 'aai,vAi. ajscaono 8

GEOGRAPHY 9
(57 years of record)
FIGUEE 4. Average monthly precipitation and temperature at McMinnville.
The growing season in the study area is generally from mid-April to September, but in some years late spring rains delay preparation of the soil for planting until late in May.
PHYSIOGRAPHIC FEATURES
The Eola-Amity Hills area is a segment of the Willamette Valley that lies between the Cascade and Coast Ranges in the Pacific Border physiographic province (Fenneman, 1931, p. 449).
The area extends westward from the Willamette Kiver to near the base of the Coast Kange and extends northward from the Salem Hills to the Ked Hills of Dundee. The main physiographic units in the area are (a) the Eola-Amity Hills, (b) the east valley plain, (c) the west valley plain, and (d) the flood plain of the Willamette Kiver (% 1).

10 GROUND WATE.R, EiOLA-AMTTY HILLS AREA, OREGON
BOLA-AMITY HTT.T.S
The Eola-Amity Hills are one of several isolated lava-capped upland areas in the northern Willamette Valley between Salem and Portland. They are separated from .the Salem Hills by a gap through which the Willamette Kiver flows and from the Coast. Range, Red Hills of Dundee, and other local upland areas by intervening segments of the main Willamette Valley plain (fig. 1).
The Eola-Amity Hills subarea consists of approximately 70 square miles, or nearly one-third of the study area. The Eola Hills, which alone occupy about 50 square miles, extend northward from Salem nearly 13 miles to near the town of Amity. They are divided into two nearly equal segments by a pass (alt about 430 ft) about 6 miles north of Salem and are separated from the Amity Hills by another pass (alt about 450 ft) between Amity and Hopewell (fig. 1).
The average altitude along the crest of the Eola-Amity Hills is about 850 feet, although some of the higher peaks extend more than a thousand feet above mean sea level. The highest point is identified by triangulation point Yam (about 4 miles southeast of Amity), which has an altitude of 1,163 feet.
A characteristic feature of the Eola-Amity Hills is their cuesta- like shape. The hills trend generally northward and have fairly steep western flanks and more gently sloping eastern flanks. This is caused by the attitude of the geologic units that underlie the Eola-Amity Hills. These rocks have been tilted generally toward the east. Con siderable land slippage is evident on the southern and western flanks of the hills.
EAST VAULEY PI/AIN
The east valley plain is that part of the main Willamette Valley plain east of McMinnville and the Eola-Amity Hills; it includes Dayton Prairie and Spring Valley (fig. 1) and consists of about 67 square miles. The east valley plain is a mostly flat surface that ranges in width from less than a mile at the north end of Spring Valley to about 9 miles in the south part of Dayton Prairie. It has an average altitude of about 160 feet and slopes gently to the north. The altitude in Spring Valley near Lincoln is about 170 feet; farther north near Uniondale it is about 160 feet; and in Dayton Prairie at the McMinn ville Airport it is about 155 feet.
The east valley plain is one of the most important parts of the study area with respect to agriculture and availability of ground water for irrigation. It is underlain to depths of more than 200 feet by fairly permeable sand and gravel aquifers, which are tapped by a number of moderate- to large-yield irrigation wells.

GEOGRAPHY 11
WEST VAULBY PI*AIN
The west valley plain includes that part of the main Willamette Valley plain west of McMinnville and the Eo]a-Amity Hills (fig. 1) and consists of about 70 square miles. It differs physiographically from the east valley plain in that it has an undulating surface owing to local outcrops of moderately resistant shale and siltstone strata that form small scattered knolls and hills. The west valley plain has an average altitude of about 180 feet and is divided into two parts by a western extension of the Eola Hills that is breached by Holmes Gap (fig. 1). North of Holmes Gap the plain slopes gently to the north, and south of Holmes Gap it slopes southeastward. A short distance beyond the southwest boundary of the study area, the west valley plain merges with the east slopes of the Coast Range.
WHUTiAMETTB RIVER FLOO1> PILAIN
The present flood plain of the Willamette River is about 30 to 80 feet lower in altitude than the main valley plain and is separated from the main valley plain by a steep erosional scarp of the Willamette River. The present flood plain has an average altitude of about 130 feet and slopes northward about 3 feet per mile. It ranges in width from less than 1 to about 4 miles and has many features characteristic of flood plains adjacent to low-gradient streams that have large varia tions of flow; these features include ox'bow lakes, meander scars, and numerous abandoned stream channels that are occupied by water only during freshets and floods.
Only discontinuous segments of the Willamette River flood plain lie within the study area, which is west of the Willamette River. The largest of these segments includes Grand Island, which consists of about 13 square miles. The other segments (unnamed) have a combined area of about 10 square miles.
DRAINAGE
The Eola-Amity Hills area is drained primarily by the Willamette and Yamhill Rivers and by Rickreall Creek. The Willamette River, which is the master stream, enters the area from the south and flows generally northward east of the Eola-Amity Hills; it forms the east boundary of the study area. The South Yamhill River enters the area from the west and flows generally northeastward across the west valley plain and part of Dayton Prairie, and is joined by the North Yamhill River about 2 miles northeast of McMinnville. From this confluence the Yamhill River flows generally eastward, to where it drains into the Willamette River about 3 miles east of Dayton. Rickreall Creek drains most of the southwest part of the study area; it enters the area

12 GROUND WATER, EKDLA-AMITY HILLS' AREiA, OREGON
northwest of Rickreall, flows eastward, and drains into the Willamette River near Eola (fig. 1).
The two largest streams which rise within the study area are Ash Swale and Palmer Creek. Ash Swale drains much of the area west of the Eola-Amity Hills between Holmes Gap and Amity. It drains into Salt Creek, which flows into the South Yamhill River about 2 miles north of Amity. Palmer Creek, east of the Eola-Amity Hills, flows northward parallel to the Willamette River and empties into the Yamhill River at Dayton.
Most of the streams that drain the main valley plain, including the Willamette and Yamhill Rivers, are sluggish, meandering streams of low gradient. Their low gradients are caused largely by a natural dam of basalt across the Willamette River near Oregon City about 25 miles downstream from the study area. The dam, which is formed by struc tural uplift of the basalt, has been artificially heightened in recent years to increase the power potential of waterfall (Willamette Falls) over the dam.
Only small, generally intermittent streams drain the Eola-Amity Hills and the Red Hills of Dundee. Many of them begin as springs near the base of the lava that caps the hills. The few streams that are perennial discharge several cubic feet per second during the winter and spring, but their flow decreases markedly during the summer. Water from some of these streams is impounded behind small dams and is used for limited irrigation and public and domestic supplies.
STREAM DISCHARGE
Stream-gaging stations are maintained by the Geological Survey on Willamette River at Salem; on South Yamhill River near Whiteson; and on Rickreall Creek, about 3 miles west of Dallas (not shown on map). Streamflow records collected at those and other gaging stations are published in a ser|ies of Geological Survey water-supply papers entitled "Surface Water Supply of the United States, Part 14, Pacific slope basins in Oregon and lower Columbia River basin."
According to records published in this series, the average annual discharge of the Willamette River past the gaging station at Salem was about 23,350 cfs (cubic feet per second), or about 16.9 million acre-feet per year, for the period of record (1909-63). The discharge of the Willamette River measured'at Salem includes discharge from Rickreall Creek, which averaged about 102,000 acre-feet per year dur ing 6 years of record, beginning in 1947. Most of the visible inflow to the Willamette River along the reach that forms the east boundary of the study area north of Salem is from the Yamhill River, which had an average annual discharge near Lafayette of about 7,550 cfs

GEOGRAPHY 13
(about 1.12 million acre-ft per yr) during the period of record (1929- 32). Direct ground-water inflow to the Willamette Eiver from the study area is not known but is believed to be substantial.
The only stream-gaging station in operation in the study area as of 1964 was on South Yamhill Kiver near Whiteson. During 24 years of record beginning in water year 1941, the average annual discharge at that station was 1,743 cfs, which is equivalent to 1,262,000 acre-feet per year. The annual runoff of the river ranged from about 600,000 acre-feet in water year 1941 to more than 2 million acre-feet in water year 1956 (fig. 5). The average monthly flow of the river was about 275,000 acre-feet for January and about 3,000 acre-feet for August (fig. 6).
Measurements have not been made of the discharge of the smaller streams rising within the study area. The average discharge of even the largest of these streams is less than that of Kickreall Creek. These streams obtain a large percentage of their flow from ground water discharging through seeps and springs.
1- uj onr\n
u.Ulcc o <U-
wQ
< O>D OX 1000
RUNOFF, IN
Ul8 // /// //
' ' '
/ 1 *
< r/ * / /
/
7 /
,
/
/ / ,
/
y
-
//
/
// / / ' / / / ' / / * '
/
s /
/
/ /
' / ^
/
/ / / / ^
/
/ ^ / / /X /
/ / / / / / /
/ ^/ /
/ ,/
'
/
/ / /
' s
7
/
/s 'S '
s s
, // / / / /
X " / '/ / ///
/ '/ / '/ X
/
/ // / // / / /0
/ //
/ '/ / / '
/ ' / ', // /X /
// / '/ / / //
/
/
/ X /
/ /
// /
/ /
/
X /
/ / / / ,^ __ <
/ ' / / ^ / / ^ / /
?
/ , // /
/ /
/ /
// 7
/
/
/
/
/
/
/
^
'
*
'
'
s< ' " '
7
'
/ ^ -1
'
^
'
x
'
/
'
/
/
7
/
s /^
/ _ / /
// / /
]|
H/ ^/ // // ^' ^ .
oo 01 o -! CM m oo 01 o -"IO IO IO
YEAR
FIGURE 5. Annual runoff of the South Yamhill River near Whiteson (wateryears 1941-64).
265^-947 O 67-

14300-
250
LU£ 200LUtrO<u_ 0
Q
< 150
I 1-
u_~u_ 0 Z 100Dtr
50
GROUND WATEK, E OLA- AMITY HILLS AREA, OREGON
iO0
W
\
!iV,y,%>
II%\//.1I1
\
V,
1'//
y/%
\
??1//
//,
\<7~r-(
\uV; // Y/A VA rm V71
oo§-g(OQ.roC-W)a zQ-)U-5<S-,-j<(rt
FIGURE 6. Average monthly runoff of the South Yamhill River near Whiteson(water years 1941-64).
CULTURE AND INDUSTRY
The area of this report is largely rural and sparsely populated. Most of the land is utilized for crops, orchards, and grazing. Salem, the principal commercial center serving the area, had a population of about 62,800 in 1964, including about 4,300 people who resided in West Salem. The largest city entirely within the study area is McMinnville,

GEOLOGIC SETTING. 15
which had a population of about 8,400 in 1964. Other towns in the area having reported estimated populations of 500 or more as of 1964 include Dayton (pop. 985), Amity (pop. 638), and Lafayette (pop. 579.)
Exact figures are not available for the rural population of the area. However, it is estimated from the Oregon State Board of Census rec ords of unincorporated county population that the rural population in the parts of Polk and Yamhill Counties included in the study area was about 7,500 in 1964.
The principal occupation in the Eola-Amity Hills area is agricul ture. About 20,000 acres of land was under cultivation in the area in 1964; about 4,000 acres was irrigated with ground water. The major farm crops included small grains, berries, and legumes; and the major orchard crops included nuts, cherries, and prunes. Dairy goods and poultry are also important agricultural products of the area.
Industries of the study area include food processing and packing, gravel screening, and rock quarrying. Much of the food grown in the area is processed and packaged at a large packing plant about 5 miles south of Dayton. Much of the rock material for road metal and for construction is obtained from gravel excavations adjacent to the Willa- mette and Yamhill Rivers and from rock quarries in the Eola-Amity Hills.
Ground water is by far the most important mineral resource of the area. Wells and springs supply water for the towns of Dayton, Amity, Lafayette, Eola, and Hopewell and for several water districts in the West Salem area as well as for most of the farm homes. Considerable ground water is also used for irrigation, especially in Dayton Prairie and the Willamette River flood plain.
Although the area west of the Eola-Amity Hills has long been con sidered a favorable area for oil and gas exploration, recent prospecting reportedly has not uncovered any economically important oil and gas accumulations.
GEOLOGIC SETTING
The Eola-Amity Hills area occupies part of the west limb of a synclinal trough that was formed by the structural deformation of Pliocene and older rocks. The syncline, whose axis trends north-north east, has been partly filled with nonmarine sedimentary rocks. The Miocene and older rocks are widely exposed in and west of the Eola- Amity Hills, dip generally eastward, and are buried under varying thicknesses of nonmarine sedimentary rocks in the eastern part of the area. The general geology of the study 'area is shown on plate 1.

16 GROUND WATER, E,OLA-AMITY HILLS AREA, OREGON-
ROCK UNITS AND THEIR WATER-BEARING PROPERTIES
MARINE SEDIMENTARY ROCKS
The oldest rocks exposed in the area are the marine sedimentary rocks of Eocene to middle Oligocene age, which underlie about 40 square miles in the area. These rocks underlie much of the south and west slopes of the Eola-Amity Hills and Eed Hills of Dundee; they generally erode to smooth, moderately steep slopes. Well records indi cate that marine sedimentary rocks underlie younger units at varying depths throughout the study area, as shown in the geologic sections on plate 1.
The marine sedimentary rocks consist mainly of thick layers of tuffaceous shale and siltstoiie, with thin interbeds of sandstone; these rocks are generally light gray to black in fresh exposures and buff to reddish brown in weathered exposures. They are intercalated locally with volcanic tuffs, lava flows, and breccias and have been intruded by gabbro and basalt sills in the northeast corner of the study area.
The thickness of the marine sedimentary rocks probably exceeds 5,000 feet in the study area. These rocks have been fully penetrated by an oil test well in the NE^ sec. 31, T. 6 S., E. 4 W., where they were found to be about 4,920 feet thick and to overlie volcanic rocks. The thickest sections exposed in the Eola-Amity Hills are generally less than a thousand feet thick.
The marine sedimentary rocks of this report include several forma tions that have been described by Snavely and Yokes (1949) ; Baldwin and others (1955) ; and Schenck (1928, p. 36; 1936, p. 62-63).
Shale and siltstone form the bulk of the marine sedimentary rocks in the Eola-Amity Hills area, are of low permeability, and yield water slowly to wells and springs. Most of the wells that tap these rocks yield only to 2 to 5 gpm (gallons per minute), and a few wells yield more than 10 gpm. Some individuals who live west of the Eola Hills, where the marine sedimentary rocks are at or near the land surface, have found it necessary to drill two or three wells before suffi cient water could be developed to meet normal household requirements.
Not all the materials in the marine sedimentary rocks have low permeabilities, however. Locally, moderately permeable interbeds of sandstone or volcanic rocks have been tapped by wells that produce several tens to more than 100 gpm. Well 5/4W-27E1, about iy2 miles east of Amity, taps marine sedimentary rocks and reportedly yields 120 gpm with 55 feet of drawdown. Well 5/5W-1P1, about 3i/2 miles northwest of Amity, reportedly yields 75 gpm with 160 feet of draw down ; however, most of the water from that well is probably developed in the overlying Troutdale Formation. A log is not available for well

GEOLOGIC SETTING 17
4/3W-6N1 at Lafayette; but that well, which reportedly yields 180 gpm with a drawdown of 50 feet, presumably taps the marine sedimentary rocfes.
A major problem in developing water from the marine sedimentary rocks, aside from the low permeability of those rocks, is that of water quality. The formation contains highly mineralized connate water; that is, water that was entrapped in the rocks during their deposition. (See table 4, sample 10.) This water is unsuitable for drinking and for most other uses. Much of the connate water has been diluted or displaced from the marine sedimentary rocks above a depth of about 200 feet by fresh ground water. However, several wells that tap the marine sedimentary rocks above a level of 200 feet yield water that is generally more mineralized than water from the younger rocks. A sample from well 6/4W-17K1 (table 4, sample 11), which taps marine sedimentary rocks above the 200-foot level, contained 2,100 ppm (parts per million) of dissolved solids, including 1,160 ppm of chloride, which is considerably greater than the mineral content of the samples from the younger rocks.
INTRUSIVE ROCKS
Coarse-grained intrusive basalt and gabbro underlie less than 2 square miles in the extreme northwest corner of the study area but are more widely exposed to the west (Baldwin and others, 1955). The rock is deeply weathered and forms a yellowish-brown clay soil.
No wells in the area are known to be drilled in the intrusive igneous rocks, which are of generally low permeability and probably would not yield appreciable quantities of water.
COLUMBIA RIVER GROUP
The marine sedimentary rocks are unconformably overlain by the Columbia River Group (formerly called the Columbia River Basalt), a series of basaltic lava flows that are locally of Miocene age. The Columbia River Group underlies about 35 square miles in the study area, caps the Eola-Amity Hills and the Red Hills of Dundee, and forms the eastward-dipping slopes of those hills. Well records indicate that the basalt may extend eastward for some distance beneath younger valley-fill materials, as shown in the geologic sections on plate 1. A down-faulted block of basalt 1 mile north of Amity marks tfie westernmost extent of the Columbia River Group in the study area. The basalt is widely exposed in adjacent parts of the northern Willam- ette Valley and much of the lower Columbia River basin.
The Columbia River Group is more resistant to erosion than the underlying marine sedimentary rocks. Consequently, the basalt forms

18 GROUND WATER, EOLA-AMITY HILLS AREA, OREGON;
escarpments and ledges above the contacts between the two geologic units.
The Columbia River Group consists of several accordantly layered lava flows that range in thickness from a few to several tens of feet. Thin rubbly interflow zones generally mark the contact between the individual flow layers.
The basalt in individual flows is, for the most part, dense and im permeable ; however, the basalt near the upper and lower surfaces of the flows is generally glassy and inflated and contains permeable vesicular and scoriaceous zones. Most of the flows contain one or more joint systems that are a result of contraction of the lava during cooling. In nearly all the flows a vertical joint pattern separates the rock into vertical columns ranging in diameter from a few inches to several feet. Similar columnar jointing is a characteristic structural feature of the Columbia River Group and can be seen in most exposures throughout the lower Columbia River basin.
Deformation of the Columbia River Group following its extru sion has caused considerable fracturing in the formation. The down- faulted block 1 mile north of Amity (pi. 1), for example, has been thoroughly brecciated. Similar brecciated flows can be seen in rock quarries in other parts of the Eola-Amity Hills. The brecciation enhances the water-yielding properties of the Columbia River Group.
In most places in the study area the Columbia River Group is deeply weathered and forms a buff to dark reddish-brown saprolitic soil that is strewn with large boulders of weathered lava. The depth of weathering is generally less than 50 feet, but in some parts of the area the entire unit is decomposed (table 2, log of well 6/3W-7A1). In fresh exposures the basalt is dark gray to black and porphyritic, with phenocrysts of feldspar and augite.
Basalt of the Columbia River Group was extruded on an unevenly eroded surface and has undergone considerable erosion following its extrusion. Consequently, the basalt varies considerably in thickness from place to place in the mapped area. The basalt ranges in thick ness from less than 1 foot along its exposed contact with the marine sedimentary rocks to about 400 feet (table 2, well 7/3W-8G1). In most places, however, the basalt is believed to be less than 400 feet thick and probably has an overall average thickness of about 200 feet.
The water-bearing properties of the Columbia River Group depend largely on the thickness and number of flows that form this geologic unit and on the total thickness of the basalt. The most permeable water-bearing zones in the Columbia River Group occur in the scori aceous upper parts of some flows and in the interflow zones. There fore, a well penetrating a large number of relatively thin flow layers
GEOLOGIC sosrrniNG 19
is likely to produce more water than a well of the same diameter and depth penetrating only a few relatively thick flow layers.
Along the east flanks of the Eola-Amity Hills and the Red Hills of Dundee, a number of wells tap basalt of the Columbia River Group at various depths below the regional water table. Most of these wells yield small quantities of water (generally less than 15 gpm). Some of the wells, however, produce more than 100 gpm. (See table 1, records of wells 5/3W-30M1, 6/3W-6R1, and 7/3W-8G1.)
Near the crest of the Eola-Amity Hills, the Columbia River Group extends above the regional water table. Here, discontinuous bodies of ground water are perched at varying depths in the basalt above the main water table. These perched ground-water bodies generally yield only small quantities of water to wells and springs.
During a pumping test that lasted nearly 6 days, one well that taps a confined perched ground-water body in the southern part of the Eola Hills was pumped at a rate of 100 to 105 gpm; however, the test indicated that the well probably would not sustain that rate. (See p. 43-44.)
TROtTTDAIiE FORMATION
Nonmarine sedimentary rocks of Pliocene age overlie the Columbia River Group with apparent unconformity. Where the Columbia River Group is missing, the nonmarine sedimentary rocks lie unconformably on the marine sedimentary rocks (pi. 1). The nonmarine sedimentary rocks are believed to be equivalent to the Troutdale Formation (lower Pliocene) of the East Portland area (Trimble, 1963, p. 29, and Hogen- son and Foxworthy, 1965, p. 22) and therefore are tentatively corre lated with that formation. Throughout most of the Eola-Amity Hills area, the Troutdale Formation is concealed beneath younger sedi mentary deposits. Only scattered outcrops of the Troutdale Forma tion, each covering less than a square mile, can be seen on the east flanks of the Eola-Amity Hills and Red Hills of Dundee (pi. 1) and along the channel of the Willamette River at low-river stage (not shown on map).
Where it underlies the northern part of the study area, the Trout- dale Formation consists chiefly of alternating layers of clay and sand with scattered discontinuous lenses of generally fine to medium gravel. The gravel lenses, which are generally less than 10 feet thick,.appear to have been deposited chiefly by the Yamhill and South Yamhill Rivers. Drillers' logs of wells indicate that gravel constitutes about 20 to 30 percent of the materials forming the Troutdale Formation beneath the valleys of the North and South Yamhill Rivers. Else where in the northern part of the study area, the Troutdale Forma-

20 GROUND WATER, EOLA-AMTTY HILLS AREA, OREGON1
tion (at least in the upper 200 ft) contains from 0 to 20 percent gravel.
In the southeastern part of the study area, the Troutdale Forma tion was apparently deposited by the Willamette River and contains a fairly large percentage of gravel (table 2, log of well 7/3W-10E1); some of the gravel strata contain boulders more than 6 inches in diameter.
The few exposures of the Troutdale Formation in the study area and drill cuttings from wells show the formation to be deeply weath ered and partly cemented. The pebbles and sand grains are largely basaltic. The cementing material is primarily iron oxide.
The Troutdale Formation ranges in thickness from less than 1 foot, where it laps up on the older rocks along the flanks of the Eola- Amity Hills and the Red Hills of Dundee, to about 280 feet, where it was penetrated by well 5/3W-9N1 near Uniondale. Well 5/3W-9N1 (driller's log in table 2) did not fully penetrate the Troutdale Forma tion, but the formation is assumed by the writer not to greatly exceed the 280-foot thickness penetrated at that particular site. This assump tion is based on a report by the owner that the now abandoned well originally yielded saline water, the source of which most likely was the underlying marine sedimentary rocks.
The maximum thickness of the Troutdale Formation may exceed 280 feet in other parts of the study area; but in most places where it has been fully penetrated by wells, the formation is generally less than 200 feet thick. In the northeast corner of the study area, for example, the formation is about 156 feet thick (table 2, log of well 4/3W-11C1); in the northwest corner, north of McMinnville, it is about 22 feet (log of well 4/4W-8H1); southwest of McMinnville it is only 3 feet (log of well 4/4W-30J1); in the southeast corner it is about 110 feet (log of well 7/3W-22M1); and in the southwest corner it is about 30 feet thick (log of well 8/4W-3B1).
The Troutdale Formation of the Eola-Amity Hills area is appar ently continuous with the Troutdale Formation of the French Prairie area (Price, 1967, p. 20). The formation can be traced from the French Prairie area to the Eola-Amity Hills area by exposures along the Willamette River, which forms the boundary between the two areas, and by well logs.
The Troutdale Formation of the Eola-Amity Hills area differs lithologically from that at the type area near Troutdale, Oreg. (about 40 miles northeast of Dayton), chiefly in that it contains few or no quartzite pebbles, whereas the Troutdale Formation at the type area and in much of the lower Columbia River basin contains abundant quartzite pebbles and cobbles. (See Trimble, 1963, p. 31, and Hogenson

GEOLOGIC SETTING 21
and Foxworthy, 1965, p. 22.) The absence of quartzite in the Trout- dale Formation of the study area is explained by a lack of quartzite in the source area, the drainage basins of the Willamette and Yamhill Rivers. In the type area, at Troutdale, materials composing the Trout- dale Formation were derived from quartzite-rich terrane in the upper Columbia River basin.
The Troutdale Formation is one of the most important geologic units in the Eola-Amity Hills area with respect to the availability of ground water. Most of the domestic wells and large-yield irrigation, industrial, and public-supply wells in the area tap the Troutdale Formation. The formation as a whole is generally only moderately permeable, but some gravel lenses are moderately to highly permeable and yield water readily to wells. Wells that tap one or more of the permeable gravel lenses in Dayton Prairie and other parts of the main Willamette Valley plain yield as much as 900 gpm of water, generally with less than 75 feet of drawdown (table 1, wells 5/4W-1C1 and -1E1).
In parts of the area where the Troutdale Formation contains little or no gravel (such as between Dayton and Hopewell), wells yielding up to 500 gpm have been developed from layers of moderately permea ble sand. (See table 1, wells 4/3W-28B1, -32B1, and -33K1.)
The predominance of fine sand and silt in the Troutdale Formation underlying the northern part of the study area has hampered develop ment of ground water. These fine-grained sediments enter wells through oversize perforations in the well casing and cause excessive wear on pumping equipment and water-distribution systems. In many parts of the country where similar problems exist, it has been found that use of properly designed and fabricated well screens has suc cessfully reduced the amount of sand entering the wells without reduc ing the water-yielding capacity of those wells.
wnj^AMEfTTE smr
A sequence of buff to reddish-brown silt with thin discontinuous lenses of clay or sand directly underlies about 130 square miles of the main Willamette Valley plain, and rests unconformably on the Trout- dale Formation and on the older rocks where the Troutdale Formation is absent (pi. 1). These fine-grained deposits have been correlated with the Willamette Silt of Allison (1953, p. 12) by Baldwin, Brown, Gair, and Pease (1955); therefore, the name Willamette Silt is also used in this report. The silt is generally bedded, and the bedding planes, usually several inches apart, are distinguished by faint color changes.
The Willamette Silt is well exposed along the bluffs of the Wil lamette River and its tributaries and in readouts throughout the area
2&5-94T O 67 1

22 GROUND WATER, EiOLA-AMITY HILLS AREA, OREGON
below a general altitude of about 200 feet. A veneer of the silt blankets the older rocks locally above 200 feet. However, the silt has not been mapped as a separate unit above that altitude (a) owing to the diffi culty in distinguishing it from the soils that are formed on the older rocks and (b) because it is too thin in most places above the 200-foot level to form an aquifer.
The Willamette Silt, as its name implies, consists mainly of silt-size particles. Four auger samples collected from the formation in French Prairie, and analyzed for particle-size distribution, contained from about 60 to about 80 percent silt-size particles (Price, 1967, p. 22). These samples contained about 6 percent clay and from about 14 to 35 percent very fine or fine sand. (See fig. 7 and following table.)
The Willamette Silt appears to be remarkably uniform in texture throughout the northern Willamette Valley. Therefore, the four sam ples collected from French Prairie are believed to be representative of the Willamette Silt that underlies the Eola-Amity Hills area.
U.S. STANDARD SIEVE NUMBER, OR NUMBER OF SIEVE OPENINGS PER INCH230 120 60 35 18
PERCENTAGE OF PARTICLES FINER THAN INDICATED SIZE CLASS>- w to * 01 o> ~J ooioc
oooooooo ooc
&t
^
A
i
j
/-i& *fl
1
1'$
/
/[M
1/
/Kit
f
Y
PARTICLE-SIZE DIAMETER, IN MILLIMETERS
FIGURE 7. Particle-size distribution of four samples of Willamette Silt from auger holes in French Prairie.

GEOLOGIC .SETTESTG, 23
Weight percentage of particles in samples of the Willamette Silt collected from augerholes in French Prairie
[Analyses by U.S. Geol. Survey hydrol. lab., Denver, Colo. Particle diameters, in millimeters]
Sample
1
2
3
4
Location
SEHSWHsec. 5, T.4S., R. 1 W--_ ...
SEHSEWsec. 34, T. 48., R.2 W. __. ___._
NEHSE^sec. 21, T. 5 S., R. 2 W.. ................
SWH8WH sec. 5 T. 68., R. 2 W..-. ......
Depthof
sample (feet)
17.5
9(1
16.5
9S
Clay
«o.-001)
7.7
6.0
5.7
6.0
Silt
(0. 004- 0. 0625)
66.5
80.4
62.9
58.8
Very fine
(0.0625- 0. 125)
23.0
1 O f\
26.2
31.0
Fine (0. 125- 0.25)
2.6
.6
5.2
4.0
Sand
Medi um
(0. 25- 0.5)
0.2
.2
Coarse (0. 5-1)
Very coarse (1-2)
In the study area the Willamette Silt ranges in thickness from less than 1 foot to about 75 feet. It is thinnest where it laps up on older rocks along the flanks of the Eola-Amity and other hills and thickest where it is exposed along the erosional scarp of the Willamette River. In most places, however, the Willamette Silt, as interpreted on well logs (table 2), is generally less than 50 feet thick.
The Willamette Silt was deposited in a lake that inundated the Willamette Valley during early Wisconsin (late Pleistocene) time. The lake was formed by apparent damming of the Columbia River in the vicinity of Portland.
The permeability of the Willamette Silt is generally quite low; consequently, the formation transmits water slowly to wells and springs. The average coefficient of permeability x of the four auger samples mentioned above was less than 1.0 gpd per sq ft (gallon per day per square foot). However, the coefficients of permeability of the sand occurring as lenses in the formation are undoubtedly much higher than 1.0 gpd per sq ft, and could be as much as about 63.0 (Price, 1967, p. 28).
Only a few wells tap the Willamette Silt in the Eola-Amity Hills area. Those wells produce sufficient water for domestic and stock sup plies, but the water is yielded much too slowly to sustain large con tinual pumping yields such as are needed for irrigation. The water from the Willamette Silt is of generally good chemical quality for most uses.
Although the permeability of the Willamette Silt is low, a large volume of water from precipitation and other sources percolates down
1 The coefficient of permeability can be expressed as the number of gallons per day of water at 60° F. that will pass a cross section of 1 square foot of a water-bearing rock under a hydraulic gradient of 1 foot in 1 foot (Brown, 19i53, p. 846). The field coefficient of permeability is the same, except that it is measured under the prevailing water temperature.

24 GROUND WATE.R, lEiOLA-AMITY HILLS AREA, OREGON
through the formation to help recharge more permeable aquifers in underlying Tertiary rocks. The average annual precipitation on the area is about 42 inches. Of this amount about 22 inches is lost by evapotranspiration. There is very little overland runoff because most of that part of the area underlain by Willamette Silt is flat, and most of the precipitation not lost by evapotranspiration is infiltrated by the silt and percolates to the water table.
LANDSLIDE DEBRIS
Landslides, involving mainly the Columbia River Group and ma rine sedimentary rocks, have occurred in several places along the south and west slopes of the Eola Hills. The largest of these are shown on plate 1. These slides have occurred where erosion has removed the lateral and vertical support from the relatively incompetent marine sedimentary rocks which have subsequently failed owing to their inability to support their own weight and the weight of the more competent overlying Columbia River Group.
Several small springs issue from landslide debris; some are used for domestic and limited irrigation supplies. Also, a number of wells tap the landslide debris locally and produce sufficient water for do mestic use. However, none of the wells that tap the landslide debris is known to yield more than about 20 gpm.
AZiLTIVITIM
Alluvial deposits of Recent age underlie the present flood plains of the Willamette and Yamhill Rivers and exend up the valleys of the larger tributaries of those two rivers. The most extensive deposits of alluvium underlie about 13 square miles in Grand Island and about 10 square miles in the flood-plain segments of the Willamette River near Salem. These deposits consist chiefly of alternating layers of highly permeable sand and gravel blanketed by several feet of flood- plain silt. The alluvial materials, which were derived largely from rocks of the Cascade Range, are mainly basaltic and andesitic but also include minor amounts of rhyolite and other igneous rock types. The clasts range in size from small pebbles to cobbles as much as 6 inches in diameter. Individual pebbles are generally well rounded, and the deposits are fairly well sorted.
The alluvium of the Yamhill River consists chiefly of fine-grained materials, although it does contain some gravel. The gravels are chiefly basaltic, as are the gravels in the alluvium of the smaller streams draining the Eola Hills.
The maximum thickness of the alluvium in the study area ranges from a few feet along small streams to about 70 feet in the Willamette

GROUND WATER 25
River flood plain. The contact between the base of the alluvium of the Willamette River and the top of the gravels of the underlying Trout- dale Formation is difficult to ascertain in well logs because of the similarity of drillers' descriptions of the two units. The arbitrary contracts shown on the logs of wells (table 2) penetrating the two geologic units indicate that the thickness of the alluvium increases in a downstream direction. For example, the alluvium is about 35 feet thick in the vicinity of Salem (logs of wells 7/3W-9F1 and 7/4W- 36F1), and as much as about 70 feet thick in Grand Island, about 10 miles downstream from Salem (log of well 5/3W-22J1). Logs of wells on the east side of the Willamette River flood plain also indi cate the increasing thickness of the alluvium in a downstream direc tion (Price, 1967, p. 29).
The alluvium of streams tributary to the Willamette River in the study area is generally too thin and of too low permeability to yield large quantities of water to wells. Conversely, the alluvium of the Willamette River is moderately to highly permeable in most places and yields moderate to large quantities of water (as much as 1,000 gpm) to wells.
GROUND WATER
GENERAL FEATURES OF OCCURRENCE
Ground water may be denned as water that occurs under hydro static pressure below the land surface and completely saturates or fills all the pore spaces in the rock materials in which it occurs. The saturated rock materials that readily transmit the ground water are referred to as aquifers, and those that do not readily transmit the ground water are referred to as aquicludes. All the saturated rocks in a given area may be referred to as a ground-water reservoir. The volume of water stored in the ground-water reservoir increases dur ing wet seasons and decreases during dry seasons, much the same as in most surface-water reservoirs.
In the Eola-Amity Hills area ground water occurs under unconfined, perched, confined, and semiperched hydrologic conditions. These vari ous conditions of occurrence are illustrated in figure 8 and are dis cussed below.
Most ground water in the study area is unconfined. The upper sur face of the unconfined ground-water body is called the water table, and its position is determined by the level at which water stands in wells that tap the unconfined ground-water body. The water table is under atmospheric pressure and is free to rise and decline in re sponse to recharge to and withdrawal from the unconfined ground- water body.

X-.
-* s
~\
x,
Eola
-Am
ity^li^
'/'.'''//'/
Pre
cip
ita
tio
n //////?
/
'
> E
vap
otr
an
spira
tion
\ t
\222
dA
quifers
in
ba
sa
lt o
f th
e C
olu
mbia
R
ive
r G
rou
p
Perc
hed
sV^r
tS-
or
sem
iperc
hed g
rou
nd
wa
ter
Gro
un
d-w
ate
r m
ove
me
nt
Gro
und-w
ate
r re
cha
rge
Eva
po
tra
nsp
ira
tio
n
Ma
rin
e s
edim
enta
ry r
ock
s
FIG
URE
8. H
ydro
logi
c sy
stem
and
var
ious
occ
urre
nces
of
grou
nd w
ater
. W
ell
A t
aps
unco
nfin
ed a
quif
er i
n th
e T
rout
dale
For
mat
ion
bene
ath
mai
n w
ater
tab
le,
wel
ls O
and
D t
ap a
con
fine
d pe
rche
d aq
uife
r in
bas
alt
of
the
Col
umbi
a B
iver
Gro
up,
wel
l B
tap
s an
unc
onfi
ned
perc
hed
aqui
fer
in b
asal
t of
the
Col
umbi
a B
iver
Gro
up,
and
wel
l E ta
ps a
sem
iper
ched
aqu
ifer
in th
e W
illa
met
te S
ilt.

GROUND WATER 27
In the Eola-Amity Hills area the main water table has a configura tion similar to that of the land surface but somewhat subdued; that is, it is highest beneath areas of highest land-surface altitude and lowest beneath areas of lowest land-surface altitude. A profile of the main water table is shown diagrammatically in figure 8, and con tours of the surface of the water table in the main valley plain, based on measurements made in late summer and fall, are shown on plate 1. Most wells in the main valley plain and the Willamette Kiver flood plain tap unconfined ground water beneath the main water table. A hypothetical example of such a well is well A in figure 8.
Perched ground water occurs locally in the Eola-Amity Hills and Red Hills of Dundee where the water in permeable rocks is held above the main water table by impermeable rocks (aquicludes), such as dense basalt. Water in the permeable rocks cannot percolate freely downward through the underlying impermeable rocks to the main water table and, therefore, accumulates as a perched ground-water body. Much of the perched ground water occurs in the deeply weathered upper part of the Columbia River Group, where it is separated from the main zone of saturation by dense unweathered basalt. A number of wells currently in use in the Eola-Amky Hills area tap perched uncon fined ground water. (See table 1, well 7/3W-17Q1.)
Confined ground water occurs locally in the Eola-Amity Hills and the Red Hills of Dundee, where permeable water-bearing zones in the eastward-dipping basalt flows of the Columbia River Group are over lain by or sandwiched between impermeable confining layers (fig. 8). Water moving into the lower ends of the permeable zones is under pressure exerted by the weight of unconfined water in the upper part of the aquifer. Similarly, confined ground water may also occur in the more permeable sedimentary rocks where they extend beneath im permeable clay layers in parts of the study area.
In a well that taps a confined ground-water body (fig. 8, wells C and D), the water rises above the bottom of the upper confining layer. The imaginary surface coinciding with the level to which confined water will rise in wells that tap the same confined aquifer is called the piezometric surface. If the piezometric surface is higher than the land surface at a well, water will flow out of the well (fig. 8, well D). Sev eral wells that tap confined aquifers in the Eola Hills flow continuously or during part of the year (table 1, wells 5/3W-19N1, 6/3W-6R1, and 7/3W-8R1).
In Dayton Prairie and adjacent segments of the main Willamette Valley plain, downward percolation of water from the land surface to the water table is impeded greatly by impermeable <?lay lenses in the Willamette Silt. The water held above the regional water table in

28 GROUND WATE.R, ElOLA-AMITY HILLS AREA, OREGON!
this manner may be referred to as semiperched water because it is not separated from the main zone of saturation by unsaturated rocks. The more permeable water-bearing layers (generally silt or very fine sand) above the clay lenses are referred to as semiperched aquifers. Several wells in the area tap semiperched aquifers in the Willamette Silt. Well E in figure 8 is a hypothetical example of such a well.
The principal features of the hydrologic system of the Eola-Amity Hills area are shown cliagrammatically in figure 8. As figure 8 shows, the ground-water reservoir receives natural replenishment (recharge) chiefly by downward percolation of precipitation that falls within the area boundaries. Other means of recharge include lateral percolation of ground water into the area from the north and west and downward percolation of water from overirrigated farmland. The ground water moves downgradient from the areas of recharge and discharges nat urally through seeps and springs (chiefly along stream channels) and by evapotranspiration.2 Some ground water is intercepted by dis charging wells in the area, but the volume discharged by natural means far exceeds that pumped from wells.
Most of the natural recharge takes place during the winter and early spring, when precipitation is greatest. The first autumn rains restore the soil moisture, but little water percolates to the ground-water bodies. However, when the soil has become saturated (generally by late November), nearly all the precipitation that is not lost by overland runoff or evapotranspiration percolates downward, saturates the per meable rock materials, and fills the ground-water reservoir. As the reservoir fills, ground-water gradients steepen and the rate of dis charge through seeps and springs increases. When the reservoir is filled to near capacity (generally by midspring), the rate of recharge cannot exceed the rate of discharge from the reservoir. Consequently, any additional water is rejected and lost by evaporation or overland runoff.
During the dry summer months the rate of ground-water discharge exceeds the rate of recharge, and the upper part of the ground-water reservoir becomes dewatered. The continual summertime discharge of ground water through seeps and springs helps to sustain the flow of the Willamette and Yamhill Rivers and of many of the smaller streams during this normal period of low flow.
No estimate was made of the annual change of ground-water storage in the Eola-Amity Hills area; however, records of ground-water levels collected in the area indicate that even during the drier years there was sufficient precipitation in the winter to restore all or most of the
2 Bvapotranspiration is a term used for the return of water to the atmosphere by the combined mechanisms of direct evaporation from land and water surfaces and transpira tion by vegetation.

GROUND WATER 29
water pumped or discharged by natural means during the preceding summer.
SPRINGS AND SEEPS
Springs occur under various geohydrologic conditions in the study area. Most of the springs in the Eola-Amity Hills and Red Hills of Dundee occur along exposed contacts of the marine sedimentary rocks and basalt of the Columbia River Group and at places wThere perched ground-water bodies intersect the land surface. They generally dis charge at the heads of small ravines. Those springs that were observed by the writer generally discharge a few to several tens of gallons per minute, but some discharge as much as 100 gpm during the wet season. Most of the larger and more permanent springs in the Eola-Amity Hills and Red Hills of Dundee have been developed by installing col lector systems and storage reservoirs and are used for domestic, stock, irrigation, and public supplies. Records of 13 representative springs that occur in the Eola-Amity Hills and Red Hills of Dundee are given in table 3.
Numerous springs and seeps in the main valley plain are along channels of deeply incised streams that intersect the main water table or perched ground-water bodies. The springs and seeps are generally not seen because they discharge into the streams at or below the water surface; thus, the discharge of individual springs or seepage areas cannot be directly measured or accurately estimated. However, the gain in flow of long reaches of streams represents the total discharge of all springs and seeps along those reaches; and in much of the Eola- Amity Hills area, the discharge is substantial. On the basis of estimates made in French Prairie, which is geologically and hydrologically sim ilar to the main valley plain in the Eola-Amity Hills area, the volume of ground water discharging through springs and seeps directly into streams draining 130 square miles of the main valley plain is about 500 acre-feet per square mile per year. This spring and seep discharge sustains the flow of the larger streams during late summer and con stitutes virtually all the flow of the smaller creeks that rise within the study area.
WATER-LEVEL FLUCTUATIONS
Ground-water levels rise and decline chiefly in response to recharge to and discharge from the ground-water reservoir. Other phenomena that cause ground-water levels to rise and decline include tides, earth quakes, and changes in atmospheric pressure. (A momentary fluctu ation of about 0.04 ft in the water level in well 4/4W-27J1, recorded Mar. 27, 1964, is attributed to the Alaskan Good Friday earthquake.)
26S-947 O 67 5

30 GROUND WATER, EOLA-AMITY HILLS AREA, OREGON!
Well 4/3W-33K1; taps the Troutdale Formation
Well 5/3W-21C1; taps the Troutdale Formation
Well 5/4W-11D3; taps the. Troutdale Formation
Well 5/4W-20N1; taps the Troutdale Formation
Well S/4W-25G1, taps basalt of the Columbia River Group
Well 5/4W-27E1, taps ma sedimentary rocks
Well 7/3W-10E1; taps alluvium and the Troutdale Fo mation
Well 7/3W-17Q1, taps basalt of the Columbia River Group
J FMAMJ JASON DJ FMAMJ JASON D J FMAMJ JASON D

GROUND WATEB 31
Figure 9 shows the hydrographs of water levels in eight wells that tap different geologic units in the Eola-Amity Hills area and the monthly precipitation recorded at McMinnville during the period 1962-65.
As figure 9 shows, the water levels in all the wells are generally highest during late winter and early spring, coinciding with the pe riod of greatest monthly precipitation, and are lowest during late sum mer and early autumn, coinciding with the period of least monthly precipitation. The lower levels also coincide and closely follow the periods of greatest pumpage and natural discharge of ground water in the area.
In general, the ground-water levels in wells that tap the Troutdale Formation in the east valley plain have fluctuated about 20 feet per year during the approximately 3 years of record (fig. 9, hydrographs of wells 4/3W-33K1, 5/3W-21C1, and 5/4W-11D3). In July 1963 a rise of water level (about 3.8 ft) was recorded in well 5/4W-11D3, whereas declines were recorded in the other observation wells. This in dicates that some recharge of ground water may have resulted from irrigation in the vicinity of well 5/4W-11D3 shortly before that well was measured.
Water levels in wells in the west valley plain fluctuate about 10 to 30 feet or more annually (fig. 9, hydrographs of wells 5/4W-20N1 and -2YE1). Gravel aquifers tapped by well 5/4W-20N1 apparently receive recharge continually from ground water moving into the study area beneath the west boundary. The larger fluctuations of the water level in well 5/4W-27E1 are attributed to the fact that the well is pumped for irrigation most of the summer.
Water-level records collected in two wells that tap basalt of the Columbia River Group in the Eola Hills indicate that the levels, at least in the lower altitudes, fluctuate about 5 to 15 feet during the year (fig. 9, hydrographs of wells 5/4W-25G1 and 7/3W-17Q1). However,
the annual fluctuations of water levels at higher altitudes in the Eola- Amity Hills may be more than 30 feet (table 1, well 5/4W-35C1). Con sequently, some wells that tap relatively thin perched aquifers could go dry during prolonged periods of dry weather.
In general, ground-water levels in the flood plain of the Willamette River fluctuate about 10 to 15 feet during the year, although the fluctua tions may be somewhat greater than 15 feet in areas of intensive local-
4 FIGURE 9. Water-level fluctuations in wells in the Eola-Amity Hills area and monthly precipitation at McMinnville during the period 1962-65.
32 'GROUND WATER, EOLA-AMITY HILLS ARElA, OREGON
ized pumping. The hydrograph of well 7/3W-10E1, which taps young alluvium and Troutdale gravels beneath the Willamette River flood plain, is shown in figure 9. The annual range of fluctuations of the water level in that well was about 5 feet in 1962 and 1963 and about 10 feet in 1964.
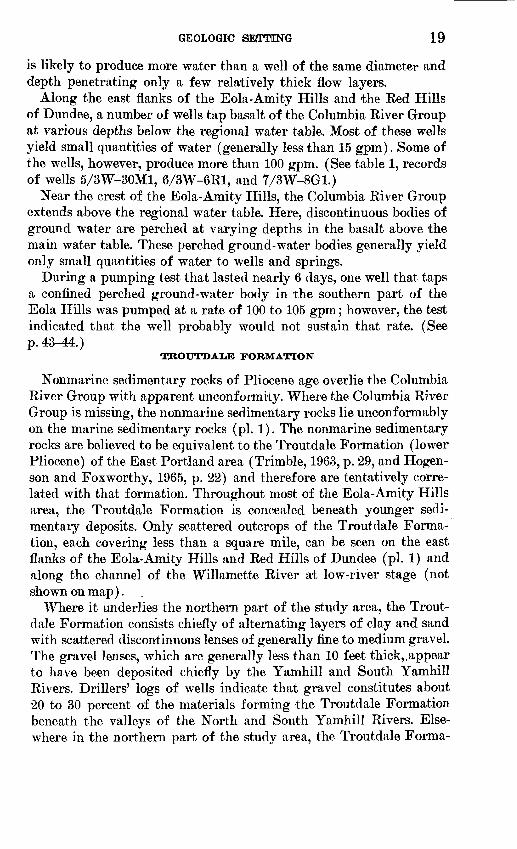
Figure 10 is a hydrograph, compiled from periodic water-level measurements made during the period 1928-65, of the water level in well 5/5W-13B1, which taps the Troutdale Formation. As the hy drograph shows, the water levels, like the levels in wells discussed above, are generally highest during late winter and early spring, and lowest in late summer and early autumn. There are not enough meas urements to indicate clearly any rising or declining trends on the hy drograph over a given number of years. However, the measurements that are available indicate that the water table fluctuated within the same range of levels during the entire period of record, even though there were some years of below-average precipitation. A long period of below-average precipitation in the region would very likely cause a declining trend in the ground-water levels in the study area.
20
30
Dashed line indicates period of more than one year between measurements
I I j__I1935 1940 1945
1945 1950 1955 1960 1965
FIGUEE 10. Water-level fluctuations in well 5/5W-13B1, which taps the Trout- dale Formation, during the period 192S-65.

GROUND WATE:K 33
CHEMICAL QUALITY OF THE GROUND WATER
The chemical analyses of 14 water samples collected in the Eola- Amity Hills area are given in table 4. One of the samples (sample 14) was collected from a spring that issues from the base of the Colum bia River Group (table 4, 7/4W-llMls). The other samples were col lected from wells that tap various geologic formations in the study area. Samples 1 and 13 are from wells believed to tap alluvium; sam ples 2, 4, 5, and 6 are from wells that tap the Troutdale Formation; sample 3 is from a well that taps the Willamette Silt; samples 7, 9, and 12 are from wells that tap basalt of the Columbia River Group; and samples 8,10, and 11 are from wells that tap marine sedimentary rocks. Twelve of the analyses given in table 4 are illustrated graphi cally in figure 11 to show the relative concentrations of important mineral constituents in the water. Excluded from figure 11 are the analysis of sample 10, a brine from deep in the marine sedimentary rocks, and the partial analysis of sample 8.
As figure 11 shows, the samples from the basalt of the Columbia River Group and alluvium contained the lowest concentrations of dissolved minerals. The samples from the Troutdale Formation and the Willamette Silt contained somewhat greater concentrations than those from the basalt and alluvium, and the sample from marine sedi mentary rocks contained moderate to large concentrations of dissolved minerals.
The chemical analyses indicate that most of the water from, the nonmarine sedimentary rocks (Troutdale Formation, Willamette Silt, and alluvium) and the Columbia River Group is of generally good chemical quality for most uses. The ground water from these rocks is soft to moderately hard and contains only small to moderate amounts of dissolved solids. The dissolved solids in the 11 samples from the nonmarine sedimentary rocks ranged from 85 to 273 ppm and averaged about 157 ppm. Three of the samples (2, 6, and 7) contained unusually large concentrations of iron.
In contrast, the chemical analysis of water from well 6/4W-6F1 (sample 10) shows that the marine sedimentary rocks contain highly mineralized water at great depths. The two samples (8 and 11) from wells that tap the marine sedimentary rocks at depths of less than about 200 feet are considerably less mineralized, although the sample from a depth of 191 to 201 feet (sample 11) contained 1,160 ppm of chloride and 2,100 ppm of dissolved solids.
Several of the more significant dissolved mineral constituents and properties of the ground waters sampled in the Eola-Amity Hills area are discussed briefly below. The reader is referred to a report by Hem (1959) for a more detailed discussion of the chemical characteristics of natural waters.

34 GROUND WATER, EOLA-AMTTY HILL® AREA, OREGON1
Qw, Willamette Silt Tcr, Columbia River Group Tm, marine sedimentary rocks
Tt
FIGURE 11. Chemical character of ground water. Numbers at top of bars cor respond to sample numbers in table 4.
IRON
Iron occurs in solution at two levels of oxidation ferrous (Fe+2 ) and ferric (Fe+3 ). Both forms can be present in the same solution under certain conditions. However, in the pH range of most ground water, significant amounts of dissolved iron are stable only in the ferrous form within a reducing (oxygen-deficient) environment. The ferrous form changes to the insoluble ferric form in the presence of oxygen. Thus, the water can contain as much as several parts per million of dissolved iron in a reducing environment, such as in deep aquifers; but the iron in solution becomes unstable and precipitates as ferric hydrox ide (rust) when the water is brought to the surface and exposed to the atmosphere.

GROUND WATER 35
Water containing more than about 0.3 ppm of iron can cause staining of utensils and laundry and can turn a rust color upon exposure to the atmosphere.
Of the 13 ground-water samples collected in the Eola-Amity Hills area and analyzed for iron, 6 contained less than 0.3 ppm of iron. The other seven contained concentrations of iron that ranged from 0.35 to 9.7 ppm and averaged 2.08 ppm. The unusually high concentrations (7.7 and 6.3 ppm) of iron in the samples from wells 4/3W-33K1 and 5/4W-1C1 (table 4, samples 2 and 6) were probably dissolved largely from iron-oxide cementing material in the Troutdale Formation.
It seems unlikely that all the iron (9.7 ppm) in sample 7 from well 5/4W-25G1 was dissolved from basalt of the Columbia River Group because the concentration of iron in waters from that formation seldom exceeds 1 ppm. Well 5/4W-25G1 was not used for more than a year prior to the time that it was pumped to collect the water sample. Conse quently, most of the iron in the sample was probably dissolved from the well casing and the pump column during the long period of time when the well was not used. Even though the well was pumped at a rate of about 75 gpm for more than 20 minutes (total withdrawal about 1,500 gal) before the sample was collected, the pumpage may not have been sufficient to remove all the abnormally iron-rich water from the well and aquifer.
CHXiOBIl>E
The U.S. Public Health Service (1962, p. 7) recommends that the upper limit for the concentration of chloride in drinking water be 250 ppm. A concentration of 300 ppm or more causes the water to have a noticeably salty taste, but water containing concentrations of chloride as great as about 1,000 ppm is used for domestic supplies in many places, including the study area, despite the salty taste.
The concentration of chloride in water from the Columbia River Group and from the nonmarine sedimentary rocks was generally low. In the 11 water samples collected from these rocks, chloride ranged from 2.0 to 10 ppm and averaged only 4.8 ppm. The chloride in the four samples collected from the Columbia River Group (table 4, samples 7, 9,12, and 14) averaged only 2.4 ppm.
The analyses of the three samples collected from the marine sedi mentary rocks (table 4, samples 8,10, and 11) show that the water in those rocks contains moderately large to extremely large concentrations of chloride and that the chloride content increases markedly with depth. For example, sample 8, collected from a depth of 50 to 77 feet, contained 172 ppm of chloride; sample 11, collected from a depth of 191 to 201 feet, contained 1,160 ppm of chloride; and sample 10,

36 GROUND WATER, EOLA-AMTTY HILI^S AREA, OREGON!
collected from an assumed depth of about 2,000 feet, contained 26,000 ppm of chloride.3
The increasing concentration of chloride with depth in the marine sedimentary rocks is brought about chiefly by mixing of the fresh ground water of meteoric origin with connate water entrapped in the rocks during their deposition. Much of the connate water has been displaced from the rocks at shallow depth, where ground water circu lates more freely; but very little has been removed at great depths, where ground-water circulation is slow.
FTjUOIUDE
Although fluoride is present in natural waters generally in concen trations of less than 1 ppm, its presence in drinking waters is important because of its effects on teeth. Concentrations of about 1.0 ppm of fluoride in drinking waters are considered beneficial in the formation of sound teeth (Dean, 1936, p. 1269-1272). However, concentrations of fluoride in excess of about 2 ppm in water consumed by children during the formation of their teeth may cause the enamel to become mottled. Nine water samples collected in the Eola-Amity Hills area were analyzed for fluoride. Concentrations of fluoride in these nine samples ranged from 0.1 to 0.5 ppm, amounts that may be slightly beneficial to tooth development.
HARDNESS OF WATER
Hardness is a property of water that causes excess consumption of soap used during washing. Hardness of water is caused principally by dissolved calcium and magnesium. These constituents and silica are a primary source of scale that forms in boilers and in cooking utensils. The relative degree of water hardness can be evaluated from the following arbitrary classification in use by the U.S. Geological Survey.
Hardness as CaCO3(parts per million) Degree of hardness
0-60 ___________________ Soft. 61-120 __________________ Moderately hard.
121-200 __________________ Hard. >200 ___________________ Very hard.
The hardness of most of the ground water in the Eola-Amity Hills area ranged from soft to moderately hard. Four water samples col lected from the Columbia Kiver Group (table 4, samples 7, 9, 12, and 14) ranged in hardness from 18 to 38 ppm, which is in the soft category.
3 Data are scant regarding the well (6/4W-6F1) from which sample 10 was collected. The present owner reported that the well was cased to its total depth of 2,985 feet, but that the water rises from a depth of about 2,000 feet through holes in the casing.

GROUND WATER 37
Two water samples from the alluvium (samples 1 and 13), two from the Troutdale Formation (samples 4 and 5), and one from the marine sedimentary rocks (sample 11) had hardnesses that ranged from TO to 116 ppm, which is in the moderately hard category. Two water samples from the Troutdale Formation (samples 2 and 6), one from the marine sedimentary rocks (sample 8), and the sample from the Willamette Silt (sample 3) had hardnesses that ranged from 141 to 197 ppm, which is in the hard to very hard categories.
The moderate hardness of sample 11 (106 ppm) is unusual, when one considers that most waters having concentrations of dissolved solids in the range found in this sample (2,100 ppm) are generally hard or very hard. Apparently the water from which sample 11 was collected has been softened naturally by coming into contact with minerals that have a high capacity for ion exchange. The ground water exchanges calcium and magnesium (which make water hard) for sodium, which is not a hardening constituent. This type of ex change, which generally results in a sodium bicarbonate water, has been observed in a number of areas throughout the country (Hem, 1959, p.220).
SUITABILITY OF THE GROUNI> WATER FOR IRRIGATION
Ground water from the Columbia Kiver Group and the nonmarine sedimentary rocks is chemically excellent for irrigation. Water from the marine sedimentary rocks is less favorable for irrigation, although water from several wells that tap those rocks is used to irrigate lawns, gardens, pasture, and some crops without harmful effects.
The characteristics most important in determining the suitability of water for irrigation are (a) the total amount of soluble salts, (b) the relative proportion of sodium to other cations in the water, and (c) the concentration of boron or other elements that may be toxic to plants (U.S. Salinity Laboratory Staff, 1954, p. 69).
Large amounts of dissolved solids (soluble salts) in irrigation water can have some harmful effects on crops and soil. The concentration of soluble salts in water is indicated by the electrical conductivity (specific conductance), which is usually expressed in micromhos at 25° C. (table 4). By measuring the specific conductance of the water, one can obtain an indication of its salinity hazard. If the specific con ductance of the irrigation water is high, the salinity hazard may be high. The range of conductivity of waters sampled in the study area (except sample 10) indicates that those waters may be applied to virtually all soils without harmful effects.
The sodium (alkali) hazard involved in use of water for irrigation is determined by the proportion of sodium relative to calcium and

38 GROUND WATE.R, EiOLA-AMITY HILLiS ARElA, OREGON)
magnesium in the water. If the proportion of sodium is high, the alkali hazard is high; conversely, if the proportion of calcium and magnesium is high, the alkali hazard is low.
A useful index for designating the sodium hazard is the sodium- adsorption-ratio (SAR), which is related to the adsorption of sodium by the soil. The classification of waters with respect to SAR is based primarily on the effects of exchangeable sodium on the physical con ditions of the soil.
Figure 12 is a diagram used for the classification of irrigation waters on the basis of specific conductance and SAR. This diagram classifies irrigation water into 16 categories, ranging from low salinity (Cl) and low sodium (SI) to high salinity (C4) and high sodium (S4). Water in the 01-$ 1 category can be used on practically all soils with little danger of harmful effects on the soils or crops; water in the C4-S4 category is unsuitable for any type of crop or soil except under special conditions.
Most of the analyses plotted in figure 12 fall in the Cl-Sl class (low- salinity-low-sodium hazard) and the C2-S1 class (medium-salinity- low-sodium hazard) and therefore are suitable for irrigation. How ever, one analysis that of sample 11 from the marine sedimentary rocks is in the very high salinity-very high sodium hazard category. Even though the indicated hazard is high, the water may be suitable for irrigation in the study area. (The classification shown in fig. 12 applies chiefly to warm, dry climates and may not apply strictly to the more humid climate of the study area.) The well from which sample 11 was collected (well 6/4W-17K1) is used mainly for supple mentary domestic supply and for watering of a small lawn and shrubs; and according to the owner, the water has had no harmful effects on the plants and soil.
Small amounts of boron are essential to the growth of nearly all plants; a slight excess over the required amount, however, is toxic to some types of plants. Therefore, plants may be classified as sensitive, semitolerant, and tolerant according to their ability to withstand boron concentrations (Wilcox, 1948). Of the more common irrigated crops in the Eola-Amity Hills area, legumes and corn are most sensitive to boron and may not withstand concentrations of more than about 1 ppm. Other irrigated crops in the area, such as cabbage and alfalfa, are tolerant to boron and can withstand concentrations of as much as about 3 ppm.
Only two analyses in table 3 include a boron determination. Both reported concentrations (0.00 to 0.36 ppm) are nontoxic to even the most boron-sensitive plants.

100
GROUND WATER
23 57 1000
395000
34
32
30
28
26
24
22£*<| 20"ro
.1 18
* 16E3
i u
12
^ C1-S4
C1-S3
C1-S2
C1-S1
C2-S4
C2-S3
C2-S2
C2-S1
C3-S4
C3-S3
C3-S2
C3-S1
11
C4-S4
C4-S3 -
C4-S2
C4-S1
100 250 750 2250Specific conductance, in micromhos per centimeter at 25° C
Cl C2Medium
C3
High
C4
Very high
SALINITY HAZARD
FIGURE 12. Classification of irrigation waters (after U.S. Salinity Labora tory Staff, 1954, p. 80). Numbers of plotted circles correspond to sample numbers in table 4.

40 'GROUND WATE.R, EiOLA-AMTTY HILLS ARElA, OREGON
TEMPERATURE OF THE GROUND WATER
Most of the ground-water temperatures given in table 1 were taken by the well drillers at the time the wells were completed. The tempera tures given in table 4 were taken at the time of water-sample collection.
The temperature of ground water at shallower depths (generally less than 100 ft) is controlled largely by the mean annual air tempera ture, which ranges from about 50° to 54° F. in the Eola-Amity Hills area. Owing to the earth's natural temperature gradient, the tempera ture of ground water in the deeper aquifers (below 100 ft) increases with depth by about 1.8° F. for each 100 feet.
The temperature of the ground water from most of the wells in the Eola-Amity Hills area ranges from about 54° to 56° F. However, wintertime temperatures as low as 46° F. have been reported for waters from some of the shallower aquifers, owing to rapid recharge to the aquifers from rain and snow. Water from well 7/3W-8J1, which taps confined ground water in the Columbia River Group at a depth of 160 to 326 feet, reportedly had a temperature of 69° F. when the well was completed. This is somewhat warmer than could be expected if the rock and water temperatures were influenced only by the earth's nat ural temperature gradient. The water may have been wanned by heat generated along a fault (not shown on map) in the Salem Hills (Wells and Peck, 1961, map), which apparently passes beneath the Willa- mette River not far from that well.
UTILIZATION OF GROUND WATER
In the Eola-Amity Hills area, ground water is used mainly for irri gation and also for domestic, public, and industrial supplies. As used in this report irrigation supplies include water used for irrigation of crops, orchards, and pastures; domestic supplies include water used for household requirements, watering of stock, and irrigation of lawns and small gardens; public water supplies include water supplied to municipalities, water districts serving suburban residential areas, and school and recreational facilities; and industrial supplies include water used in processing and packing of fruits and vegetables, dairy opera tions, and processing of meat and poultry.
The total annual ground-water withdrawal for all uses in 1964 was estimated to be about 6,100 acre-feet. The amounts withdrawn for each major use are shown in the following table and are discussed below.
IRRIGATION
Most of the ground water used for irrigation in the study area is withdrawn from wells in Dayton Prairie and in segments of the present Willamette River flood plain. Nearly all those wells are equipped with

GROUND WATER 41
electrically powered pumps of known horsepower rating. By using data supplied by Portland General Electric Co. on the electric power consumed to operate the pumps during 1964 and estimates of the average pumping head in the area, it was estimated that the total volume of water pumped from the wells in 1964 was about 3,400 acre- feet. Another 1,400 acre-feet was estimated to have been withdrawn from springs and wells for which electric-power-consumption data were not available by determining the number of acres and types of crops irrigated with water from those wells and springs. During 1964, therefore, a total of approximately 4,800 acre-feet of ground water is estimated to have been pumped for irrigation in the study area; this is about 80 percent of the estimated total volume of ground water with drawn for all uses during that year.
EstimatedPrincipal uses amounts, 1964
of ground water (acre-feet) Irrigation supplies____________ _ 4, 800Domestic supplies__________________ 630Public supplies--^_________________ _____ 430Industrial supplies_ __________________ 250
Total (rounded) _____________________ 6,100
DOMESTIC SUPPLIES
Most of the wells and many springs in the Eola-Amity Hills area are used for domestic supplies, and most of these also supply water for livestock and for irrigation of lawns and small gardens.
The volume of ground water used for domestic supplies in 1964 was determined on an estimated daily per capita water requirement of about 75 gpd (gallons per day) for the rural segments of the study area. This estimate takes into account water used for all household requirements, watering of stock, and irrigation of lawns and small gardens. It is based on data collected in nearby water districts, where reasonably accurate records are kept of the amount of water delivered for rural domestic supplies.
The rural population of the Eola-Amity Hills area not served by public-supply systems in 1964 was estimated to be about 7,500. Assum ing that an average of about 75 gpd was required for each individual using privately owned domestic wells and springs, the volume of ground water withdrawn for domestic supplies in 1964 was about 562,000 gpd, or about 630 acre-feet.
PUBLIC SUPPLIES
The two largest cities in the Eola-Amity Hills area, McMinnville and West Salem, obtain their municipal water supplies from surface- water sources outside the study area. McMinnville's water supply is piped from Haskins Creek, which heads in the Coast Range; and West

42 GROUND WATER, ElOLA-AMITY HILLS AREiA, OREGON!
Salem's supply is piped by the Salem Water Department from the North Santiam River, which heads in the Cascade Range. Three wells in West Salem are maintained by the Salem Water Department on a standby basis and are used only for emergency supplies in West Salem.
Other towns in the study area that have public water-supply systems obtain their entire water supply from wells, springs, or both. These towns include Dayton, Lafayette, Amity, Hopewell, and Eola. A farm labor camp, a water district, several neighborhood water-supply sys tems, and several rural schools also obtain all or part of their water supply from wells or springs.
Very few records are kept of the volume of water pumped for public supplies in the Eola-Amity Hills area. Therefore, the pumpage could be estimated only by interviewing persons most familiar with the indi vidual water-supply systems and by determining from data so obtained the capacities, pumping rates, and number of people served. Thus, it was estimated that about 430 acre-feet of ground water was used for public supplies in the area in 1964. The largest amount (about 97 acre- ft) was used by the town of Dayton.
INIWSareilAXi SUPFXjIES
Only a small amount of ground water is withdrawn for industrial supplies in the study area as compared with the amounts withdrawn for irrigation and other uses. Most of the larger industries of the region are in Salem and McMinnville and are supplied with surface water. Industries that do utilize ground water include food process ing and packing and dairy operations.
About 250 acre-feet of ground water was pumped for these indus tries during 1964. The largest amount, by far (about 220 acre-ft), was pumped for food processing and packing at the Stayton Canning Co.'s Alderman Farms plant, about 5 miles south of Dayton.
GROUND-WATER CONDITIONS AND AVAILABILITY BY SUBAREAS
The occurrence, quality, and availability of ground water in any given area are controlled largely by the nature and distribution of the rock units that underlie that area and by the relation of those rocks to each other and to the main zone of saturation. At least seven geologic units of differing water-bearing properties underlie the study area. The uneven areal distribution of the rock units and their relation to each other and to the main zone of saturation make the occurrence, quality, and availability of ground water highly variable. The hydrologic properties of the rock units that underlie the area are discussed in an earlier section (p. 16 to 25). The areal distribution of the rock units is shown on plate 1, and their relation to each other

GBOUND-WATE.R CONDITIONS AND AVAILABILITY BY SUBAREAS 43
and to the main zone of saturation is shown diagrammatically in figure 8.
On the basis of geologic, hydrologic, and physiographic conditions, the study area is divided into four major ground-water subareas, each differing somewhat from the others in occurrence, quality, and avail ability of ground water. These ground-water subareas include the Eola-Amity Hills, the east valley plain, the west valley plain, and the flood plain of the Willamette Kiver.
EOLA-AMITY HILLS
The Eola-Amity Hills subarea includes the Eola-Amity Hills and the part of the Red Hills of Dundee that extends into the study area. These hills are underlain by marine sedimentary rocks that are capped on their east slopes by basalt of the Columbia Kiver Group. Both geologic units dip gently to the east.
At higher altitudes in the Eola-Amity Hills subarea, the main water table is generally more than 200 feet below the land surface. Con sequently, some wells at the higher altitudes must be drilled to con siderable depths to obtain sufficient water for domestic use. However, shallow, discontinuous bodies of perched ground water occur locally above the 200-foot level. These perched ground-water bodies (some less than 20 ft below the land surface) yield sufficient water for domestic requirements, but the water is yielded much too slowly to support large continual withdrawals such as are needed for irrigation and public supplies. Pump-test data collected and analyzed by D. H. Hart, U.S. Geological Survey (written commun., January 1953), showed this to be the case with the perched ground-water body tapped by well 7/4W-24G1. The data collected during the test indicate that the ground-water body is confined and of limited extent.
When a well that taps an extensive confined ground-water body is pumped at a constant rate, the drawdown of water level in the well below the nonpumping level increases roughly as the logarithm of pumping time. Therefore, a graph in which the drawdown of water level is plotted against the logarithm of time should be roughly a straight line. The slope, or change in slope, of this line reflects the inherent characteristics of the aquifer; steepening of the slope of the line without increasing the rate of pumping may be caused by one or more of the following possibilities: (a) The outer edge of the cone of depression 4 intersects one or more relatively impermeable zones
4 Cone of depression is a phrase used to refer to the drawdown of the water table (or piezometric surface) around a discharging well (as shown in cross section at the hypo thetical discharging well, well A, in fig. 8). When a well begins to discharge, the cone of depression expands and deepens until the rate of movement of water through the aquifer toward the discharging well equals the rate of discharge from the well; when this occurs, the cone of depression will remain stable.

44 GROUND WATER, ElOLA-AMITY HILLS AREA, OREGON
in the aquifer, (b) the outer edge of the cone of depression intersects an impermeable boundary of the aquifier, or (c) dewatering of the upper part of the aquifer by the pumping reduces the saturated thick ness of the aquifer and the cross sectional area through which the water can be drawn.
Figure 13 shows the drawdown of water level in well 7/4W-24G1 plotted against the logarithm of pumping time. The pumping rate ranged from 98 to 105 gpm. As figure 14 shows, the relation between drawdown and the logarithm of pumping time began to deviate from a straight line after about 200 minutes of pumping and continued a gradual downward trend until the end of the test. This could have been caused by one or more of the conditions mentioned above. In any event the test indicated that the aquifer would not sustain a pumping rate of about a hundred gallons per minute for indefinite periods of time.
At lower altitudes on the east side of the Eola-Amity Hills subarea, the Columbia River Group extends beneath the main water table. At these lower altitudes, wells that tap the basalt of the Columbia River Group are more likely to retain their original specific capacities during long periods of pumping than those that tap the discontinuous perched water bodies at higher altitudes; this is chiefly because there is less possibility of dewatering of the aquifers in the main zone of saturation. Several wells of moderate yield that tap the basalt of the Columbia River Group along the lower east slopes of the Eola Hills reportedly have fairly constant yields throughout the irrigation season. (See table 1, records of wells 5/3W-30M1, 6/3W-6J1, and 7/3W-8G1.)
The chemical quality of the water of the Eola-Amity Hills subarea is excellent to good for most uses, as indicated by the analyses of samples 7, 8, 9, 12, and 14 in table 4. However, wells that penetrate the marine sedimentary rocks considerably below the base of the basalt in this subarea could possibly pump water of less desirable chemical quality.
EAST VALLEY PLAIN
The geologic units that underlie the east valley plain are, in de scending order, the Willamette Silt, the Troutdale Formation, the Columbia River Group (probably absent locally), and the marine sedimentary rocks. (See sections on pi. 1.) Most of the ground water utilized in this subarea is pumped from the Troutdale Formation, although some wells tap the Willamette Silt or basalt of the Columbia River Group.

GROTJND-WATEB CONDITIONS' AND AVAILABILITY BY STIBAREAS 45
8 o02
P
(ONISVO n~l3M JO dOl MOn38Id fr^'O H3A3H d31VM OIIVIS) H3A3H
d31VM OIIVIS M013a 133d Nl 'NMOQMVya

46 GROUND WATE.R, EOLA-AMITY HILLS AREA, OREGON1
In the east valley plain the main water table is generally less than 50 feet below the land surface (see pi. 1), and most wells obtain water below that level; that is, from the main zone of saturation. Most wells in the Dayton Prairie and Spring Valley segments of the east valley plain are less than 150 feet deep, whereas those in the segment of the subarea between Dayton and Hopewell are generally between 200 and 310 feet deep.
Large-diameter wells in the east valley plain produce moderate to large quantities (as much as 900 gpm) of water with drawdowns of less than 100 feet. The most productive wells are those that tap gravels in the Troutdale Formation beneath the west half of Dayton Prairie and the segment of the subarea due west of Grand Island, although wells that tap only sand in the vicinity of Dayton re portedly produce as much as 480 gpm with 110 feet of drawdown.
On the basis of drillers' logs, it is estimated, using a method 5 described by Davis, Green, Olmsted, and Brown (1959, p. 211-241), that there is about 935,000 acre-feet of recoverable ground water of good quality in the 10- to 200-foot-depth zone beneath the 42,500-acre (or 67 sq mi) east valley plain. There is considerably more good- quality ground water available for recovery below the 200-foot-depth zone; however, there are insufficient well-log and quality-of-water data for aquifers below the 200-foot level on which to base quantitative estimates.
The chemical quality of ground-water samples collected in the east valley plain was found to be suitable for most uses, although the water from two wells (4/3W-33K1 and 5/4W-1C1) contained un usually large concentrations of dissolved iron. (See table 4, analyses of samples 2 and 6.) Also, the water from well 5/3W-9N1, which is one of the deepest (307 ft) wells in the subarea, was judged by the well owner to be too "saline" for irrigation after a corn crop had been damaged. A chemical analysis of the water was not available from which to determine the harmful constituents in the water, but the fact that the water was not suitable for irrigation (at least for corn) suggests that deeper wells in the vicinity of well 5/3W-9N1 or other parts of the subarea could also yield water containing harmful min eral constituents.
The predominance of fine sand in aquifers tapped by many wells in the east valley plain causes a major problem in development of
5 (a) Estimated specific-yield values were assigned to several lithologic types in repre sentative wells, as follows: Gravel or gravel and sand, 25 percent; sand, 20 percent; sand tincl clay, 15 percent; and clay, 5 percent; (b) an average specific yield, based on total thicknesses of respective lithologic units, was then computed for each township for the depth zone 10 to 200 ft; (c) the volume of saturated rocks in this depth zone was then multiplied by the computed average specific yield to obtain the volume of recoverable ground water.

GROUND-WATER CONDITIONS AND AVAILABILITY BY STJBAEEAS 47
ground water. The sand enters the wells, generally through oversize perforations, and causes excessive wear on pumps and water-supply systems. Also, sand and sediment accumulate in some wells, a condi tion which eventually necessitates cleaning and redeveloping those wells. In some wells artificial gravel packs have been used with mod erate success, but great care must be taken in the selection and place ment of the pack material around the well screen or perforated liner so that an effective pack may be formed.
In other areas, where sand has been a problem in ground-water development, well screens have been used with greater success than have gravel packs. Wells equipped with properly designed and fabri cated well screens (with a slot size to match the grain size of the aquifer materials) have an advantage over wells with perforated casings and gravel packs because the well screens provide more area open to the aquifer and have a slot size small enough to hold out the larger sand particles. The increased open area provides a greater yield from the well per unit drawdown, and the resultant lower en trance velocities reduce the quantity of sand drawn into the well with the water and subsequently pumped from the well.
Some wells in the subarea tap aquifers that contain a large per centage of silt. Even if those wells were equipped with well screens, the silt could not be held back because it is suspended in the pumped water. Suspended silt can be troublesome in water-supply systems where sediment-free water is needed.
There is no way to avoid pumping suspended sediment except by casing off the silt-producing strata during well construction. Care ful logging of the well is necessary to ensure that the casing will not be perforated or that a screen will not be placed opposite a silt- producing stratum.
WEST VALLEY PLAIN
Much of the west valley plain is underlain by marine sedimentary rocks, which in most places are covered by a veneer of the Troutdale Formation and Willamette Silt. In the subarea, therefore, most wells more than a few feet deep obtain water from the rather impermeable marine sedimentary rocks and generally yield less than 10 gpm. One well that taps the marine sedimentary rocks beneath the west valley plain was reportedly pumped at a rate of 120 gpm (table 1, well 5/4W-2TE1), but it is unlikely that more than a few gallons per minute of water can be obtained from other wells that tap this rock unit.
Locally in the subarea, however, alluvial deposits (probably the Troutdale Formation) overlie the marine sedimentary rocks. The more permeable of these deposits underlie the valley of the South Yamhill

48 'GROUND WATER, ElOLA-AMITY HILLS AREiA, OREGON)
River and yield moderate quantities of water to wells. Well 5/5W- 25A1, which taps these deposits, reportedly yielded 250 gpm with 61.5 feet, of drawdown. Wells 5/4W-20N1 and 5/5W-1P1 tap both the Troutdale Formation and the marine sedimentary rocks but are be lieved to obtain most of their yield from the Troutdale. They report edly yielded 60 gpm with 97 feet of drawdown and 75 gpm with 160 feet of drawdown, respectively.
A major problem affecting the devolpment of ground water in the west valley plain, aside from the low. permeability of the marine sedi mentary rocks that underlie most of that subarea, is the mineral con tent of the ground water in those rocks particularly of the water from deeper producing zones. The amount of water that can be pumped from a well is determined to some extent by the depth drilled and the number of producing zones penetrated and is therefore limited locally because of poor-quality water from the deeper producing zones.
WILLAMETTE RIVER FLOOD PLAIN
The principal aquifers in the Willamette River flood plain include sand and gravel deposits in the alluvium of the Willamette River and in the Troutdale Formation which underlies the alluvium in most places. The alluvium generally is 40 to 70 feet thick in most parts of the subarea. The underlying Troutdale Formation extends to depths at least 120 feet or more below the base of the alluvium in Grand Island (table 2, log of well 5/3W-22J1) and probably to even greater depths in other parts of the subarea downstream from Salem. Up stream from Salem, along Hayclen Slough, the alluvium is generally less than 50 feet thick and rests on marine sedimentary rocks (table 2, logofwel!7/4W-36Fl).
The water table is only a few feet below the land surface in most parts of the Willamette River flood plain and intersects the land sur face locally, as in abandoned stream channels and meander scars. It slopes toward the Willamette River and rises and declines with the stage of the river.
Ground water is pumped in the subarea mainly for irrigation; most of the wells are less than 100 feet deep and yield moderate to large quantities of water with only a few feet of drawdown. Because of the small drawdowns, many of the wells are equipped with centrifugal pumps, which are easily transported and can be stored during the winter. Locally on Grand Island, several wells failed to penetrate suffi cient permeable material in the alluvium and were drilled into the Troutdale Formation to depth of about 190 feet. Those wells (table 1, wells 5/3W-15R1 and 22Jl) flow at land surface.

StUMMMlY 49
It is estimated that about 420,000 acre-feet of recoverable ground water is stored in the 10- to 200-foot-depth zone in the 14,270 - acre Wil- lamette River flood plain; this estimate is based largely on specific yields determined in Mission Bottom and other flood-plain segments of the Willamette River east of the study area (Price, 1967).
The chemical quality of the ground water in the Willamette River flood plain is suitable for most uses. Two samples, Nos. 1 and 13 (table 4), from wells believed to tap alluvium of the Willamette River con tained only 132 and 156 ppm of dissolved solids, respectively. A sample (No. 5) collected from well 5/3W-15R1, which taps the Troutdale Formation in Grand Island, contained 211 ppm of dissolved solids. None of the samples had significantly large concentrations of unde sirable mineral constituents.
SUMMARY
Ground water is generally available throughout the Eola-Amity Hills area, but the quantities that can be developed vary considerably from place to place. Small but usable quantities for domestic and stock supplies can generally be developed from wells that tap the marine sedimentary rocks underlying most of the area west of the Eola-Amity Hills. In the Eola-Amity Hills small quantities of water can be ob tained from the marine sedimentary rocks, and small to moderate quantities are obtainable from the basalt of the Columbia River Group. However, the amount of water yielded by a well that taps the basalt of the Columbia River Group depends greatly on the thicknesses of saturated permeable zones in the basalt penetrated, and those thick nesses vary considerably over short distances. In the main valley plain north and east of the Eola-Amity Hills and in the flood plain of the Willamette River, moderate to large quantities of water are available from the Troutdale Formation and alluvium of the Willamette River. The Willamette Silt, which blankets much of the Eola-Amity Hills area below an altitude of about 200 feet and ranges in thickness from less than 1 foot to about 75 feet, yields only small quantities of water to wells.
It is estimated that more than 1.3 million acre-feet of recoverable ground water is stored in the 10- to 200-foot-depth zones in the east valley plain and Willamette River flood plain, although no estimate was made for the rest of the Eola-Amity Hills area.
Most of the ground water, which receives replenishment mainly from precipitation that falls in the area (1900-64 average about 42 in. per yr), discharges naturally through unused seeps and springs and

50 GROUND WATER, E'OLA-AMITY HILLS AREA, OREGON)
by evapotranspiration. At least part of that water could be intercepted and put to beneficial use by pumping from wells and by developing springs.
Major problems affecting the utilization of ground water in the Eola-Amity Hills area are (a) uneven distribution of the more per meable rocks throughout the study area, (b) undesirable chemical quality of ground water locally in the marine sedimentary rocks, and (c) undesirable effects of sand and silt on the efficiency and life of wells that tap the Troutdale Formation and on pumps and water- distribution systems. Other problems, such as mutual interference between discharging wells and local overdraft, may arise as develop ment of ground water increases.
BASIC GROUND-WATER DATA
The data summarized in the following tables are representative of all ground-water data previously available or collected in the study area during this investigation. Virtually all the data collected during this investigation have been published by the Oregon State Engineer (Price and Johnson, 1965). Additional unpublished ground-water data, including well records and ground-water-level records, are on file at the offices of the Oregon State Engineer, Salem, and the U.S. Geological Survey, Portland, Oreg.
Most of the well records shown in table 1 (records of representa tive wells) were obtained from reports compiled by the drillers of the wells and from interviews with the well owners and operators. Most of the lithologic logs of wells given in table 2 were also obtained from well-drillers' reports. Those logs have been edited for consistency of terminology but have not been otherwise changed. The geologic desig nations have been assigned by the writer.
Only a few of the many springs presently being used in the Eola- Amity Hills and the Red Hills of Dundee are listed in table 3 to illus trate the various modes of occurrence and uses and to show the range of yield of the springs.
Table 4 (chemical analyses of ground waters) includes at least one analysis of water from each of the major geologic units tapped by wells in the study area, and all the analyses were made by the Geological Survey.

TAB
LE 1
. R
ecor
ds o
f re
pres
enta
tive
wel
ls
Wel
l num
ber:
See
p.
5 fo
r de
scri
ptio
n of
wel
l-nu
mbe
ring
sys
tem
.T
ype
of w
ell:
Dg,
dug
, D
r, d
rille
d.F
inis
h: B
, ope
n bo
ttom
(ca
sing
unp
erfo
rate
d);
G, g
rave
l pa
cked
; P
, ca
sing
per
fora
ted.
D
epth
int
erva
l of
gra
vel
pack
and
per
fora
tions
giv
en i
n fe
et b
elow
lan
d su
rfac
e at
w
ell.
Cha
ract
er o
f m
ater
ial
and
geol
ogic
uni
t: T
cr,
Col
umbi
a K
iver
Gro
up;
Tm
, m
arin
e se
dim
enta
ry r
ocks
; T
t, T
rout
dale
For
mat
ion;
Qal
, al
luvi
um;
Qw
s, W
illa
met
te S
ilt.
Alt
itud
e: A
ltit
ude
of la
nd-s
urfa
ce d
atum
at
wel
l, in
fee
t ab
ove
mea
n se
a le
vel,
inte
r
pola
ted
from
topo
grap
hic
map
s.W
ater
leve
l: D
epth
s to
wat
er g
iven
in
feet
and
dec
imal
fra
ctio
ns a
re m
easu
red;
tho
se
give
n in
who
le f
eet
are
repo
rted
by
the
wel
l ow
ner
or d
rille
r.
Typ
e of
pum
p: C
, cen
trif
ugal
; C
y, c
ylin
der;
J, j
et;
N, n
one;
S, s
ubm
ersi
ble;
T, t
urbi
ne.
Wel
l pe
rfor
man
ce: Y
ield
, in
gal
lons
per
min
ute,
and
dra
wdo
wn,
in
feet
bel
ow n
ondi
s-
char
ging
wat
er le
vel,
repo
rted
by
owne
r, o
pera
tor,
dri
ller,
or
pum
p co
mpa
ny.
Bai
led
yiel
ds a
re in
dica
ted
fay
" b"
; fl
owin
g yi
elds
are
indi
cate
d by
" f.
"U
se:
D,
dom
estic
; Ir
r, i
rrig
atio
n; N
, non
e; P
S,
publ
ic s
uppl
y; S
, sto
ck.
Kem
arks
: C
a, c
hem
ical
ana
lysi
s in
tab
le 4
; H
, hy
drog
raph
inc
lude
d in
thi
s re
port
; L
, dr
ille
r's l
og o
f wel
l in
tab
le 2
; T
emp,
tem
pera
ture
of w
ater
, in
deg
rees
Fah
renh
eit;
W
L,
addi
tion
al w
ater
-lev
el m
easu
rem
ents
ava
ilabl
e at
the
off
ices
of t
he O
rego
n S
tate
E
ngin
eer,
Sal
em,
Ore
g.,
and
the
U.S
. G
eol.
Surv
ey,
Por
tlan
d, O
reg.
Rem
arks
on
the
adeq
uacy
and
dep
enda
bili
ty o
f wat
er s
uppl
y, g
ener
al q
uali
ty o
f wat
er,
and-
ma-
te
rial
s pe
netr
ated
are
rep
orte
d by
ow
ners
, ten
ants
, dr
iller
s, o
r ot
hers
.
Wel
lO
wne
rT
yp
e of
w
ell
Yea
r co
m
plet
ed
Dep
th
of w
ell
(fee
t)
Dia
m
eter
of
wel
l (i
nche
s)
Dep
th
of
casi
ng
(fee
t)
Fin
ish
Wat
er-b
eari
ng z
one(
s)
sfe
D.o
-2(B
+J^
Q
_M 03**
og
Sa
a^-
e
Cha
ract
er o
f m
ater
ial
and
geol
ogic
uni
t (p
l. D
Alt
i
tude
(f
eet)
Wat
er le
vel
Feet
be
low
da
tum
Dat
e
Ty
pe
of
pum
p
and
hp
Wel
l per
fo
rman
ce
Yie
ld
(gpm
)
Dra
w
dow
n (f
eet)
Use
Rem
arks
T. 4
S.,
R.
3 W
.
6N1
9B1
11C
1
26K
1
28B
1
32B
1
83K
1
Cit
y of
Laf
ay
ette
. C
ityo
fDay
ton.
W.
E.
Forr
est-
R.
H.
Woo
d--.
W.
E.
Gra
ben-
ho
rst.
Jess
Hoc
kem
a..
C. J
. T
ren
t-
Dr
Dr
Dr
Dr
Dr
Dr
Dr
1913
1937
1961
1957
1959
235
208
196 40
158
155
228
8 6 6 8 10 8
235
192J
.S
159
155
220
P
B B B /P,
82-1
58
\G,
20-1
58
P,
80-1
55
P,
64,6
9,
85-1
00,
175-
220.
G,
19-2
20
200
I" 1192
40
}l!6
f 85
11
29
83 173
8 1 1 19 15 6 9 46
Bas
alt
(Tcr
)..
Sand
, co
arse
(T
t).
Boc
k, p
orou
s (T
cr).
A
Uuv
ium
(?)_
.
Sand
(T
t) .
.
}san
d(T
t)._
.._
Sand
, fin
e (T
t).
Sand
, so
me
clay
(T
t).
220
280
1 14
0 80
162
158
160
53.2
0
120 9.
78
I2' 128.
79
14 26.7
0
5-23
-63
3- 3
-65
9-18
-63
10-1
4-61
9-21
-62
5-
-57
10-2
9-62
T,2
5
T,3
0
J IT, 2
5
T,
30
180
150 5
385
480
350
50
80 178
110
125 90
PS
PS D PS
Irr
Irr
Irr
WL
.
L.
Ca.
Irri
gate
s ab
out
40 a
cres
.
Tem
p 56
.
Irri
gate
s ab
out
60 a
cres
; T
emp
55;.
Ca,
H,
WL
.

Or
TAB
LE
1. R
ecor
ds o
f re
pres
enta
tive
wel
ls C
onti
nued
Wel
lO
wne
rT
ype
of
wel
l
Yea
r co
m
plet
ed
Dep
th
of w
ell
(fee
t)
Dia
m
eter
of
wel
l (i
nche
s)
Dep
th
of
casi
ng
(fee
t)
Fin
ish
Wat
er-b
eari
ng z
one(
s)
««~in
Cha
ract
er o
f m
ater
ial a
nd
geol
ogic
uni
t (p
l. D
Alti
tu
de
(fee
t)
Wat
er le
vel
Feet
be
low
da
tum
Dat
e
Typ
e of
pu
mp
and
hp
Wel
l pe
r
form
ance
Yie
ld
(gpm
)
Dra
w
dow
n (f
eet)
Use
0
Rem
arks
o <d
T. 4
S.,
R.
4 W
. j>
6R1
7F1
8H1
24N
1
27D
1
30J1
31F1
I. H
. B
erna
rds.
W.
B.
Fost
er...
C.
E.
Co
nra
d..
A.
J. M
ott
.-.-
.
J. L
. W
ilcox -
McM
innv
ille
G
rang
e.
Am
os E
ash
....
Dr
Dr
Dr
Dr
Dr
Dr
1957
1963
1958
1956
1960
1961
46 160 96
41
120 96 75
6 6 6 12
10 6 6
46.6
72
96 120 60
3^
53
fP,
22-4
6 \G
, 16
-46
B
P,
79-9
6
P,
92-1
20
fP,
54-6
0 \G
, 29
-60
f P,
42-5
3 \G
, 20
-53
72 84 92
} 46
25 57
11J4
23 47 6
Bas
alt,
wea
th
ered
(T
m).
Bas
alt
(Tm
)_.
Gra
vel,
loos
e (T
t).
"Val
ley
fill"
...
Gra
vel a
nd
coar
se s
and
(Tt)
.
Mud
ston
e,
gritt
y (T
m).
Gra
vel,
ce
men
ted
(Tt)
.
220
188
155
152
150
140
150
8 50 Il4.
50
9.63
J17.
48
J27.
97
15 20
6-
-57
12-2
1-63
6-
20-5
81
12-
6-63
) 7-
25-3
05-
28-6
2 10
-16-
62
4- 7
-60
4-12
-61
J, 3
/4
8,1
S, l/
i
s,«
lOb
lOb
20b
10+
75 20b
20
27 85
25 42 45
30
D D
D
D,S
D.I
rr
D
D
Wel
l rep
orte
dly
&
adeq
uate
for
ir
riga
tion
of
M
law
n an
d O
sm
all g
arde
n.
t^ iL
. 5
Tem
p 52
.5; C
a.
h^
Als
o us
ed to
wj
su
pply
wat
er
for t
raile
r M
ca
mp;
Tem
p M
54
.5;
Ca,
H,
tj
WL
. £
L.
T.
5 S
., R
. 3
W.
Q
9N1
15R
1
How
ard
Bak
er.
D.
R. W
lley
...
Dr
Dr
1959
1958
307
192
10
10
30.
150
P,
110-
115,
25
8-26
6.
B
Jll2
J2
60
f 31
Il92
3 6Sa
nd (
Tt)
.
Sand
; so
me
grav
el (
Tt)
.
{Gra
vel,
coar
se
(Qal
). Sa
nd (
Tt)
.
Il60 lio
o
305-
12-5
9
5- 3
-58
NJ3
00
|500
95
137h D
, In
aA
band
oned
; S
re
port
edly
2
pum
ped
"sa-
y
lin
e w
ater
";
^
Tem
p 56
; L.
Wel
l flo
ws
abou
t 15
0 gp
m;
Tem
p 54
.5;
Ca.

BASIC GROUND-WATER DATA 53
S B
O 5P IN 5O
O Q Cl> 25
dieli c
So S 8
ls
r-i g oo
»O O* O 00 00 00 S "
« PH
oo oo
S o§ a
- *wasP11 So? a-
iSis-SHUgt
IN IN Oo o t-
.->,> ._.*O cS S'O rf ^g-sagsaM OQ 03 OQ
§ CO TX O <O 00
§ 00 IN IN Q Q CO t>- O ^ 25
*"55 S
Si S
s
go <o g g
Q ft ft ft
^ § 0 W
ft
tt -3
8 3
s s
ft ft
I

TAB
LE
1. R
ecor
ds o
f re
pres
enta
tive
wel
ls C
onti
nued
Cn
Wel
lO
wne
rT
ype
of
wel
l
Yea
r co
m
plet
ed
Dep
th
of w
ell
(fee
t)
Dia
m
eter
of
wel
l (i
nche
s)
Dep
th
of
casi
ng
(fee
t)
Fin
ish
Wat
er-b
eari
ng z
one(
s)
Q^""
3 B
^
Cha
ract
er o
f m
ater
ial
and
geol
ogic
uni
t
Alti
tu
de
(fee
t)
Wat
er le
vel
Fee
t be
low
da
tum
Dat
e
Typ
e of
pu
mp
andhp
Wel
l pe
r
form
ance
Yie
ld
(gpm
)
Dra
w
dow
n (f
eet)
Use
O
Rem
arks
jjj 0 0
T.
5 S.
, R
. 4
W. C
onti
nued
^
35C
1W
. J.
Sch
lech
t.D
r19
5916
36
67B
153
10Sa
nd, c
oars
e (T
m).
940
128.
52
158+
5-23
-63
10-
2-63
N15
bN
ITI
Fil
led
in w
ith
£|
silt
to 1
40
J°
ft b
y 19
64;
aban
done
d.
W
O
T.
5 S
., R
. 5
W.
i &
1P1
13B
1
25A
1
Ivan
and
Mar
- vi
n B
er
nard
s.G
eorg
e F
ulle
r..
Cit
y of
Am
ity.
Dr
Dr
Dr
1952
1959
325 64
89
12 6 10
60 88
B B P,
57}£
- 71
, 85
M-
86.
60 64
{ 84
}|
125 H
"All
uviu
m"
(Tt,
Tm
).G
rave
l an
d sa
nd (
Tt)
.[G
rave
l, lo
ose
[ (T
t).
128
152
162
26 21.2
8 8.
25
17.6
0
11
9-
-52
12-1
3-63
4-
1-6
3 7-
15-6
3
4-17
-59
T
75 7±
200
220
160 44
N
D,
S
PS
B
Wel
l ha
s H-
) ne
ver
been
KJ
us
ed.
H,W
L.
W
Tem
p 54
. ^
T.
6 S
., R
. 3
W.
§ FS.
6R1
7A1
30Q
2
Gus
t Ja
nze
n...
Est
ate
of B
elle
S t
alk
ins.
A
. H
. N
lsly
.
Dr
Dr
Dr
1952
1958
1956
142
250 66
10 6 6
122
187 65
B B
B
122
185 65
20 35 1
.. d
o........
Sand
and
gr
avel
(T
t).
190
200
170
30
25
9- 1
-58
1956
T,7
^/
80
I 11
0 6
30b
115
135
160 15
D
D
Irri
gate
s ab
out
_
30 a
cres
; ££
w
ater
leve
l 2
12
ft
abov
e S
la
nd s
urfa
ce
o
Feb.
195
3.
§
L.
Tem
p 56
.

BASIC GROUND-WATER DATA 55
«&^ 8s« l^so^l
§l*l2|?li|'s|u5'SooNS43
Q £5
8
o S
»H\
?cl
§
S cS
£ 1"
C3 ^ iw QC3-
<S 3W M
*
o> c<>
§
tO (N
U5 IO
S3 o><N
1 1
h bl
Q Q
^ 1"E uo S
M STH CD
s.irto & ._ d'-' 13^^io»i«« e"2® So
^«ldli**®S -®liS^'iS'SSoa^^iS^^^
Q
§
CT.
S!
§4. J>
>o o>
i
o H
N
|
i
N
S
CO
SSCT>
SH
Q
1^
w «'
n S
Well produced a small amount of
03
Q
CO
ss 1 J,4;£
3 §B
iRock (Tm) .
o
2
«
a
oo
8N
8sSH
Q
John Romig _ .
S t-
Sig- . ^ftg^a 0^ cf-*^ O . ^r^i 05 ° O U J
l§ls>
«° s

Cn
TAB
LE
1. R
ecor
ds o
f re
pres
enta
tive
wel
ls C
onti
nued
Wel
lO
wne
rT
ype
of wel
l
Yea
rco
m
plet
ed
Dep
thof
wel
l(f
eet)
Dia
m
eter
of
wel
l(in
ches
)
Dep
thof
casi
ng(f
eet)
Fin
ish
Wat
er-b
eari
ng z
one(
s)
a ,
S-w
lo
&SS
Q
" ^.M
Jai
n3
§^
&H
Cha
ract
er o
fm
ater
ial a
ndge
olog
ic u
nit
(pl.
D
Alti
-tu
de(f
eet)
Wat
er le
vel
Feet
belo
wda
tum
Dat
e
Typ
eof
pum
pan
d hp
Wel
l per
-fo
rman
ce
Yie
ld(g
pm)
Dra
w
dow
n(f
eet)
Use
oR
emar
ks
§ ^ Q 3 * ! <5T
. 7
S.,
R.
3 W
. >
8G1
8R1
9F1
10E
1
17Q
1
22M
1
28B
1
Em
met
tR
oger
s.
F. W
. B
erm
s...
Oak
Cre
stFa
rm.
L.
P. B
randt
Mrs
. Am
on
Gric
e.
Nor
thw
est
Nat
ural
Gas
Co.
C
ity o
f Wes
tSa
lem
.
Dr
Dr
Dr
Dr
Dg
Dr
Dg
1964
1960
1957
1961
1963
700
110 73
H
150 17
H
400 34
10 6 10 12 36 10 168
295 96 73
M
134M 17
H
20 34
B B P, 2
5-72
P, 4
0-13
0
B B B
135
108 24 20 160 30
±
15 2 47H
130 15
Roc
k, p
orou
s(T
cr).
Bas
alt,
"dic
ed"
(Tcr
).
Gra
vel,
sand
,an
d cl
ay(T
t).
Gra
vel a
nd
sand
, ce
men
ted
(Qal
.Tt)
.B
asal
t, w
eath
ered
(Tcr
).
Sand
, med
ium
, and
grav
el (
Tt)
. G
rave
l (Q
al)~
250
160
125
110
400
130
125
85 18 /24.
55
\29.
55
f 12.
59
lie. i
s
29.5
9- 9
-63
5- 1
8-65
6-
5-62
10
-16-
62
1- 2
3-62
9-
14-
62
9- 1
9-28
j y
T,
60
}T, 2
0
}cy
150
f 40
b
I 20
f
500
570 5
±
165
16 uf 30 7
100
PS D Irr
Irr
N PS
sE
ight
-inc
h J*
3st
eel l
iner
from
395
to
M45
5 ft;
L.
OFl
ows,
sta
tic
f
head
abo
ut
>4H
ft (
1960
); J.
supp
lies
5w
ater
for
n
swim
min
g hg
pool
; T
emp
«j55
.5,
Ca.
B P r^T
emp
57, H
, ®
L
, W
L.
^ s sH-
J6- Q
Gro
undi
ng
gjw
ell
for g
as
spi
pelin
e; L
. g
T
emp
54;
Ca.
g

T.
7 S
.f R
. 4
W.
6B1
13R
1
15K
1 24
G1
36F1
Art
hur
Lep
pin.
J. W
. Sim
mon
s.
Art
hur
Bis
hop.
R
. W
. C
lark
e..
Gor
don
Dag
ue.
Dr
Dr
Dr
Dr
Dr
1956
1958
19
53
1957
89
385 61
216 39
6 6 6 8 10
i« 41
14 35
B P
B P,
21-3
5
16 216 15
73 21
Bas
alt
and
shal
e (T
m).
B
asal
t (?)
(T
cr).
Shal
e (T
m)
. B
asal
t (T
cr).
.
Gra
vel
(Qal
)._
245
775
315
600
125
16 29
23.9
3
15
1956
7- 2
1-58
1-
19-
53
1-
-57
..H
C,1
0
3b 19
105
300
500
73 30
60+
3 5
S D D,
In
to
WL
.
Bas
alt
to 2
01
ft,
shal
e 20
1-38
5 ft
.
Wel
l ori
gina
lly
flow
ed.
L.
T.
8 S
., R
. 4
W.
W
3B1
T.
C. M
ulle
r...
Dr
1962
6012
60P
, 38
-56
3127
Gra
vel,
med
i
um,
and
clay
(T
t).
170
28.3
76
-5-6
240
028
Irr
SL
, W
L.
O 0 i a

58 GROUND WATEB, EOLA-AMITY HILLS AREA, ORE.GON1
TABLE 2. Drillers' logs of representative wells
MaterialThick
ness (feet)
Depth (feet) Material
Thick ness (feet)
Depth (feet)
4/3W-11C1E. Forrest. Alt 140 ft. Drilled by A. M. Jannsen Drilling Co., 1937. Casing: 6-in. diam to 192^ ft;
unperforated]
Willamette Silt:
Troutdale Formation: Sand, hard. __ ______ ...
22410
61
209732
22636
424363
160192
Columbia River Group:13
193196
4/4W-8H1[C. E. Conrad. Alt 155 ft. Drilled by Wilcox Drilling Co., 1958. Casing: 6-in. diam to 96 ft; perforated
79-96 ft]
Willamette Silt: Top soil- - - 2
1710
9228
2192938606873
Troutdale Formation:11HH
84951496
4/4W-30J1[McMinnville Orange. Alt 140 ft. Drilled by Wilcox Drilling Co., 1960. Casing: 6-in. diam to 60H ft; per
forated 54-60 ft; gravel pack 29-60 ft]
Willamette Silt: Top soiL--.-------.-. ---...--.
Troutdale Formation: Sand and
2 27 17
3
2 29 46
49
Marine sedimentary rocks: Mudstone, brown, gritty. .... Mudstone, blue and black,
12
35
61
96
5/3W-9N1
[Howard Baker. Alt 160 ft. Drilled by Willamette Drilling Co., 1959. Casing: 10-in. diam to 301 ft; perforated 110-115 ft, 258-266 ft]
Willamette Silt:
Willamette Silt and Troutdale
Troutdale Formation: Sand, black, water-bearing...
2 23
87
3 23 65
2 25
112
115 138 203
Troutdale Formation Con.
Clay, black. ..................
Sand, brown; some gravel. ... Clay, blue, with boulders .... .
17 10 30
6 19 15
6 1
220 230 260 266 285 300 306 307

BASIC GROUND-WATE'R DATA 59
TABLE 2. Drillers' logs of representative wells Continued
MaterialThick
ness (feet)
Depth (feet) Material
Thick ness (feet)
Depth (feet)
5/3W-22J1[Dan Tomkins. Alt 102 ft. Drilled by Willamette Drilling Co., 1962. Casing: 8-in. diam to 190 ft;
unperforated]
Alluvium:
Troutdale Formation:
Sand.. ____ . ___ .- ......
27 40
83 8
27 67
150 158
Troutdale Formation Con.24 3 4 1
182 185 189 190
5/4W-1C1[E. F. Day. Alt 155 ft. Drilled by Arrow Drilling & Supplies Co., 1963. Casing: 10-in. diam to 172 ft; per
forated 70-170 ft; gravel pack 18-172 ft]
Willamette Silt: Top soil. . .. 2
1631
6103
134
2184Q
556568
8185
Troutdale Formation Con.13184
196
134
10
98116120139145158162172
6/3W-7A1^Estate of Belle Simkins. Alt 200 ft. Drilled by West Well Drilling, 1958. Casing: 6-in. diam to 187 ft; un
perforated]
Troutdale Formation: Clay,
Columbia River Group:
Clay, red, soft, caving; yields
86
17
48
4 30
86
103
151
155 185
Columbia River Group Con. Basalt, decomposed, with
some unweathered layers;
Shale, light blue-gray,
Shale, blue and red, soft,
35
10
20
220
230
250
6/4W-17K1 [John Romig. Alt 220 ft. Drilled by John T. Miller, 1956. Casing: 8-in. diam to 32 ft; unperforated]
Willamette Silt: Top soil and clay.. _ _______ ._
Marine sedimentary rocks: Shale, blue... _______ .
Shale. _______ . _ . ....
32
109 10 40
32
141 151 191
Marine sedimentary rocks Con.
Shale, blue. hard... _ ._..
14 10 3 7
35
215 225 228 235 270

60 CROWD WATER, ElOLA-AMITY HILLS AREA, OREGON1
TABLE 2. Drillers' logs of representative wells Continued
MaterialThickness(feet)
Depth(feet) Material
Thickness(feet)
Depth(feet)
7/3W-8G1[Emmett Rogers. Alt 250 ft. Drilled by Barren & Strayer, 1964. Casing: 10-in. diam to 295 ft, 8-in. liner 395-
455 ft; unperforated]
Columbia River Group: Top soil ---_-__---_.--._...Clay, red. ____________________Rock, black, hard. _ __ __
bearing. ___________________Rock, black, hard.. __________Rock, gray. _________
Rock, black, hard ____________
108
117
15655015
510203
223540
1018
135
150215265280285295315318340375415
Marine sedimentary rocks:15153023
245207560
430445475498500545565640700
7/3W-9F1
[Oak Crest Farm. Alt 125 ft. Drilled by Harry A. Robinson, 1957. Casing: 10-in diam to 73J, ft; perforated25-72 ft]
Alluvium: Silt... . ____________________
Troutdale Formation:
1527
10
15172434
36^
Troutdale Formation Con.
Columbia River Group: Andesite,
1
36
37J^
73H
7/3W-10E1[L.P. Brandt. Alt 110 ft. Drilled by Duffleld Bros., 1961. Casing: 12-in. diamto 134J. ft; perforated 40-130 ft]
Alluvium: Silt, brown, sandy.....
tion: Gravel and sand, brown,
20
69
20
89
Troutdale Formation: Gravel and61 150
7/3W-22M1[Northwest Natural Gas Co. Alt 130 ft. Drilled by Bottner Drilling Co., 1963. Casing: 10-in. diam to 20
ft; unperforated]
Alluvium:
flll__._____-_-_______________
6
58
2076
6
64
84160
Troutdale Formation Con.15
8525
115
175
260285400
7/4W-36F1
[Gordon Dague. Alt 125 ft. Drilled by Art Clinton Well Drilling Co., 1957. Casing: 10-in. diam to 35 ft;perforated 21-35 ft]
Alluvium: Soil.... ____________________ 11
251136
Marine sedimentary rocks: Rock. 3 3?
BASIC GROUND-WATER DATA 61
TABLE 2. Drillers1 logs of representative wells Continued
MaterialThick
ness(feet)
Depth(feet) Material
Thickness(feet)
Depth(feet)
8/4W-3B1[T. C. Muller. Alt 170 ft. Drilled by Art Clinton Well Drilling Co., 1962. Casing: 12-in. diam to 60 ft;
perforated 38-56 ft]
WiUamette Silt:
Clay, blue.. __ ____ __ .
41413
41831
Troutdale Formation:1910
2
4858
60

TAB
LE 3
. R
ecor
ds o
f rep
rese
ntat
ive
spri
ngs
in t
he E
ola-
Am
ity
Hil
ls a
nd R
ed H
ills
of D
unde
efc
O
Num
ber:
See
p.
5 fo
r exp
lana
tion
of n
umbe
ring
sys
tem
.A
ltitu
de:
Alti
tude
of l
and
surf
ace
at s
prin
g in
fee
t abo
ve m
ean
sea
leve
l, in
terp
olat
edfr
om to
pogr
aphi
c m
aps.
Y
ield
: Y
ield
of s
prin
g es
timat
ed o
n gi
ven
date
; yie
lds o
f all
spri
ngsr
epor
tedl
y fl
uctu
ate
cons
ider
ably
thro
ugho
ut th
e ye
ar.
Use
: D
, dom
estic
; Irr
, irr
igat
ion;
PS,
pub
lic s
uppl
y; S
, sto
ck w
ater
ing.
R
emar
ks:
Ca,
che
mic
al a
naly
sis
give
n in
tabl
e 4;
gfr
m, g
allo
ns p
er m
inut
e; p
pm, p
arts
pe
r mill
ion;
Tem
p, te
mpe
ratu
re o
f wat
er in
deg
rees
Fah
renh
eit.
Spri
ng
4/4W
-4K
1S..-
5/4W
-23P
1S...
-.
25Fl
s___
__
35A
ls..-
__
35N
1S. _
36
N1
S
6/4W
-12B
1S...
..
Nam
e
Unn
amed
.
Bre
edin
g. ..
....
.
Mat
thew
s .......
Unn
amed
.. .-
-
Unn
amed
..- _
Ow
ner
or u
ser
City
of D
ayto
n...
Cit
y of
Am
ity
Hild
a P
arv
in
_
City
of A
mity
,A
. L. M
atth
ews.
Com
m.
R. H
. Wac
ken.
...
Altl
- tu
de
(fee
t)
295
400
495
800
900
500
600
Geo
logi
c so
urce
Basa
lt
....
. do
. ..
.
basa
lt.
..
do
... .
..d
o .
...
basa
lt.
Occ
urre
nce
cirq
ue in
rav
ine;
se
vera
l out
lets
vi
sibl
e.
betw
een
basa
lt an
d m
arin
e se
dim
enta
ry
rock
s.
feet
of s
oil n
ear s
mal
ra
vine
.
smal
l rav
ine
near
hi
lltop
.
base
of s
teep
slo
pe.
smal
l rav
ine
near
con
ta
ct b
etw
een
basa
lt an
d m
arin
e se
dim
en
tary
roc
ks.
eral
fee
t of s
oil o
n a
mod
erat
ely
stee
p sl
ope.
Gal
lo
ns
per
min
ut
e
1 V
\
Ort
<5 Ort
OR
10
fiel
d Dat
e
3-3-
65
e_l4
_«K
5-14
-65
6-14
-65
12-1
3-63
6-14
-65
Use
PS, I
rr
PS D PS, I
rr, D
D.I
rr
PS D,S
Rem
arks
^ S M jtf M
Fl
ows
into
sm
all
conc
rete
co
llect
or
osu
mps
; di
vert
ed f
rom
sm
all
sum
ps
tr1
into
rese
rvoi
r sys
tem
of a
bout
175
,000
- i>
ga
l ca
paci
ty;
over
flow
us
ed
for
J ir
riga
tion.
5
sum
p; d
iver
ted
from
sum
p to
220
,000
- 1-3
ga
l-ca
paci
ty
rese
rvoi
r;
Tem
p 55
; KJ
su
pple
men
ted
by
flow
fr
om
Mat
th
ews
Spri
ng a
nd o
ne w
ell.
hj
grav
ity
from
col
lect
or b
ox t
o P
arvi
n t]
ho
me.
C
sum
p; p
art
of w
ater
div
erte
d fr
om
^
sum
p to
city
of A
mit
y pi
pelin
e; p
art
£
dive
rted
for
dom
estic
and
irr
igat
ion
£H
supp
ly;
Tem
p 55
. ^
part
is
pum
ped
for
dom
estic
sup
ply;
p
irt
flow
s in
to
abou
t a
30,0
00-g
al-
O
capa
city
res
ervo
ir f
or i
rrig
atio
n.
g
by a
3-in
. pi
pe d
rive
n in
to s
prin
g 2
sour
ce;
supp
lem
ente
d by
flo
w f
rom
s
smal
ler n
earb
y sp
ring
. ^*

12M
1S
24L
ls_-
-_.
7/3
W-3
0M
1S
..
7/4W
-11M
1S
14L1
S
....
.do
........
.-..
.do
. .
Bra
nch.
Bra
nch.
Mee
ker
Ran
ch _
_
C.
N.
Purv
ine.
....
Ore
gon
Sta
teH
ighw
ay D
ept.
(Hol
man
Sta
te
Par
k).
fam
ilies
.
fam
ilies
.
800
480
300
225
610
600
.....d
o .
...
Basalt
-.-
Wea
ther
edba
salt
.
Lan
dsli
dede
bris
.
..... d
o .
...
Flow
s fr
om l
arge
see
par
ea n
ear s
mal
l rav
ine.
Flow
s fr
om n
ear
con
tact
bet
wee
n ba
salt
an
d m
arin
e se
dim
en
tary
roc
ks.
Flow
s fr
om b
ase
of lo
wes
carp
men
t in
to s
mal
l ra
vine
.
Sour
ce n
ot s
een;
flo
ws
from
lan
dsli
de r
ubbl
e;
sour
ce a
ppea
rs to
be
base
of l
ands
lide
es
carp
men
t.
slid
e es
carp
men
t nea
r co
ntac
t bet
wee
n ba
salt
an
d m
arin
e se
dim
en
tary
roc
ks.
near
con
tact
bet
wee
n ba
salt
and
mar
ine
sedi
men
tary
roc
ks.
15 20 80 20 50'
6-14
-65
6-21
-65
6-21
-65
6-21
-65
6-17
-63
S Irr
D.S
.Irr
D D.I
rr
D.I
rr
Flow
im
poun
ded
behi
nd
smal
l di
rtda
m a
t st
ock-
wat
erin
g po
int;
Tem
p 55
. D
iver
ted
dire
ctly
int
o sm
all
rese
rvoi
r;us
ed
to
irri
gate
se
vera
l ac
res
of
nurs
ery
stoc
k.
Dev
elop
men
t in
clud
es a
3-i
n. a
nd a
1-
in.
pipe
dri
ven
into
spr
ing
sour
ce;
over
flow
im
poun
ded
in s
mal
l re
ser
vo
ir f
orm
ed b
y di
rt-f
ille
d da
m a
cros
s ra
vine
; ir
riga
tes
abou
t 15
acr
es.
For
mer
ly s
uppl
ied
wat
er f
or d
rink
ing
and
park
res
troo
ms;
par
k ab
ando
ned
fa
in 1
965
to m
ake
room
for
fre
eway
. gj
Flow
s in
to s
mal
l woo
den
trou
gh; m
eas-
O
ured
yie
ld 3
0 gp
m O
ct.
2, 1
951;
Ca.
I
Mea
sure
d flo
w w
as 7
8 gp
m 1
00 f
t bel
ow
dup
per
orif
ice
and
115
gpm
J4
mil
e Z
be
low
upp
er o
rifi
ce o
n O
ct.
3, 1
951;
O
ha
rdne
ss 2
2 pp
m,
chlo
ride
2.5
ppm
. L Oi
CO

64 GROUND WATER, EiOLA-AMITY HTLL$ AREA, OREGON
TABLE 4. Chemical
[Analyses by U.S.
<o'o,
OQ
12
3 4
5 6
8
9
10
11 12
1314
Location No.
4/3W-26K1.. 33K1..
4/4W-24N1.. 27D1..
5/3W-15R1..5/4W-1C1
25G1..
27E1-.
6/4W-1H1...
6F1...
17K1_.7/3W-8R1...
28B1.. 7/4W-11M1S.
Geologic source
Troutdale Forma tion.
Willamette Silt.---..Troutdale Forma
tion. ...-do ..... .____._._.__.do.-__. _____._ Columbia River
Group. Marine sedimentary
rocks. Columbia River
Group. Marine sedimentary
rocks, - do...............Columbia Eiver
Group.
Columbia River Group.
Depth of
water bearing zone(s)
(feet)
40 64-69
4192-120
192 70-170 50-268
SO-77
219-233
2,000+
191-201 108-110
34
Date of collec tion
10-13-28 6-15-63
10-15-28 6-15-63
6-17-63 .-.do..-.
6-15-63
6-25-63
6-17-63
2- 6-65
6-17-63 6-17-63
10-13-28 6-17-63
-Temperature (°F)
51.5 55.0
52.5 54.5
54.5 55.5 55.0
55.0
55.5
56.0 55.5
54.0 53.0
Parts per million
Silica (SiO2)
42 31
21 32
33 3541
50
4
25 51
57 37
Iron (Fe)
.377.7
.23
.42
.35 6.3
29.7
.07
1.5
.17
.03
.10
.04
idIIs
.1
.2
.4
B 3*3 3Oea^-' O
1538.0
40.0 30.0
18.0 45.0
7.5
4.5
11,500
34.0 6.0
18.0 9.5
^ Ǥ
fs03 Hs s
8.0 14.0
10.0 10.0
9.121.0 4.0
1.7
51.0
5.0 2.2
10.0 3.7
1 Calculated values with bicarbonate (HCOs) recomputed as carbonate (COs).2 Includes dissolved and suspended iron.
SELECTED REFERENCES
Allison, I. S., 1953, Geology of the Albany quadrangle, Oregon: Oregon Dept. Geology and Mineral Industries Bull. 37, 20 p.
Baldwin, E. M., 1964, Geology of the Dallas and Valsetz quadrangles, Oregon: Oregon Dept. Geology and Mineral Industries Bull. 35 (revised), 56 p.
Baldwin, E. M., Brown, R. D., Jr., Gair, J. E., and Pease, M. H., Jr., 1955, Geology of the Sheridan and McMinnville quadrangles, Oregon: U.S. Geol. Survey Oil and Gas Inv. Map OM-155.
Brown, R. H., 1953, Selected procedures for analyzing aquifer test data: Am. Water Works Assoc. Jour., v. 45, no. 8, p. 844-866.
Davis, G. H., Green, J. H., Olmstead, F. H., and Brown, D. W., 1959, Ground- water conditions and storage capacity in the San Joaquin Valley, Califor nia: U.S. Geol. Survey Water-Supply Paper 1469, 287 p.
Dean, H. T., 1936, Chronic endemic dental fluorosis: Am. Med. Assoc. Jour., v. 107, p. 1269-1272.
Fenneman, N. M., 1931, Physiography of the western United States: New York, McGraw-Hill Book Co., 534 p.
Hart, D. H., and Newcomb, R. C., 1965, Ground water in the Tualatin Valley, Ore gon : U.S. Geol. Survey Water-Supply Paper 1697, 60p.
Hem, J. D., 1959, Study and interpretation of the chemical characteristics of natural water: U.S. Geol. Survey Water-Supply Paper 1473,260 p.
Hogenson, G. M., and Foxworthy, B. L., 1965, Ground water in the east Portland area, Oregon: U.S. Geol. Survey Water-Supply Paper 1793, 78 p.
Lowry, W. D., and Baldwin, E. M., 1952, Late Cenozoic geology of the lower Columbia River valley, Oregon and Washington: Geol. Soc. America Bull., v. 63, no. 1, p. 1-24.

SELECTED REFERENCES 65
analyses of ground waters
Geol. Survey]
Parts per million Continued
Sodium (Na)
7.2 14.0
12.0 8.3
40.0 18.08.7
5.6
4,060.0
770.0 8.8
9.15.2
Potassium (K)
1.32.5
1.4 1.7
1.8 2.7 1.6
2.0
22.0
5.8 2.6
.7 2.2
Bicarbonate (HC03)
88 209
160 141
203278
52
36
14
194 49
109 56
Carbonate (COa)
0 0
0 0
0 0 0
0
0
0 0
0 0
Sulfate (SO4)
5.5 1.8
17.0 6.0
.2
.4 9.6
.0
12.0
2.6 .2
5.3 .0
Chloride (Cl)
2.6 4.2
10.08.2
4.5 .80
2.0
172.0
2.0
26,000.0
1,160.02.5
5.5 3.0
Fluoride (F)
0.4
.2
.1
.5
.2
.2
.3
.2
.1
o'S
11fc
5.33.5
3.81.5
.4
.3
.6
.9
53.0
3.0 .7
9 8
1.8
25<jsg°fe £
2.3
1.0
3.1 5.0 1.0
.47
.07
.64
.23
Boron (B)
0
.36
Dissolved solids '
132 215
197 168
211 273 102
85
341,800
2,100 99
156 91
Hardness, as CaCOs
70 153
141 116
82 197 35
153
18
28,900
10624
86 38
Sodium-adsorption-
ratio (SAR)
0.4.5
.4
.3
1.9 .6 .6
.6
33.0.8
.4
.4
Specific conduct ance (micromhos
at25°C.)
337
258
314 427 110
1,220
68
49,700
3,860 91
104
PH
7.7
7.5
8.0 7.7 7.5
7.2
6.1
7.6 7.4
6.6
a Includes 63 ppm of bromide (Br) and 14 ppm of iodide (I).
Newcomb, R. C., 1959, Some preliminary notes on ground water in the Colum bia River Basalt: Northwest Sci., v. 33, no. 1, p. 1-18.
Piper, A. M., 1942, Ground-water resources of the Willamette Valley, Oregon: U.S. Geol. Survey Water-Supply Paper 890,194 p.
Price, Don, 1967, Geology and ground water in the French Prairie area, north- ern Willamette Valley, Oregon: U.S. Geol. Survey Water-Supply Paper 1833, 98 p.
Price, Don, and Johnson, Nyra A., 1965, Selected ground-water data in the Eola- Amity Hills area, northern Willamette Valley, Oregon: Oregon Ground Water
Rept. 7, 55 p.Sceva, J. E., and DeBow, Robert, 1964, Ground-water levels, 1963: Oregon Ground
Water Rept. 4, 71 p. 1965, Ground-water levels, 1964: Oregon Ground Water Rept. 5, 109 p. Schenck, 1928, Stratigraphic relations of western Oregon Oligocene formations:
California Univ. Dept. Geol. Sci. Bull., v. 18, no. 1, 50 p. 1936, Nuculid bivalves of the genus Aclla: Geol. Soc. America Spec.
Paper 4,149 p. Snavely, P. D., Jr., and Vokes, H. E., 1949, Geology of the coastal area from Cape
Kiwanda to Cape Foulweather, Oregon: U.S. Geol. Survey Oil and GasInv. Prelim. Map 97.
Thayer, T. P., 1939, Geology of the Salem Hills and the North Santiam Riverbasin, Oregon: Oregon Dept. Geology and Mineral Industries Bull. 15, 40 p.
Treasher, R. C., 1942, Geologic history of the Portland area: Oregon Dept. Geologyand Mineral Industries Short Paper 7,17 p.
Trimble, D. E., 1963, Geology of Portland, Oregon, and adjacent areas: U. S. Geol.Survey Bull. 1119,119 p.

66 GROUND WATER, ElOLA-AMITY BOLLS AREA, QRE,GON!
U.S. Geological Survey, 1909-63, Surface water supply of the United States, part 14, Pacific slope basins in Oregon and lower Columbia River basin Water- Supply Papers 272, 292, 312, 332-C, 362-C, 394, 414, 444, 464, 484, 514, 534, 554, 574, 594, 614, 634, 654, 674, 694, 709, 724, 739, 754, 769, 794, 814, 834, 864, 884, 904, 934, 964, 984, 1014, 1044, 1064, 1094, 1124, 1154, 1184, 1218, 1248, 1288,1348,1398, 1448,1518,1568,1638,1718,1738,1945, and 1951.
U.S. Salinity Laboratory Staff, 1954, Diagnosis and improvement of saline and alkali soils: U.S. Dept. Argiculture Handb. 60, 160 p.
U.S. Public Health Service, 1962, Public Health Service drinking water standards, 1962: Public Health Service Pub. 956, 61 p.
Vokes, H. E., Snavely, P. D., Jr., and Meyers, D. A., 1951, Geology of the southern and southwestern border area, Willamette Valley, Oregon: U.S. Geol. Survey Oil and Gas Inv. Map OM-110.
Wells, F. G., and Peck, D. L., 1961, Geologic map of Oregon west of the 121st meridan: U.S. Geol. Survey Misc. Geol. Inv. Map 1-325.
Wilcox, L. V., 1948, The quality of water for irrigation use: U.S. Dept Agriculture Tech. Bull. 962, 40 p.
U.S. GOVERNMENT PRINTING OFFICE: 1967 O 265-947