Embed Size (px)
Citation preview

GROCERY SHOPPING DESTINATION CHOICE AND OBESITY:
AN EMPIRICAL STUDY OF URBAN POPULATION IN BANGKOK, THAILAND
by
Tinapa Himathongkam
A Dissertation
Submitted to the
Graduate Faculty
of
George Mason University
In Partial fulfillment of
The Requirements for the Degree
of
Doctor of Philosophy
Public Policy
Committee:
___________________________________ Naoru Koizumi, Chair
___________________________________ Lisa Pawloski
___________________________________ Kenneth Reinert
___________________________________ Chanuantong Tanasugarn, External Reader
___________________________________ Sita N. Slavov, Program Director
___________________________________ Mark J. Rozell, Dean
Date: ______________________________ Fall Semester 2016
George Mason University
Fairfax, VA

Grocery Shopping Destination Choice and Obesity: an Empirical Study of Urban
Population in Bangkok, Thailand
A dissertation submitted in partial fulfillment of the requirements for the degree of
Doctor of Philosophy at George Mason University
by
Tinapa Himathongkam
Master of Public Policy
Georgetown University, 2011
Bachelor of Arts
Wesleyan University, 2005
Director: Naoru Koizumi, Professor
Department of Public Policy
Fall Semester 2016
George Mason University
Fairfax, VA

ii
Copyright © 2016 by Tinapa Himathongkam
All Rights Reserved

iii
ACKNOWLEDGEMENTS
I would like to express my sincerest gratitude to my committee chair, Naoru Koizumi,
whose guidance and motivation both in academic and personal matters proved invaluable
not only to this dissertation but also to my future research undertakings. She was always
available for questions, generous with her time, knowledge, and useful comments. I am
also appreciative of my committee members, Lisa Pawloski and Kenneth Reinert, for
their contributions without which the completion of this project would not have been
possible.
Besides my committee members, I would also like to thank my supervisor, Arnauld
Nicogossian, for the opportunity to be part of the wondrous world of space medicine
research that I had never fathomed I would experience. I am truly thankful for your
support through all these years.
Last but not least, I am forever indebted to my parents, my sister, my brother, and my
loving husband for their endless patience and encouragement, for the sacrifices they
make for me to be on this journey, for always having faith in me and still letting me be
the baby of the family.

iv
TABLE OF CONTENTS
LIST OF TABLES ......................................................................................................................... vii
LIST OF FIGURES ........................................................................................................................ ix
LIST OF ABBREVIATIONS .......................................................................................................... x
ABSTRACT .......................................................................................................................................
CHAPTER ONE: INTRODUCTION .............................................................................................. 1
I: Statement of the Problem ......................................................................................................... 1
II: Study Objectives ..................................................................................................................... 2
III: Potential Contributions and Challenges ................................................................................. 3
CHAPTER TWO: LITERATURE REVIEW .................................................................................. 5
I: Grocery Retailing and Shopping in Asia .................................................................................. 5
Subsection 1.1 Grocery Retailing in Asia ................................................................................ 6
Subsection 1.2: Factors Impacting the Consumer’s Choice of Store Type .............................. 9
II: Grocery Revolution in Thailand ............................................................................................ 15
Subsection 2.1: The Arrival of Western-Format Grocery Outlets in Thailand ...................... 16
Subsection 2.2: Major Players in Bangkok, Thailand ............................................................ 20
Subsection 2.3: Grocery Shopping Behavior of Bangkok Residents ..................................... 22
III: Thailand’s Food and Health Policy...................................................................................... 26
Conclusion ............................................................................................................................. 40
CHAPTER THREE: THEORETICAL FRAMEWORK ............................................................... 57
I: The Evolution of the Obesity Issue Framework ..................................................................... 57
II: The Social Cognitive Theory ................................................................................................ 61
III: The Ecological Perspective Framework .............................................................................. 63
IV: Social and Structural Environment in Obesity Research ..................................................... 67

v
Conclusion ................................................................................................................................. 69
CHAPTER FOUR: RESEARCH QUESTIONS AND HYPOTHESES ....................................... 80
I: Spatial Analysis of Bangkok Food Landscape ....................................................................... 80
II: Socio-Demographic Analysis ................................................................................................ 82
III: Grocery Destination Choice and Health Behavior ............................................................... 88
IV: Grocery Destination Choice and Obesity ............................................................................ 91
Conclusion ................................................................................................................................. 93
REFERENCES .......................................................................................................................... 94
CHAPTER FIVE: DATA AND METHOD................................................................................... 98
I: Description of Data................................................................................................................. 98
Subsection 1.1: GIS Mapping Data........................................................................................ 98
Subsection 1.2: The Grocery Shopping and Health Survey and Data Collection ................ 101
Subsection 1.3: Definitions of Grocery Retailers ................................................................ 105
Subsection 1.4: Sample Populations .................................................................................... 107
II: Description of Methods and Model ..................................................................................... 108
Subsection 2.1 Average Nearest Neighbor Distance (NND) and Moran’s I Spatial Analysis
............................................................................................................................................. 108
Subsection 2.2: Shopper Group Characteristics (ANOVA, Chi-Squares, and Independent t-
tests) ..................................................................................................................................... 111
Subsection 2.3: Grocery Destination and Health Behavior (Negative Binomial Regression)
............................................................................................................................................. 115
Subsection 2.4: Grocery Destination Choice and Weight Status (Ordinary Least Squares
Regression) .......................................................................................................................... 119
REFERENCES ........................................................................................................................ 128
CHAPTER SIX: STATISTICAL ANALYSIS RESULTS.......................................................... 130
I: Descriptive Statistics ............................................................................................................ 130
II: Research Question I ............................................................................................................ 137
III: Research Question II .......................................................................................................... 141
IV: Research Question III ........................................................................................................ 150
Negative Binomial Regression Analysis .............................................................................. 153
V: Research Question IV ......................................................................................................... 160

vi
Subsection 5.1: Shopper Groups .......................................................................................... 160
Subsection 5.2: Frequent Shoppers ...................................................................................... 168
Conclusion ............................................................................................................................... 176
CHAPTER SEVEN: DISCUSSION AND IMPLICATIONS ..................................................... 180
I: Limitations and Generalizability .......................................................................................... 182
II: Policy Implications and Recommendations ........................................................................ 185
III: Directions for Future Research .......................................................................................... 194
Conclusion ............................................................................................................................... 196
APPENDIX A: GROCERY PURCHASING BEHAVIOR QUESTIONNAIRE ....................... 201
APPENDIX B: GROCERY STORE EVALUATION FORM .................................................... 209
APPENDIX C: BODY COMPOSITION ANALYSIS SAMPLE ............................................... 211
APPENDIX D: STATA COMMANDS ...................................................................................... 212
Research Question II ................................................................................................................ 212
Chi-squares test (Tables 6.3, 6.4, 6.5, 6.8) ........................................................................... 212
ANOVA tests (Table 6.6) .................................................................................................... 213
t-tests (Table 6.7) ................................................................................................................. 214
Research Question III .............................................................................................................. 214
Negative Binomial (Table 6.9)............................................................................................. 214
Test 1 Histogram (Table 6.10) ............................................................................................. 216
Test 2 mean equal variance (Table 6.11) ............................................................................. 216
Test 3: Poisson Goodness of Fit (GOF) test ........................................................................ 216
Test 4: The Likelihood Ratio Test of Alpha ........................................................................ 216
Research Question IV .............................................................................................................. 216
BMI and shopping destination (Table 6.14) ........................................................................ 216
PBF and shopping destination (Table 6.15) ......................................................................... 217
Waist circumference and shopping destination (Table 6.16) ............................................... 218
BMI and Shopping Frequency (Table 6.17) ........................................................................ 218
PBF and Shopping Frequency (Table 6.18) ......................................................................... 219
Waist Circumference and Shopping Frequency (Table 6.19) .............................................. 219
BIOGRAPHY .............................................................................................................................. 221

vii
LIST OF TABLES
Table Page
Table 2.1: Household Income and Food Expenditure of Bangkok Residents……..….…23 Table 3.1: EPF’s Levels of Influence and Definitions…………………………………65
Table 4.1: Expected Signs of Variables of Interest……………………………………84
Table 5.1: Socioeconomics of Respondents and General Bangkok’s Working Population
(Census Data)………………………..…………………………………….108
Table 5.2: Shopper Group Definitions………………………………………………….111
Table 5.3: The Categorical Variables Tested using the Chi-square Test…..…………..112
Table 5.4: The variables to be tested using ANOVA ………………………………….114
Table 5.5: Variables to be Tested by Independent T-Tests…………………..……… 115
Table 5.6: Health Behavior Variables and Control Variables …………………………117
Table 5.7: Independent Variables of Interest for Negative Binomial Regression (Shopper
Group)……………………………………………………………………… 118
Table 5.8: Independent Variables of Interest for Negative Binomial Regression (Frequent
Shopper)…………………………………………………………………… 118
Table 5.9: Independent Variables (Primary Shopping Destination Choice) …………...120
Table 5.10: Independent Variables (Shopping Frequency) …..………………………..121
Table 5.11: Control Variables for OLS models (Shopper Group) ……………………122
Table 5.12: Control Variables for OLS models (Frequent Shopper) …………………..125
Table 6.1: Gender, Age, and Educational Attainment of Primary and Non-Primary
Shoppers…………………………………………………..…………….131
Table 6.2: Household Income, Residence Type, Marital Status, Family Composition and
Car Ownership of Primary and Non-Primary Shoppers…………………133
Table 6.3: Sex, Age, and Educational Attainment of Modern, Traditional, and Mixed
Shoppers (Chi-squares test)……………………………..…………..……...143
Table 6.4: Monthly Household Income and Residence Type of Modern, Traditional, and
Mixed Shoppers (Chi-squares test)…………………………….…………144
Table 6.5: Household Size and Car Ownership of Modern, Traditional, and Mixed
Shoppers (Chi-squares test)……………………………………..………...145
Table 6.6: Spending, Shopping, and Traveling Time per Trip (ANOVA)……………..146
Table 6.7: Shopping Frequency and Spending per Trip among Car Owners and Non-Car
Owners (ttest)……………………………………………………………….148
Table 6.8: Importance of Store Attributes by Shopper Groups (Pearson Chi2)……..…149

viii
Table 6.9: Negative Binomial Regression controlling for Age, Sex, and Education…..151
Table 6.10: Histograms of Health Behavior Variables (Dependent Variables)………...154
Table 6.11: Mean and Variance of Dependent Variables are not Equal……………….155
Table 6.12: Pearson’s Chi-Squares Statistics and their Significance………..……..156
Table 6.13: Results from the Likelihood Ratio Test of Alpha…………………………157
Table 6.14: OLS Results of BMI and Shopper Groups………………….……...162
Table 6.15: OLS Results of PBF and Shopper Groups…………………………………164
Table 6.16: OLS Results of WC and Shopper Groups…………………………………166
Table 6.17: OLS Results of BMI and Shopping Frequency……………………………168
Table 6.18: OLS Results of PBF and Shopping Frequency……………………………170
Table 6.19: OLS Results of WC and Shopping Frequency…….................................…172
Table 7.1: shows summary of findings……...……………………………..………….180

ix
LIST OF FIGURES
Figure Page
Figure 2.1: Food Expenses as Percentage of Total Food & Beverages Expenditure……25
Figure 5.1: Area of Study………………………………………………………………99
Figure 5.2: Area of Study as GIS Layer………………………………………………..99
Figure 6.1: Educational Attainment of Primary and Non-Primary Shoppers…………..132
Figure 6.2: Monthly Household Income of Primary and Non-Primary Shoppers……..135
Figure 6.3: Average Nearest Neighbor Distance Analysis of Traditional Markets…….136
Figure 6.4: Average Nearest Neighbor Analysis of Modern Retailers………………....138
Figure 6.5: Choropleth Map of District-Level Convenience Stores adjusted for the
Number of Total Population in the District…………………………….139

x
LIST OF ABBREVIATIONS
AAN ……………………………………………………Alternative Agricultural Network
ACFS ……………………………………….National Bureau of Agricultural Commodity
ASEAN …………………………………………..Association of Southeast Asian Nations
BIA…………………………………………………….. Bioelectrical Impedance Analysis
BMI ……………………………………………………………………. Body Mass Index
CSR ………………………………………………………Corporate Social Responsibility
EPF …………………………………………………... Ecological Perspective Framework
FASC ……………………………………………………Family and School Collaborative
FDI ……………………………………………………………..Foreign Direct Investment
GDA ………………………………………………………... Guideline for Daily Amount
LBW …………………………………………………………………... Low Birth Weight
NCD …………………………………….………………….. Non-Communicable Disease
NEMS …………………………………………..Nutrition Environment Measures Survey
NHANES …………………………….National Health and Nutrition Examination Survey
NHES ……………………………………………….National Health Examination Survey
PBF ………………………………………………………………………Percent Body Fat
RCPT ……………………………………………Royal College of Physicians of Thailand
SCT ………………………………………………………………Social Cognitive Theory
SES …………………………………………………………………Socioeconomic Status
SNOCOP ……………………………..School Network on Childhood Obesity Prevention
TBW ……………………………………………………………………Total Body Water
TCS …………………………………………………………………….Thai Cohort Study
TFC ………………………………………………………...Transnational Food Company
TRHR …………………………………………Thyrotropin-releasing Hormone Receptor
VF ……………………………………………………………………………Visceral Fat
WC ………………………………………………….……………….Waist Circumference
WHR ……………………………………………………………………..Waist-Hip Ratio

ABSTRACT
GROCERY SHOPPING DESTINATION CHOICE AND OBESITY:
AN EMPIRICAL STUDY OF URBAN POPULATION IN BANGKOK, THAILAND
Tinapa Himathongkam, PhD
George Mason University, 2016
Dissertation Director: Naoru Koizumi
The dissertation explores the effects of the food retail landscape in Thailand that has been
going through a major transformation since the late 1990s on the population’s health. The
rapid expansion of Western-format grocery outlets such as hypermarkets, supermarkets,
and convenience stores was most evident in Bangkok, the capital city, at the same time
that obesity rates have been rising. The research on the food retail industry has focused
primarily on the economic effects of Western-format grocery store expansion such as the
impacts on small-scale producers and the survival of traditional mom-and-pop stores. The
role of Western-format grocery stores in increasing the availability and desirability of
Western food products in the developing world, which has potentially significant health
impacts, has rarely been looked at. The purpose of this study is to bridge this gap in the
literature by looking at the relationship between the choice of grocery shopping
destination and obesity using measures including body mass index (BMI), percent body
fat (PBF), and waist circumference (WC). The findings suggest uneven distribution of

food outlets in Bangkok. Sociodemographic characteristics also differ by shopper groups.
Modern shoppers are significantly more likely to hold a graduate degree, live in a
condominium, and live by themselves. Traditional shoppers are likely to be in the lowest
income category, and mixed shoppers are likely to live in larger households with at least
one child under the age of 18. Grocery destination choice alone does not appear to be
associated with health behaviors, but frequent shopping does. Particularly, those who
visit convenience stores three or more times a week are significantly more likely to eat
fast foods (p<0.002), consume sweet drinks (p<0.003), consume alcohol (p<0.039), and
sit 8 or more hours a day on average (p<0.012). These undesirable health habits have not
translated into greater propensity to be obese as postulated. Surprisingly, those who
frequent traditional markets (three or more times a week) appear to have significantly
higher BMI (p<0.05) even after controlling for age, gender, education and health habits.
Policy implications, recommendations, and future research directions are discussed.

1
CHAPTER ONE: INTRODUCTION
I: Statement of the Problem
Southeast Asia is a region with distinct cultures, values, as well as body
composition features. The region is also experiencing nutrition transition, a process
whereby patterns in the human diet shifts from traditional meals that are high in fiber and
cereal to more Western diets that are high in sugar and fat (Popkin 1993). Similar
changes in nutrition and the food retail environment that took place in now-industrialized
countries over 50 years have unfolded in Southeast Asia in the last 15-20 years (Reardon
et al. 2008).
Western-style markets are replacing traditional fresh markets and people are more
exposed to processed foods. On the one hand, modern retailers increase diet diversity,
offering consumers nutrition benefits. On the other hand, modern retailers also increase
the availability of energy-dense and low nutrient foods (Hawkes 2008, Kelly et al. 2014).
What most people can agree on, however, is the supermarket revolution has led to an
increase in average caloric consumption regardless of what foods have been consumed
(Hawke 2008). In less than two decades, the estimated daily calorie intake of Thai
populations increased from 2250 kcal in 1990 to 2540 kcal in 2008. During the same
period, daily fat intake rose from 45 grams to 56 grams (FAOSTAT).

2
The much more rapid pace of modern retailing expansion in this part of the world
has raised concerns regarding the emergence of chronic diseases and the adequacy of the
region’s healthcare capacity (Aekplakorn et al. 2009). Obesity rate is rising in this part of
the world along with related non-communicable diseases (NCDs) such as hypertension
and diabetes. To exacerbate the matter, obesity, in Western standards, is not necessarily
present for an individual of Asian descent to develop conditions commonly linked to
having high body mass index (BMI). Ethnicity, it turns out, is also an important
determinant of body tissue proportions. Diabetes cases are greater among Asians than in
people of European descent of the same BMI (Park et al. 2001; McNeely and Boyko
2004). In other words, an Asian person is more likely to develop diabetes than a
Caucasian person of the same weight and height. The impact of nutrition transition is thus
expected to be more severe in this part of the world.
II: Study Objectives
The aim of this dissertation is three-fold. First, it explores the food retail
landscape of Bangkok. Second, it seeks to understand the factors influencing store choice
behavior among Bangkok grocery shoppers. Third, it investigates the relationship
between obesity and the store format of grocery destination choice. There are, thus, three
main objectives for this dissertation.
to explore the Bangkok spatial distribution of grocery stores
to examine the characteristics of those who shop at different types of grocery
stores

3
to investigate how an individual’s health behavior and weight status is related to
their grocery destination choice and shopping frequency
III: Potential Contributions and Challenges
a.) Contributions
The contributions of this dissertation include: (1) It takes the public health
perspectives on the expansion of modern food retailers in emerging economies whereas
existing literature is focused primarily on the economic challenges. This brings to the fore
the importance of the impacts on health from urbanization and change in lifestyle which
often takes the back seat to the economic perspectives. (2) It takes into account the spatial
relationship between grocery store locations and where one shops. This allows for
observation in the importance of distance to grocery stores as a determinant of destination
choice. There is a wealth of literature in this area in the developed world but none in
Thailand. (3) It focuses on the largest metropolitan area in Thailand where the
supermarket revolution is most pronounced. As such, it provides a visualization of a
potential path for growing smaller cities in the country and the Southeast Asia region. It
is hoped that this dissertation will bring forth policy implications on creating conditions
for healthy living in the still-urbanizing city of Bangkok.
b.) Challenges
Policy challenges of this study include: (1) Obesity is a multifaceted condition. The
dissertation includes some of very important contributors but leaves out others such as
the influence of the media and access to exercise facilities due to time and budget

4
constraints. (2) The study uses a convenience sample of working population from
selected industries who may be systematically different than the public at large. (3) The
scope is limited to Bangkok which is markedly different in demographic profile and level
of development than the rest of Thailand and may not be generalizable. It will, however,
be a good example for other urbanizing mega-cities in Southeast Asia.

5
CHAPTER TWO: LITERATURE REVIEW
The issue of food retail environments and obesity has attracted the attention of
researchers only in recent years with the vast majority of work being conducted on
Western populations, exploring the effects of the lack of food outlets in low-income
neighborhoods. Literature on Asian populations is almost always drawn from minorities
in Western countries who face a different set of factors than those in the developing
world. Studies on food environments in Southeast Asia are scant as the supermarket
revolution is still unfolding at the same time that diet-related diseases are on the rise. This
chapter reviews literature related to food retailing in Asia, grocery destination choice, and
the prevailing situation in Thailand.
I: Grocery Retailing and Shopping in Asia
Culture has been used in a number of disciplines to represent different concepts.
In the social sciences, culture refers to shared characteristics of members of a particular
society that include beliefs, language, cuisine, habits, morals, and everything else that
make up their way of life (McNeely 1996). Culture has undeniable influences on dietary
patterns and lifestyles of populations especially in the Southeast Asia region.
Understanding dietary and other health behaviors in cultural context can shed light on the
consequences of interactions between social, environmental and biological factors on the
prevalence of chronic diseases (Shatenstein and Ghadirian 1998).

6
Subsection 1.1 Grocery Retailing in Asia
Asia is one of the most dynamic and diverse region for grocery retailing in the
world. While there are certainly common elements among Asian markets, each country
has fairly distinct food and shopping cultures. Countries in Asia are experiencing a rise in
educational attainment, increasing wealth, urbanization, smaller families, condominium
living, and the general Westernization influence. These factors together propel the growth
and popularity of Western-format grocery stores. As consumers become more educated
and purchasing power increases, they also demand higher quality and greater variety of
products. Between 2008 and 2012, the average growth in grocery sales were double digits
at 13% though has since slowed down to about 8% (Retail Asia 2014). The number of
new players expanding into the region has also slowed, allowing existing retailers to
strengthen their presence, especially in Southeast Asia. The massive income gap in Asian
countries, nonetheless, means that traditional open-air markets still maintain a strong
presence and serve a large portion of the population, creating a bifurcated retail industry
(Kelly et al. 2014).
Despite their phenomenal proliferation, there is still room for growth for big box
stores in Asia, particularly in suburban area and smaller cities. Foreign retailers have
been trying to address the needs of diverse populations and overcome the cultural barriers
in tastes and preferences. Niche markets are also just emerging for health foods, organic
produce, supplements, and imported luxury grocery products. In addition, large chain
stores are experimenting with online retailing although it hasn’t gained much traction for
many people view grocery shopping as leisure activity and prefer to browse the stores

7
themselves. There is positive outlook for expansion, however, as Internet access reaches
wider audience and online shopping becomes more common.
While the expansion trend of modern grocery outlets in Asia mirrors that in the
West in many ways, the level of community penetration differs due to structural and
cultural disparities. There remains a lack of consensus in the literature regarding the
future of modern retailers in Asia. Each year, the number of new stores goes down but the
size of each store gets larger, emphasizing the importance of being a one-stop-shop
(Trappey and Lai 1997). The supermarket revolution happened in three waves. The first
wave occurred in the early 1990s in Latin America. The second wave, to which Thailand
belongs, took off in the late 1990s in Southeast Asia with an exception of Vietnam. The
market share of modern retailers in second-wave countries reached 30-50% by the mid-
2000s. The third wave began in the late 1990s and early 2000s and includes China,
Vietnam, India, and Russia. Countries in Africa are just starting to see the increasing
presence of modern retailers and have yet to take off (Reardon 2003, Reardon et al. 2004,
Reardon et al. 2012).
In all three waves, the progress had similar stages. Expansion starts in big cities.
The upper income populations lead the trend, followed by less wealthy populations.
Processed foods are the first to hit the supermarket shelves, then semi-processed, and
eventually fresh produce. The revolution also typically starts with pioneer domestic
supermarket chains that are later overtaken or overpowered by transnational food
companies (Ibid).

8
Many believe that modern retailers would never fully replace traditional markets
in Asia because of the non-economic significance that fresh markets have in people’s
lives as a venue for socialization and staying connected with the community (Trappey
and Lai 1997, Reardon et al. 2012; Kelly et al. 2014). People are more likely to engage in
a conversation with fellow shoppers or stallholders at traditional markets (Chenxi 2013,
Isaacs et al. 2010). Some have argued that Asians do not value convenience, variety, and
cleanliness, which are the advantages of supermarkets, as much as Westerners do. Instead,
Asians perceive traditional markets as offering fresher products at lower costs because
they do not have to bear the higher labor and rental costs (Goldman et al. 2002). This,
nonetheless, may not be the case for much longer as modern retailers have been
improving their efficiency in procurement of fresh produce by building relationship with
suppliers directly (Reardon et la. 2004, Gorton et al. 2011) and have been gaining market
share by offering similar pricing with superior food safety and hygiene than their
traditional counterparts (Minten and Reardon 2008).
Studies have also noted the structural improvements in the supply chain efficiency
of modern retailers that fueled their expansion. Supermarkets have taken advantage of
economies of scale to build their own supply networks and impose their own standards
(Reardon et al 2003, 2004, 2007). To address their disadvantage vis-à-vis traditional
markets, Western-style markets have imitated certain aspects of the traditional markets,
embedding a fresh market setup with stalls of fruits, meat, and vegetables within their
modern aisle format (Minten and Reardon 2008). Some supermarkets have live fish in
aquariums and offer butchering and fishmonger services (Gorton 2011). The growth of

9
supermarket chains in Asia has been constant over the past 2 decades with third-wave
countries such as China, India, and Vietnam showing the highest growth rate (Reardon et
al. 2012). In 2007, modern retailers make up 5% of the total food retail outlets in absolute
store number but commanded 45% of total sales in Thailand (Di 2008). They are no
longer insignificant players in the fresh fruit and vegetable markets. In Hong Kong, fresh
market’s share in fresh product sales fell from 65% in 1994-1995 to 49% in 1999-2000
(Ho 2005).
Subsection 1.2: Factors Impacting the Consumer’s Choice of Store Type
The process of replacing traditional fresh markets with Western-format grocery
stores has been incomplete in Asia even in developed countries such as Japan, Hong
Kong, and Taiwan. After over a decade since the introduction of supermarkets, traditional
markets still have a stronghold over the sale of fresh produce and meat (Cadilhon et al.
2006). Opinions differ regarding the prospects of traditional market’s survival in the face
of expanding modern grocery retailers. Some have said that, in Asia, consumers’ idea of
‘fresh’ is to be as close as possible to the live animal or plant. Therefore, traditional
markets where many animals are sold live are still the preferred destination for many
(Ibid). In Hong Kong the economy is fully developed but Western-style retailers
surprisingly still only occupy approximately 57% of the grocery sales (Li 2013). On the
other hand, some researchers have suggested that the dwindling trend of traditional
markets in some places such as Taiwan will probably continue until they cease to exist as
modern retailers grow in popularity (Trappey and Lai 1997, Agriculture and Agrifood
Canada Global Analysis Report 2013). In some regions, wet markets appear to only be

10
serving a shrinking population of older generations while younger consumers prefer
modern-format retailers such as supermarkets and hypermarkets (Trappey and Lai 1997).
In Singapore, however, advocates of traditional markets argue that shopping is a social
activity. It is easy for people to initiate a conversation with strangers in a traditional
market setting. By contrast, supermarkets do not promote community bonding the way
traditional markets do. Both types of retailers should, therefore, coexist (Chenxi 2013).
The following paragraphs describe the potential factors influencing people’s choice of
marketplace.
a.) Family Dynamics
Family dynamics has been explored with respect to grocery purchases. The
increase in female participation in the labor force has increased the demand for
convenience foods. Given that women are typically the one responsible for food
preparation, this is a big change in the family dynamics. Working wives were found to
prefer eating out or foods that require minimal preparations more so than housewives.
Housewives also reportedly feel a greater sense of responsibility over the family’s health
than do their working counterparts (Jackson et al. 1985, DeVault 1994).
Children and adolescents exert influences of varying degrees in household
decision making including during grocery shopping trips (Gaumer and Arnone 2009).
Families with children reported that getting meals outside, take-out, delivery, or eating at
a restaurant, makes life more manageable, according to the National Restaurant
Association (2009). Ready-made meals are a convenience that is increasingly available,
accessible, and affordable. These include both frozen meals and those that are prepared

11
and then packed fresh for same-day consumption. The proliferation of frozen meal
options in Bangkok have been incredible in the past few years, revolutionizing the
meaning of eating at home.
b.) Generation Gap
Age dynamics has also been explored as an influential factor. Traditional markets
shoppers tend to be older generations and predominantly female whereas modern retailers
see customers from all age and gender groups (Trappey and Lai 1997, Gorton et al. 2011,
Chenxi 2013). Younger people are more likely to accept variety and novelty (Dixon et al.
2007). Such generation gaps may also reflect the desire for the younger generations to be
informed and make their own judgment on their food choices by shopping at self-service
Western-style markets. While at supermarkets, people decide on which products to
purchase from external cues such as price, nutrition facts, and packaging, at traditional
markets, patrons rely more on stallholders’ recommendations. Traditional market
shoppers are, therefore, more dependent on others in making their food choices (Chenxi
2013).
c.) Single-person Households
One-person households are not able to take advantage of economies of scale when it
comes to purchasing perishables as they may go bad before one can finish them. They are
more likely to live in smaller spaces with little room for storage and may be more likely
to shop at neighborhood or convenience stores with few selections of healthful foods and
a large array of sweet drinks and energy dense snacks. They shop for fresh foods less
frequently because they perceive cooking for oneself as being wasteful in time and effort

12
(Fowler 2008). The trend in preference for smaller format stores is likely to continue as
lifestyle and demographic changes towards urban living, increasing time-constraint, and
smaller household sizes. In Thailand, the average household size fell from 3.3 in 2005 to
2.8 in 2012 (Retail Asia 2014). These new smaller households as well as single person
households seek convenience that fits their lifestyle. Living alone is, therefore, a possible
reason for choosing modern grocery outlets, eating fast foods and purchasing ready-to-eat
meals that are often higher in calories and less nutritious than home-cooked meals
(Buckley et al. 2007). It may also provide an additional incentive that encourages people
to eat out at restaurants among friends as a social event.
d.) Location
Access is an important determinant in selecting a grocery outlet. Traditional
markets have been part of neighborhoods but the small size of convenience stores enables
them to penetrate and spread throughout communities more easily. In Korea, Thailand,
and Indonesia, convenience stores and minimarkets have gained as much as 25% of
market share in packaged grocery sales in recent years (Retail Asia 2014). Location
appears to be more important for traditional market shoppers than modern retailer
shoppers. In Taiwan, a study found that, whereas most traditional market patrons live or
work nearby, location did not play a similarly significant role among Western-style
grocery store shoppers (Trappey and Lai 1997). The authors also showed that the four
most important factors attracting patrons to supermarkets were: 1. Good environment; 2.
Good product quality; 3. Sales promotions; and 4. Good service quality, whereas the most

13
important factors for wet market patrons were proximity to home and workplace as well
as their social nature as a place where acquaintances meet. (Ibid).
e.) Price
Existing literature consistently show that health outcomes are positively linked
with educational attainment and SES (Hampson et al. 2007; Braveman et al.2005; Adams
et al. 2002). Affordability and price of products are unsurprisingly important determinant
of grocery purchases including brands and stores they visit. This is particularly true for
poorer and often less educated households. Income, urbanization, and college education
are positively associated with shopping frequency at supermarkets (Meng et al. 2014,
Kelly et al. 2014, Banwell et al. 2013). Price has the power to alter short-term quantity
demanded of products and is an important factor of product value as perceived by
consumers. Big box retailers share similar marketing strategies aimed at enhancing
consumers’ shopping experience such as offering a wide range of products, temporary
price reduction, and other promotional campaigns. As such, traditional markets with their
lack of marketing promotion may be less appealing to bargain hunters (Kelly et al 2014,
Banwell et al. 2013).
f.) Quality and Food Safety
Another distinction between traditional and modern grocery outlet is the common
general perception that traditional markets are less hygienic than modern markets. Many
Thai consumers believe that TFCs offer higher standards for products and services at
reasonable prices (Watchravesringkan et al. 2011). Food safety has been rated as the most
important factor in consumers’ food choice (Dixon et al. 2006). Due to a lack in industry
14
standard for open-air market cleanliness and organization, some appear dirty, and
sanitation guidelines are necessary (Filiousis et al. 2009). Thailand has been a major
exporter of chicken meat and shrimp that meet stringent quality control and hygienic
standards (Sriwichailamphan 2007). Domestic availability, nonetheless, varies in quality
and cleanliness. Modern retailers, adopting Western standards, sell prepackaged products
under refrigeration. In Thailand, it has been noted that packaging has been a key driver of
the competitive environment for fast moving consumer goods (Silayoi and Speece 2004).
At traditional markets meat is sold at outdoor temperature and is often exposed to
contaminations but substantial proportion of consumers in urban cities and the majority
of consumers in rural areas are willing to overlook the lack of refrigeration and believe
that traditional markets still offer superior quality fresh foods and only purchase dry
ingredients at modern retailers (Kelly et al. 2014). In addition, the traditional sector in
certain areas has been working on improving their hygienic appearance (Ibid.). Some
local authorities have taken initiatives to improve the situation of sanitary practices. For
example, in Chiang Mai, the public health department visits stall owners every few
months to educate them on how to wash, soak, and rinse their produce thoroughly before
selling them (Isaacs et al. 2010). Physical renovations are difficult and they cause
disruption of business to stall owners and loss of income. Without reorganization,
however, these traditional markets are sure to lose their customers to modern retailers that
are becoming ever more prevalent (Ibid).

15
g.) Time Pressure
Time pressure bears a strong influence on decision making of grocery shoppers.
In the western research literature, perceived time pressure limits the effort of searching
for price and promotional information such as coupon clipping and unit price comparison
(Vermeir and Van Kenhove 2005). Similarly, many working women in Asia find
supermarket more convenient for grocery shopping as they offer greater variety of
products, both grocery and non-grocery items, than the traditional sector (Kelly et al.
2014). Younger and more educated shoppers were found to be more time-constrained and
more likely to purchase prepared meals. Time is of an essence for supermarket shoppers
more so than for wet market patrons. Those who shop at fresh markets spend more time
at the venue because they socialize with friends and acquaintances. Consumers who shop
at supermarkets are attracted by time-saving products such as processed foods, ready-to-
eat meals, and various bottled and canned beverages (Trappey and Lai 1997). Modern
retailers also advertise themselves to be one-stop shop, offering a full range of household
necessities from food, basic medications, and personal care products (Minten and
Reardon 2008).
II: Grocery Revolution in Thailand
Emerging markets or emerging economies such as Thailand receive special
attention with regard to dietary change and subsequent health implications. Significant
transformations in grocery shopping formats are clear over the past two decades whereas
similar changes occurred in the Western hemisphere over 50-80 years (Reardon and

16
Hopkins 2006). In the 1980s and early 1990s, Thailand’s average household income rose
and the problems of under-nutrition declined. With this decline, however, new problems
of diet-related chronic illnesses became visible (James et al. 2010). The change in dietary
pattern in these countries is occurring much sooner and at a much lower level of per
capita income than when now-industrialized countries experienced it.
Subsection 2.1: The Arrival of Western-Format Grocery Outlets in Bangkok
The first modern retailer in Bangkok, Thai Daimaru, opened its doors in 1964.
The Japanese department store had a food section that targeted high income customers.
The success of Daimaru attracted competitors. Central and Robinson Department Store
opened several Bangkok locations in 1970s, each with their own grocery section. The
embedded grocery stores take the form of a typical western supermarket carrying mostly
food items and many household essentials. They expanded to the suburbs in the 1980s.
Convenience stores were introduced in 1987 and quickly taking presence at gas stations,
bus stops, and office buildings. Lotus and Big C, the largest hypermarket chains, arrived
in 1994, as domestic chains before getting taken over by foreign firms (Jitpleecheep
2006). Hypermarkets in Thailand are stand-alone buildings with usually 2-3 floors that
include the grocery section resembling a supermarket as well as clothing stores,
restaurants, fast food outlets, and food courts. Some hypermarkets even include large
children playground with a bounce house and rides, a bowling alley, and a movie theater.
The rise of supermarkets in the 1990s changed Thai social, economic, and
culinary culture in significant ways. Changes in food retailing environment were slow in

17
the 1980s and early 1990s, owing in part to the Alien Business Law which requires that at
least 51% of company shares must be owned by Thai nationals. When the Asian Crisis hit
in 1997, the law was adjusted, and many foreign partners in transnational food companies
took over control and quickly expanded their presence in Thailand. The Alien Business
Operations Act of 1999 allowed foreign investors to conduct business in all kinds of
retailing and wholesaling that are worth over 100 billion baht in capital. The act also
changed the law so that aliens can hold the majority of company shares. They can also
buy land, condominiums and rent property, the rights previously restricted to Thai
nationals (Tosonboon 2003). Waves of new foreign direct investments then followed the
decline of the local distribution system (Shannon 2009). The main companies in this
movement were Tesco (UK), Carrefour (France), and Big C (France) (Banwell et al.
2013). In 2010, Big C acquired Carrefour (Groupe Casino 2010). In less than 2 years,
these retailers were owned by foreign investors (Tosonboon 2003).
The Alien Business Operations Act was just one reason for the influx of FDI into
retailing. Strong market potential and the absence of strong local competitors also
attracted these large transnational food companies (TFCs). TFCs were facing saturated
market at home and the demands for Western products in Thailand were increasing with
the rising income. These combined push and pull forces led to an explosion of Western-
format grocery outlets. In the early 1990s, while mom-and-pop stores were the primary
food retail outlet numbering over 200,000 stores, there were reportedly fewer than 50
supermarkets, and only a single hypermarket in the city (Smith and Mandhachitara 2000).
The number of supermarkets and hypermarkets increased almost fourfold from 110 in

18
1997 to 391 in 2007 while convenience stores increased six fold during the same period
(Shannon 2009). Hypermarkets alone accounted for over 60 percent of food sales in
Bangkok in 2008 (Shannon and Mandhachitara 2008). By the end of March 2011, the
number of modern retail outlets had increased from 1,429 stores in 1999 to 10,871
(Pratruangkrai 2011). A recent estimate indicates that modern retailers are commanding
as much as 70% of the market share (Global Agricultural Information Network 2013).
The rapid expansion of big box retailers has raised concerns over the eminent threats to
the existence of traditional fresh markets and mom-and-pop stores which, local trade
groups argue, are integral to Thailand’s unique grassroots culture (Crispin 2008).
As competition grows and zoning regulations become stricter, retailing giants
start exploring smaller store sizes because they are faster and cheaper to set up. Tesco
introduced Lotus Express in 2001 and Big C introduced Mini Big C in 2007. These stores
are between hypermarkets and convenience stores, averaging between 4000 m2 to 6000
m2 while hypermarkets are upwards of 8500 m2 and convenience stores are around 80 m2.
Other competitors are also catching up (Crowley 2014). Among modern retailers, urban
shoppers appear to favor hypermarkets and convenience stores. One report indicated over
half of Bangkok dwellers shop primarily at hypermarkets and over 85% visit convenience
stores regularly several times a week (Di 2008). Meanwhile, supermarkets are losing their
share in the market to larger and smaller store formats that better meet the needs of urban
residents (Ibid.). The latest development in the food retailing business is the movement
towards online shopping and home delivery. Tesco Lotus recently implemented Content
Acceleration in order to speed up their websites and improve online shopping experiences

19
for their customers in emerging markets including China, Thailand, and Malaysia
(Crowley 2014).
The growth of the modern retailing sector provides greater access to low-nutrient
energy-dense foods. Western-style markets are replacing traditional fresh markets and are
turning towards greater consumption of processed foods (Dixon et al. 2006). In less than
two decades, the estimated daily calorie intake of Thai populations increased from 2250
kcal in 1990 to 2540 kcal in 2008. During the same period, daily fat intake rose from 45
grams to 56 grams (FAOSTAT). The Thai population is being increasingly exposed to
obesogenic environment. A study found that urban residence is linked to an increased risk
of childhood obesity (Firestone et al. 2011). Children living in urban settings are typically
wealthier than their rural counterparts and they are more exposed to media exposure and
Western style fast food outlets (Ibid.).
Although Western-style markets are quickly becoming the preferred shopping
venues in Bangkok, in provincial cities, traditional markets still maintain a level of
popularity (Isaacs et al. 2010). Ethnographic investigations were carried out in Chiang
Mai, a city in the north of Thailand, to understand people’s choice in shopping venues. In
this much smaller city of less than one million, compared with Bangkok’s population of
over 8 million, the social circle is also much smaller. Here, traditional markets act as
more than just a place to shop but also double as a place to socialize. Sellers are usually
owners of the stores who recognize their frequent buyers and greet them in personal
manner, even asking about the wellbeing of their family members. The same people who
shop at traditional markets, however, also shop at Western style markets due to

20
convenience, cleanliness and, to some people, the perceived superior quality of products
(Ibid.). In addition, the people who frequent supermarkets for packaged foods are
significantly younger (Gorton et al. 2011). Such findings suggest that traditional markets
may only be holding on in close-knit societies for social reasons among older generations.
Subsection 2.2: Major Grocery Retailers
Traditional retailers do not operate in franchise as do modern retailers. The
market or store space varies widely as well as the organization and cleanliness. They are,
however, generally open-air in nature. Modern retailers adhere to corporate quality
standards and store format. The following is a list with description of major players in the
modern retailing market in Bangkok.
a.) Big C
Big C is a retailer chain owned by Groupe Casino of France. Big C’s presence in
Thailand is primarily in the form of hypermarkets. In 2010, Big C acquired Carrefour,
another French hypermarket chain and became Tesco Lotus’ main competitor. As of May
2014, there are 121 branches, 49 of which are located in Bangkok. In 2007, as Big C tries
to capture market share in the provincial areas, they have introduced small convenience
store format that are located closer to communities called Mini Big C (Big C company
website http://www.bigc.co.th).
b.) Tesco Lotus
Tesco Lotus, a UK hypermarket chain, is the biggest player and has been most
aggressive in expanding its market share. They offer the most varied store types including

21
in, receding size order, Extra, Hypermarket, Compact Hyper, Supermarket, and Express.
Lotus Extra, Hypermarket, and Compact Hyper offer both food and non-food products
and are located in major cities and communities. The Supermarket and Express formats
serve smaller communities and offers primarily fresh foods and groceries. There are over
1,700 Lotus store outlets and 5 distribution centers currently in operation. The newest
distribution center was opened in May 2014 in Khon Kaen, the first center outside of the
central region of Thailand. Tesco Lotus introduced online shopping in April 2013 and is
now in the process of improving the web loading time in order to improve service to their
e-business customer base. The chain also advertises itself as being socially and
environmentally conscious through their corporate social responsibility (CSR) work. It
makes multi-million baht donations annually to various charities in Thailand and as
emergency response fund in areas hit by natural disasters (Tesco Lotus website).
c.) Tops
Tops, originally part of the US-based Tops Markets LLC, is now managed by a
local company, Central Retail Corporation. Tops is the leader in the supermarket format,
operating 139 stores in Thailand, including 87 stores in Bangkok and 52 stores in the
provinces. Most Tops outlets are located within a department store while a smaller
number are stand-alone supermarkets.
d.) Seven-Eleven
Seven-Eleven is an international franchise, headquartered in Japan. It is the world’s
largest convenience store franchiser with over 50,000 outlets. Thailand is its 3rd largest
market after Japan and the US. There are over 7,000 stores in Thailand, half of which are

22
in Bangkok. Seven-Eleven also operates as a place where people can pay their utility bills
and put money on their prepaid mobile phones. The primary purpose of convenience
stores is, of course, convenience. The selections of products are, therefore, limited.
Subsection 2.3: Grocery Shopping Behavior of Bangkok Residents
A study examining Bangkok dwellers’ attitudes towards hypermarkets and mom-
and-pop shops found that respondents were more satisfied with the product quality and
the prices at hypermarkets than at mom-and-pop shops. They were also more satisfied
with the availability of parking spaces, cleanliness, quality of facility such as toilets, as
well as organization of products at hypermarkets. The strength for mom-and-pop shops,
the author found, was in customer relationship due to its small size and its relationship
with the community (Di 2008).
Modern-format grocery stores offer ready-made meals, both fresh and frozen, that
have been gaining popularity as more women join the labor force and as young people
migrate to cities for job opportunities and become a single-person household. They seek
convenience and foods that require less preparation time. Small food stalls sell precooked
meals in plastic bags are popular among households where the mother works outside of
home (Banwell et al. 2013). Table 2.1 shows average household income and food
expenditure of Bangkok residents in absolute term from year 2000 to 2011 and their
annual percentage change. Prepared Food Eaten at Home is the only category that logged
a constant increase throughout the period even in 2011 when the big flood hit the city.
That year, expenditure in other categories went down as people saved to repair the

23
damages on their homes from the devastating flood that began in July 2011 and in some
areas persisted until January 2012.

24
As Table 2.1 indicates, people do not always eat out but many often purchase
prepared food to be eaten at home. Figure 2.1 shows expenses on foods prepared at home
and ready meals (eaten at home and eaten away from home) as percentage of total food &
beverages expenditure. Expenses on prepared foods always exceeded those on foods
prepared at home. Of the expenses on prepared foods, more was spent on eating out than
eating at home. This does not suggest higher frequency of eating prepared food away
from home than at home as dining out is typically more expensive. In 2011, severe
flooding during the monsoon season in Thailand destroyed homes and businesses, with
estimated damage of 45.7 USD. Seventy-five of Thailand’s 77 provinces declared flood
disaster zones. That year, the graph shows people spending a greater proportion of their
budget on raw ingredients for home food preparation. It was also the only year in which
expenses on prepared foods eaten at home exceeded those on dining out. This may stem
from several factors including store closing, difficulty in transporting, and people saving
money to repair water damages in their homes.

25
Source: National Statistical Office of Thailand http://service.nso.go.th/
Figure 2.1: Food Expenses as Percentage of Total Food & Beverages Expenditure
46.0243.56
42.0238.12
38.4
45.53
33.6
53.98
56.44
58
55.33
57.4
49.39
16.3518.92
20.87 21.2522
27.54 26.53
37.63 37.5237.13
34.0835.4
21.85
35.43
10
15
20
25
30
35
40
45
50
55
60
2000 2002 2004 2006 2009 2011 2013
foods prepared athome
Prepared Food
prepared foodeaten at home
prepared foodeaten away fromhome

26
III: Thailand’s Food and Health Policy
Thailand has been successful in a number of health initiatives including those to
reduce the prevalence of anemia in pregnant women in 1970-1990s (Winichagoon 2002),
HIV/AIDS incidence in the 1990s (Nelson et al. 1996), and using tax from alcohol and
tobacco to fund health promotion activities, primarily through the Thai Health Promotion
Foundation. Several anti-smoking policies were implemented between 1991 and 2006
that resulted in 25% reduction in prevalence of smoking (Levy et al. 2008). In the 1980s
to mid-1990s, community-based nutrition program successfully reduced malnutrition and
micronutrient deficiency in children and women (Winichagoon 2013). Obesity is a
relatively new problem in Thailand, starting to emerge as the country is still battling the
issue of under-nutrition (Pawloski et al. 2011). The macro-economic trends in developing
countries are such that obesity rate is predicted to continue to rise, along with NCDs,
unless governments introduce major policies to redirect the lifestyle path that comes with
globalization (Prentice 2006). To further complicate the matter, the nutrition transition is
happening so rapidly that coexistence of obesity and malnutrition among family members
within the same household is not uncommon, as with other developing countries
(Prentice 2006). Efforts by the Thai government are there but whether they are effective
and sufficient remain to be seen.
There are undeniably many facets contributing to the rise in population body
weight globally. Researchers have been trying to find the primary culprit. In developed
countries, there is evidence that increased food energy supply is a major driver of the
obesity epidemic (Vandevijvere et al. 2015) while decreased physical activity (from

27
urbanization and change in lifestyle) may be a more important factor for developing
regions such as China (Ng et al. 2010). It can be expected that developing countries, too,
will see an excess in food energy supply from heavily processed foods available at
cheaper prices as the economy advances and food distribution systems progress. In
anticipation of such changes, policy efforts should aim at creating healthy eating habits
and environments that are conducive to engagement in physical activities. Once an
economy is fully developed, as in the United States, an increase in physical activity level
appears to have only small influence on obesity prevalence (Dwyer-Lindgren et al. 2013).
The expansion of Western-format grocery stores in Thailand in the last 15 years
parallels the rise in obesity rates and reflects the modernization of the food retail and
distribution sectors as part of globalization. Reardon et al. (2003) described the
supermarket product introduction as a two-stage process. In the first stage, supermarkets
carry mainly dry ingredients, processed and packaged foods while in the second stage,
fresh fruits and produce are introduced. In terms of customers, too, there is a two-stage
process. Western-format markets initially target high-income consumers, selling products
of higher quality standards and higher prices than traditional markets. Later when they
gain greater market share, they expand their outlets, product selections, as well as lower
prices from economy of scale, and develop marketing strategies to attract lower-income
consumers (Hagen 2002). As the array of products expands and highly processed foods
become part of everyday life, health concerns arise and a number of programs and
policies have been initiated.

28
Starting in 1991, the Ministry of Public Health has been conducting a periodic
National Health Examination Survey (NHES) to monitor the prevalence of life style
diseases and risk factors such as diabetes, hypertension, obesity, smoking, physical
activity, and fruit and vegetable intake. The fifth and latest survey was conducted in 2013.
The results of the NHES are used by government agencies to guide the national health,
economic and social development plans, among others (Tangcharoensathien et al. 2014).
The Universal Health Coverage Scheme, implemented in 2002, increased access to
healthcare, lowers the level of unmet health needs and provides financial risk protection
(Ibid.). Initiatives to encourage healthy lifestyle and promote the prevention of chronic
diseases are taking place through various channels but lack coordination and concerted
efforts among stakeholders. Lifestyle modification programs also lack proper monitoring
and evaluation (Chavasit et al. 2013).
a.) Food Labeling
Food labeling policy in Thailand was implemented in 1998 on a voluntary basis
for most food except milk, milk products, and those that claim certain nutrients
(Whitehead 2015a). It was therefore a marketing tool to enhance the image of some
products rather than an educational tool. A number of food scares in the 1990s
diminished consumer’s confidence and the presence of food labeling gives a sense of
security, a trend observed in other Asian countries as well. Recently, the Taiwanese
government announced their plan to address the need for a food system that would track
the entire supply chain after a series of high-profile scandals in 2014 (Ibid).

29
According to a recent study by TNS market research institute, Asian consumers
are much more likely to check nutrition label than Europeans and Americans. While 64%
of American and European survey respondents reported reading nutrition labels when
shopping, significantly greater proportion, 74%, of consumers in China, Indonesia and
Thailand do so (Whitehead 2015c). Nutrition label studies show that people living with
lifestyle diseases such as diabetes and hypertension learn to use food labels to make
healthier food purchases, but while they avoid or limit the intake of certain ingredients,
they may be neglecting other aspects of diet that contributes to holistic health (Lippa and
Klein 2008; Lane 2014). For instance, some people are careful about their fat intake by
selecting low-fat but high sugar or low-sugar but high sodium food items. In addition,
some studies reported that the format was too complicated for the general population to
understand. A similar concept of guideline for daily amounts (GDA) was also
implemented on a voluntary basis except for snacks. It was impractical for a variety of
foods since the calculations are not based on serving portion but on the entire package
which could be large or small. Academics and health policy professionals pushed for the
utilization of the traffic light model to categorize healthy and unhealthy foods based on
fat, sugar, and sodium contents. Naturally, the idea faced strong opposition from the food
industry (Chavasit et al. 2013).
Labeling for fresh produce, especially vegetables, is a different story. The
industry is capitalizing on the increase in income and an increasing concern for food
safety. In the early 1990s as the Thai economy was swiftly developing, the heavy use of
pesticides in farm produce that had helped the growth of agricultural exports in the 1960s

30
and 1970s became a serious health concern among more educated consumers (Posri et al.
2007). The import of pesticides more than doubled between 1987 and 1996 (Thapinta and
Hudak 2000). Inspections by the Ministry of Public Health showed Thai farmers
overusing highly toxic chemicals that are considered hazardous by the WHO to improve
the agricultural output and appearance. Vegetables, in particular, showed the greatest
pesticide residue limit violations based on samples collected between 1994 and 2001
(Chadbunchachai 2005).
Following a series of scandals, both public and private movements started to
promote certified “safe” vegetables, guaranteed pesticide residue within legal limits
(Posri et al. 2007). In 2004, the National Bureau of Agricultural Commodity and Food
Standards (ACFS) rolled out its plan for food production quality control throughout the
food chain dubbed “From Farm to Table” policy. A year later, it introduced a voluntary
accreditation procedure called “Q Mark” for fresh produce that are able to demonstrate
safe production and processing with traceability and product liability. Q Marks come in
two colors, green and gold. Green labels indicate low-pesticide, or safe, produce. Gold
labels indicate premium produce such as organic products that are free from pesticides as
well as other chemical inputs such as synthetic fertilizers. The Ministry of Public Health,
the Department of Agriculture, and other private certification bodies also set their own
standards and assign labels to various produce that pass their safety requirements
(Roitner-Schobesberger et al. 2008).
As the economy advances, consumers are more educated, more selective and
continuously look for better alternatives. Although farmers were first reluctant to modify

31
their farming methods and seek certification, unsure of the added value of the labels,
several surveys conducted in Bangkok as well as in the provinces show that Thai
consumers are willing to pay the premium for these low-pesticide and organic produce
(Posri et al. 2007, Roitner-Schobesberger er al. 2008, Wongprawmas et al. 2014). Clean
food consumption and labeling is another trend that has been around for several years.
More Asian consumers, 74%, pay attention to the presence of artificial coloring and
preservatives in their purchasing decision than the global average of 60% (Food News
International Team 2015). Despite the enthusiasm, however, few people understand what
the labels stand for such as the criteria used for evaluation and the responsible
organization. The presence of the labels simply gives them greater confidence for the
safety, in addition to the mandatory regulation, of the products they are purchasing
(Roitner-Schobesberger 2008, Wongprawmas et al. 2014).
Efforts are being made to improve the understanding of and outlets for organic
produce among Thai consumers. The Alternative Agriculture Network (AAN) is a
network of organic farmers with strongest presence in the Northeast region. The AAN
has been working with the Thai Health Promotion Foundation (ThaiHealth), an
independent government agency, to educate children on organic farming and to create
outlets for organic farmers to sell their produce. The designated Green Markets are
farmer’s markets that operate regularly at various times in various locations, selling local
organic produce. These markets are held mostly in five provinces outside of Bangkok.
32
b.) Food Outlet Accreditation
In a similar manner to food products, food outlets may also seek certification. The
Bureau of Food and Water Sanitation under the Ministry of Public Health has evaluation
procedure with Key Performance Indicators for traditional retailers. Those who perform
well receive a Healthy Market seal. The assessment on environmental health, food safety,
and consumer protection is said to be carried out every 6 months by district health
authorities. However, 2011 is the latest year for which data is publicly available. In that
year, only 150 markets were evaluated, of which 74 markets did not pass. Of the markets
that passed the evaluation, 25 received “good” status and 3 received “excellent” status
(Bureau of Food and Water Sanitation 2015).
The ACFS also awards Q Mark accreditation to qualifying food stores. Major
hypermarket and supermarket chains including Tesco Lotus, Big C, and Tops have all
received the accreditation. For fresh markets, only 34 markets out of over 290 are
certified. Additionally, because market stalls are separately owned, the government-
backed Q Mark label is displayed only on individual stalls that pass the inspection
making it difficult for new customers who value the accreditation to select a fresh market
over a modern retailer. All restaurants, food stores and stalls must apply for renewal
every 3 years (ACFS 2015). Thailand also serves as a coordinator of the ASEAN Food
Safety Network (AFSN), working closely with Member States on addressing diet-related
health issues and disseminating food safety regulations and requirements (AFSN 2015).

33
c.) Food Advertisements
Children and adults worldwide are exposed to a large amount of food
advertisements, most of them are non-staple or snack foods including fast foods,
chocolate and confectionery, dairy products, and high-sugar, high-fat, or high-salt sauces
and spreads (Lobstein and Dibb 2005, Kelly et al. 2010, Harris et al. 2009, Ng et al.
2014). An experimental study suggests that food advertising increases consumption of
unhealthy foods in children (Harris et al. 2009, Ng et al. 2014) and both healthy and
unhealthy foods in adults (Harris et al. 2009). In developing countries, the potential
negative influence on children’s diets from TV advertising is amplified by the lack of
knowledge and proper regulations (Ng et al. 2014).
Advertising law and regulations are fragmented in Thailand. Several agencies are
responsible for approving advertising materials including the Office of the Consumer
Protection Board, the Directing Board for Broadcast Division, the Food and Drug
Administration and the Office of Alcoholic Beverage Control at the Department of
Disease Control, Ministry of Public Health. The focus appears to be on truthful and non-
exaggerated advertising for the purpose of food safety. Exaggerated advertising may
include bigger and more appealing McDonald’s burgers than the actual products. Alcohol
advertising is governed by the Alcoholic Beverage Control Act and tobacco advertising
by the Tobacco Product Control Act. With regard to advertising unhealthy foods to
children, however, there is simply a voluntary agreement by large food companies such
as Coca-Cola, Nestle, and Kellogg. Signed in 2008, these transnational food giants
committed to “not advertise food and beverage products to children under the age of 12

34
in Thailand unless the products meet specified nutritional criteria” in support of the
governments’ aim to promote healthy lifestyles (Thai Pledge 2008). In addition to being
voluntary and self-monitoring, specific commitments by each of the members and the
nutrition criteria are not published. The Advertising Association of Thailand has
guidelines for commercials and promotional materials targeting children, but it is unclear
how they are being enforced (AAT 2015).
At the same time, the advertising industry in Thailand is highly competitive and
considered one of the most vibrant in the region with double digit growth in revenues for
many years (Hawkes 2006). Regulations are poor and trade openness allows numerous
foreign brands into the country, encouraging fierce marketing campaigns to promote
products and brand loyalty.
d.) Taxes and Subsidies
Imposing taxes on unhealthy foods and subsidizing healthy ones have been
suggested as appropriate approach to encouraging healthy eating habits. Many developed
countries such as France have introduced tax on sugary drinks, believing it would curb
the level of sugar consumption and reduce incidents of diabetes and other lifestyle
diseases. Although evidence for the effectiveness of such policy is lacking, it has not
been ruled out and has been gaining support in the UK where the Children’s Food
Campaign has been advocating a 20% tax on sugary drinks that would go toward
Children’s Health Fund. Such tax could reportedly save the UK up to £15 million in a
year in direct healthcare costs (Bosely 2015).

35
A recent study shows that the impact of sugar-sweetened beverages on chronic
diseases vary widely between populations, but 71% of sugar-sweetened beverages (SSB)-
related deaths occur in middle-income countries, many in Latin America but also in Asia
like China and Thailand (Singh et al. 2015). Over 20% of adults living in Beijing are
now identified as clinically obese, and the trend is rising outside the capital as well. The
national Health and Family Planning Commission reported that the adult obesity rate was
11.9% in 2012, a 4.8% increase from 10 years ago in 2002 (Whitehead 2015c). Despite
this rapid increase, some have argued that the population proportion that stand to benefit
from SSB tax is too small (lower than 20%) to warrant the policy as the evidence for its
effectiveness is still lacking and it may provoke negative feedbacks from the beverage
industry and the general public (Jou and Techakehakij 2012).
The intention behind what kinds of non-alcoholic beverages are taxed and at what
rates in Thailand is unclear. In developed countries, SSB taxes reflect the potential health
risks. In developing countries, the same taxes may be imposed for their “luxury” nature.
Literature is lacking with regard to what policy rationale the Thai government is using to
guide their product selection and tax rate setting (Preece 2012). The effective rates are
highest for soda water, which has no sugar, at 25%, 20% for carbonated soft drinks but
syrups, ready-to-drink tea and coffee, and sports drinks are exempt. Sale growth has been
highest for ready-to-drink tea, reflecting the rising trend for bottled green tea which
contain about 9-10% sugar (Ibid).

36
e.) Obesity and NCD Prevention Programs
Programs and policies aimed at reducing obesity are recent developments. The
Health Plan of the Ministry of Public Health and the National Economic and Social
Development Plan of Thailand (2002-2006) stated a goal of 60% participation rate in
sports and exercise programs (Banchonhattakit et al. 2009). The “Thai People Have Flat
Belly” campaign, led by the Royal College of Physicians of Thailand in 2006, created a
network of stakeholders in both the public and private sectors at the national as well as
local levels. It received much media attention from the involvement of high profile
politicians. The campaign raised awareness in obesity self-monitoring using waist
circumference method. The 3E concept including Eating, Emotion, and Exercise was
used to educate people about weight reduction and maintenance. Demonstrations and
classes promote inexpensive but effective exercise tools and exercises that can be done at
home or at a work desk (RCPT 2011). Thai Health, a government agency, has been using
social marketing to provide various education tool clips on their website for tech-savvy
individuals. Despite the vibrancy in activities, there is, to date, no reports of measurable
outcomes.
A diabetes education prevention program was implemented for 35 community
healthcare workers in Chiang Mai province, Thailand (Sranacharoenpong et al. 2009).
The program was culturally tailored based on formative research. The course consisted of
8 in-person classes and 8 online sessions and included problem-based learning,
discussion, reflection, community-based application, self-evaluation, and online support.
Assessment using a pre-post knowledge test shows improvement in knowledge of

37
diabetes and NCD prevention in general. The program was well-received and participants
reported that activities were fun and information relevant. Authors suggested ongoing
access to web-based materials and expert support to sustain the gains (Ibid).
Nationally, there have been several initiatives to address obesity and related
NCDs, but implementation has been intermittent and their impacts have not been
measured. The food-based dietary guidelines were developed in 1996 recommending
proper food group combination and portions for one’s age. The guidelines also
recommend avoiding sweet and salty foods while encouraging clean and safe food. The
original charts were not effective because portions were measured in weight. Later they
were adjusted to reflect familiar tools and utensils such as cups and tablespoons. These
became more useful for dietitians and nutritionists in communicating with target
populations. There was a host of activities that utilized this concept such as the Sweet
Enough Campaign Network to lower children’s sugar consumption, the school lunch
program, the elderly menu development, and nutrition education training for school staff
and administrators (Sirichakwal and Sranacharoenpong 2008). The Ministry of Public
Health launched a campaign to promote eating ‘half fruits and vegetables and half of
others’ in 2005. The concept was popular for its simplicity and practicality but the
campaign died in 2006 when it ran out of funding (Chavasit et al. 2013).
The Thai National Health Assembly is fully aware of the grave consequences of
nutrition-related NCDs on the economy should no action be taken to curb the increasing
prevalence. The Assembly passed a resolution for the management of overweight and
obesity in 2009. The government established the National Food Committee in 2010

38
involving several subcommittees, task forces, and working groups that work together to
pursue exercise, healthy diet, and educational campaigns as well as establish dietary
guidelines. The visible enthusiasm is a positive sign but obesity-related health programs
in the past have been fragmented and inconsistent. Implementations have depended on
the availability of funding and at the mercy of the political party in power (Chavasit et al.
2013). Finally, there appears to be a lack of evaluation mechanism for short-term and
long-term effectiveness (Pawloski et al. 2011).
f.) School-based Programs
Children spend significant amount of time in school. Administrators play an
important role in creating food environment that can shape students’ life-long eating
habits through lunch programs and availability of snacks in school. Early nutrition has
also been shown to influence the development of obesity and chronic diseases later in life
(Winichagoon 2013). Schools are, therefore, a natural site to implement various nutrition
programs and policies, but their effectiveness has rarely been evaluated. A systematic
review of school-based nutrition policy evaluations worldwide only included studies in
the US and Europe. The review found some evidence for impacts of school policies
including nutrition guidelines and price interventions on creating healthy food
environment and improving students’ diet quality but little can be said of their impacts on
BMI (Jaime and Lock 2009).
Similarly, in Thailand, several school-based programs are promising but lack
evidence for long-term effectiveness. The School Network on Childhood Obesity
Prevention (SNOCOP) was an 8 month program aimed at empowering school

39
administrators, teachers, parents, and community leaders in Saraburi province to promote
healthy diet, enhance physical activities, and improve school lunch programs for primary
school students. Six schools, and a total of 195 students, participated. Results showed
improved diets, knowledge, attitude, and intention towards leading a healthy lifestyle
among intervention schools. Similar results were not observed in the control group.
Though potentially effective, the authors conceded that the program duration was too
short to measure effects on change in obesity prevalence (Banchonhattakit et al. 2009).
The Family and School Collaborative (FASC) program in Chiang Mai aimed to promote
healthy diets and exercise (Chotibang et al. 2013). The program involved 110
stakeholders such as teachers, parents, and cafeteria staff, coming together in
participatory workshops and discussions to establish school policies and guidelines for
obesity prevention activities such as raising awareness and limiting snack sale and sugary
drink consumption. The experiment achieved a level of success in laying out school
policies, but concrete changes in policy implementation and subsequent behavior
modification are yet to be seen. The program is also extremely localized, only
implemented in one school (Ibid).
Social networking strategy has been successful in lowering smoking uptake rates
by adolescents (Valente et al. 2003) and prevention drug abuse and drop outs in many
countries (Eggert et al. 1994). The same concept, used at the school-level as opposed to
the individual-level, proved ineffective in a Thai primary school setting. In school
settings, peer leaders may be nominated to discuss targeted issues and groups share
stories and progress. A study of 107 schools in Saraburi province indicated that only 42%

40
of the schools were connected to a social network. Of those, more than half (60%) did not
utilize the network regularly. Forty percent of the schools organized activities such as
educational meetings and sports events but did not cooperate with other schools. School
networks have not expanded social contacts for facilitated exchange of ideas and support
between schools (Banchonhattakit et al. 2009).
Conclusion
Thailand has always had liberal FDI policies allowing influx of foreign food
companies, leading up to the current supermarket revolution. Many important factors
affect one’s shopping destination choice. Meanwhile, the growing economy increases
people’s purchasing power and options for grocery outlets. Grocery shopping behavior of
Bangkok populations is undergoing a transition at the same time that NCDs are becoming
a concern. While Thailand has had notable successful health campaigns in the past, the
fight against obesity may prove more difficult as it requires concerted and sustained
efforts from authorities in diverse fields. The biggest challenges may be to ensure
continuous funding for programs that are in place and to establish a monitoring and
evaluation system.

41
REFERENCES
ACFSa National Bureau of Agricultural Commodity and Food Standards. 2015. “Q Mark
Certification Procedure for Agricultural Products and Food Outlets หลกเกณฑเงอนไข
การตรวจรบรองสถานทจ าหนายสนคาเกษตรและอาหารคณภาพภายใตเครองหมาย Q.” Accessed July 28 2015.
http://www.acfs.go.th/qmark/qshop/download/regulations.pdf.
ACFSb National Bureau of Agricultural Commodity and Food Standards. 2015. “Healthy
Market Handbook.” Accessed July 28 2015.
http://foodsan.anamai.moph.go.th/main.php?filename=market
Aekplakorn, W., and L. Mo-suwan. 2009. “Prevalence of Obesity in Thailand.” Obesity
Reviews 10 (6): 589–592. doi:10.1111/j.1467-789X.2009.00626.x.
Agriculture and Agri-Food Canada. 2013. “Grocery Retail Trends in Taiwan.” Ottawa,
Canada. http://www5.agr.gc.ca/resources/prod/Internet-Internet/MISB-
DGSIM/ATS-SEA/PDF/6425-eng.pdf.
Banchonhattakit, Pannee, Chanuantong Tanasugarn, Mandhana Pradipasen, Kathleen R.
Miner, and Dechavudh Nityasuddhi. 2009. “Effectiveness of School Network for
Childhood Obesity Prevention (SNOCOP) in Primary Schools of Saraburi Province,
Thailand.” Southeast Asian Journal of Tropical Medicine and Public Health 40
(July).

42
Banwell, Cathy, Jane Dixon, Sam-Ang Seubsman, S Pangsap, Matthew Kelly, and
Adrian Sleigh. 2013. “Evolving Food Retail Environments in Thailand and
Implications for the Health and Nutrition Transition.” Public Health Nutrition 16
(04): 608–15. doi:10.1017/S1368980012004223.
Bosely, Sarah. 2015. “Tax on Sugary Drinks Could Save NHS £15m a Year, Slaims
Study.” The Guardian, March 11.
http://www.theguardian.com/business/2015/mar/12/tax-sugary-drinks-nhs-child-
health.
Braveman PA, Cubbin C, Egerter S, and et al. 2005. “Socioeconomic Status in Health
Research: One Size Does Not Fit All.” JAMA 294 (22): 2879–88.
doi:10.1001/jama.294.22.2879.
Buckley, Marie, Cathal Cowan, and Mary McCarthy. 2007. “The Convenience Food
Market in Great Britain: Convenience Food Lifestyle (CFL) Segments.” Appetite 49
(3): 600–617. doi:10.1016/j.appet.2007.03.226.
Bureau of Food and Water Sanitation. 2015. “ส านกสขาภบาลอาหารและน า : Bureau of Food and
Water Sanitation.” http://foodsan.anamai.moph.go.th/main.php?filename=market.
Cadilhon, Jean-Joseph, Paule Moustier, Nigel D. Poole, Phan Thi Giac Tam, and Andrew
P. Fearne. 2006. “Traditional vs. Modern Food Systems? Insights from Vegetable
Supply Chains to Ho Chi Minh City (Vietnam).” Development Policy Review 24 (1):
31–49. doi:10.1111/j.1467-7679.2006.00312.x.
Chadbunchachai, Supatra. 2005. “The Safety from Toxic Chemicals in Vegetables
Project.” In . Bangkok: Institute of Nutrition, Mahidol University.

43
Chavasit, Visith, Vijj Kasemsup, and Kraisid Tontisirin. 2013. “Thailand Conquered
Undernutrition Very Successfully but Has Not Slowed Obesity.” Obesity Reviews,
n/a – n/a. doi:10.1111/obr.12091.
Chenxi, Chelsea Zheng. 2013. “Relevance of Traditional Wet Markets, as a Communal
Space That Promotes Community Bonding, in Singapore’s Public Housing Estates. |
Asian Urban Epicenters.” May. http://www.asianurbanepicenters.com/?p=1734.
Chotibang, Jutamas, Warunee Fongkaew, Ladda Mo-suwan, Janet C. Meininger, and
Pimpaporn Klunklin. 2013. “Development of a Family and School Collaborative
(FASC) Program to Promote Healthy Eating and Physical Activity among School-
Age Children.” Pacific Rim International Journal of Nursing Research 13 (2): 133–
47.
Crispin, Shawn. 2014. “Asia Times Online :: Southeast Asia News and Business from
Indonesia, Philippines, Thailand, Malaysia and Vietnam.” Accessed May 1.
http://www.atimes.com/atimes/Southeast_Asia/JE03Ae02.html.
Crowley, Amy-jo. 2014. “Tesco Speeds up Online Shopping Experience in Asia by 70%
- Computer Business Review.” Accessed May 5.
http://www.cbronline.com/news/tech/software/servicemanagement/tesco-speeds-up-
online-shopping-experience-in-asia-by-70-4255295.
DeVault, Marjorie L. 1994. Feeding the Family: The Social Organization of Caring as
Gendered Work. Reprint edition. Chicago: University of Chicago Press.
Di, Awng. 2008. “Consumer Perceptions Toward Retail Stores Comparing Between
Superstores and Family-Run Stores In Bangkok.” The Thesis of Business

44
Administration in Management School of Management, Shinawatra University.
http://dspace.siu.ac.th/bitstream/1532/270/1/SIUTHESOM-MBA-2007-04.pdf.
Dixon, Jane, Cathy Banwell, Sam-ang Seubman, Wundee Kanponai, Sharon Friel, and
Robert MacLennan. 2007. “Dietary Diversity in Khon Kaen, Thailand, 1988-2006.”
International Journal of Epidemiology 36: 518–21.
Dixon, Jane M., Sarah J. Hinde, and Cathy L. Banwell. 2006. “Obesity, Convenience and
‘phood.’” British Food Journal 108 (8): 634–45. doi:10.1108/00070700610682328.
Dwyer-Lindgren, Laura, Greg Freedman, Rebecca E. Engell, Thomas D. Fleming,
Stephen S. Lim, Christopher JL Murray, and Ali H. Mokdad. 2013. “Prevalence of
Physical Activity and Obesity in US Counties, 2001–2011: A Road Map for Action.”
Population Health Metrics 11 (1): 7. doi:10.1186/1478-7954-11-7.
Eggert, Leona L., Elaine A. Thompson, Jerald R. Herting, Liela J. Nicholas, and Barbara
Garii Dicker. 1994. “Preventing Adolescent Drug Abuse and High School Dropout
Through an Intensive School-Based Social Network Development Program.”
American Journal of Health Promotion 8 (3): 202–15. doi:10.4278/0890-1171-
8.3.202.
Filiousis, George, Anders Johansson, Joachim Frey, and Vincent Perreten. 2009.
“Prevalence, Genetic Diversity and Antimicrobial Susceptibility of Listeria
Monocytogenes Isolated from Open-Air Food Markets in Greece.” Food Control 20
(3): 314–17. doi:10.1016/j.foodcont.2008.05.018.
Firestone, Rebecca, Sureeporn Punpuing, Karen E. Peterson, Dolores Acevedo-Garcia,
and Steven L. Gortmaker. 2011. “Child Overweight and Undernutrition in Thailand:

45
Is There an Urban Effect?” Social Science & Medicine 72 (9): 1420–28.
doi:10.1016/j.socscimed.2011.03.003.
Fowler, Aubrey R. 2008. “Dinner for One: A Grounded Theory of Grocery Shopping in
the Single -Person Household.” ETD Collection for University of Nebraska - Lincoln,
January, 1–210.
Gaumer, Carol J., and Carol Arnone. 2009. “Grocery Store Observation: Parent-Child
Interaction in Family Purchases.” Journal of Food Products Marketing 16 (1): 1–18.
doi:10.1080/10454440802537207.
Global Agricultural Information Network. 2013. “Thailand: Retail Foods 2012.”
ASSESSMENTS OF COMMODITY AND TRADE ISSUES MADE BY USDA
STAFF AND NOT NECESSARILY STATEMENTS OF OFFICIAL U.S.
GOVERNMENT POLICY TH3011. USDA Foreign Agricultural Service.
http://gain.fas.usda.gov/Recent%20GAIN%20Publications/Retail%20Foods_Bangko
k_Thailand_1-23-2013.pdf.
Goldman, Arieh, S. Ramaswami, and Robert E. Krider. 2002. “Barriers to the
Advancement of Modern Food Retail Formats: Theory and Measurement.” Journal
of Retailing 78 (4): 281–95. doi:10.1016/S0022-4359(02)00098-2.
Gorton, Matthew, Johannes Sauer, and Pajaree Supatpongkul. 2011. “Wet Markets,
Supermarkets and the ‘Big Middle’ for Food Retailing in Developing Countries:
Evidence from Thailand.” World Development 39 (9): 1624–37.
doi:10.1016/j.worlddev.2011.02.005.

46
Hagen, James M. 2002. “Causes and Consequences of Food Retailing Innovation in
Developing Countries: Supermarkets in Vietnam.” In . Las Vegas, NV: Department
of Applied Economics and Management.
http://ageconsearch.umn.edu/bitstream/16612/1/cp03ha01.pdf.
Hampson, Sarah E., Lewis R. Goldberg, Thomas M. Vogt, and Joan P. Dubanoski. 2007.
“Mechanisms by Which Childhood Personality Traits Influence Adult Health Status:
Educational Attainment and Healthy Behaviors.” Health Psychology 26 (1): 121–25.
doi:10.1037/0278-6133.26.1.121.
Harris, Jennifer L., John A. Bargh, and Kelly D. Brownell. 2009. “Priming Effects of
Television Food Advertising on Eating Behavior.” Health Psychology : Official
Journal of the Division of Health Psychology, American Psychological Association
28 (4): 404–13. doi:10.1037/a0014399.
Hawkes, Corinna. 2008. “Dietary Implications of Supermarket Development: A Global
Perspective.” Development Policy Review 26 (6): 657–692. doi:10.1111/j.1467-
7679.2008.00428.x.
Hawkes, Corinna. 2006. “Uneven Dietary Development: Linking the Policies and
Processes of Globalization with the Nutrition Transition, Obesity and Diet-Related
Chronic Diseases.” Globalization and Health 2 (March): 4. doi:10.1186/1744-8603-
2-4.
Ho, Suk-Ching. 2005. “Evolution Versus Tradition in Marketing Systems: The Hong
Kong Food-Retailing Experience.” Journal of Public Policy & Marketing 24 (1):
90–99. doi:10.1509/jppm.24.1.90.63886.

47
Retail Asia. 2014. “New Trends Shape Asia Pacific Grocery Retailing Sector.” Retail
Asia Publishing Pte Ltd, December 10. http://retailasiaonline.com/?p=2165.
Isaacs, Bronwyn Alison, Jane Dixon, and Cathy Banwell. 2010. “Fresh Market to
Supermarket: Nutrition Transition Insights from Chiang Mai, Thailand.” Public
Health Nutrition 13 (06): 893–97. doi:10.1017/S1368980009993260.
Jackson, Ralph W., Stephen W. McDaniel, and C. P. Rao. 1985. “Food Shopping and
Preparation: Psychographic Differences of Working Wives and Housewives.”
Journal of Consumer Research 12 (1): 110–13.
Jaime, Patricia Constante, and Karen Lock. 2009. “Do School Based Food and Nutrition
Policies Improve Diet and Reduce Obesity?” Preventive Medicine 48 (1): 45–53.
doi:10.1016/j.ypmed.2008.10.018.
James, W. Philip T., Nipa Rojroongwasinkul, Tashmai Rikshasuta, and Emorn
Wasantwisut. 2010. Trade, Food, Diet and Health: Perspectives and Policy Options.
Edited by Corinna Hawkes, Chantal Blouin, Spencer Henson, Nick Drager, and
Laurette Dube. Iowa, USA: Blackwell Publishing, Ltd.
Jitpleecheep, Pitsinee. 2006. “Thailand’s Retail Industry Has Changed Dramatically in
Last 60 Years.” Bangkok Post (Bangkok, Thailand), August.
http://www.highbeam.com/doc/1G1-149175737.html.
Jou, Judy, and Win Techakehakij. 2012. “International Application of Sugar-Sweetened
Beverage (SSB) Taxation in Obesity Reduction: Factors That May Influence Policy
Effectiveness in Country-Specific Contexts.” Health Policy 107 (1): 83–90.
doi:10.1016/j.healthpol.2012.05.011.

48
Kelly, Matthew, Cathy Banwell, Jane Dixon, Sam-Ang Seubsman, Vasoontara
Yiengprugsawan, and Adrian Sleigh. 2010. “Nutrition Transition, Food Retailing
and Health Equity in Thailand.” Australasian Epidemiologist 17 (3): 4.
Kelly, Matthew, Sam-ang Seubsman, Cathy Banwell, Jane Dixon, and Adrian Sleigh.
2014. “Traditional, Modern or Mixed? Perspectives on Social, Economic, and Health
Impacts of Evolving Food Retail in Thailand.” Agriculture and Human Values 32
(3): 445–60. doi:10.1007/s10460-014-9561-z.
Levy, D. T., S. Benjakul, H. Ross, and B. Ritthiphakdee. 2008. “The Role of Tobacco
Control Policies in Reducing Smoking and Deaths in a Middle Income Nation:
Results from the Thailand SimSmoke Simulation Model.” Tobacco Control 17 (1):
53–59. doi:10.1136/tc.2007.022319.
Li, Chris. 2013. “Hong Kong Retails Food.” HK1318. USDA Foreign Agricultural
Service.
http://gain.fas.usda.gov/Recent%20GAIN%20Publications/Retail%20Foods_Hong%
20Kong_Hong%20Kong_5-1-2013.pdf.
Lippa, Katherine D., and Helen Altman Klein. 2008. “Portraits of Patient Cognition: How
Patients Understand Diabetes Self-Care.” CJNR (Canadian Journal of Nursing
Research) 40 (3): 80–95.
Lobstein, T., and S. Dibb. 2005. “Evidence of a Possible Link between Obesogenic Food
Advertising and Child Overweight.” Obesity Reviews 6 (3): 203–8.
doi:10.1111/j.1467-789X.2005.00191.x.

49
McNeely, Connie L. 1996. “Understanding Culture in a Changing World: A Scoiological
Perspective.” Journal of Criminal Justice and Popular Culture 4 (1): 2–11.
Meng, Ting, Wojciech Florkowski, Daniel B. Sarpong, Manjeet S. Chinnan, and Anna
V.A. Resurreccion. 2014. “Consumer’s Food Shopping Choice in Ghana:
Supermarket or Traditional Outlets?” International Food and Agribusiness
Management Review 17 (Special Issue A): 107–30.
Minten, Bart, and Thomas Reardon. 2008. “Food Prices, Quality, and Quality’s Pricing in
Supermarkets versus Traditional Markets in Developing Countries.” Applied
Economic Perspectives and Policy 30 (3): 480–90. doi:10.1111/j.1467-
9353.2008.00422.x.
Nelson, Kenrad E., David D. Celentano, Sakol Eiumtrakol, Donald R. Hoover, Chris
Beyrer, Somboon Suprasert, Surinda Kuntolbutra, and Chirasak Khamboonruang.
1996. “Changes in Sexual Behavior and a Decline in HIV Infection among Young
Men in Thailand.” New England Journal of Medicine 335 (5): 297–303.
doi:10.1056/NEJM199608013350501.
Ng, See H., Bridget Kelly, Chee H. Se, Karuthan Chinna, Mohd Jamil Sameeha, Shanthi
Krishnasamy, Ismail MN, and Tilakavati Karupaiah. 2014. “Obesogenic Television
Food Advertising to Children in Malaysia: Sociocultural Variations.” Global Health
Action 7 (August). doi:10.3402/gha.v7.25169.
Ng, Shu Wen, Edward C. Norton, David K. Guilkey, and Barry M. Popkin. 2010.
“ESTIMATION OF A DYNAMIC MODEL OF WEIGHT.” National Bureau of
Economic Research. http://www.nber.org/papers/w15864.pdf.

50
Park, Yong-Woo, David B. Allison, Steven B. Heymsfield, and Dympna Gallagher. 2001.
“Larger Amounts of Visceral Adipose Tissue in Asian Americans.” Obesity
Research 9 (7): 381–87. doi:10.1038/oby.2001.49.
Pawloski, Lisa R., Manyat Ruchiwit, and Samantha M. Markham. 2011. “The Growing
Burden of Obesity in Thailand: A Review of Current Trends and Policies.” Pediatric
Nursing 37 (5): 256–61.
Popkin, Barry M. 1993. “Nutritional Patterns and Transitions.” Population and
Development Review 19 (1): 138. doi:10.2307/2938388.
Posri, Wilatsana, Bhavani Shankar, and Supatra Chadbunchachai. 2006. “Consumer
Attitudes Towards and Willingness to Pay for Pesticide Residue Limit Compliant
‘Safe’ Vegetables in Northeast Thailand.” Journal of International Food &
Agribusiness Marketing 19 (1): 81–101. doi:10.1300/J047v19n01_05.
Pratruangkrai, Petchanet. 2011. “Govt Fails yet Again to Enact Law Limiting
Hypermarket Domination - The Nation.” The Nation, May 9.
http://www.nationmultimedia.com//Govt-fails-yet-again-to-enact-law-limiting-
hyperma-30154864.html.
Preece, Rob. 2012. “Excise Taxation of Non-Alcoholic Beverages in Thailand: Products,
Approaches, Rates and Administration.” World Customs Journal 6 (2): 59–72.
Prentice, A. M., and S. A. Jebb. 1995. “Obesity in Britain: Gluttony or Sloth?” BMJ
(Clinical Research Ed.) 311 (7002): 437–39.

51
Prentice, Andrew M. 2006. “The Emerging Epidemic of Obesity in Developing
Countries.” International Journal of Epidemiology 35 (1): 93–99.
doi:10.1093/ije/dyi272.
RCPT Royal College of Physicians of Thailand. 2011. “เครอขายคนไทยไรพง.”
http://www.raipoong.com/content/detail.php?slug=news_about&page_size=full_wid
th&header=no.
Reardon, Thomas, and Ashok Gulati. 2008. “The Supermarket Revolution in Developing
Countries: Policies for ‘Competitiveness with Inclusiveness.’” International Food
Policy Research Institute. http://ageconsearch.umn.edu/bitstream/47660/2/bp002.pdf.
Reardon, Thomas, Christopher B. Barrett, Julio A. Berdegué, and Johan F.M. Swinnen.
2009. “Agrifood Industry Transformation and Small Farmers in Developing
Countries.” World Development 37 (11): 1717–27.
doi:10.1016/j.worlddev.2008.08.023.
Reardon, Thomas, Spencer Henson, and Julio Berdegué. 2007. “‘Proactive Fast-Tracking’
Diffusion of Supermarkets in Developing Countries: Implications for Market
Institutions and Trade.” Journal of Economic Geography 7 (4): 399–431.
doi:10.1093/jeg/lbm007.
Reardon, Thomas, and Rose Hopkins. 2006. “The Supermarket Revolution in Developing
Countries: Policies to Address Emerging Tensions Among Supermarkets, Suppliers
and Traditional Retailers.” The European Journal of Development Research 18 (4):
522–45. doi:10.1080/09578810601070613.

52
Reardon, Thomas, C. Peter Timmer, Christopher B. Barrett, and Julio Berdegué. 2003a.
“The Rise of Supermarkets in Africa, Asia, and Latin America.” American Journal
of Agricultural Economics 85 (5): 1140–46. doi:10.1111/j.0092-5853.2003.00520.x.
Reardon, Thomas, C. Peter Timmer, and Bart Minten. 2012. “Supermarket Revolution in
Asia and Emerging Development Strategies to Include Small Farmers.” Proceedings
of the National Academy of Sciences 109 (31): 12332–37.
doi:10.1073/pnas.1003160108.
Reardon, Thomas, Peter Timmer, and Julio Berdegue. 2004. “The Rapid Rise of
Supermarkets in Developing Countries: Induced Organizational, Institutional, and
Technological Change in Agrifood Systems.” The Electronic Journal of Agricultural
and Development Economics 1 (2): 168–83.
Reardon, Thomas, Peter C. Timmer, and Julio Berdegue. 2008. “The Rapid Rise of
Supermarkets in Developing Countries: Induced Organizational, INstitutional and
Technological Change in Agri-Food Systems.” In The Transformation of Agri-Food
Systems: Globalization Supply Chains and Smallholder Farmers, edited by Ellen B.
McCullagh, Prabhu L. Pingali, and Kostas G. Stamoulis. Sterling, VA: Earthscan.
Retail Asia. 2014. “INDUSTRY ROUNDUP New Trends Shape Asia Pacific Grocery
Retailing Sector.” Retail Asia Publishing Pte Ltd, December 10.
http://retailasiaonline.com/?p=2165.
Roitner-Schobesberger, Birgit, Ika Darnhofer, Suthichai Somsook, and Christian R. Vogl.
2008. “Consumer Perceptions of Organic Foods in Bangkok, Thailand.” Food Policy
33 (2): 112–21. doi:10.1016/j.foodpol.2007.09.004.

53
Shannon, Randall. 2009. “The Transformation of Food Retailing in Thailand 1997-2007.”
Asia Pacific Business Review 15 (1): 79–92. doi:10.1080/13602380802399379.
Shannon, Randall, and Rujirutana Mandhachitara. 2008. “Causal Path Modeling of
Grocery Shopping in Hypermarkets.” Journal of Product & Brand Management 17
(5): 327–40. doi:10.1108/10610420810896086.
Shatenstein, Bryna, and Parviz Ghadirian. 1998. “Influences on Diet, Health Behaviours
and Their Outcome in Select Ethnocultural and Religious Groups.” Nutrition 14 (2):
223–30. doi:10.1016/S0899-9007(97)00425-5.
Silayoi, Pinya and Mark Speece. 2004. “Packaging and Purchase Decisions: An
Exploratory Study on the Impact of Involvement Level and Time Pressure.” British
Food Journal 106 (8): 607–28. doi:10.1108/00070700410553602.
Singh, Gitanjali M., Renata Micha, Shahab Khatibzadeh, Stephen Lim, Majid Ezzati, and
Dariush Mozaffarian. 2015. “Estimated Global, Regional, and National Disease
Burdens Related to Sugar-Sweetened Beverage Consumption in 2010.” Circulation,
June, CIRCULATIONAHA.114.010636.
doi:10.1161/CIRCULATIONAHA.114.010636.
Sirichakwal, Prapaisri P, and Kitti Sranacharoenpong. 2008. “Practical Experience in
Development and Promotion of Food-Based Dietary Guidelines in Thailand.” Asia
Pacific Journal Of Clinical Nutrition 17 Suppl 1: 63–65.
Smith, Tasman, and Rujirutana Mandhachitara. 2000. “Retail Investment in Asia/Pacific:
Local Responses and Public Policy Issues.” In Retail Investment in Asia/Pacific:
54
Local Responses and Public Policy Issues, edited by Ross Davies and Toshiyuki
Yahagi. Oxford: Templeton College.
Sranacharoenpong, Kitti, Rhona M Hanning, Prapaisri P Sirichakwal, and Uraiporn
Chittchang. 2009. “Process and Outcome Evaluation of a Diabetes Prevention
Education Program for Community Healthcare Workers in Thailand.” Education for
Health (Abingdon, England) 22 (3): 335.
Sriwichailamphan, Thanes. 2007. “Global Food Chains and Environment: Ago-Food
Production and Processing in Thailand.” Netherlands: Wageningen University.
http://edepot.wur.nl/36156.
Tangcharoensathien, Viroj, Supon Limwattananon, Walaiporn Patcharanarumol, and
Jadej Thammatacharee. 2014. “Monitoring and Evaluating Progress towards
Universal Health Coverage in Thailand.” PLOS Med 11 (9): e1001726.
doi:10.1371/journal.pmed.1001726.
Thai Plege. 2008. “Thailand Children’s Food and Beverage Advertising Initiative.”
https://www.ifballiance.org/sites/default/files/Thai%20Pledge%20Fact%20sheet%20
Eng%2021-05-08.pdf.
Thapinta, Anat, and Paul F. Hudak. 2000. “Pesticide Use and Residual Occurrence in
Thailand.” Environmental Monitoring and Assessment 60 (1): 103–14.
doi:10.1023/A:1006156313253.
Tosonboon, Jirapar. 2003. “The Impact of World Class Distributors on the Retail
Industry in Thailand.” In The Internationalisation of Retailing in Asia, edited by
John Dawson. London: Routledge Curzon.

55
Trappey, Charles, and Meng Kuan Lai. 1997. “Differences in Factors Attracting
Consumers to Taiwan’s Supermarkets and Traditional Wet Markets.” Journal of
Family and Economic Issues 18 (2): 211–24. doi:10.1023/A:1024980425100.
Valente, Thomas W., Beth R. Hoffman, Annamara Ritt-Olson, Kara Lichtman, and C.
Anderson Johnson. 2003. “Effects of a Social-Network Method for Group
Assignment Strategies on Peer-Led Tobacco Prevention Programs in Schools.”
American Journal of Public Health 93 (11): 1837–43.
Vandevijvere, Stefanie, Carson C Chow, Kevin D Hall, Elaine Umali, and Boyd A
Swinburn. 2015. “Increased Food Energy Supply as a Major Driver of the Obesity
Epidemic: A Global Analysis.” Bulletin of the World Health Organization 93 (7):
446–56. doi:10.2471/BLT.14.150565.
Vermeir, Iris, and Patrick Van Kenhove. 2005. “The Influence of Need for Closure and
Perceived Time Pressure on Search Effort for Price and Promotional Information in
a Grocery Shopping Context.” Psychology and Marketing 22 (1): 71–95.
doi:10.1002/mar.20047.
Whitehead (a), RJ. 2015. “Taiwan Updates Its Certification in Wake of Scandals.” Food
Navigator Asia, June 26. http://www.foodnavigator-asia.com/Policy/Taiwan-
updates-its-certification-in-wake-of-scandals.
Whitehead (b), RJ. 2015. “One in Five Beijingers Is Obese.” Food Navigator Asia, June
29. http://www.foodnavigator-asia.com/Markets/One-in-five-Beijingers-is-
obese/?utm_source=newsletter_daily&utm_medium=email&utm_campaign=01-Jul-
2015&c=IWo4tBLFSpMwupMhVrSz52poexdgyV7i&p2=.

56
Whitehead (c), RJ. 2015. “Asian Shoppers More Likely to Check Labels than Americans.”
Food Navigator Asia, July 7. http://www.foodnavigator-asia.com/Markets/Asian-
shoppers-more-likely-to-check-labels-than-Americans.
Winichagoon, Pattanee. 2002. “Prevention and Control of Anemia: Thailand
Experiences.” The Journal of Nutrition 132 (4 Suppl): 862S – 6S.
Winichagoon, Pattanee. 2013. “Thailand Nutrition in Transition: Situation and
Challenges of Maternal and Child Nutrition.” Asia Pacific Journal of Clinical
Nutrition 22 (1): 6–15.
Wongprawmas, Rungsaran, Canavari Maurizio, and Chutima Waisarayutt. 2014. “Are
Thai Consumers Willing to Pay for Food Safety Labels? Choice Experiment on
Fresh Produce.” In . Ljubljana, Slovenia: EAAE 2014 Congress.
http://purl.umn.edu/182739.

57
CHAPTER THREE: THEORETICAL FRAMEWORK
This chapter explores the theories and frameworks used to explain obesity over
the course of evolution. Section I presents the thrifty genotypes and thrifty phenotypes
hypotheses that have partially explained the rise in the prevalence of type 2 diabetes but
that researchers do not believe to be the main driver. Section II and III details the two
concepts most relevant to contemporary obesity research, the Social Cognitive Theory
(SCT) and the Ecological Perspective Framework (EPF), both pointing to the
environment as playing a significant role in encouraging unhealthy lifestyle leading to the
rise in obesity.
I: The Evolution of the Obesity Issue Framework
Traditionally, obesity is thought of as an imbalance between caloric intake and
energy expenditure or a net positive energy balance. In other words, overweight
individuals overeat (Prentice and Jebb 1995). The interactions between genotypes and
phenotypes have been used to explain differences in body composition that leads to high
prevalence of obesity and diabetes in certain populations (Wulan et al. 2010). A genome-
wide association study of independent samples of Caucasian and Chinese populations
found a link between polymorphism in the thyrotropin-releasing hormone receptor

58
(TRHR) and levels of lean body mass. The receptor signals growth hormones that
determine the development of vertebrae skeletal muscle and muscle protein balance (Liu
et al. 2009). Some have argued that the human genes from hunters and gatherers times,
metabolism efficiency and fat storage, have not evolved rapidly enough to adjust the
modern way of life (Hu 2011). Human biology gives us preferences for sweet and fatty
foods and the desire to avoid labor-intensive tasks (Popkin et al. 2012). The thrifty
genotypes we inherited from our ancestors are unmatched for lifestyle in a society where
sweet and fatty foods are in abundance and automation spares us manual labors. Our
genes combined with the modern lifestyle, therefore, make us susceptible to conditions
such as obesity and diabetes (Hu 2011).
For all populations, the thrifty phenotype hypothesis posits that the intrauterine
environments affect one’s susceptibility to obesity and diabetes in adulthood. In
developing countries where under-nutrition still exists, pregnant women who do not
receive adequate nutrition may send signals to their unborn babies to metabolize more
efficiently which will be beneficial for survival during famines but may increase their
susceptibility to obesity later in life when food scarcity is no longer an issue
(Ramachandran and Snehalata 2010). This is particularly relevant in Southeast Asia
where the same generation that may have grown up under-nourished now faces the risks
of over-nutrition (Dans 2011). Stunting in childhood has been linked to lower energy
metabolism, increased fat storage, and impaired food regulation system (Ramachandran
and Snehalata 2010). As such, stunted children are more prone to overweight and obesity
later in life. The effects can be further amplified by a sedentary lifestyle that includes

59
spending several hours a day watching television, browsing the Internet, and playing
video games. Studies have shown that low birth weight (LBW) is linked to an enhanced
risk of type-2 diabetes because the condition promotes a thrifty phenotype including
insulin resistance and low β-cell function (Hales and Barker 1992; Hu 2011).
Undeniably, there are unmodifiable genetic and modifiable behavioral
components to the issue of obesity. Absence of obesogenic environment, variability in
behavior does not usually result in excess weight gain, but people can deliberately fatten
themselves through overfeeding (Pasquet et al. 1992). It seemed obvious, then, that
behavior modification at the individual level should be the target of interventions to
reduce and prevent the spread of obesity. The behavior-change theoretical framework has
been used to guide the understanding and interventions of obesity (Gibbs and Waters
2011). Countless interventions aimed at increasing nutrition education, reducing fat and
caloric intake, and/or increasing physical activity level to address the imbalance of
caloric intake and energy expenditure. Over the years, we have learned, however, that
interventions at the individual-level without accompanying changes in the surrounding
environment have limited success especially in the long-run (Wells 2012). The approach,
while straight forward and relevant, ignores the socio-political context of regulation,
legislation, social norms, and the environment in which the individuals reside (Gibbs and
Waters 2011). It is now clear that animals put captive in similar obesogenic environment
with abundant fattening foods and reduced opportunities for physical activity also
develop obesity (Kemnitz and Francken 1986; German 2006).

60
The two prevailing frames in obesity are the personal responsibility frame and the
obesogenic environment frame. Those in support of the personal responsibility frame
advocate demand-side interventions that include such measures as education campaigns,
food labeling, and menu labeling. The food and beverage industry has long used this
argument to block government interventions to regulate the sales of unhealthful diets.
For many years, the food industry had been successful at using this line of reasoning to
block school reforms aimed at restricting the sale of junk foods and sugary drink
(Brownell et al. 2009). Personal responsibility advocates have lobbied for nutrition
education, physical activity campaigns, and asking the food and beverage industry to
voluntarily adopt healthy practices instead of using the regulations approach (Kersh,
2009).
The view on the obesity issue at the population level slowly evolved from that of
an overly simplistic personal responsibility to a product of more complex interactions
between humans, their changing lifestyle, and the industrializing surrounding
environment. The next subsections describe two theories that look at people through the
lens of the problem and are often used in the study human health behavior as well as
provide the basis for health promotion campaigns. The two include the social cognitive
theory (SCT) and the ecological perspective framework (EPF). Both the theory and the
framework recognize the environment and the study of people’s values as important
factors in the issue of obesity and represent a move away from the personal responsibility
perspective.

61
II: The Social Cognitive Theory
The Social Cognitive Theory (SCT) is a theory that is often used in studying
human behavior including food choices. The conceptual origin of the theory is derived
from Edwin B. Holt and Harold Chapman Brown’s 1931 book describing animal action
as being based on satisfying psychological needs (Holt and Brown 1931). A decade later,
Neal E. Miller and John Dollard created the Social Learning and Imitation Theory,
adding the process of element of behavioral imitation, taking cues on whether the model
receives a reward or punishment (Miller and Dollard 1941). Finally, in 1986, Albert
Bandura introduced SCT from the study of children’s aggressive behavior using concepts
adapted from Miller and Dollard’s Social Learning and Imitation Theory. SCT focuses on
the interactions of multiple factors of influence rather than only on individual-level
factors in recognition that people live lives as part of a society and that, oftentimes,
personal goals are only achievable through socially interdependent effort. People must
then come together and share their resources, skills, and work together to help individuals
accomplish their goals that are in the society’s best interests (Bandura 2002).
The unique aspect of SCT is its emphasis on social influence and internal and
external motivations. Bandura also reckoned the cultural difference variable and asked
that cultural analyses be addressed to differentiate cultural social norms from universal
human nature (Bandura 2002). He believed that effective health promotions must involve
equipping individuals with knowledge and skills as well as identifying social supports
within cultural context in order to manage their health habits (Bandura 1998, Bandura

62
2004). The theory, most often used in the psychology, education, and communication
disciplines, explains human behavior using the concept of reciprocal determinism.
Individual behavior is thought of as product of reciprocal interactions between three
constructs; behavioral factors, personal factors, and environmental factors. SCT considers
individual’s past experiences and social environment such as family members, peers, and
colleagues to explain their likelihood of engaging in a particular behavior. Despite the
interplay of several factors that SCT brings to the fore, the theory is only loosely
organized. It does not delve into how and the extent to which each construct of the three
factors, behavioral, personal, and environmental, may influence targeted behavior.
SCT has been used to study human nutrition choices in the face of obesogenic
environments that include an increase in convenience foods, pricing strategies and
agricultural policies that encourage unhealthy eating, and a decrease in opportunities for
physical activity. Such an environment requires individuals to make a considerable
conscientious effort to develop or maintain healthy dietary habits. Anderson et al. has
done extensive research on self-efficacy and outcome expectations components of the
SCT. Using self-reported food frequency surveys and food-shopping receipts, Anderson
et al. found self-efficacy, mediated through physical outcome expectations, to be
significantly associated with food shoppers’ nutrition behaviors. Those with high self-
efficacy (high confidence for change) were more likely to expect positive outcomes from
a better diet which was reflected in the grocery items they purchased (Anderson et al.
2000; Anderson et al. 2001). Later studies on SCT-based interventions revealed similar
results (Steptoe et al. 2004; Fuemmeler et al. 2006). SCT was also applied to exercise

63
behavior studies and was found to be effective in predicting behavior modification both
in adolescents and older populations (Wallace et al.2000, Booth et al. 2000, Conn 1998)
III: The Ecological Perspective Framework
In 1924, McKenzie introduced the ecological approach to the study of the human
community. Ecology had previously referred to existence of plants and animals in the
environment, their relationships, and interdependence. Applying the same concept, he
defined human ecology as “a study of the spatial and temporal relations of human beings
as affected by the selective, distributive, and accommodative forces of the environment,”
(McKenzie p.288). He pointed out that the difference between the two is that while
animals can move across space in their environment to gather food, humans, in addition,
can also select their own habitat and have the ability to adapt to and alter the conditions
of the habitat. Even with superior control, humans are relatively weak because they need
the company of other human beings as well as shelter and clothing. Unlike the SCT
where environment predominantly entails people surrounding the targeted individual, the
ecology approach stresses the importance of physical and structural environment such as
prevalence of grocery stores and availability of public transportation. Three essential
elements for human community are a house, a road, and water whereas food can be more
easily transported from outside. It is the advancements in transportation technologies that
allow for the growth of large cities where businesses are concentrated. Foods are
transported from outside of large economic bases where goods and produce are most
easily produced (McKenzie 1924).

64
The concept, now termed the Ecological Perspective Framework (EPF), was
introduced to the public health discipline by McLeroy et al. in 1988. It acknowledges the
interaction between, and interdependence of, various factors across multiple levels of a
health problem (McLeroy et al. 1988). Most researchers, policy makers, and health
professionals now agree that obesity is no longer simply individual responsibility but a
societal issue. Individual psychological and social factors cannot adequately account for
the widespread prevalence of the obesity epidemic in the developed world and
interventions at the individual level have had limited success at best. As the world
witnesses the development of more chronic diseases, it becomes evident that the
structural environment and social influences have important impacts on human health
(McLaren and Hawe 2005). The current lifestyle encourages an imbalance between
caloric intake and physical exercise. While there has been increasing varieties of
palatable foods, opportunities for physical activities have been quickly dwindling,
especially for city dwellers. Such conditions contribute to the proliferation of chronic
diseases and obesity.
According to the EPF model, behavior modification is most effective when there
are multiple levels, or “spheres,” of influence, namely
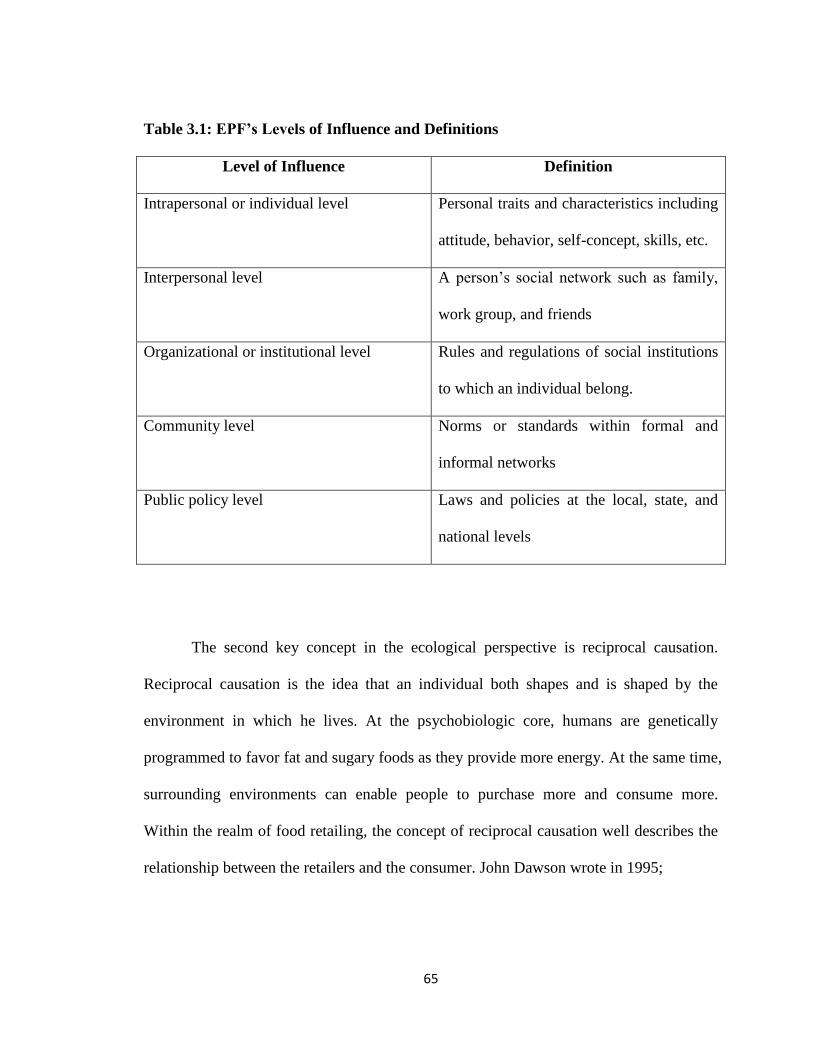
65
Table 3.1: EPF’s Levels of Influence and Definitions
Level of Influence Definition
Intrapersonal or individual level Personal traits and characteristics including
attitude, behavior, self-concept, skills, etc.
Interpersonal level A person’s social network such as family,
work group, and friends
Organizational or institutional level Rules and regulations of social institutions
to which an individual belong.
Community level Norms or standards within formal and
informal networks
Public policy level Laws and policies at the local, state, and
national levels
The second key concept in the ecological perspective is reciprocal causation.
Reciprocal causation is the idea that an individual both shapes and is shaped by the
environment in which he lives. At the psychobiologic core, humans are genetically
programmed to favor fat and sugary foods as they provide more energy. At the same time,
surrounding environments can enable people to purchase more and consume more.
Within the realm of food retailing, the concept of reciprocal causation well describes the
relationship between the retailers and the consumer. John Dawson wrote in 1995;

66
Whilst retailers respond to the culture of consumers and provide goods
which are expected in a way which is acceptable, nonetheless the
retailers also extend the horizons of consumers by presenting them with
new products sold in new ways. Retailers, therefore, are both reactive
and proactive agents in the process of consumer choice, (p.77).
It is apparent that modern food retailers have already exerted control over the
supply chain, imposing new standards on suppliers and pushing some small-scale farmers
off the food supply chain (Hawkes 2008). It is less apparent that they are, at the same
time, taking control over shaping consumer food choice through various marketing tools
(Ibid). This shift in power is of concern. Policymakers have the interest in balancing the
power between the suppliers, the retailers, and the consumer (Ibid).
In 2001, Booth et al. published an article detailing strategies to combat obesity
that focus on changing environmental factors and require the collaboration of various
sectors not traditionally within the health domains (Booth et al. 2001). In examining
factors affecting individual’s eating and exercising choices, they identified two types of
leverage points; proximal and distal. Proximal, or primary, leverage points directly
control behavior settings such as family, employer, and supermarket. Distal, or secondary,
leverage points exert indirect, but crucial, influences on the controllers of those settings.
Examples of distal leverage points include policies, the entertainment industry, education
system, transportation system, and the media. Certain factors have stronger influence on
some segments of populations. Adolescents, for instance, are most influenced by body
image and eating behavior in media and advertising (Story et al. 2002). The government
67
has pervasive influence over both proximal and distal leverage points. It will require the
cooperation of public agencies at all levels to achieve sustainable changes in the macro-
and micro-environments that are conducive to the prevention and reduction of
population-wide obesity problems (Booth et al. 2001).
IV: Social and Structural Environment in Obesity Research
The role of built environment in shaping one’s health outcomes has been a
popular subject of obesity research. Using the ecological perspective, supermarkets are
part of the environment, a community-level factor. In developed countries, food
availability and presence of supermarkets have been investigated as possible determinants
of diet and subsequently lifestyle diseases such as diabetes and cardiovascular diseases,
of which obesity is a major risk factor (Eisenhauer 2001, Fitzgibbon et al. 2005, Story et
al. 2008, Morland et al. 2002). By making processed-foods more accessible and
affordable, supermarkets influence consumer choice. Marketing tools such as promotions
and advertisements are used to drive up the demand for such products, influencing
change in a population’s dietary patterns and allowing supermarkets to expand further
(Hawkes 2008). A study on values and preferences of fresh market shoppers and
supermarket shoppers in Chiang Mai, Thailand, revealed stronger preferences for rice
among regular fresh market shoppers. Whereas 100% of fresh market shoppers in the
sample reported preferences for rice, a small number of supermarket shoppers displayed
preferences for bread and wheat noodles (Isaacs et al. 2010).

68
Previous studies capture pieces of the complex relationships between residents,
race, socioeconomic status, grocery stores, health, community, and society at large
(Yeager and Gatrell 2014, Burns et al. 2004, Block et al. 2004, Lewis et al. 2005, Zenk et
al. 2005). Disparities in food availability in various settings have been observed (Morland
et al. 2002, Burns et al. 2004, Zenk et al. 2005, Larson et al. 2009). For example, in
Australia, there is greater availability of healthy foods at lower costs in non-rural settings.
The highest price variability was found among fresh fruits and vegetables (Burns et al.
2004). While literature on the absence of grocery stores in poor neighborhoods is
abundant, proximity, it has been shown, is not the only determinant of destination choice
nor is it the only indicator of access to healthful foods. Other factors such as prices and
physical disabilities of individuals can also limit people’s access even in areas where
grocery stores are plentiful (Choi and Suzuki 2013).
Food prices influence dietary patterns and subsequently health as evidenced by
the link between regional food prices and obesity rates among low-income households
(Lovasi et al. 2009, Todd et al. 2011, Ford and Dzewltowski 2009). During the 1990s,
there were increasing discussions on “populated areas with little or no food retail
provision” (Cummins and Macintyre 1999). The term “food desert” was coined by the
Nutrition Task Force Low Income Project Team of the United Kingdom Department of
Health in 1995 as concerns on food issues such as genetically modified foods and diet-
related diseases such as obesity were rising (Beaumont et al. 1995). While there are
variations on the exact meaning of food desert, the USDA defines it as “parts of the
country vapid of fresh fruit, vegetables, and other healthful whole foods, usually found in

69
impoverished areas” (American Nutrition Association 2010). In Portland, Oregon, food
deserts are rare but food mirages where grocery store prices are too high for low-income
families are commonly found (Breyer and Voss-Andreae 2013). Fresh produce are
consistently more affordable in supermarkets than in small neighborhood food outlets
that are present in poorer neighborhoods (Horowitz et al. 2004), and those with better
access to supermarkets have lower levels of obesity (Larson et al. 2009). In Japan where
the socio-economic discrepancy is not as large, elderly who were without a car and
unemployed were a socially excluded group (Choi and Suzuki 2013). Food deserts are
often determined by area demographics while ignoring personal attributes. Elderly
individuals had lower accessibility to grocery stores whether or not they live in what is
considered to be food desert (Ibid).
Conclusion
Social ecological theories such as the EPF and the SCT described in this chapter
have just started to be applied to obesity research studies in recent decades (McLeroy et
al. 1988; Green and Kreuter 2004). The models of analysis in this dissertation are built on
these theories exploring sociocultural influences, in this case, types of grocery stores, on
health behaviors and weight status. While environmental influences on obesity risk
encompass a wide range of factors unable to all be covered in a single study, some of the
elements included in this dissertation are drawn from three aspects of the environment
including physical, economic, and sociocultural. The increasing presence of modern

70
format grocery stores in Bangkok may be able to explain the concurrent rise in obesity
and chronic diseases in the population.

71
REFERENCES
American Nutrition Association. 2010. “USDA Defines Food Deserts | American
Nutrition Association.” http://americannutritionassociation.org/newsletter/usda-
defines-food-deserts.
Anderson, E. S., R. A. Winett, and J. R. Wojcik. 2000. “Social-Cognitive Determinants
of Nutrition Behavior among Supermarket Food Shoppers: A Structural Equation
Analysis.” Health Psychology: Official Journal of the Division of Health Psychology,
American Psychological Association 19 (5): 479–86.
Anderson, E. S., R. A. Winett, J. R. Wojcik, S. G. Winett, and T. Bowden. 2001. “A
Computerized Social Cognitive Intervention for Nutrition Behavior: Direct and
Mediated Effects on Fat, Fiber, Fruits, and Vegetables, Self-Efficacy, and Outcome
Expectations among Food Shoppers.” Annals of Behavioral Medicine: A Publication
of the Society of Behavioral Medicine 23 (2): 88–100.
Asfaw, Abay. 2008. “Does Supermarket Purchase Affect the Dietary Practices of
Households? Some Empirical Evidence from Guatemala.” Development Policy
Review 26 (2): 227–43.
Bandura, Albert. 1998. “Health Promotion from the Perspective of Social Cognitive
Theory.” Psychology & Health 13 (4): 623–49. doi:10.1080/08870449808407422.

72
———. 2002. “Social Cognitive Theory in Cultural Context.” Applied Psychology 51
(2): 269–90. doi:10.1111/1464-0597.00092.
———. 2004. “Health Promotion by Social Cognitive Means.” Health Education &
Behavior 31 (2): 143–64. doi:10.1177/1090198104263660.
Beaumont, J., T. Lang, S. Leather, and C. Mucklow. n.d. “Report from the Policy Sub‐
group to the Nutrition Task Force Low Income Project Team of the Department of
Health.” Radlett Institute of Grocery.
Block, Jason P., Richard A. Scribner, and Karen B. DeSalvo. 2004. “Fast Food,
Race/ethnicity, and Income: A Geographic Analysis.” American Journal of
Preventive Medicine 27 (3): 211–17. doi:10.1016/j.amepre.2004.06.007.
Booth, Michael L., Neville Owen, Adrian Bauman, Ornella Clavisi, and Eva Leslie. 2000.
“Social–Cognitive and Perceived Environment Influences Associated with Physical
Activity in Older Australians.” Preventive Medicine 31 (1): 15–22.
doi:10.1006/pmed.2000.0661.
Booth, Sarah L., James F. Sallis, Cheryl Ritenbaugh, James O. Hill, Leann L. Birch,
Lawrence D. Frank, Karen Glanz, et al. 2001. “Environmental and Societal Factors
Affect Food Choice and Physical Activity: Rationale, Influences, and Leverage
Points.” Nutrition Reviews 59 (3): S21–36. doi:10.1111/j.1753-4887.2001.tb06983.x.
Breyer, Betsy, and Adriana Voss-Andreae. 2013. “Food Mirages: Geographic and
Economic Barriers to Healthful Food Access in Portland, Oregon.” Health & Place
24 (November): 131–39. doi:10.1016/j.healthplace.2013.07.008.

73
Brownell, Kelly D., Thomas Farley, Walter C. Willett, Barry M. Popkin, Frank J.
Chaloupka, Joseph W. Thompson, and David S. Ludwig. 2009. “The Public Health
and Economic Benefits of Taxing Sugar-Sweetened Beverages.” The New England
Journal of Medicine 361 (16): 1599–1605. doi:10.1056/NEJMhpr0905723.
Burns, C. M., P. Gibbon, R. Boak, S. Baudinette, and J. A. Dunbar. 2004. “Food Cost
and Availability in a Rural Setting in Australia.” Rural and Remote Health 4 (4): 311.
Choi, Yuran, and Tsutomu Suzuki. 2013. “Food Deserts, Activity Patterns, & Social
Exclusion: The Case of Tokyo, Japan.” Applied Geography 43 (September): 87–98.
doi:10.1016/j.apgeog.2013.05.009.
Conn, Vicki S. 1998. “Older Women: Social Cognitive Theory Correlates of Health
Behavior.” Women & Health 26 (3): 71–85. doi:10.1300/J013v26n03_05.
Cummins, Stevens and Sally Macintyre. 1999. “The Location of Food Stores in Urban
Areas: A Case Study in Glasgow.” British Food Journal 101 (7): 545–53.
doi:10.1108/00070709910279027.
Dans, Antonio, Nawi Ng, Cherian Varghese, E Shyong Tai, Rebecca Firestone, and Ruth
Bonita. 2011. “The Rise of Chronic Non-Communicable Diseases in Southeast Asia:
Time for Action.” The Lancet 377 (9766): 680–89. doi:10.1016/S0140-
6736(10)61506-1.
Dawson, John. 1995. “Food Retailing and the Consumer.” In Food Choice And The
Consumer, edited by David W. Marshall. Springer.
Eisenhauer, Elizabeth. 2001. “In Poor Health: Supermarket Redlining and Urban
Nutrition.” GeoJournal 53 (2): 125–33. doi:10.1023/A:1015772503007.

74
Fitzgibbon, Marian L., Melinda R. Stolley, Linda Schiffer, Lisa A. P. Sanchez-Johnsen,
Anita M. Wells, and Alan Dyer. 2005. “A Combined Breast Health/weight Loss
Intervention for Black Women.” Preventive Medicine 40 (4): 373–83.
doi:10.1016/j.ypmed.2004.06.018.
Ford, Paula B, and David A Dzewaltowski. 2008. “Disparities in Obesity Prevalence due
to Variation in the Retail Food Environment: Three Testable Hypotheses.” Nutrition
Reviews 66 (4): 216–28. doi:10.1111/j.1753-4887.2008.00026.x.
Fuemmeler, Bernard F., Louise C. Mâsse, Amy L. Yaroch, Ken Resnicow, Marci
Kramish Campbell, Carol Carr, Terry Wang, and Alexis Williams. 2006.
“Psychosocial Mediation of Fruit and Vegetable Consumption in the Body and Soul
Effectiveness Trial.” Health Psychology: Official Journal of the Division of Health
Psychology, American Psychological Association 25 (4): 474–83. doi:10.1037/0278-
6133.25.4.474.
German, Alexander J. 2006. “The Growing Problem of Obesity in Dogs and Cats.” The
Journal of Nutrition 136 (7): 1940S – 1946S.
Gibbs, Lisa and Elizabeth Waters. 2011. “A Settings-Based Theoretical Framework for
Obesity Prevention Community Interventions and Research.” Australian and New
Zealand Journal of Public Health 35 (2): 104–6. doi:10.1111/j.1753-
6405.2010.00688.x.
Hales, C. N., and D. J. P. Barker. 1992. “Type 2 (non-Insulin-Dependent) Diabetes
Mellitus: The Thrifty Phenotype Hypothesis.” Diabetologia 35 (7): 595–601.
doi:10.1007/BF00400248.

75
Hawkes, Corinna. 2008. “Dietary Implications of Supermarket Development: A Global
Perspective.” Development Policy Review 26 (6): 657–92. doi:10.1111/j.1467-
7679.2008.00428.x.
Holt, Edwin B, and Harold Chapman Brown. 1931. Animal Drive and the Learning
Process, an Essay toward Radical Empiricism,. New York: H. Holt and Company.
Horowitz, Carol R., Kathryn A. Colson, Paul L. Hebert, and Kristie Lancaster. 2004.
“Barriers to Buying Healthy Foods for People With Diabetes: Evidence of
Environmental Disparities.” American Journal of Public Health 94 (9): 1549–54.
Hu, Frank B. 2011. “Globalization of Diabetes The Role of Diet, Lifestyle, and Genes.”
Diabetes Care 34 (6): 1249–57. doi:10.2337/dc11-0442.
Inagami, Sanae, Deborah A. Cohen, Brian Karl Finch, and Steven M. Asch. 2006. “You
Are Where You Shop: Grocery Store Locations, Weight, and Neighborhoods.”
American Journal of Preventive Medicine 31 (1): 10–17.
doi:10.1016/j.amepre.2006.03.019.
Isaacs, Bronwyn Alison, Jane Dixon, and Cathy Banwell. 2010. “Fresh Market to
Supermarket: Nutrition Transition Insights from Chiang Mai, Thailand.” Public
Health Nutrition 13 (06): 893–97. doi:10.1017/S1368980009993260.
Kelly, Matthew, Sam-ang Seubsman, Cathy Banwell, Jane Dixon, and Adrian Sleigh.
2014. “Traditional, Modern or Mixed? Perspectives on Social, Economic, and Health
Impacts of Evolving Food Retail in Thailand.” Agriculture and Human Values 32
(3): 445–60. doi:10.1007/s10460-014-9561-z.

76
Kemnitz, J. W., and G. A. Francken. 1986. “Characteristics of Spontaneous Obesity in
Male Rhesus Monkeys.” Physiology & Behavior 38 (4): 477–83.
Kersh, Rogan. 2009. “The Politics of Obesity: A Current Assessment and Look Ahead.”
The Milbank Quarterly 87 (1): 295–316. doi:10.1111/j.1468-0009.2009.00556.x.
Larson, Nicole I., Mary T. Story, and Melissa C. Nelson. 2009. “Neighborhood
Environments: Disparities in Access to Healthy Foods in the U.S.” American
Journal of Preventive Medicine 36 (1): 74–81.e10.
doi:10.1016/j.amepre.2008.09.025.
Lewis, LaVonna Blair, David C. Sloane, Lori Miller Nascimento, Allison L. Diamant,
Joyce Jones Guinyard, Antronette K. Yancey, and Gwendolyn Flynn. 2005. “African
Americans’ Access to Healthy Food Options in South Los Angeles Restaurants.”
American Journal of Public Health 95 (4): 668–73. doi:10.2105/AJPH.2004.050260.
Liu, Xiao-Gang, Li-Jun Tan, Shu-Feng Lei, Yong-Jun Liu, Hui Shen, Liang Wang, Han
Yan, et al. 2009. “Genome-Wide Association and Replication Studies Identified
TRHR as an Important Gene for Lean Body Mass.” The American Journal of Human
Genetics 84 (3): 418–23. doi:10.1016/j.ajhg.2009.02.004.
Lovasi, Gina S., Malo A. Hutson, Monica Guerra, and Kathryn M. Neckerman. 2009.
“Built Environments and Obesity in Disadvantaged Populations.” Epidemiologic
Reviews, January, mxp005. doi:10.1093/epirev/mxp005.
McKenzie, R. D. 1924. “The Ecological Approach to the Study of the Human
Community.” American Journal of Sociology 30 (3): 287–301.

77
McLaren, Lindsay, and Penelope Hawe. 2005. “Ecological Perspectives in Health
Research.” Journal of Epidemiology and Community Health 59 (1): 6–14.
doi:10.1136/jech.2003.018044.
McLeroy, K. R., D. Bibeau, A. Steckler, and K. Glanz. 1988. “An Ecological Perspective
on Health Promotion Programs.” Health Education Quarterly 15 (4): 351–77.
Miller, N., and J. Dollard. 1941. Social Learning and Imitation. Vol. xiv. New Haven, CT,
US: Yale University Press.
Morland, Kimberly, Steve Wing, Ana Diez Roux, and Charles Poole. 2002.
“Neighborhood Characteristics Associated with the Location of Food Stores and
Food Service Places.” American Journal of Preventive Medicine 22 (1): 23–29.
Morland, Kimberly, Steve Wing, and Ana Diez Roux. 2002. “The Contextual Effect of
the Local Food Environment on Residents’ Diets: The Atherosclerosis Risk in
Communities Study.” American Journal of Public Health 92 (11): 1761–68.
Pasquet, P., L. Brigant, A. Froment, G. A. Koppert, D. Bard, I. de Garine, and M.
Apfelbaum. 1992. “Massive Overfeeding and Energy Balance in Men: The Guru
Walla Model.” The American Journal of Clinical Nutrition 56 (3): 483–90.
Popkin, Barry M, Linda S Adair, and Shu Wen Ng. 2012. “Global Nutrition Transition
and the Pandemic of Obesity in Developing Countries.” Nutrition Reviews 70 (1): 3–
21. doi:10.1111/j.1753-4887.2011.00456.x.
Prentice, A. M., and S. A. Jebb. 1995. “Obesity in Britain: Gluttony or Sloth?” BMJ
(Clinical Research Ed.) 311 (7002): 437–39.

78
Ramachandran, Ambady, and Chamukuttan Snehalatha. 2010. “Rising Burden of Obesity
in Asia.” Journal of Obesity 2010 (August). doi:10.1155/2010/868573.
Steptoe, Andrew, Linda Perkins-Porras, Elisabeth Rink, Sean Hilton, and Francesco P.
Cappuccio. 2004. “Psychological and Social Predictors of Changes in Fruit and
Vegetable Consumption Over 12 Months Following Behavioral and Nutrition
Education Counseling.” Health Psychology 23 (6): 574–81. doi:10.1037/0278-
6133.23.6.574.
Story, Mary, Karen M. Kaphingst, Ramona Robinson-O’Brien, and Karen Glanz. 2008.
“Creating Healthy Food and Eating Environments: Policy and Environmental
Approaches.” Annual Review of Public Health 29 (1): 253–72.
doi:10.1146/annurev.publhealth.29.020907.090926.
STORY, MARY, DIANNE NEUMARK-SZTAINER, and SIMONE FRENCH. 2002.
“Individual and Environmental Influences on Adolescent Eating Behaviors.” Journal
of the American Dietetic Association 102 (3, Supplement): S40–51.
doi:10.1016/S0002-8223(02)90421-9.
Todd, Jessica E, Ephraim Leibtag, Corttney Penberthy, United States, Department of
Agriculture, and Economic Research Service. 2011. Geographic Differences in the
Relative Price of Healthy Foods. [Washington, D.C.]: U.S. Dept. of Agriculture,
Economic Research Service. http://purl.fdlp.gov/GPO/gpo14265.
Wallace, Lorraine Silver, Janet Buckworth, Timothy E. Kirby, and W. Michael Sherman.
2000. “Characteristics of Exercise Behavior among College Students: Application of

79
Social Cognitive Theory to Predicting Stage of Change.” Preventive Medicine 31
(5): 494–505. doi:10.1006/pmed.2000.0736.
Wells, Jonathan C. K. 2012. “The Evolution of Human Adiposity and Obesity: Where
Did It All Go Wrong?” Disease Models & Mechanisms 5 (5): 595–607.
doi:10.1242/dmm.009613.
Wulan, S N, K R Westerterp, and G Plasqui. 2010. “Ethnic Differences in Body
Composition and the Associated Metabolic Profile: A Comparative Study between
Asians and Caucasians.” Maturitas 65 (4): 315–19.
doi:10.1016/j.maturitas.2009.12.012.
Yeager, Charles D., and Jay D. Gatrell. 2014. “Rural Food Accessibility: An Analysis of
Travel Impedance and the Risk of Potential Grocery Closures.” Applied Geography
53 (September): 1–10. doi:10.1016/j.apgeog.2014.05.018.
Zenk, Shannon N., Amy J. Schulz, Teretha Hollis-Neely, Richard T. Campbell, Nellie
Holmes, Gloria Watkins, Robin Nwankwo, and Angela Odoms-Young. 2005. “Fruit
and Vegetable Intake in African Americans: Income and Store Characteristics.”
American Journal of Preventive Medicine 29 (1): 1–9.
doi:10.1016/j.amepre.2005.03.002.

80
CHAPTER FOUR: RESEARCH QUESTIONS AND HYPOTHESES
This chapter states and explains the main research questions and hypotheses for
this research project. The analyses are divided into four major components, each with its
own research question and hypotheses. The first two components are exploratory data
analyses of the spatial food landscape of Bangkok and of socio-demographic
characteristics of shoppers who choose to purchase their groceries at various store
formats. The remaining two components are inferential analyses, examining the
relationship of grocery destination choice with health behavior and obesity measure.
I: Spatial Analysis of Bangkok Food Landscape
Research Question
R1: What does the spatial food landscape in Bangkok look like?
To my knowledge, there exists no study on the general food landscape of
Bangkok. Spatial analysis in obesity research has only been receiving attention in the last
decade or so, in part, because much progress on the analysis software was made only in
recent years. The number, types, and proximity to food retail outlets may play an
important role in destination choice and subsequently health outcomes because of the
availability and accessibility of different types of foods. The literature has mixed results

81
with some studies finding a modest association between distance to grocery store and
weight status (Smith et al. 1998, Robert and Reither 2004) whereas other studies did not
find such association (Burdette and Whitaker 2004, Simmons et al. 2005). This section
aims to provide basic visualization of the food shopping scene in Bangkok.
Hypothesis
H1: Food retail outlets in Bangkok are not evenly distributed
Because this is a pioneer study attempting to examine Bangkok food landscape
with limited data, the hypothesis is a simple one. Existing Western research literature
suggests that most of the time grocery outlets are not evenly distributed, giving birth to
terms such as “food desert” and “food mirage” (defined in chapter 3). These imply
unequal access to nutrition for people living in different locales. Historically,
development patterns, certain economic and land-use policies are socioeconomically
discriminatory such that urban food resources are unevenly distributed (Eisenhauer 2001).
In the US, the common pattern is for supermarkets to locate in the suburbs where higher
income families reside while poor inner city residents have most readily access to
neighborhood stores and small food outlets with limited selections of fresh fruits and
vegetables (Ibid).
In Thailand, the situation is different as the country is still considered
agricultural-based. Fruits and vegetables are inexpensive and plentiful. Similar problems
of food deserts and food mirages may not be an issue, at least not yet. Rather, the market
appears to be bifurcated between modern and traditional food outlets (Kelly et al. 2014).

82
While this has been empirically observed, it has not been spatially analyzed. I
hypothesize that food retail outlets in Bangkok are not evenly distributed as the
supermarket revolution pattern is such that modern retailers concentrate in higher income
areas such as city centers before sprawling into lower income populations (Reardon et al.
2012). Traditional markets are not always registered with the city. So the count can vary
depending on what the data source is. It is, however, also hypothesized that they would
likely be crowded in the city center where it is more densely populated.
II: Socio-Demographic Analysis
Research Question:
R2: Is there any discrepancy in the sociodemographic characteristics of modern,
traditional, and mixed shoppers?
Past studies indicate significant differences in characteristics of people who shop
at different store formats. Regular patrons of department stores are likely to be younger,
more educated, and had higher incomes than occasional patrons (Crask and Reynolds
1978). Warehouse club members tend to be from upper socio-economic class, compared
to the general public (Sampson and Tiger 1992), and compared to supermarket shoppers
(Stone 1995). Fox et al. (2004) found that supermarkets receive more frequent visits and
per trip spending than mass merchandisers and drug stores. The same study also found
that patrons of mass merchandisers are least sensitive to travel time and supermarket
patrons are most sensitive to product assortment (Fox et al. 2004).

83
Similarly, people who choose to shop at modern retailers may have different
characteristics and values than those who shop at traditional retailers and those who shop
at both store formats. These three groups of shoppers may differ by: 1.) Individual
characteristics i.e., age, income, education, family size, type of residence, 2.) Individual
shopping behavior i.e., frequency, duration, and spending, 3.) Individual’s values with
regard to store characteristics i.e., product pricing, organization, availability of parking
space, and 4.) Health behavior i.e., smoking, drinking, and exercising frequency. For
example, those who shop at a modern retailer may be younger, spend less money per trip,
and be more concerned about facilities such as air-conditioning and parking space. Those
who shop at fresh markets may be more concerned about the personalized service and
opportunities to connect with their community and may live a more active lifestyle.
Those who shop at both store formats may have a larger family size to accommodate
their members’ diverse needs. They may also be more concerned about product quality
and therefore shop for different products at different stores. Many people believe fresh
produce at traditional markets are of higher quality than their supermarket counterpart
whereas supermarkets carry a much wider variety of imported goods.
Hypothesis
H2: The socio-demographic profile of consumers significantly influences their choice of
grocery destination
Empirical evidence suggests that sociodemographic factors such as age, gender,
educational attainment and income have significant influences in determining the food
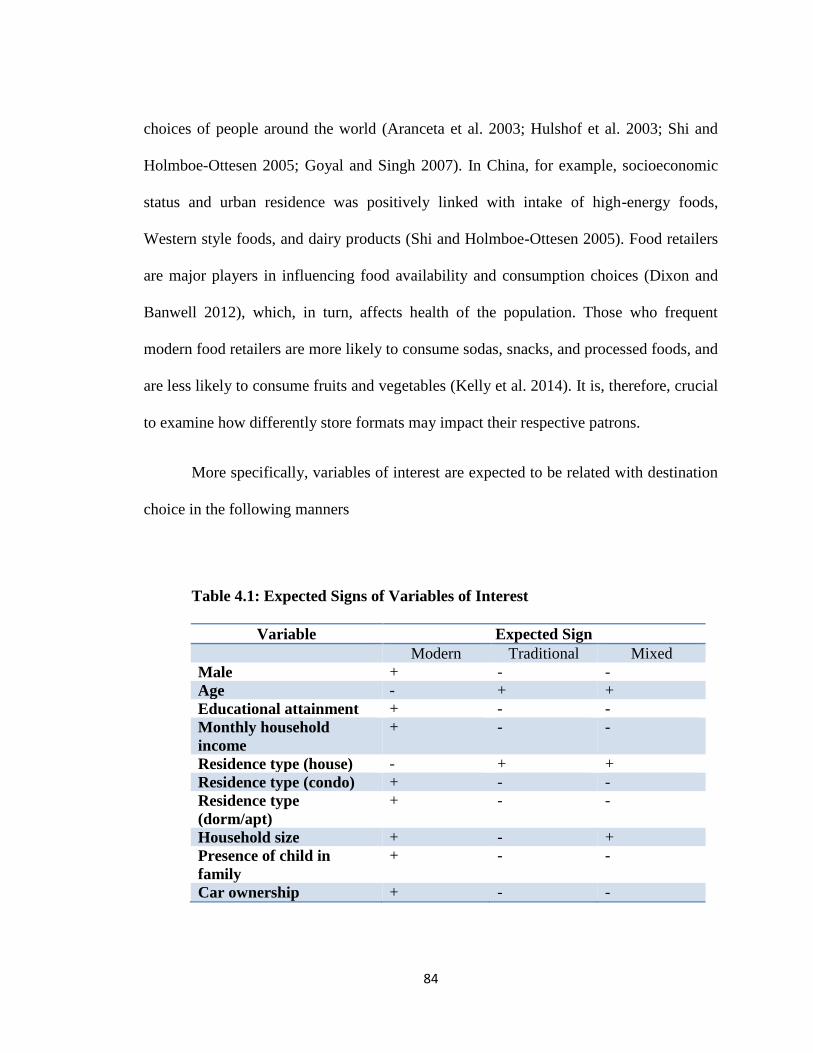
84
choices of people around the world (Aranceta et al. 2003; Hulshof et al. 2003; Shi and
Holmboe-Ottesen 2005; Goyal and Singh 2007). In China, for example, socioeconomic
status and urban residence was positively linked with intake of high-energy foods,
Western style foods, and dairy products (Shi and Holmboe-Ottesen 2005). Food retailers
are major players in influencing food availability and consumption choices (Dixon and
Banwell 2012), which, in turn, affects health of the population. Those who frequent
modern food retailers are more likely to consume sodas, snacks, and processed foods, and
are less likely to consume fruits and vegetables (Kelly et al. 2014). It is, therefore, crucial
to examine how differently store formats may impact their respective patrons.
More specifically, variables of interest are expected to be related with destination
choice in the following manners
Table 4.1: Expected Signs of Variables of Interest
Variable Expected Sign
Modern Traditional Mixed
Male + - -
Age - + +
Educational attainment + - -
Monthly household
income
+ - -
Residence type (house) - + +
Residence type (condo) + - -
Residence type
(dorm/apt)
+ - -
Household size + - +
Presence of child in
family
+ - -
Car ownership + - -

85
Being male is expected to be positively associated with being a modern shopper,
negatively associated with being a traditional shopper, and negatively associated with
being a mixed shopper. Men are comparatively more independent shoppers who do not
value personalized services that traditional markets offer. They are expected to be
negatively associated with being a mixed shopper because, compared with women, they
value convenience and time over good deals. For example, in the US, women are
significantly more likely to be deal seekers and coupon users (Harmon and Hill 2003).
Age is expected to be negatively associated with being a modern shopper,
positively associated with being a traditional shopper, and positively associated with
being a mixed shopper. Younger individuals are more likely to welcome change and to
try new shopping venues (Dixon et al. 2007). They are also more curious and receive
greater western cultural influence in other aspects of life through the media. Older
individuals are more likely to be traditional shopper because they are set in their ways
and are more inclined to opt for familiar things (Trappey and Lai 1997). At the same time,
however, modern retailers are doing more in an attempt to attract older customers such as
selling pre-packaged offerings for monks and holding daily aerobic sessions.
Educational attainment is expected to be positively associated with being a
modern shopper, negatively associated with being a traditional shopper, and negatively
associated with being a mixed shopper. Educated consumers are more likely to demand
greater product information and value convenience. They are more likely to desire and
understand the importance of nutrition labels (Rimal et al. 2008). They also tend to have
higher purchasing power and be more open to trying new unfamiliar store settings and

86
products. I, thus, hypothesize that educated consumers would be more likely to shop at
modern retailers and less likely to shop at traditional markets. As they are also likely to
value convenience, I would also be less likely to be mixed shoppers.
Monthly household income is expected to be positively associated with being a
modern shopper, negatively associated with being a traditional shopper, and negatively
associated with being a mixed shopper. High income earners are likely to be time-poor
and value convenience. They want to be able to navigate their way quickly to the items
they need and receive fast service at check-out (Kenhove and De Wulf 2000). Modern
retailers are more accommodating to such demands because their organizations of
products and aisles do not vary much from store to store within the same chain.
Customers also pay once at the end of their shopping trip instead of paying for each stall
owner at traditional markets. They are then hypothesized to prefer modern retailers where
they can purchase both grocery and non-grocery items and spend less number of trip and
less time finding their desired items. The products are more organized than at traditional
markets, making them easier to find.
Living in a house is expected to be negatively associated with being a modern
shopper, positively associated with being a traditional shopper, and positively associated
with being a mixed shopper. Substantial number of house residents has live-in maids,
especially in Bangkok where the general populations earn higher income than the rest of
Thailand. The maids usually do the grocery shopping at traditional markets while
occasionally the family members shop for Western items at modern retailers.

87
Living in a condominium is expected to be positively associated with being a
modern shopper, negatively associated with being a traditional shopper, and negatively
associated with being a mixed shopper. Condominium dwellers usually live alone or with
few members and face limited storage. University students who live away from home
develop unhealthy dietary habits such as increasing sugary beverage and processed food
consumption (Papadaki et al. 2007). I hypothesize that they would be more likely to value
convenient foods with little preparation time and excess that needs storage. They are, thus,
expected to shop primarily at modern retailers.
By the same line of argument with condominium dwellers, those who live in a
dormitory or an apartment setting are expected to be positively associated with being a
modern shopper, negatively associated with being a traditional shopper, and negatively
associated with being a mixed shopper.
Household size is expected to be positively associated with being a modern
shopper, negatively associated with being a traditional shopper, and positively associated
with being a mixed shopper. Modern retailers offer a one-stop shop for many families for
grocery and non-grocery items. People are thus able to forego traditional markets. The
same is not true with the traditional sector as they offer much smaller selections of
products. Meanwhile, some households who prefer to shop at both formats may become
mixed shoppers to serve family members’ needs.
Presence of a child (or children) in the household is expected to be positively
associated with being a modern shopper, negatively associated with being a traditional
shopper, and negatively associated with being a mixed shopper. Children are likely to be

88
attracted to the comfort of air conditioning, western snacks, and fun playground that
modern retailers offer. Traditional markets are not known to be children-friendly place.
Parents are likely to want to double-purpose their grocery shopping trip as an excursion
for their children.
Car ownership is expected to be positively associated with being a modern
shopper, negatively associated with being a traditional shopper, and negatively associated
with being a mixed shopper. Modern retailers usually have parking arrangements for their
customers whereas traditional markets usually do not. Those who own a car are likely to
want to drive to grocery store rather than taking public transportation because of the
convenience of loading and unloading grocery items to and from a private vehicle.
III: Grocery Destination Choice and Health Behavior
Research Question:
R3: Is there a correlation between grocery destination choice, shopping frequency, and
health behavior?
Grocery destination choice and shopping frequency may have influential effects
on consumers’ health behaviors. Health behavior is defined as any activity undertaken by
a person that may affect their health positively or negatively. By making processed-foods
more accessible and affordable, supermarkets play a role in consumer choice. Marketing
tools such as promotions and advertisements are used to drive up the demand for such
products, influencing change in population dietary patterns and allowing supermarkets to
expand further (Hawkes 2008). The media, in its various forms, is a powerful tool in

89
disseminating nutrition and health information. The quality, reliability, and the amount of
information that reach the consumers, however, are difficult to determine. The time use
survey 2009, conducted by the National Statistical Office, revealed that Thais ages 10
and over spend on average 2.9 hours per day on mass media. People at the ends of the
educational spectrum, those with no education and those with more than high school
education, spend over 3 hours daily on mass media (NSO 2009).
A study on values and preferences of fresh market shoppers and supermarket
shoppers in Chiang Mai, Thailand, revealed stronger preferences for rice among regular
fresh market shoppers. Whereas 100% of fresh market shoppers in the sample reported
preferences for rice, a small number of supermarket shoppers displayed preferences for
bread and wheat noodles (Isaacs et al. 2010).
The frequency at which one shops at a particular format grocery store may also
alter one’s lifestyle. Kelly et al. looked at food shopping at supermarkets and its
relationship to processed food consumption and health, using a subsample of the Thai
Cohort Study (TCS) conducted in 2005 and 2009. The original survey had wide-ranging
questions related to health-risk behaviors. The authors sent out another survey to a
subsample of these participants in 2012 regarding local food environments, food
provisioning patterns, and dietary intake (Kelly et al. 2014). They found an association
between frequent modern grocery store visits and consumption of “problem foods” (soft
drinks, snack foods, processed meats, western style bakery items, instant foods, and deep
fried foods) while frequent fresh market shopping was linked to increased vegetable

90
intake. The authors also found a link between grocery destination choice and
hyperlipidemia, but not with BMI, diabetes, or hypertension (Kelly et al. 2014).
H3: Modern grocery shoppers will demonstrate a greater level of undesirable health
behaviors than traditional market shoppers and mixed shoppers.
In developing countries such as Thailand, modern grocery retailers enter the
market first with processed foods and dry ingredients for which they have economy of
scale advantage over the traditional sector (Reardon and Berdegue 2006). These
processed foods are often palatable and high in fat and sugar while lacking fiber and
essential micronutrients. They are also foods of convenience such as frozen meals and
bakery items. Such products discourage home cooking and are often associated with
sedentary behavior such as television watching (French et al. 2001). Marketing strategies
such as pricing promotion, point-of-purchase posters, product placement, and targeting of
children prompt impulse purchases of sugary beverages, sweets, and other unhealthy
items (Zhou and Wong 2004).
Hypermarkets, the most common modern store format in Bangkok, usually have
food courts, children playground, and popular fast food restaurants while traditional
markets do not offer such options. Modern shoppers, exposed to these attractions, are
expected to be more likely to engage in dining out and fast food experiences.
H4: Those who frequent modern grocery retailers will demonstrate greater level of
undesirable health behavior than those who do not frequent modern grocery retailers.

91
Modern shoppers are more likely to be exposed to processed foods, Western
snacks, sweet drinks, and fast food restaurants. Although marketing strategies can be
used to promote purchases and consumption of healthy food items, they are more often
used to promote “fun” food laced with sugar, fats, and refined grains. These items are
palatable, convenient, and inexpensive. They are also energy-dense and less satiating
according to lab studies, which can result in passive overeating and weight gain
(Drewnowski and Darmon 2005). Because those who frequent modern retailing
establishments encounter these factors that encourage undesirable health behavior, it is
likely that they will demonstrate greater level of such behaviors.
IV: Grocery Destination Choice and Obesity
Research Question:
R4: Is there a correlation between grocery destination choice, shopping frequency, and
obesity measures?
In developed countries, food availability and presence of supermarkets have been
investigated as possible determinant of diet and subsequently lifestyle diseases such as
diabetes and cardiovascular diseases, of which obesity is a major risk factor (Eisenhauer
2001, Fitzgibbon et al. 2005, Story et al. 2008, Morland et al. 2002). The direction in
which grocery shopping destination choice influences diets and subsequently health is
unclear. While studies on food environment are plentiful, studies on where one shop and
the link to health are far and few between. In the US, Inagami et al. showed that an
individual’s grocery destination choice is a significant determinant of one’s BMI

92
(Inagami et al. 2006). Those who shopped at stores in lower-SES neighborhoods than one
they lived in showed higher BMI than those who shopped in their own neighborhood
(Ibid). In Guatemala, a study links supermarket purchases to an increase in consumption
of processed food. Supermarket shopping is also significantly associated with BMI of
household members (Asfaw 2008). In Tunisia, a different study found the opposite effect
linking supermarket shopping to improved diet quality (Tessier et al. 2008). The
difference in the direction of influence is likely due in part to the discrepancies in levels
of economic development, modern retailing penetration, and cultural factors of different
countries.
Hypotheses
H5: Those who shop primarily at modern grocery retailers will score higher on obesity
measures than those who shop primarily at traditional markets and those who shop at
both equally.
As previously stated, modern retailers expose customers to marketing strategies that
encourage purchases of processed foods, Western snacks, bakery items, and other
palatable unhealthy foods. These items are convenient and attractive especially to time-
poor shoppers, single-person households, and families with children. They often are
ready-to-eat or require little preparation time while boasting long shelf life. The obesity
epidemic in the US is believed to be driven in large part by the increase in consumption
of these food items. Traditional markets, on the other hand, offer mostly fresh fruits and
vegetables. Although you do see some processed foods such as sausages and bakery
items, they are not primary products in the traditional sector. It is, therefore, likely that

93
those who shop primarily at modern grocery retailers will score higher on obesity
measure than traditional and mixed shoppers who do not face the same level of exposure
to unhealthy foods.
H6: Those who frequent modern grocery retailers will score higher on obesity measures
than those who frequent fresh markets
By the same line of argument, the more frequent shoppers are exposed to factors that
encourage the purchase of unhealthy foods, eating out, and consumption of fast food, the
more likely they are to be overweight or obese.
Conclusion
Four research questions and six hypotheses have been proposed and explained in
this chapter. The first two research questions and their pertinent hypotheses are
exploration of data whereas the remaining research questions and hypotheses are more
analytical in nature. Because there is a lack of literature in this field for the Southeast
Asia region, supporting arguments often are drawn from Western literature and from
developing areas outside of Southeast Asia and are to be tested in the following chapters
with appropriate mathematical models.

94
REFERENCES
Aranceta, J., C. Pérez-Rodrigo, L. Ribas, and Ll Serra-Majem. 2003. “Sociodemographic
and Lifestyle Determinants of Food Patterns in Spanish Children and Adolescents:
The enKid Study.” European Journal of Clinical Nutrition 57 (S1): S40–44.
doi:10.1038/sj.ejcn.1601813.
Asfaw, Abay. 2008. “Does Supermarket Purchase Affect the Dietary Practices of
Households? Some Empirical Evidence from Guatemala.” Development Policy
Review 26 (2): 227–43.
Burdette, Hillary L, and Robert C Whitaker. 2004. “Neighborhood Playgrounds, Fast
Food Restaurants, and Crime: Relationships to Overweight in Low-Income
Preschool Children.” Preventive Medicine 38 (1): 57–63.
doi:10.1016/j.ypmed.2003.09.029.
Crask, M., and F. Reynolds. 1978. “An Indepth Profile of the Department Store Shopper.”
Journal of Retailing 54 (2): 23–33.
Dixon, Jane, Cathy Banwell, Sam-ang Seubman, Wundee Kanponai, Sharon Friel, and
Robert MacLennan. 2007. “Dietary Diversity in Khon Kaen, Thailand, 1988-2006.”
International Journal of Epidemiology 36: 518–21.

95
Drewnowski, Adam, and Nicole Darmon. 2005. “The Economics of Obesity: Dietary
Energy Density and Energy Cost.” The American Journal of Clinical Nutrition 82
(1): 265S–273S.
Eisenhauer, Elizabeth. 2001. “In Poor Health: Supermarket Redlining and Urban
Nutrition.” GeoJournal 53 (2): 125–33. doi:10.1023/A:1015772503007.
Fitzgibbon, Marian L., Melinda R. Stolley, Linda Schiffer, Lisa A. P. Sanchez-Johnsen,
Anita M. Wells, and Alan Dyer. 2005. “A Combined Breast Health/weight Loss
Intervention for Black Women.” Preventive Medicine 40 (4): 373–83.
doi:10.1016/j.ypmed.2004.06.018.
Fox, Edward J., Alan L. Montgomery, and Leonard M. Lodish. 2004. “Consumer
Shopping and Spending across Retail Formats.” The Journal of Business 77 (S2):
S25–60. doi:10.1086/jb.2004.77.issue-s2.
French, Simone A., Mary Story, and and Robert W. Jeffery. 2001. “Environmental
Influences on Eating and Physical Activity.” Annual Review of Public Health 22 (1):
309–35. doi:10.1146/annurev.publhealth.22.1.309.
Goyal, Anita, and N.P. Singh. 2007. “Consumer Perception about Fast Food in India: An
Exploratory Study.” British Food Journal 109 (2): 182–95.
doi:10.1108/00070700710725536.
Harmon, Susan K., and C. Jeanne Hill. 2003. “Gender and Coupon Use.” Journal of
Product & Brand Management 12 (3): 166–79. doi:10.1108/10610420310476924.

96
Hawkes, Corinna. 2008. “Dietary Implications of Supermarket Development: A Global
Perspective.” Development Policy Review 26 (6): 657–692. doi:10.1111/j.1467-
7679.2008.00428.x.
Hulshof, K. F. a. M., J. H. Brussaard, A. G. Kruizinga, J. Telman, and M. R. H. Löwik.
2003. “Socio-Economic Status, Dietary Intake and 10 Y Trends: The Dutch National
Food Consumption Survey.” European Journal of Clinical Nutrition 57 (1): 128–37.
doi:10.1038/sj.ejcn.1601503.
Inagami, Sanae, Deborah A. Cohen, Brian Karl Finch, and Steven M. Asch. 2006. “You
Are Where You Shop: Grocery Store Locations, Weight, and Neighborhoods.”
American Journal of Preventive Medicine 31 (1): 10–17.
doi:10.1016/j.amepre.2006.03.019.
Isaacs, Bronwyn Alison, Jane Dixon, and Cathy Banwell. 2010. “Fresh Market to
Supermarket: Nutrition Transition Insights from Chiang Mai, Thailand.” Public
Health Nutrition 13 (6): 893–897. doi:10.1017/S1368980009993260.
Kelly, Matthew, Sam-Ang Seubsman, Cathy Banwell, Jane Dixon, and Adrian Sleigh.
2014. “Thailand’s Food Retail Transition: Supermarket and Fresh Market Effects on
Diet Quality and Health.” British Food Journal 116 (7): 1180–93.
Kenhove, Patrick Van, and Kristof De Wulf. 2000. “Income and Time Pressure: A
Person-Situation Grocery Retail Typology.” The International Review of Retail,
Distribution and Consumer Research 10 (2): 149–66.
doi:10.1080/095939600342334.

97
Morland, Kimberly, Steve Wing, Ana Diez Roux, and Charles Poole. 2002.
“Neighborhood Characteristics Associated with the Location of Food Stores and
Food Service Places.” American Journal of Preventive Medicine 22 (1): 23–29.
Papadaki, Angeliki, George Hondros, Jane A. Scott, and Maria Kapsokefalou. 2007.
“Eating Habits of University Students Living At, or Away from Home in Greece.”
Appetite 49 (1): 169–76. doi:10.1016/j.appet.2007.01.008.
Tessier, Sophie, Pierre Traissac, Bernard Maire, Nicolas Bricas, Sabrina Eymard-
Duvernay, Jalila El Ati, and Francis Delpeuch. 2008. “Regular Users of
Supermarkets in Greater Tunis Have a Slightly Improved Diet Quality.” The Journal
of Nutrition 138 (4): 768–74.

98
CHAPTER FIVE: DATA AND METHOD
Quantitative analysis methods using secondary and primary data are presented in
this chapter. Mapping and spatial data retrieved online are used in Bangkok food
landscape exploratory analysis. Primary data are used in subsequent analysis at the
individual level. They were collected in collaboration with Theptarin Hospital, a private
healthcare organization located in Bangkok Thailand in two waves, in the summer of
2014 and the summer of 2015, together yielding a total of 510 usable questionnaires and
observations.
I: Description of Data
Subsection 1.1: GIS Mapping Data
a.) Boundary data
The area of study was mapped using district-level shape files available on BangkokGIS
website.

99
Figure 5.1: area of study Figure 5.2: area of study as GIS layer
While Bangkok, in some studies, may refer to the city of Bangkok and its peripheral
suburban areas, this study restricts the analyses to the 50 districts of Bangkok for the ease
of defining boundaries. The 50 districts include
Bang Bon, Bang Kapi, Bang Khae, Bang Khen, Bang Kho laen, Bang Khun thain, Bang
Na, Bang Phlat, Bang Rak, Bang Sue, Bangkok Noi, Bangkok Yai, Bueng Kum, Chatu
Chak, Chom Thong, Din Daeng, Don Mueang, Dusit, Huai Khwang, Khan Na Yao,
Khlong Sam Wa, Khlong San, Khlong Toei, Lak Si, Lat Krabang, Lat Phrao, Min Buri,
Nong Chok, Nong Khaem, Parthum Wan,Phasi Charoen, Phaya Thai, Phra Khanong,
Phra Nakhon, Pom Prap Sattru Phai, Pra Wet, Rat Burana, Ratchathewi, Sai Mai,
Samphanthawong, Saphan Sung, Sathon, Suanluang, Taling Chan, Thawi Watthana,
Thon buri, Thung khru, Vadhana, Wang Thong Lang, Yan na wa
b.) Grocery Store Data
Modern Retailers
Modern grocery retailers, in this study, refer to western-format food stores
including hypermarkets, supermarkets, and convenience stores. The difference between
convenience stores and the other two formats, hypermarkets and supermarkets, is obvious

100
due to the sheer size disparities. Few people, however, know the difference between
hypermarkets and supermarkets. As such, the two store formats are treated as one in this
study.
While hypermarkets and supermarkets are represented by point data, convenience
stores’ specific locations are not captured in this study due to its overwhelming presence
of 2,974 stores in Bangkok. The data on convenience stores are retrieved from district
offices and joined to district polygons. The three biggest hypermarket and supermarket
chains in Bangkok are BigC, Tesco Lotus, and Tops. They have the highest sales-
volumes and are most popular among Thai consumers. The locations of these chain stores
were retrieved from their websites. A total of 88 addresses were manually geocoded
using GIS coordinates obtained from freegeocoder.com. The coordinates were input into
an excel spreadsheet that was then imported into ArcMap and projected onto the
boundary file.
Traditional Market
Traditional markets are open-air markets where meat and fresh produce are traded
without modern day packaging and refrigeration. There are small stalls selling various
products, many of them identical. The stalls are owned by mostly the person selling the
meat or produce. Data on traditional market locations were downloaded in shape file
format from BangkokGIS.com and projected onto the boundary file. There are 148
traditional markets in record.
101
Population Density
Population size is important to the analyses of the food retail landscape as they
form the customer base of grocery outlets. The data were obtained in excel file format
from the Bureau of Registration Administration which I imported to ArcGIS and joined
them to boundary data layer for analysis.
Subsection 1.2: The Grocery Shopping and Health Survey and Data Collection
In the summer of 2014, a convenience sample that included 344 hospital
employees was selected to fill out a questionnaire after their annual health check-up
which included a body composition analysis. The survey is adapted from the US National
Health and Nutrition Examination Survey (NHANES) and the Flexible Consumer
Behavior survey. A content analysis has been conducted with the help of professional
nutritionists in Thailand to validate its cultural relevancy. The following summer, in 2015,
additional data sites were chosen including Kukkai elementary school where 58 teachers,
administrators, and other personnel were recruited and True Corporation, a
telecommunication company, where 174 individuals participated. Grocery shopping
behavior, health behavior, and sociodemographic data were collected using a survey
questionnaire. The survey included 35 questions on grocery shopping routine, 18
questions on dietary and health behavior, and 12 questions on demography. In return,
participants received a brief health check-up that included a bioelectrical impedance body
composition analysis where we obtained their obesity measures, namely body mass index
(BMI), percent body fat (PBF), waist circumference (WC), visceral fat (VF), and waist-
hip ratio (WHR). The survey document is presented in Appendix A.

102
c.) Grocery shopping behavior data
Grocery shopping behavior data are individual-level. Respondents fill out a
survey on their grocery shopping experience that includes questions on their destination
choice, frequency and duration of shopping, average spending per trip, mode of
transportation, items purchased at different types of stores, and factors that they consider
in choosing a grocery store. Refer to Appendix A for a full questionnaire.
Questions selected for use in this study are
(Q1):
What is your primary grocery shopping store/market? Please give the name and
location (ie. Lotus, Rama 4 Rd. or Klongtoey Market)
*This was an open ended question that was later coded as:
1 for modern grocery retailers
2 for traditional markets, and
3 for those who shop equally at both store formats
(Q6-15):
On a scale of 1-5, 5 being “very important” and 1 being “not at all important,” How
important is each of the following grocery store characteristics when you shop?
Level of Importance
Highest Lowest
6. Pricing 5 4 3 2 1
7. Convenience of location 5 4 3 2 1
8. Facilities including parking lots and air conditioner 5 4 3 2 1
9. Store promotions 5 4 3 2 1
10. Store cleanliness and organization 5 4 3 2 1
11. Store product quality 5 4 3 2 1
12. The assortment of different brands and products 5 4 3 2 1
13. Store service; helpfulness, availability, and friendliness
of staff
5 4 3 2 1
14. Availability of product in large-size packaging 5 4 3 2 1
15. Opportunity to connect with the local community 5 4 3 2 1

103
(Q16, 18, 19)
How often do you shop for food items at the following grocery outlets?
Less
than
once a
month
Once a
month
1-2
times a
week
3-4
times a
week
More
than 4
times a
week
16. Hypermarket/Supermarkets (ie.
Lotus, Big C, Tops, Gourmet)
18. Convenience stores (7-eleven,
Family Mart)
19. Traditional wet markets
(Q. 21, 23, 24)
How much do you spend on average per shopping trip at each of the following
places?
21. Hypermarket/Supermarkets (ie. Lotus, Big C, Tops, Gourmet)
____________ baht
23. Convenience stores (7-eleven, Family Mart)
____________ baht
24. Traditional wet markets
____________ baht
d.) Health behavior data
Health behavior data are individual level 7-day recall. Participants indicate how
many days they engaged in certain diet and health-related behavior in the past 7 days.
Selected for use in this study are (Q36-48)

104
How many days in the past 7 days did you do the following?
Number of days in the past 7 days
36. Have breakfast at home 0 1 2 3 4 5 6 7
37. Have breakfast elsewhere (not at home) 0 1 2 3 4 5 6 7
38. Have dinner that is prepared at home 0 1 2 3 4 5 6 7
39. Eat at restaurants for dinner (excluding cafeterias
and food courts)
0 1 2 3 4 5 6 7
40. Eat at fast food or pizza restaurants (KFC,
McDonalds, Pizza Hut)
0 1 2 3 4 5 6 7
41. Have food or fruits purchased from street stalls 0 1 2 3 4 5 6 7
42. Have fruits or Thai snacks between meals 0 1 2 3 4 5 6 7
43. Have Western snacks between meals (ie. potato
chips, pastries)
0 1 2 3 4 5 6 7
44. Drink soda or other sugary drinks (juice, energy
drinks, sweet tea)
0 1 2 3 4 5 6 7
45. Smoke cigarettes 0 1 2 3 4 5 6 7
46. Drink alcoholic beverages (liquor, beer, cocktails) 0 1 2 3 4 5 6 7
47. Be physically active for more than 60 minutes per
day (add up all the time that increase heart rate and
make you breathe hard some of the time)
0 1 2 3 4 5 6 7
48. Spend more than 8 hours sitting (at work, at home,
in a car, on a bus)
0 1 2 3 4 5 6 7
e.) Grocery store data
Grocery store data are store-level. Modern and traditional grocery outlets are
evaluated for their availability and affordability of healthy food options such as low-fat
milk, whole-grain bread, and green vegetables.
A food store assessment criteria adapted from the validated Nutrition
Environment Measures Survey (NEMS) will be used to score each store between 0 to 27
points. A healthy food availability index (HFAI) will be determined according to the
assessment. A content analysis has been conducted with the help of professional
nutritionists in Thailand to validate its cultural relevancy. The researcher sampled grocery
105
store outlets of various formats to complete the evaluation form. Refer to Appendix B for
an evaluation form.
f.) Health outcomes data
Health outcomes data are individual-level. Specific outcomes collected are
measures of obesity including BMI, percent body fat, waist circumference, visceral fat,
and waist-hip ratio. The Bioelectrical Impedance Analysis (BIA) was used to determine
body composition. BIA measures total body water (TBW) by sending a low electric
current through body tissues. TBW can, in turn, be used to calculate body fat and muscle
mass. BIA has been widely used clinically for nutrition and weight management purposes.
The data obtained were matched with consumer behavior data from the survey for
analysis. Refer to Appendix C for a body composition analysis sample.
Subsection 1.3: Definitions of Grocery Retailers
While there are numerous types of grocery store outlets in Bangkok, the present
study focuses on four major types, one traditional and four Western-style markets. This
section briefly describes each type of grocery outlet.
a.) Traditional retailers
Fresh market – Also known as open-air markets and wet markets. A collection of
stalls commonly found in Asian countries where live animals, meat,
and fresh produce are sold out in the open with no refrigeration and
minimal packaging. Sizes vary from market to market as do
sanitation and organization.

106
b.) Modern retailers
Hypermarket – Also known as supercenter and superstore. Large size retailer
typically between 8,000 to 15,000 m2 in space, carrying a large
product variety with in-store bakeries and pharmacy. The average
size for hypermarkets in Bangkok is 8500 m2. This type of retailers
also rent out space in the mall area to independent small stores
selling clothing, food, mobile phones, etc. The biggest players in
Thailand are Tesco Lotus and Big C.
Supermarket – Typically ranging between 400 to 2,500 m2, carrying all major
household goods, food and non-food items, and some personal care
products. In Bangkok, the most common supermarket chain is Tops
and is usually situated within a department store.
Convenience store – Small stores of approximately 80 m2 carrying essential every day
products and open long hours. Many are open 24 hours. The most
common chains in Thailand are Seven-Eleven and Family Mart. The
number of convenience stores has been rising rapidly. As of 2012,
the Thai Retail Association reported there were 12,246 convenience
stores in Thailand, each serving about 3,000 households, compared
to 10,000 households when it was first introduced in 1989.

107
Subsection 1.4: Sample Populations
The target population for this dissertation is working individuals living in
Bangkok. The sampling frame is limited by the need for health outcome data which
requires an on-site body composition analysis. There were 510 usable surveys in total
from 130 male and 383 female participants between ages of 17 and 65. Overall, the
sample is slightly younger and has lower household income, but much more educated
than the underlying Bangkok working age population. The sample’s average age is 35
with household income between 10,000-30,000 baht per month whereas the largest age
group of working population in Bangkok is 40-49 years old with average household
income of 43,058 baht per month (NSO 2013). As much as 72% of the sample holds a
bachelor’s degree or higher, compared with 35% of Bangkok population ages 15 and over
(NSO 2015). It is suspected that this is due to the points of data collection and the
interest in study participation. One of the venues of data collection was a mobile phone
application development office of a large telecommunications company. It is known that
this sector of the industry attracts primarily younger individuals. Though participation in
the study was open not only to desk workers but also to housekeepers, security guards,
and others, those make up a small portion of the sample. In addition, some people with
lower education were not proficient readers and had difficulty filling out the survey.
More educated individuals are also thought to be more health conscious and interested in
getting a health check-up in general. Lastly, older individuals who are more likely to hold
managerial positions may be more occupied with work and less interested in events such
as this.

108
Table 5.1: Socioeconomics of Respondents and General Bangkok’s Working
Population (Census Data)
Survey Census
(2015)
Median age 26 40-49
Average household size 2.7 2.7
Educational Attainment (of
employed persons 2013)
Primary or less 3.94% 29%
Junior HS 2.36% 13.9%
HS 12.6% 16.7%
Vocational 9.06% 4.9%
Bachelor’s and higher 72.05% 35%
Household income (baht/month) 10,000-30,000 43,058
II: Description of Methods and Model
The analysis for this dissertation will be in 4 parts. The first two parts are
exploratory analysis of the food retail landscape and consumer characteristics of each
store format. The third part investigates the relationship between health behavior,
shopping destination, and shopping frequency. Finally the fourth part relates destination
choice and shopping frequency with obesity measures.
Subsection 2.1 Average Nearest Neighbor Distance (NND) and Moran’s I Spatial
Analysis
To get an understanding of what the food retail landscape in Bangkok looks like, I
use the Geographic Information Systems to conduct an Exploratory Spatial Data Analysis
(ESDA). In public health, GIS methods have been most widely used to determine

109
disparities in access to healthcare (McLafferty 2003). The utilization of GIS to analyze
local food environment is a relatively recent phenomenon, but is one that is becoming
increasingly common as spatial data are more readily available and GIS software
capability improves (Thornton et al. 2011).
Local food environments are often assessed in terms of proximity and/or density.
A review of GIS methods in food environment analysis was published in 2010. The study
found that measuring Euclidean distance or travel times to the closest food store are the
most common approaches to assess proximity. The buffer method, kernel density
estimation, and spatial clustering are used to assess density of grocery stores (Charreire et
al. 2010).
Limited by the availability of data, this section of the study uses the Average
Nearest Neighbor Distance (NND) and Moran’s I methods of spatial clustering to
determine the density of modern food retailers and traditional markets. Both methods
evaluate whether food stores are randomly distributed within the study area. The analysis
of supermarkets and traditional markets are conducted using point data and the NND
approach for accuracy of location. The downfall of this method being that the population
density is not taken into account. Convenience store data are available as district-level
areal data which is less accurate than point location but allows for the integration of
population density information. This part of the analysis will be conducted using the
Moran’s I method.

110
Calculations
The Average Nearest Neighbor ratio is defined as:
𝐴𝑁𝑁 =��0
��𝐸
where ��0 is the observed mean distance between each feature (grocery outlet) and their
nearest neighbor:
��0 =∑ 𝑑𝑖
𝑛𝑖=1
𝑛
and ��𝐸 is the expected mean distance for the features in a random pattern:
��𝐸 =0.5
√𝑛/𝐴
𝑑𝑖 represents the distance between feature i and its nearest neighbor
n represents the total number of features, and
A is the total study area
The Z-score is calculated as follows
𝒛𝑨𝑵𝑵 = ��𝟎 − ��𝑬
𝑺𝑬
Where
𝑺𝑬 = 𝟎. 𝟐𝟔𝟏𝟑𝟔
√𝒏𝟐/𝑨
The z-score is then translated into p-value, similar to regression analyses. Significant p-
value would suggest a pattern that is significantly different from random.

111
Subsection 2.2: Shopper Group Characteristics (ANOVA, Chi-Squares, and
Independent t-tests)
This step examines factors affecting grocery destination choice at the individual
level of influence according to the ecological perspective. Series of chi-square and
ANOVA tests are to be conducted to determine these differences between shoppers in
groups a, b, and c while independent t-tests will examine car owners and non-car owners.
Given that the median grocery shopping frequency of the sample is 1-2 times a week, the
following definitions are used in the analysis. The categories are mutually exclusive.
Table 5.2: Shopper Group Definitions
A. Traditional retailer
shoppers
those who visit hyper/supermarkets at least once
a week and visit traditional markets less than
once a week on average
B. Modern retailer
shoppers
those who visit traditional open-air markets at
least once a week and visit hyper/supermarkets
less than once a week on average
C. Mixed shoppers those who visit both hyper/supermarkets and
traditional open-air markets at least once a week
on average

112
Table 5.3: The Categorical Variables Tested using the Chi-square Test
Shopper’s
Characteristics
Categories
Male male
female
Age group <30
30-44
45-60
60+
Education primary or less
junior high school
high school
vocational
bachelor’s degree
master’s degree or higher
Income group <10,000 baht/month
10,000-30,000 baht/month
30,001-50,000 baht/month
50,001-100,000 baht/month
>100,000 baht/month
Type of residence house
condo
dorm/apartment
Household size Live alone
2 family members
3 family members
4 family members
5 or more family members*
Child in family Yes
No
Car ownership Yes
No
Store’s Characteristics
(Importance of)
Categories
Price Most important
Very important
Neutral
Somewhat important
Least important
Location Most important

113
Very important
Neutral
Somewhat important
Least important
Amenities (parking, air
conditioning, etc.)
Most important
Very important
Neutral
Somewhat important
Least important
Promotion (sale) Most important
Very important
Neutral
Somewhat important
Least important
Cleanliness and
organization
Most important
Very important
Neutral
Somewhat important
Least important
Product quality Most important
Very important
Neutral
Somewhat important
Least important
Product variety Most important
Very important
Neutral
Somewhat important
Least important
Service Most important
Very important
Neutral
Somewhat important
Least important
Family size packages Most important
Very important
Neutral
Somewhat important
Least important
Community relationship
(opportunity for)
Most important
Very important
Neutral
Somewhat important
Least important

114
The null hypothesis for each variable is that there is no significant difference
between groups. As an example, the following is null hypothesis for the variable gender.
H0: µa = µb: There is no significant difference in the gender distribution between
groups a, b, and c.
Analysis of Variance (ANOVA)
Table 5.4: The variables to be tested using ANOVA
Shopping Behavior Type
Spending per trip to
supermarket
Continuous
Spending per trip to traditional
market
Continuous
Spending per trip to
convenience store
Continuous
Shopping duration per trip Continuous
Travel time per trip Continuous
The null hypothesis for each variable is that the means are the same for all
shopper groups. As an example, the following is the null hypothesis for the variable age.
H0: µa = µb = µc: The mean age of shoppers is the same across groups a, b, and c.
ANOVA tests for an overall difference between groups a, b, and c, but it does not
indicate which specific groups differ. Should ANOVA show statistical significance, the
Sidak, Bonferroni, and Scheffe post-hoc tests will be conducted to confirm where the
differences occur between groups.

115
Independent t-test
The independent t-tests will be used to examine the differences between
car owners and non-car owners on the following variables
Table 5.5: Variables to be Tested by Independent T-Tests
Shopping Behavior Type
Supermarket Shopping
Frequency
Ordinal
Traditional Market
Shopping Frequency
Ordinal
Convenience Store Shopping
Frequency
Ordinal
Spending per trip to the
supermarket
Continuous
Spending per trip to
traditional market
Spending per trip to
convenience store
Continuous
Subsection 2.3: Grocery Destination and Health Behavior (Negative Binomial
Regression)
This section of the analysis uses the negative binomial regression to observe the
relationship between the number of days a subject engages in certain health behaviors
and their shopping behaviors. The model was selected based on the nature of the
dependent variable being count data and pre-hoc and post-hoc goodness-of-fit tests.
Discrete count data containing high number of zero values are typically fitted into

116
Poisson or negative binomial distribution as they are not normally distributed. The
Poisson distribution assumes that the mean and variance are equal. Data sometimes
contain variation that is greater than the mean, resulting in over-dispersion and standard
errors could be biased. The negative binomial regression relaxes this assumption and
adjusts the variance independently from the mean.
The Poisson probability distribution is as follows
Pr(𝑌 = 𝑦|𝜆) =𝑒−𝜆𝜆𝑦
𝑦! for y = 0,1,2,…
Where
λ represents both the mean and the variance
The negative binomial distribution relaxes the mean equal variance assumption such that
Pr(𝑌 = 𝑦|𝜆, 𝛼) =ᴦ(𝑦 + 𝛼−1)
𝑦! ᴦ(𝛼−1)(
𝛼−1
𝛼−1 + 𝜆)
𝛼−1
(𝜆
𝛼−1 + 𝜆)
𝑦
Where
λ represents the mean of the distribution
α represents the over dispersion parameter
Note that the Poisson distribution only has one parameter, λ, whereas the negative
binomial has two parameters, λ and α. When α = 0, the negative binomial distribution is
exactly the same as the Poisson distribution.
Diagnostic tests reveal that for this study, the negative binomial regression is the
better model. Histograms of the dependent variables show that none of the variables is
normally distributed. Most variables are skewed to the right with high number of zero

117
values. Poisson and negative binomial regressions are typically used to analyze such data.
The mean-equal-variance test, goodness-of-fit test, and the likelihood ratio test of alpha
all indicate that the negative binomial, which is less restrictive allowing variance to be
greater than the mean, is a better fit. The results of these tests are detailed in chapter six.
The variables included in this negative binomial regression analyses are drawn
from the 7 day recall of health behaviors asking how many days in the past 7 days did
participant do the following
Table 5.6: Health Behavior Variables and Control Variables
Dependent Variables Type
Eat breakfast outside Ordinal
Dinner outside Ordinal
Eat fast food Ordinal
Consume western snacks Ordinal
Consume Sweet drinks Ordinal
Drink alcohol Ordinal
Exercise 60 (not necessarily
consecutive) min or more
Ordinal
Sit 8 (not necessarily consecutive)
hours or more
Ordinal
Control Variables Type
Age group Categorical
Gender Categorical
Educational attainment Categorical
Two sets of regressions are conducted. The first set investigates the relationship
between shopping destination choice and health behaviors. The second set investigates
the relationship between frequent visits to each destination and health behaviors.

118
The independent variables of interest in the first set of regressions are primary
shopping destination choice. They are mutually exclusive. Convenience store is excluded
from the analysis as only a negligible number of participants indicated they shop
primarily at a convenience store. The variables, thus, include binary variables
Table 5.7: Independent Variables of Interest for Negative Binomial Regression
(Shopper Group)
Independent Variables of Interest
(primary shopping destination choice)
Type
Supermarket Binary
Traditional market Binary
Mixed (both supermarket and traditional
market)
Binary
The independent variables of interest in the second set of regressions are whether
or not one shops at a particular store format at least 3 times a week. Because one can
shop 3 times a week at both supermarket and at traditional market, these variables are not
mutually exclusive. It is also beneficial to tease out the effect of convenience stores as
they offer significantly less fresh foods and are heavily reliant on processed foods.
Table 5.8: Independent Variables of Interest for Negative Binomial
Regression (Frequent Shopper)
Independent Variables of Interest
(shopping frequency)
Type
Frequent visit to supermarket Binary
Frequent visit to traditional market Binary
Frequent visit to convenience store Binary

119
Subsection 2.4: Grocery Destination Choice and Weight Status (Ordinary Least
Squares Regression)
This step of the analysis uses ordinary least squares (OLS) regression to examine
the relationship between where one shops and one’s obesity status. OLS is one of the
simplest forms of multivariate regression. The goal of OLS is to minimize the sum of
squared errors from the data to create the best fit line.
The general form of OLS is
𝑌 =∝ +𝛽𝑋𝑖 + 𝜀
Where
Y is the dependent variable
α is a constant
β is a coefficient representing the slope of the line, and
Xi is the observed value of the independent variable for the ith case, and
Ɛ is the error term
The dependent variables for this step are obesity measures. Recall that I collected
primary data through bioelectrical impedance analysis for measures including BMI, PBF,
VF, WC, and WHR. Of these five measures, two were excluded from the analysis. VF in
the two waves of data collected were measured using different machines that yielded
results in two different irreconcilable measurement units. It had to, therefore,

120
unfortunately be dropped. The second measurement excluded from the analysis was
WHR due to lack of evidence for its accuracy in indicating obesity status.
Two sets of regressions, each with three subsets for the three obesity measure
dependent variables, are conducted. Similar to the previous step of negative binomial
regressions, the first set investigates variations within shopper groups (shopping
destination) whereas the second set investigates frequent shoppers (shopping frequency).
As with the negative binomial regression, the independent variables of interest in
the first set of regressions are primary shopping destination choice. They are mutually
exclusive. Convenience store is excluded from the analysis as only a negligible number
of participants indicated they shop primarily at a convenience store. The variables, thus,
include binary variables
Table 5.9: Independent Variables (Primary Shopping Destination Choice)
Independent Variables of Interest
(primary shopping destination
choice)
Type
Supermarket Binary
Traditional market Binary
Mixed (both supermarket and
traditional market)
Binary
As with the negative binomial regression, the independent variables of interest in
the second set of regressions are whether or not one shops at a particular store format at
least 3 times a week. Because one can shop 3 times a week at both supermarket and at
traditional market, these variables are not mutually exclusive. It is also beneficial to tease

121
out the effect of convenience stores as they offer significantly less fresh foods and are
heavily reliant on processed foods.
Table 5.10: Independent Variables (Shopping Frequency)
Independent Variables of Interest
(shopping frequency)
Type
Frequent visit to supermarket Binary
Frequent visit to traditional market Binary
Frequent visit to convenience store Binary
Each subset of regressions is further expanded into four models using different
control variables in order to examine the effects of various factors on the independent
variables of interest. For example, regression set one (shopping destination choice) subset
one (BMI as dependent variable) has 4 different models. The following regression
models form the general regression models for the analyses.
a.) Shopper Groups (Shopping Destination)
a.1) BMI and Shopping Destination
Model 1 has only independent variable of interest, ShopperGroup, which is a
categorical variable that includes modern shoppers, traditional shoppers, and
mixed shoppers.
𝐵𝑀𝐼 =∝ +𝛽1𝑆ℎ𝑜𝑝𝑝𝑒𝑟𝐺𝑟𝑜𝑢𝑝 + 𝜀

122
Model 2 contains control variables basic control variables for age, sex, and
education.
𝐵𝑀𝐼 =∝ +𝛽1𝑆ℎ𝑜𝑝𝑝𝑒𝑟𝐺𝑟𝑜𝑢𝑝 + 𝛽2𝐴𝑔𝑒𝐺𝑟𝑜𝑢𝑝 + 𝛽3𝑀𝑎𝑙𝑒 + 𝛽4𝐸𝑑𝑢𝑐𝑎𝑡𝑖𝑜𝑛 + 𝜀
Model 3 adds controls for household characteristics including number of
household members, whether a child (18 years old or under) is present, car
ownership, and number of full-time workers.
𝐵𝑀𝐼 =∝ +𝛽1𝑆ℎ𝑜𝑝𝑝𝑒𝑟𝐺𝑟𝑜𝑢𝑝 + 𝛽2𝐴𝑔𝑒𝐺𝑟𝑜𝑢𝑝 + 𝛽3𝑀𝑎𝑙𝑒 + 𝛽4𝐸𝑑𝑢𝑐𝑎𝑡𝑖𝑜𝑛+ 𝛽5𝐻𝐻𝑀𝑒𝑚 + 𝛽6𝑐ℎ𝑖𝑙𝑑 + 𝛽7𝑐𝑎𝑟 + 𝛽8𝐹𝑇𝑤𝑜𝑟𝑘𝑒𝑟𝑠 + 𝜀
Lastly, Model 4 replaces the household characteristics variables with health
behavior variables.
𝐵𝑀𝐼 =∝ +𝛽1𝑆ℎ𝑜𝑝𝑝𝑒𝑟𝐺𝑟𝑜𝑢𝑝 + 𝛽2𝐴𝑔𝑒𝐺𝑟𝑜𝑢𝑝 + 𝛽3𝑀𝑎𝑙𝑒+ 𝛽4𝐸𝑑𝑢𝑐𝑎𝑡𝑖𝑜𝑛 + 𝛽5𝐻𝐻𝑀𝑒𝑚 + 𝛽6𝑐ℎ𝑖𝑙𝑑 + 𝛽7𝑐𝑎𝑟 + 𝛽8𝐹𝑇𝑤𝑜𝑟𝑘𝑒𝑟𝑠+ 𝛽9𝐵𝐹𝑂𝑢𝑡𝑠𝑖𝑑𝑒 + 𝛽10𝐷𝑖𝑛𝑛𝑒𝑟𝑂𝑢𝑡𝑠𝑖𝑑𝑒 + 𝛽11𝐹𝑎𝑠𝑡𝐹𝑜𝑜𝑑 + 𝛽12𝑊𝑒𝑠𝑡𝑆𝑛𝑎𝑐𝑘+ 𝛽13𝑆𝑤𝑒𝑒𝑡𝐷𝑟𝑖𝑛𝑘𝑠 + 𝛽14𝐴𝑙𝑐𝑜ℎ𝑜𝑙 + 𝛽15𝐸𝑥𝑒𝑟𝑐𝑖𝑠𝑒60𝑀𝑖𝑛 + 𝛽16𝑆𝑖𝑡8𝐻𝑟𝑠+ 𝜀
Table 5.11: Control Variables for OLS models (Shopper Group)
Control Variables
Model 1 Model 2 Model 3 Model 4
None Age group Age group Age group
Male Male Male
Education Education Education
Number of household
members
Number of household
members
A child in household A child in household
Own a car Own a car
Number of FT workers Number of FT workers
Days eat breakfast outside
Days eat dinner outside
Days eat Fast food
Days eat western snacks

123
Days drink sugary
beverage
Days drink alcohol
Days exercise 60 min or
more
Days sit at least 8 hours
a.2) PBF and Shopping Destination
As with the previous regression, the control variables for all models remain the
same. Only the dependent variables changes and the regressions take the
following forms.
Model 1:
𝑃𝐵𝐹 =∝ +𝛽1𝑆ℎ𝑜𝑝𝑝𝑒𝑟𝐺𝑟𝑜𝑢𝑝 + 𝜀
Model 2:
𝑃𝐵𝐹 =∝ +𝛽1𝑆ℎ𝑜𝑝𝑝𝑒𝑟𝐺𝑟𝑜𝑢𝑝 + 𝛽2𝐴𝑔𝑒𝐺𝑟𝑜𝑢𝑝 + 𝛽3𝑀𝑎𝑙𝑒 + 𝛽4𝐸𝑑𝑢𝑐𝑎𝑡𝑖𝑜𝑛 + 𝜀
Model 3:
𝑃𝐵𝐹 =∝ +𝛽1𝑆ℎ𝑜𝑝𝑝𝑒𝑟𝐺𝑟𝑜𝑢𝑝 + 𝛽2𝐴𝑔𝑒𝐺𝑟𝑜𝑢𝑝 + 𝛽3𝑀𝑎𝑙𝑒 + 𝛽4𝐸𝑑𝑢𝑐𝑎𝑡𝑖𝑜𝑛+ 𝛽5𝐻𝐻𝑀𝑒𝑚 + 𝛽6𝑐ℎ𝑖𝑙𝑑 + 𝛽7𝑐𝑎𝑟 + 𝛽8𝐹𝑇𝑤𝑜𝑟𝑘𝑒𝑟𝑠 + 𝜀
Model 4:
𝑃𝐵𝐹 =∝ +𝛽1𝑆ℎ𝑜𝑝𝑝𝑒𝑟𝐺𝑟𝑜𝑢𝑝 + 𝛽2𝐴𝑔𝑒𝐺𝑟𝑜𝑢𝑝 + 𝛽3𝑀𝑎𝑙𝑒 + 𝛽4𝐸𝑑𝑢𝑐𝑎𝑡𝑖𝑜𝑛 + 𝛽5𝐻𝐻𝑀𝑒𝑚 + 𝛽6𝑐ℎ𝑖𝑙𝑑 + 𝛽7𝑐𝑎𝑟 + 𝛽8𝐹𝑇𝑤𝑜𝑟𝑘𝑒𝑟𝑠+ 𝛽9𝐵𝐹𝑂𝑢𝑡𝑠𝑖𝑑𝑒 + 𝛽10𝐷𝑖𝑛𝑛𝑒𝑟𝑂𝑢𝑡𝑠𝑖𝑑𝑒 + 𝛽11𝐹𝑎𝑠𝑡𝐹𝑜𝑜𝑑 + 𝛽12𝑊𝑒𝑠𝑡𝑆𝑛𝑎𝑐𝑘+ 𝛽13𝑆𝑤𝑒𝑒𝑡𝐷𝑟𝑖𝑛𝑘𝑠 + 𝛽14𝐴𝑙𝑐𝑜ℎ𝑜𝑙 + 𝛽15𝐸𝑥𝑒𝑟𝑐𝑖𝑠𝑒60𝑀𝑖𝑛 + 𝛽16𝑆𝑖𝑡8𝐻𝑟𝑠+ 𝜀

124
a.3) WC and Shopping Destination
As with the previous regression, the control variables for all models remain the
same. Only the dependent variables changes and the regressions take the
following forms.
Model 1:
𝑊𝐶 =∝ +𝛽1𝑆ℎ𝑜𝑝𝑝𝑒𝑟𝐺𝑟𝑜𝑢𝑝 + 𝜀
Model 2:
𝑊𝐶 =∝ +𝛽1𝑆ℎ𝑜𝑝𝑝𝑒𝑟𝐺𝑟𝑜𝑢𝑝 + 𝛽2𝐴𝑔𝑒𝐺𝑟𝑜𝑢𝑝 + 𝛽3𝑀𝑎𝑙𝑒 + 𝛽4𝐸𝑑𝑢𝑐𝑎𝑡𝑖𝑜𝑛 + 𝜀
Model 3:
𝑊𝐶 =∝ +𝛽1𝑆ℎ𝑜𝑝𝑝𝑒𝑟𝐺𝑟𝑜𝑢𝑝 + 𝛽2𝐴𝑔𝑒𝐺𝑟𝑜𝑢𝑝 + 𝛽3𝑀𝑎𝑙𝑒 + 𝛽4𝐸𝑑𝑢𝑐𝑎𝑡𝑖𝑜𝑛+ 𝛽5𝐻𝐻𝑀𝑒𝑚 + 𝛽6𝑐ℎ𝑖𝑙𝑑 + 𝛽7𝑐𝑎𝑟 + 𝛽8𝐹𝑇𝑤𝑜𝑟𝑘𝑒𝑟𝑠 + 𝜀
Model 4:
𝑊𝐶 =∝ +𝛽1𝑆ℎ𝑜𝑝𝑝𝑒𝑟𝐺𝑟𝑜𝑢𝑝 + 𝛽2𝐴𝑔𝑒𝐺𝑟𝑜𝑢𝑝 + 𝛽3𝑀𝑎𝑙𝑒+ 𝛽4𝐸𝑑𝑢𝑐𝑎𝑡𝑖𝑜𝑛 + 𝛽5𝐻𝐻𝑀𝑒𝑚 + 𝛽6𝑐ℎ𝑖𝑙𝑑 + 𝛽7𝑐𝑎𝑟 + 𝛽8𝐹𝑇𝑤𝑜𝑟𝑘𝑒𝑟𝑠+ 𝛽9𝐵𝐹𝑂𝑢𝑡𝑠𝑖𝑑𝑒 + 𝛽10𝐷𝑖𝑛𝑛𝑒𝑟𝑂𝑢𝑡𝑠𝑖𝑑𝑒 + 𝛽11𝐹𝑎𝑠𝑡𝐹𝑜𝑜𝑑+ 𝛽12𝑊𝑒𝑠𝑡𝑆𝑛𝑎𝑐𝑘 + 𝛽13𝑆𝑤𝑒𝑒𝑡𝐷𝑟𝑖𝑛𝑘𝑠 + 𝛽14𝐴𝑙𝑐𝑜ℎ𝑜𝑙+ 𝛽15𝐸𝑥𝑒𝑟𝑐𝑖𝑠𝑒60𝑀𝑖𝑛 + 𝛽16𝑆𝑖𝑡8𝐻𝑟𝑠 + 𝜀
b.) Frequent Shoppers (Shopping Frequency)
b.1) BMI and Frequent Shoppers
Model 1 has only independent variables of interest, FrequentSuperShopper,
FrequentMarketShopper, and FrequentConvStrShopper. Recall that frequent
shoppers are those who shop at a particular store format 3 or more times a week.

125
𝐵𝑀𝐼 =∝ +𝛽1𝐹𝑟𝑒𝑞𝑆𝑢𝑝𝑒𝑟𝑆ℎ𝑝𝑝𝑟 + 𝛽2𝐹𝑟𝑒𝑞𝑀𝑘𝑡𝑆ℎ𝑝𝑝𝑟 + 𝛽3𝐹𝑟𝑒𝑞𝐶𝑜𝑛𝑣𝑆𝑡𝑟𝑆ℎ𝑝𝑝𝑟 + 𝜀
Model 2 contains control variables basic control variables for age, sex, and
education.
𝐵𝑀𝐼 =∝ +𝛽1𝐹𝑟𝑒𝑞𝑆𝑢𝑝𝑒𝑟𝑆ℎ𝑝𝑝𝑟 + 𝛽2𝐹𝑟𝑒𝑞𝑀𝑘𝑡𝑆ℎ𝑝𝑝𝑟 + 𝛽3𝐹𝑟𝑒𝑞𝐶𝑜𝑛𝑣𝑆𝑡𝑟𝑆ℎ𝑝𝑝𝑟+ 𝛽4𝐴𝑔𝑒𝐺𝑟𝑜𝑢𝑝 + 𝛽5𝑀𝑎𝑙𝑒 + 𝛽6𝐸𝑑𝑢𝑐𝑎𝑡𝑖𝑜𝑛 + 𝜀
Model 3 adds controls for household characteristics including number of
household members, whether a child (18 years old or under) is present, car
ownership, and number of full-time workers.
𝐵𝑀𝐼 =∝ +𝛽1𝐹𝑟𝑒𝑞𝑆𝑢𝑝𝑒𝑟𝑆ℎ𝑝𝑝𝑟 + 𝛽2𝐹𝑟𝑒𝑞𝑀𝑘𝑡𝑆ℎ𝑝𝑝𝑟 + 𝛽3𝐹𝑟𝑒𝑞𝐶𝑜𝑛𝑣𝑆𝑡𝑟𝑆ℎ𝑝𝑝𝑟+ 𝛽4𝐴𝑔𝑒𝐺𝑟𝑜𝑢𝑝 + 𝛽5𝑀𝑎𝑙𝑒 + 𝛽6𝐸𝑑𝑢𝑐𝑎𝑡𝑖𝑜𝑛 + 𝛽7𝐻𝐻𝑀𝑒𝑚+ 𝛽8𝑐ℎ𝑖𝑙𝑑 + 𝛽9𝑐𝑎𝑟 + 𝛽10𝐹𝑇𝑤𝑜𝑟𝑘𝑒𝑟𝑠 + 𝜀
Lastly, Model 4 replaces the household characteristics variables with health
behavior variables.
𝐵𝑀𝐼 =∝ +𝛽1𝐹𝑟𝑒𝑞𝑆𝑢𝑝𝑒𝑟𝑆ℎ𝑝𝑝𝑟 + 𝛽2𝐹𝑟𝑒𝑞𝑀𝑘𝑡𝑆ℎ𝑝𝑝𝑟 + 𝛽3𝐹𝑟𝑒𝑞𝐶𝑜𝑛𝑣𝑆𝑡𝑟𝑆ℎ𝑝𝑝𝑟+ 𝛽4𝐴𝑔𝑒𝐺𝑟𝑜𝑢𝑝 + 𝛽5𝑀𝑎𝑙𝑒+ 𝛽6𝐸𝑑𝑢𝑐𝑎𝑡𝑖𝑜𝑛 + 𝛽7𝐻𝐻𝑀𝑒𝑚 + 𝛽8𝑐ℎ𝑖𝑙𝑑 + 𝛽9𝑐𝑎𝑟 + 𝛽10𝐹𝑇𝑤𝑜𝑟𝑘𝑒𝑟𝑠+ 𝛽11𝐵𝐹𝑂𝑢𝑡𝑠𝑖𝑑𝑒 + 𝛽12𝐷𝑖𝑛𝑛𝑒𝑟𝑂𝑢𝑡𝑠𝑖𝑑𝑒 + 𝛽13𝐹𝑎𝑠𝑡𝐹𝑜𝑜𝑑 + 𝛽14𝑊𝑒𝑠𝑡𝑆𝑛𝑎𝑐𝑘+ 𝛽15𝑆𝑤𝑒𝑒𝑡𝐷𝑟𝑖𝑛𝑘𝑠 + 𝛽16𝐴𝑙𝑐𝑜ℎ𝑜𝑙 + 𝛽17𝐸𝑥𝑒𝑟𝑐𝑖𝑠𝑒60𝑀𝑖𝑛 + 𝛽18𝑆𝑖𝑡8𝐻𝑟𝑠+ 𝜀
Table 5.12: Control Variables for OLS models (Frequent Shopper)
Control Variables
Model 1 Model 2 Model 3 Model 4
None Age group Age group Age group
Male Male Male
Education Education Education
Number of household
members
Number of household
members
A child in household A child in household

126
Own a car Own a car
Number of FT workers Number of FT workers
Days eat breakfast outside
Days eat dinner outside
Days eat Fast food
Days eat western snacks
Days drink sugary
beverage
Days drink alcohol
Days exercise 60 min or
more
Days sit at least 8 hours
b.2) PBF and Frequent Shoppers
As with the previous regression, the control variables for all models remain the
same. Only the dependent variables changes and the regressions take the
following forms.
Model 1:
𝑃𝐵𝐹 ==∝ +𝛽1𝐹𝑟𝑒𝑞𝑆𝑢𝑝𝑒𝑟𝑆ℎ𝑝𝑝𝑟 + 𝛽2𝐹𝑟𝑒𝑞𝑀𝑘𝑡𝑆ℎ𝑝𝑝𝑟 + 𝛽3𝐹𝑟𝑒𝑞𝐶𝑜𝑛𝑣𝑆𝑡𝑟𝑆ℎ𝑝𝑝𝑟 + 𝜀
Model 2:
𝑃𝐵𝐹 =∝ +𝛽1𝐹𝑟𝑒𝑞𝑆𝑢𝑝𝑒𝑟𝑆ℎ𝑝𝑝𝑟 + 𝛽2𝐹𝑟𝑒𝑞𝑀𝑘𝑡𝑆ℎ𝑝𝑝𝑟 + 𝛽3𝐹𝑟𝑒𝑞𝐶𝑜𝑛𝑣𝑆𝑡𝑟𝑆ℎ𝑝𝑝𝑟
+ 𝛽4𝐴𝑔𝑒𝐺𝑟𝑜𝑢𝑝 + 𝛽5𝑀𝑎𝑙𝑒 + 𝛽6𝐸𝑑𝑢𝑐𝑎𝑡𝑖𝑜𝑛 + 𝜀
Model 3:
𝑃𝐵𝐹 =∝ +𝛽1𝐹𝑟𝑒𝑞𝑆𝑢𝑝𝑒𝑟𝑆ℎ𝑝𝑝𝑟 + 𝛽2𝐹𝑟𝑒𝑞𝑀𝑘𝑡𝑆ℎ𝑝𝑝𝑟 + 𝛽3𝐹𝑟𝑒𝑞𝐶𝑜𝑛𝑣𝑆𝑡𝑟𝑆ℎ𝑝𝑝𝑟+ 𝛽4𝐴𝑔𝑒𝐺𝑟𝑜𝑢𝑝 + 𝛽5𝑀𝑎𝑙𝑒 + 𝛽6𝐸𝑑𝑢𝑐𝑎𝑡𝑖𝑜𝑛 + 𝛽7𝐻𝐻𝑀𝑒𝑚+ 𝛽8𝑐ℎ𝑖𝑙𝑑 + 𝛽9𝑐𝑎𝑟 + 𝛽10𝐹𝑇𝑤𝑜𝑟𝑘𝑒𝑟𝑠 + 𝜀

127
Model 4:
𝑃𝐵𝐹 =∝ +𝛽1𝐹𝑟𝑒𝑞𝑆𝑢𝑝𝑒𝑟𝑆ℎ𝑝𝑝𝑟 + 𝛽2𝐹𝑟𝑒𝑞𝑀𝑘𝑡𝑆ℎ𝑝𝑝𝑟 + 𝛽3𝐹𝑟𝑒𝑞𝐶𝑜𝑛𝑣𝑆𝑡𝑟𝑆ℎ𝑝𝑝𝑟+ 𝛽4𝐴𝑔𝑒𝐺𝑟𝑜𝑢𝑝 + 𝛽5𝑀𝑎𝑙𝑒+ 𝛽6𝐸𝑑𝑢𝑐𝑎𝑡𝑖𝑜𝑛 + 𝛽7𝐻𝐻𝑀𝑒𝑚 + 𝛽8𝑐ℎ𝑖𝑙𝑑 + 𝛽9𝑐𝑎𝑟 + 𝛽10𝐹𝑇𝑤𝑜𝑟𝑘𝑒𝑟𝑠+ 𝛽11𝐵𝐹𝑂𝑢𝑡𝑠𝑖𝑑𝑒 + 𝛽12𝐷𝑖𝑛𝑛𝑒𝑟𝑂𝑢𝑡𝑠𝑖𝑑𝑒 + 𝛽13𝐹𝑎𝑠𝑡𝐹𝑜𝑜𝑑 + 𝛽14𝑊𝑒𝑠𝑡𝑆𝑛𝑎𝑐𝑘+ 𝛽15𝑆𝑤𝑒𝑒𝑡𝐷𝑟𝑖𝑛𝑘𝑠 + 𝛽16𝐴𝑙𝑐𝑜ℎ𝑜𝑙 + 𝛽17𝐸𝑥𝑒𝑟𝑐𝑖𝑠𝑒60𝑀𝑖𝑛 + 𝛽18𝑆𝑖𝑡8𝐻𝑟𝑠+ 𝜀
b.3) WC and Frequent Shoppers
As with the previous regression, the control variables for all models remain the
same. Only the dependent variables changes and the regressions take the
following forms.
Model 1:
𝑊𝐶 ==∝ +𝛽1𝐹𝑟𝑒𝑞𝑆𝑢𝑝𝑒𝑟𝑆ℎ𝑝𝑝𝑟 + 𝛽2𝐹𝑟𝑒𝑞𝑀𝑘𝑡𝑆ℎ𝑝𝑝𝑟 + 𝛽3𝐹𝑟𝑒𝑞𝐶𝑜𝑛𝑣𝑆𝑡𝑟𝑆ℎ𝑝𝑝𝑟 + 𝜀
Model 2:
𝑊𝐶 =∝ +𝛽1𝐹𝑟𝑒𝑞𝑆𝑢𝑝𝑒𝑟𝑆ℎ𝑝𝑝𝑟 + 𝛽2𝐹𝑟𝑒𝑞𝑀𝑘𝑡𝑆ℎ𝑝𝑝𝑟 + 𝛽3𝐹𝑟𝑒𝑞𝐶𝑜𝑛𝑣𝑆𝑡𝑟𝑆ℎ𝑝𝑝𝑟
+ 𝛽4𝐴𝑔𝑒𝐺𝑟𝑜𝑢𝑝 + 𝛽5𝑀𝑎𝑙𝑒 + 𝛽6𝐸𝑑𝑢𝑐𝑎𝑡𝑖𝑜𝑛 + 𝜀
Model 3:
𝑊𝐶 =∝ +𝛽1𝐹𝑟𝑒𝑞𝑆𝑢𝑝𝑒𝑟𝑆ℎ𝑝𝑝𝑟 + 𝛽2𝐹𝑟𝑒𝑞𝑀𝑘𝑡𝑆ℎ𝑝𝑝𝑟 + 𝛽3𝐹𝑟𝑒𝑞𝐶𝑜𝑛𝑣𝑆𝑡𝑟𝑆ℎ𝑝𝑝𝑟+ 𝛽4𝐴𝑔𝑒𝐺𝑟𝑜𝑢𝑝 + 𝛽5𝑀𝑎𝑙𝑒 + 𝛽6𝐸𝑑𝑢𝑐𝑎𝑡𝑖𝑜𝑛 + 𝛽7𝐻𝐻𝑀𝑒𝑚+ 𝛽8𝑐ℎ𝑖𝑙𝑑 + 𝛽9𝑐𝑎𝑟 + 𝛽10𝐹𝑇𝑤𝑜𝑟𝑘𝑒𝑟𝑠 + 𝜀
Model 4:
𝑊𝐶 =∝ +𝛽1𝐹𝑟𝑒𝑞𝑆𝑢𝑝𝑒𝑟𝑆ℎ𝑝𝑝𝑟 + 𝛽2𝐹𝑟𝑒𝑞𝑀𝑘𝑡𝑆ℎ𝑝𝑝𝑟 + 𝛽3𝐹𝑟𝑒𝑞𝐶𝑜𝑛𝑣𝑆𝑡𝑟𝑆ℎ𝑝𝑝𝑟+ 𝛽4𝐴𝑔𝑒𝐺𝑟𝑜𝑢𝑝 + 𝛽5𝑀𝑎𝑙𝑒+ 𝛽6𝐸𝑑𝑢𝑐𝑎𝑡𝑖𝑜𝑛 + 𝛽7𝐻𝐻𝑀𝑒𝑚 + 𝛽8𝑐ℎ𝑖𝑙𝑑 + 𝛽9𝑐𝑎𝑟 + 𝛽10𝐹𝑇𝑤𝑜𝑟𝑘𝑒𝑟𝑠+ 𝛽11𝐵𝐹𝑂𝑢𝑡𝑠𝑖𝑑𝑒 + 𝛽12𝐷𝑖𝑛𝑛𝑒𝑟𝑂𝑢𝑡𝑠𝑖𝑑𝑒 + 𝛽13𝐹𝑎𝑠𝑡𝐹𝑜𝑜𝑑 + 𝛽14𝑊𝑒𝑠𝑡𝑆𝑛𝑎𝑐𝑘+ 𝛽15𝑆𝑤𝑒𝑒𝑡𝐷𝑟𝑖𝑛𝑘𝑠 + 𝛽16𝐴𝑙𝑐𝑜ℎ𝑜𝑙 + 𝛽17𝐸𝑥𝑒𝑟𝑐𝑖𝑠𝑒60𝑀𝑖𝑛 + 𝛽18𝑆𝑖𝑡8𝐻𝑟𝑠+ 𝜀
128
REFERENCES
Charreire, Hélène, Romain Casey, Paul Salze, Chantal Simon, Basile Chaix, Arnaud
Banos, Dominique Badariotti, Christiane Weber, and Jean-Michel Oppert. 2010.
“Measuring the Food Environment Using Geographical Information Systems: A
Methodological Review.” Public Health Nutrition 13 (11): 1773–85.
doi:10.1017/S1368980010000753.
McLafferty, Sara L. 2003. “GIS and Health Care.” Annual Review of Public Health 24:
25–42. doi:10.1146/annurev.publhealth.24.012902.141012.
National Statistical Office Thailand. 2013. “Household Socio Economic Data.”
http://web.nso.go.th/en/survey/house_seco/household_main.htm.
National Statistical Office Thailand. 2015. “Household Socio Economic Data.”
http://web.nso.go.th/en/survey/house_seco/household_main.htm.
Thornton, Lukar E., Jamie R. Pearce, and Anne M. Kavanagh. 2011. “Using Geographic
Information Systems (GIS) to Assess the Role of the Built Environment in
Influencing Obesity: A Glossary.” International Journal of Behavioral Nutrition and
Physical Activity 8 (1): 71. doi:10.1186/1479-5868-8-71.

129

130
CHAPTER SIX: STATISTICAL ANALYSIS RESULTS
This chapter presents the results of analysis models described in chapter five. All
analyses were performed using Stata statistical analysis software, version 12/IC with the
exception of food retail landscape analysis which used the ArcGIS software. In section
one, descriptive statistics, the entire sample is included in the analysis. In subsequent
sections, only surveys completed by household’s primary shopper are analyzed. Where it
makes sense, modern retailers are teased out to differentiate supermarkets from
convenience stores.
I: Descriptive Statistics
The objective of this section is to provide an overview of the sample characteristics being
presented in this study.
Results
Of the 510 usable questionnaires, 63.33% of respondents reported being the
primary grocery shoppers for their household among whom approximately 75% are
female. Table 6.1 summarizes the breakdown of gender, age, and educational attainment
between the two groups. Age is significant at the p<0.05 level. Non-primary shoppers
appear to be concentrated in the younger than 30 years old category whereas the highest

131
proportion of primary shoppers is between 30-44 years old. It is probable that younger
participants are still living with their parents who do the grocery shopping or have a
domestic helper who does the chore. Those in the 30-44 years old category may be young
individuals who have left their parents and started their own family but cannot yet, or
prefer not to, have a domestic helper. They are therefore responsible for their own
grocery shopping trips. With the greater movement of labor, rising wage, and smaller
urban residence, it has become increasingly difficult for young families to afford a
domestic helper.
Educational attainment is significant at the p<0.01 level for the primary school or
less category and at the p<0.001 level for master’s degree or higher category.
Substantially more primary shoppers appear to have completed primary school or less
whereas significantly more non-primary shoppers hold a master’s degree or higher. This
is not surprising as more educated individuals are more likely to be able to afford a maid
and utilize their time on work-related more so than on household-related matters. Figure
6.1 shows a visual representation of the discrepancies in educational attainment among
primary and non-primary shoppers. It is evident that respondents are overwhelmingly
college graduates. The largest gaps are at the two extremities of primary education or less
and master’s degree or higher.
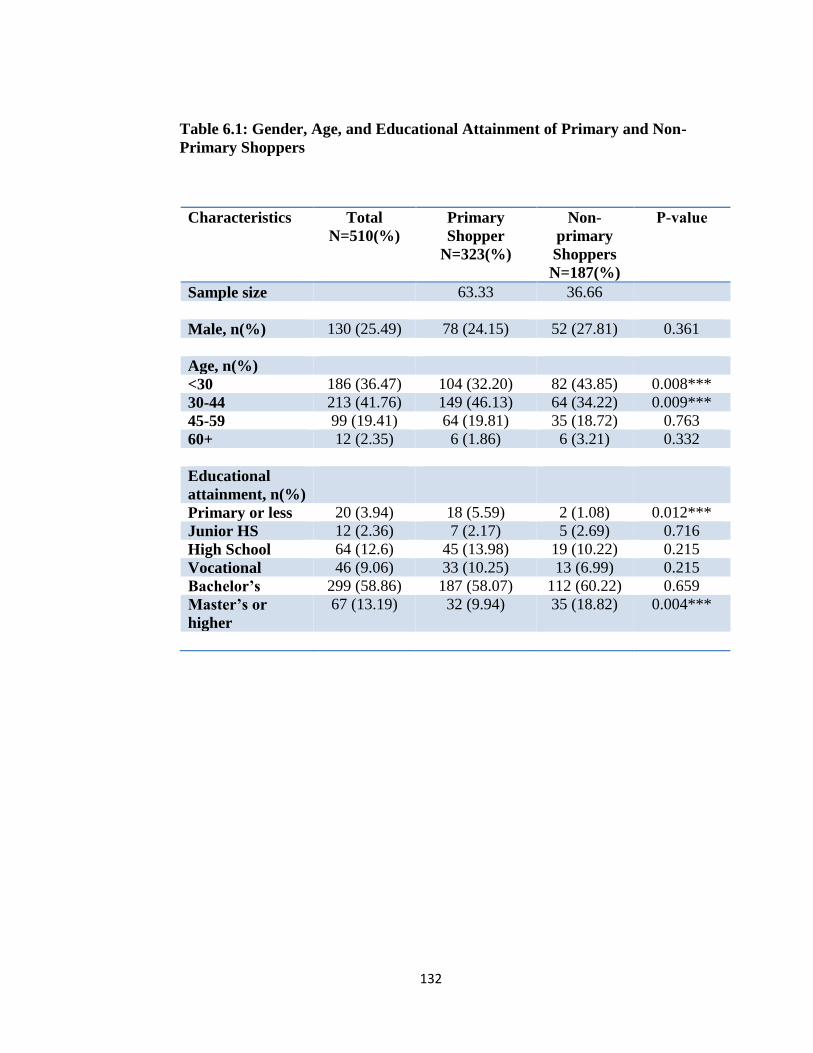
132
Table 6.1: Gender, Age, and Educational Attainment of Primary and Non-
Primary Shoppers
Characteristics Total
N=510(%)
Primary
Shopper
N=323(%)
Non-
primary
Shoppers
N=187(%)
P-value
Sample size 63.33 36.66
Male, n(%) 130 (25.49) 78 (24.15) 52 (27.81) 0.361
Age, n(%)
<30 186 (36.47) 104 (32.20) 82 (43.85) 0.008***
30-44 213 (41.76) 149 (46.13) 64 (34.22) 0.009***
45-59 99 (19.41) 64 (19.81) 35 (18.72) 0.763
60+ 12 (2.35) 6 (1.86) 6 (3.21) 0.332
Educational
attainment, n(%)
Primary or less 20 (3.94) 18 (5.59) 2 (1.08) 0.012***
Junior HS 12 (2.36) 7 (2.17) 5 (2.69) 0.716
High School 64 (12.6) 45 (13.98) 19 (10.22) 0.215
Vocational 46 (9.06) 33 (10.25) 13 (6.99) 0.215
Bachelor’s 299 (58.86) 187 (58.07) 112 (60.22) 0.659
Master’s or
higher
67 (13.19) 32 (9.94) 35 (18.82) 0.004***

133
Figure 6.1: Educational Attainment of Primary and Non-Primary Shoppers
Table 6.2 shows monthly household income, residence type, marital status,
family composition, and car ownership of primary and non-primary shoppers. As non-
primary shoppers are significantly more educated than their primary shopper counterparts,
they are also more likely to have higher monthly household income. This is significant at
p<0.01 level. While as high as 21% of non-primary shopper households earn more than
100,000 baht per month, only 10% of primary shopper households do.
0
10
20
30
40
50
60
70
Pri
mar
yo
r le
ss
Jun
ior
Hig
h S
cho
ol
Hig
h S
cho
ol
Vo
cati
on
al
Bac
he
lors
Mas
ters
or
hig
her
Primary Shopper
Non Primary Shopper

134
Table 6.2: Household Income, Residence Type, Marital Status, Family Composition
and Car Ownership of Primary and Non-Primary Shoppers
Characteristics Total
N=510
Primary
Shopper
N=323(%)
Non-
primary
Shoppers
N=187(%)
P-value
Monthly HH
income (%)
<10,000 31 (6.29) 23 (7.37) 8 (4.42) 0.195
10,000-30,000 184 (37.32) 124 (39.74) 60 (33.15) 0.153
30,001-50,000 113 (22.92) 79 (25.32) 34 (18.78) 0.100
50,001-100,000 96 (19.47) 56 (17.95) 40 (22.10) 0.259
>100,000 68 (13.79) 30 (9.62) 38 (20.99) 0.000***
Residence
type(%)
House 247 (48.72) 124 (38.63) 123 (66.13) 0.000***
Condo 74 (14.60) 60 (18.69) 14 (7.53) 0.001***
Dorm/apt 184 (36.29) 136 (42.37) 48 (25.81) 0.000***
Marital Status
Married 170 (33.40) 103 (31.99) 67 (35.83) 0.363
Single 327 (64.24) 209 (64.91) 118 (63.10) 0.716
Divorced 12 (2.36) 10 (3.11) 2 (1.07) 0.146
Household
size(%)
Live alone 115 (22.55) 94 (29.1) 21 (11.23) 0.000***
2 members 107 (20.98) 79 (24.46) 28 (14.97) 0.011***
3 members 82 (16.08) 52 (16.10) 30 (16.04) 0.987
4 members 93 (18.24) 49 (15.17) 44 (23.53) 0.018**
5 members or
more
113 (22.16) 49 (15.17) 64 (33.22) 0.000***
Car Ownership 347 (68.85) 212 (66.67) 135 (72.58) 0.167

135
Figure 6.2 below shows the discrepancies in monthly salary between primary and
non-primary shoppers. These numbers, of course, do not take into account the fact that
non-primary shoppers are more likely to live with multiple family members. As such,
their combined income is higher and each member is less likely to be the primary shopper.
Conversely, single person households have, by default, one income earner and that
person is also by default the primary grocery shopper. This is also reflected in the
significant difference in the residence type and household size whereby primary shoppers
are proportionately skewed to living in an apartment or a condominium with fewer family
members (29.1% live alone) and non-primary members tend to live in larger households
(33.22% live with 5 or more family members) in a house setting (66.13%) (Table 6.2).
Marital status does not differ between primary and non-primary shoppers, with
the majority of both groups being single. Divorcees only make up a small percentage, 3%
or less, of the groups. This is attributable to the sample being fairly young and highly
educated. Car ownership also does not significantly differ between primary and non-
primary shoppers. While having a car may increase access to a greater number grocery
outlets, those who own a car are also likely to be of higher income and have someone else
who does the chore for them.

136
Figure 6.2: Monthly Household Income of Primary and Non-Primary Shoppers
0
5
10
15
20
25
30
35
40
45
Primary Shopper
Non Primary Shopper

137
II: Research Question I
The objective of this section is to conduct an exploratory analysis using ArcGIS software
that gives an overview of the food retail landscape in Bangkok.
Results
This initial step of the analysis looks at the potential spatial clustering of grocery
outlets using the Average Nearest Neighbor Distance (NND) approach. The locations of
traditional markets in Bangkok are shown in Figure 6.3. Traditional markets are either
publicly or privately owned and vary widely in size, prices, and selections of products.
Stalls are typically individually owned and operated by the owners themselves. A visual
scan shows that there appears to be some clustering in the smaller districts in the heart of
Bangkok. The results of the NND pattern analysis confirms that the markets are
significantly more clustered than random with a z-score of -7.209 and a p-value of 0.000.
Figure 6.3: Average Nearest Neighbor Distance Analysis of Traditional Markets
Traditional market
P<0.005

138
Modern grocery retailers operate differently than traditional markets as they are
chain stores as opposed to independent individual traditional markets. The placement of
their stores is centrally and strategically planned. They also engage in territorial and
product competition with other chains (Matsa 2011). To observe the pattern for each
chain, the NND analysis for modern grocery outlets was first carried out separately for
BigC, Tesco Lotus, and Tops. The resulting p-values for these chains were 0.88, 0.06,
and 0.81, respectively. Because none of these chains achieved statistically significant p-
value (0.05 or lower), the analysis indicates that the distributions of modern grocery
retailers are not different from random when looked at separately. When I merged the
three layers of modern retailers together and repeat the NND analysis for all the stores
together, however, the p-value was 0.000. This suggests that the clustering of modern
grocery retailers is not of the same chain but across chains from competition. Such
competition is said to be intra-competition among different modern store chains, as
opposed to the more widely discussed inter-competition between big-box retailers and
traditional outlets. As development reaches parts of Bangkok, grocery chains are eager to
make their presence in the area. Urban Thai consumers have been enthusiastic adopters of
novel western products. They also display no preference for a particular hypermarket
chain for the most part as they all offer similar products and similar prices
(Watchravesring et al. 2011). Thus, success of a food chain in a particular location often
attracts competition for market share. Figure 6.4 shows the locations of hypermarket and
supermarkets in Bangkok. Due to the nature of grocery store data being point data and
population data being aerial data, the analysis does not take into account population

139
Legend
!( BigC
!( Tops
!( Lotus
Legend
!( BigC
!( Tops
!( Lotus
Legend
!( BigC
!( Tops
!( Lotus
Legend
!( BigC
!( Tops
!( Lotus
density where the grocery outlets are located. The districts where the outlets are more
concentrated are also generally more densely populated. This is, therefore, an extremely
preliminary analysis.
Figure 6.4: Average Nearest Neighbor Analysis of Modern Retailers

140
Convenience stores are common at almost every corner of the streets in Bangkok
and that is reflected in the random spatial pattern, indicated by insignificant Moran’s I
test in Figure 6.5. The analysis is adjusted for the total population in each district.
Figure 6.5: Choropleth Map of District-Level Convenience Stores adjusted for the
Number of Total Population in the District.
Legend
Convenience Stores
0.0001378 - 0.0003089
0.0003090 - 0.0003882
0.0003883 - 0.0004918
0.0004919 - 0.0007444
0.0007445 - 0.003319

141
My hypothesis, H1, stating that food retail outlets in Bangkok is not evenly
distributed is partially supported. Traditional markets, the distribution is significantly
more clustered than random using the NND approach. Supermarkets are not significantly
clustered at p<0.05 level when examined each chain separately, but are highly clustered
at p<0.001 when all three large chains were combined. These analyses did not take into
account the population density in each district. Convenience store findings did not
support the hypothesis. The distribution appeared to be random. This is presumed to be
the result of the rapid expansion of the store format in the last decade. Seven-Eleven, the
largest convenience store chain, alone has over 3,000 outlets in Bangkok.
III: Research Question II
The objective of this section is to explore any existing socio-economic differences
between urban populations who shop at different store formats. Shopping frequencies at
various store formats are used to differentiate the sample into modern, traditional, and
mixed shoppers.
Definition
Recall that the median grocery shopping frequency of the sample is 1-2 times a week.
The following definitions were used in the analysis
Modern Grocery Store Shoppers are defined as those who visit hyper/supermarkets at
least once a week and visit traditional markets less than once a week on average.

142
Traditional Market Grocery Shoppers are defined as those who visit traditional open-air
markets at least once a week and visit hyper/supermarkets less than once a week on
average.
Mixed Shoppers are defined as those who visit both hyper/supermarkets and traditional
open-air markets at least once a week on average.
Results
Sex, Age, Educational Attainment, Monthly Household Income, Residence Type,
Household Size, and Car Ownership among Shopper Groups
There are 71 (27%) modern grocery shoppers, 85 (32%) traditional market
shoppers, and 106 (40%) mixed shoppers. Using ANOVA and chi-squares tests,
significant differences were found between the three shopper groups for educational
attainment, monthly household income, residence type, household size, and whether there
is a child (under 18 years old) in the family. No differences were found for age group, sex,
and car ownership.
Table 6.3 shows the breakdown of sex, age, and education for the three shopper
groups. Modern grocery store shoppers are significantly (p<0.001) more likely to hold a
master’s degree or higher. While 16% of shoppers in this group have a graduate degree,
only 5% and 4% of traditional and mixed shoppers do, respectively. Those who attained
junior high school education or less also appear to be more inclined to be mixed shoppers
with weaker statistical significance of p<0.1. This finding indicates that more highly
educated individuals are more receptive to western style grocery shopping. This may be

143
due to several factors such as wider array of products (both grocery and non-grocery
items), convenience such as parking, availability of rest rooms, air conditioning, and
restaurants, and perhaps concerns for food safety.
Contrary to the differences between primary and non-primary shoppers in the
previous section, the higher likelihood of having attained higher education is not
accompanied by higher household income (Table 6.4). This may be attributable to the
sample being young populations who are in their early stages of career. Residence type,
household size and whether or not there is a child (18 years and under) in the family,
however, are significant at the p<0.1, p<0.05 and p<0.01 levels respectively (Table 6.5).
It appears that those who live in a condominium and those who live by themselves are
more likely to be modern shoppers. They may find that western-format grocery stores
carry more options for ready-to-eat meals or those that require minimal preparation time.
Those who live in larger household may shop at traditional markets for fresh foods
because of lower prices but also visit modern stores for other items such as dairy and
bakery products. About 40% of modern shoppers live alone, compared with 28% and
16% in the traditional and mixed shopper categories, respectively. On the other hand,
those living in larger households are more likely to be mixed shoppers. About 22% of
mixed shoppers live with 5 family members or more, compared with 11% for both
modern and traditional shopper categories. Presence of children in the household has a
significant influence on where one shops, with greater proportion of those with at least
one child choosing to shop at both store formats regularly (mixed shoppers). Car

144
ownership did not achieve significance in neither among primary vs non-primary
shoppers nor among shopper groups.
Table 6.3: Sex, Age, and Educational Attainment of Modern, Traditional, and
Mixed Shoppers (Chi-squares test)
Characteristics Total Modern
Grocery
Store
Shoppers
N=71
(%)
Traditional
Market
Shoppers
N=85
(%)
Mixed
Shoppers
N=106
(%)
P-
value
Male, n (%) 64 (24.52) 16
(22.54)
20
(25.53)
28
(26.67)
0.795
Age, n (%)
<30 82 (31.30) 26
(36.62)
26
(30.59)
30
(28.30)
0.497
30-44 129
(49.24)
33
(46.48)
42
(49.41)
54
(50.94)
0.843
45-60 45 (17.18) 11
(15.49)
14
(16.47)
20
(18.87)
0.825
60+ 6 (2.29) 1
(1.41)
3
(3.53)
2
(1.89)
0.635
Education, n
(%)
Primary or less 15 (5.75) 3
(4.23)
6
(7.06)
6
(5.71)
0.749
Junior HS* 6 (2.30) 1
(1.41)
0
(0.00)
5
(4.76)
0.081
HS 31 (11.88) 4
(5.63)
13
(15.29)
14
(13.33)
0.151
Vocational 30 (11.49) 9
(12.68)
8
(9.41)
13
(12.38)
0.770
Bachelors 154
(59.00)
38
(53.52)
53
(62.35)
63
(60.00)
0.528
Masters or
higher***
25 (9.58) 16
(22.54)
5
(5.88)
4
(3.81)
0.000

145
Table 6.4: Monthly Household Income and Residence Type of Modern, Traditional,
and Mixed Shoppers (Chi-squares test)
Monthly HH
Income
(baht)
Total Modern
Grocery
Store
Shoppers
n=67
(%)
Traditional
Market
Shoppers
N=82
(%)
Mixed
Shoppers
N=101
(%)
P-value
Monthly HH
Income
(baht), n (%)
< 10,000* 16 (6.40) 2
(2.99)
9
(10.98)
5
(4.95)
0.097
10,000 -
30,000
98 (39.20) 25
(37.31)
33
(40.24)
40
(39.60)
0.894
30,001 –
50,000
62 (24.80) 19
(28.36)
18
(21.95)
25
(24.75)
0.716
50,001 –
100,000
48 (19.20) 12
(17.91)
15
(18.29)
21
(20.79)
0.870
> 100,000 26 (10.40) 9
(13.43)
7
(8.54)
10
(9.90)
0.637
Residence
Type, n (%)
House 113
(43.97)
25
(35.71)
37
(45.53)
51
(50)
0.235
Condo* 43 (16.73) 18
(25.71)
11
(12.94)
14
(13.73)
0.059
Dorm/apt 101
(39.30)
27
(38.57)
37
(43.53)
37
(36.27)
0.474

146
Table 6.5: Household Size and Car Ownership of Modern, Traditional, and Mixed
Shoppers (Chi-squares test)
Characteristics
Total Modern
Grocery
Store
Shoppers
n=71
(%)
Traditional
Market
Shoppers
N=85
(%)
Mixed
Shoppers
N=106
(%)
P-
value
Household
Size, n (%)
Live alone*** 69 (26.34) 28
(39.44)
24
(28.24)
17
(16.04)
0.002
2 family
members
67 (25.57) 13
(18.31)
25
(29.41)
29
(27.36)
0.246
3 family
members
41 (15.65) 11
(15.49)
14
(16.47)
16
(15.09)
0.966
4 family
members
45 (17.18) 11
(15.49)
13
(15.29)
21
(19.81)
0.647
5 or more
family
members*
40 (15.27) 8
(11.27)
9
(10.59)
23
(21.70)
0.058
Child in
Family, n (%)
Yes*** 70 (27.34) 14
(19.72)
16
(19.75)
40
(38.46)
0.004
Car
Ownership, n
(%)
Yes 172
(66.93)
43
(62.32)
52
(62.65)
77
(73.33)
0.193

147
Spending per Trip, Shopping Time, and Travel Time among Shopper Groups
Table 6.6 shows results from analysis of variance (ANOVA) to look at the
possible differences in spending, shopping, and traveling time. Sidak Bonferroni, and
Scheffe post-hoc tests were conducted to examine pairwise comparison.
While most factors do not differ significantly between shopper groups, post-hoc
pairwise tests indicate that mixed shoppers appear to spend significantly more money per
trip to a traditional market. I previously found that shoppers in larger households are
more likely to be mixed shoppers and because ANOVA does not control for this fact, it is
probably that mixed shoppers spend more at markets than other shopper groups simply
because they are buying for more people. Markets are generally cheaper than western
stores and that could be why they choose to purchase more at markets.
Table 6.6: Spending, Shopping, and Traveling Time per Trip (ANOVA)
Characteristics Modern
Grocery Store
Shoppers
N=69
(SD)
Traditional
Market
Shoppers
N=73
(SD)
Mixed
Shoppers
N=98
(SD)
P-
value
SpendSuper 884.78
(551.822)
1037.64
(785.703)
1039.54
(656.607)
0.277
SpendMkt*** 281.7
(222.213)
283.44
(193.013)
415.73
(359.519)
0.002
SpendConvStr 178.01
(155.491)
216.03
(467.07)
208.61
(244.50)
0.414
MinShop 107.06
(72.760)
83.11
(72.584)
101.71
(111.353)
0.240
MinTravel 17.74
(13.911)
19.61
(23.149)
17.92
(15.800)
0.624

148
Shopping Frequency and Spending per Trip among Car Owners and Non-Car
Owners
Independent t-tests were conducted to detect the differences in grocery shopping
behavior among car owners and non-car owners. Results are displayed in Table 6.7.
Even though shopping frequency to all grocery store formats, supermarket,
traditional market, and convenience store, were similar for both groups, car owners spend
significantly more per shopping trip. Car owners spend about 174 baht more than non-car
owners at supermarkets (p<0.05) about 86 baht more per trip to a traditional market
(p<0.01) and about 62 baht more per trip to a convenience store (p<0.1). This is
presumably because it is easier to transport more groceries in private vehicles and
because car owners generally earn higher income.
Table 6.7: Shopping Frequency and Spending per Trip among Car Owners
and Non-Car Owners (ttest)
Car
Owner
N=210
(SD)
Non Car
Owner
N=105
(SD)
P-value
Supermarket Shopping
Frequency
2.685
(0.906)
2.673
(1.065)
0.914
Traditional Market
Shopping Frequency
2.73
(1.239)
2.63
(1.440)
0.538
Convenience Store
Shopping Frequency
3.90
(1.083)
3.93
(1.152)
0.227
Spend at Supermarket** 1040.58 866.65 0.023
Spend at traditional
market***
346.14 259.91 0.010

149
Spend at Convenience
Store*
215.64 153.65 0.070
Importance of Store Attributes among Shopper Groups
Table 6.8 shows results from chi-square tests to examine the importance of store
attributes among shopper groups.
Most shoppers reported giving great importance to most store attributes including
price, location, amenities, cleanliness and organization, product quality, product variety,
and service. Factors that seem less important to shoppers were promotion, availability of
family size packages, and opportunity to build a community relationship. The three that
showed statistical significance in chi-square tests were amenities, service and opportunity
to build a community relationship. The results are not surprising as modern grocery
shoppers are more concerned about amenities such as parking, air conditioning, and
bathrooms which are lacking at most traditional markets. Meanwhile, traditional markets
are known for being a place for community building and personalized service,
characteristics that are not present at modern grocery retailers.

150
Table 6.8: Importance of Store Attributes by Shopper Groups (Pearson Chi2)
Attributes N Mean Mode SD P-
Value
Price 320 3.95 4 0.82 0.709
Location 323 4.42 5 0.66 0.468
Amenities* 318 3.65 4 1.02 0.086
Promotion 320 3.73 3 0.95 0.257
Cleanliness and
Organization
321 4.32 5 0.72 0.672
Product Quality 323 4.48 5 0.68 0.672
Product Variety 321 4.01 4 0.80 0.437
Service** 320 3.66 4 1.06 0.028
Family Size Packages 322 2.84 3 1.05 0.466
Community
Relationship***
322 2.64 3 1.06 0.006
My hypothesis, H2, that socio-demographic profile of consumers significantly
influences their choice of grocery destination, is partially supported. Those with master’s
degree or higher, those who live in a condominium, and those who live alone prefer to
shop exclusively at modern grocery retailers. Participants in the lowest income category,
less than 10,000 baht/month, are significantly more likely to shop primarily at traditional
markets. Finally, those with junior high school education, those who live with 5 or more
household members, and those who live with at least one child ages 18 or younger are
significantly more likely to be mixed shoppers.
IV: Research Question III
The objective of this section is to observe the relationship between the number of days a
subject engages in certain health behavior and their shopping behavior.

151
Results
Table 6.9 shows results from negative binomial regressions to examine the
relationship between health behaviors and shopping destination and the shopping
frequency, controlling for age, gender, and educational attainment. Two sets of
regressions were performed using the same dependent variables.

152
Table 6.9: Negative Binomial Regression controlling for Age, Sex, and Education
Health
Behavior
(number of
days)
Modern
Grocery
Store
Shoppers
Mixed
Shoppers
Frequent
Traditional
Market
Shoppers
Frequent
Supermarket
Shopper
Frequent
Convenience
Store
Shopper
Eat breakfast
outside
0.088
(0.352)
0.069
(0.431)
-0.040
(0.574)
0.041
(0.615)
0.001
(0.986)
Eat dinner
outside
0.127
(0.449)
0.117
(0.461)
-0.089
(0.504)
-0.136
(0.377)
0.195
(0.127)
Eat fast
food***
0.222
(0.363)
0.385
(0.088)*
0.112
(0.527)
0.179
(0.368)
0.560
(0.002)***
Consume
Western snacks
0.174
(0.278)
0.135
(0.365)
-0.050
(0.694)
0.223
(0.115)
0.158
(0.200)
Consume sweet
drinks***
0.030
(0.803)
-0.057
(0.609)
-0.025
(0.785)
0.017
(0.878)
0.266
(0.003)***
Drink
Alcohol***
-0.271
(0.526)
0.136
(0.722)
-0.028
(0.930)
-1.520
(0.003)***
0.651
(0.039)**
Exercise 60 min 0.079
(0.680)
0.030
(0.861)
0.091
(0.531)
0.098
(0.559)
-0.110
(0.427)
Sit at least 8
hours/day***
-0.108
(0.239)
-0.065
(0.443)
-0.014
(0.843)
-0.051
(0.532)
0.172
(0.012)***
Note: traditional market shoppers is a reference group and always takes the value of 1
Results from negative binomial regressions suggest that shopping frequency
matters more than shopping destination. The only variable that achieved statistical
significance in the first set of regressions was Fastfood (the number of days the subject
consumed fast food in the past 7 days) at p<0.1 level for mixed shoppers. From this, one
can say that those who shop regularly at both modern and traditional grocery stores are

153
more likely to consume fast food more often although there is still 10% chance that this is
a pattern but a random chance.
The second set of negative binomial regressions show much stronger results.
Recall that frequent shoppers are defined as “someone who shops at a particular store
format at least three times a week.” Results in Table 6.9 suggest that those who shop at
convenience stores at least three times a week are significantly more likely to engage in
undesirable health behaviors including consuming fast food (p<0.01), sweet drinks
(p<0.01), alcohol (p<0.05), and sitting at least 8 hours a day (p<0.01). An unexpected
result is present for frequent supermarket shoppers as they appear to be significantly less
likely to consume alcohol that there non-frequent supermarket shopper counterparts.
Without additional information, it is unclear why this is the case.
Interestingly, those who shop at traditional markets three or more times a week
are not more likely to engage in undesirable health behaviors than their non-frequent
traditional market shopper counterparts.
Negative Binomial Regression Analysis
The model was selected based on the nature of the dependent variable being count
data and pre-hoc and post-hoc goodness-of-fit tests. The histograms, the mean-equal-
variance test, goodness-of-fit test and the likelihood ratio test of alpha all indicate that the
negative binomial, which is less restrictive allowing variance to be greater than the mean,
is a better fit.

154
Test 1: Histograms
Histograms of the dependent variables show that none of the variables is normally
distributed, thus OLS is not an appropriate model (Table 6.10). Most variables are
skewed to the right with high number of zero values. Poisson and negative binomial
regressions are typically used to analyze such data.

155
0.2
.4.6
.8
De
nsity
0 2 4 6 8DaysBrkfstOutside
0.2
.4.6
.8
De
nsity
0 2 4 6 8DaysWstnSnacks
0.2
.4.6
.8
De
nsity
0 2 4 6 8DaysDinnerOutside
0.5
11.5
2
De
nsity
0 1 2 3 4 5DaysEatFastfood
0.2
.4.6
De
nsity
0 2 4 6 8DaysSweetDrks
0.2
.4.6
.8
De
nsity
0 2 4 6 8DaysExercise60min
0.2
.4.6
.8
De
nsity
0 2 4 6 8DaysSit8Hrs
0.5
11.5
2
De
nsity
0 2 4 6 8DaysDrinkAlc
Table 6.10: Histograms of Health Behavior Variables (Dependent Variables)

156
Test 2: mean equal variance
While both Poisson and Negative Binomial regression models are typically used to
analyze count data, the Poisson is more restrictive in a sense that it assumes the variable
mean to equal its variance while Negative Binomial relaxes such assumption. The results
are displayed in Table 11.
Table 6.11: Mean and Variance of Dependent Variables are not Equal
variable Mean Variance Breakfast
outside
4.445 5.121
Dinner
outside
2.026 3.865
Eat fastfood 0.776 1.168
Western
snacks
1.863 3.163
Sweet
drinks
3.707 6.100
Drink
alcohol
0.489 1.341
Exercise 60
min or more
2.178 4.764
Sit 8 hours
or more
4.430 5.452
As indicated in Table 6.11, the mean and variance of all dependent variables are not the
same. The variance is substantially and consistently larger, a sign of over-dispersion. This
test suggests that Poisson is not an appropriate model.

157
Test 3: Poisson Goodness of Fit (GOF) test
A goodness-of-fit test can be conducted as a post Poisson regression analysis. Table 6.12
details the results from the regressions on my eight dependent variables.
Table 6.12: Pearson’s Chi-Squares Statistics and their Significance
Dependent Variable Pearson’s Chi-Square P-value
Breakfast outside 363.846 0.022
Dinner outside 573.580 0.000
Eat fastfood 460.477 0.000
Western snacks 509.676 0.000
Sweet drinks 514.073 0.000
Drink alcohol 739.204 0.000
Exercise 60 min or more 681.217 0.000
Sit 8 hours or more 380.634 0.004
The Poisson GOF test results are another indicator that the survey data do not fit Poisson
model very well.
Test 4: The Likelihood Ratio Test of Alpha
The likelihood ratio test of alpha is a test of over-dispersion parameter alpha. When there
is no over-dispersion in the data, the negative binomial distribution is the same as a
Poisson distribution (H0: α=0).

158
Table 6.13: Results from the Likelihood Ratio Test of Alpha
Dependent Variable Pearson’s Chi-Square P-value
Breakfast outside 5.88 0.008
Dinner outside 42.70 0.000
Eat fastfood 18.15 0.000
Western snacks 28.01 0.000
Sweet drinks 42.43 0.000
Drink alcohol 63.70 0.000
Exercise 60 min or more 109.58 0.000
Sit 8 hours or more 5.23 0.011
The p-value for all dependent variables is significant suggesting that the null
hypothesis of no over-dispersion is rejected. This reinforces the conclusion that the
Poisson distribution is too restrictive and that the Negative Binomial is a more
appropriate model.
Hypothesis H3 stating that modern grocery shoppers will demonstrate a greater
level of undesirable health behaviors than traditional market shoppers and mixed
shoppers is not supported by this section’s findings. Where one shops does not appear to
be related to one’s health behavior. Conversely, mixed shoppers are found to be more
likely to consume fast foods than their modern and traditional shopper counterparts. The
association is moderately significant at p<0.1 level. Recall that mixed shoppers tend to
live in large households, and larger households are more likely to have children who
often are attracted to fast foods. This may prompt shoppers in this group to be more likely
to dine out with family members.
Hypothesis H4 stating that those who frequent modern grocery retailers will
demonstrate greater level of undesirable health behaviors than those who do not frequent

159
modern grocery retailers is partially supported. Certain undesirable health behaviors were
found to be significantly associated with the frequency at which one shops at a particular
grocery store format. The strongest results were found among frequent convenience store
shoppers. Those who visit convenience store at least three times a week were more likely
to consume fast food, sweet drinks, alcohol, and to sit for at least 8 hours a day. An
unexpected finding was that frequent supermarket shoppers were significantly less likely
to consume alcohol than those who visit supermarkets less than 3 times a week. Thailand
has law where alcohol beverages could be sold only between 11 am – 2 pm and 5 pm –
midnight. Large grocery stores strictly follow this law whereas smaller ones are more
flexible. As such, drinkers may choose to go to smaller food outlets for their alcohol
purchases.
From these findings, a shopping destination does not appear to have a significant
association with one’s tendency to engage in undesirable health behaviors. However, the
frequency at which one visits a certain type of store outlet does. In this case, frequent
convenience store shoppers are more likely to have taken up a number of undesirable
health habits.

160
V: Research Question IV
Results
Subsection 5.1: Shopper Groups
Tables 6.14 to 6.16 show results from Ordinary Least Squares regressions to examine the
relationship between obesity measures (BMI, percent body fat, and waist circumference)
and primary shopping destination (modern, traditional, or mixed). Each set of regressions
contain four models using the same dependent variable with varying control variables.
a.) BMI and Shopping Destination
The first set of regression explores the association between BMI and shopping destination.
The first model contains only the independent variables of interest Shopcat
(Modern_Shoppers, Traditional_Shoppers, and Mixed_Shoppers).
The second model contains the control variables Age, Male, and Educ.
The third model contains the control variables Age, Male, Educ, HHMem, Child, OwnCar,
and FTWrkrs.
The fourth model contains the control variables Age, Male, BrkfstOut, DinnerOut,
Fastfood, WstnSnacks, SwtDrinks, Alcohol, Exercise60Min, and Sit8Hrs.
Mixed shoppers are significantly more likely to have higher BMI than those who
shop primarily at only one type of store format (traditional or modern) at p<0.05 level,
controlling for age and sex (model 1 and model 2). Ceteris paribus, mixed shoppers are

161
predicted to have 1.5 points higher BMI than non-mixed shoppers. After adding controls
for household characteristics, however, the significance diminishes in model 3. Age and
sex are consistently significant in all models. Not surprisingly, increasing age is
associated with increasing BMI. Contrary to finding in other studies, being male is
associated with having higher BMI (Aekplakorn et al. 2014, Jitnarin et al. 2010,
Pongchaiyakul et al. 2006).
This is perhaps due to the sample being younger than Thailand average population
and being urban dwellers. Young Asian women have been reported to develop greater
body dissatisfaction than all other cultural groups (Soh et al. 2008). Similarly, young
women in Bangkok are conscious about their image and strive to stay skinny whereas
men do not have the same level of societal pressure from the media. Unlike in the West
where discussions of body positivity are becoming the norm and people have learned to
embrace different body types, that trend has not reached Southeast Asia. Though slowly
changing, the prevailing beauty standards in Thailand are still skinny and fair-skinned as
portrayed through the media and represented by TV stars. There is an enormous pressure
to conform. It is challenging to find clothes larger than a size 4. Most local fashion stores
carry only one size clothing and that one size is equivalent to a small or even an extra
small in US sizing. Larger women either give up fashion by wearing men’s clothes or
spend significantly more by shopping in department stores.
Other factors that appeared to be significant determinant of BMI in the sample
were the number of household members (p<0.05) and the frequency of fast food

162
consumption (p<0.05). Living in a large household is associated with higher BMI. As
eating is a social activity, it is possible that people eat more often and in greater quantity
when there are many people to share food with. The only health behavior that has a
significant impact on BMI is the number of days the subject ate fast food in the last 7
days. A one day increase in the number of days one consumes fast food is associated with
a 0.599 points increase in BMI. This is consistent with findings from previous studies on
fast food consumption and obesity (Pereira et al. 2005; Dhingra et al. 2007; Niemeier et
al. 2006).

163
Table 6.14: OLS Results of BMI and Shopper Groups
Model 1 Model 2 Model 3 Model 4
N 242 242 227 212
Traditional
shoppers
1 1 1 1
Modern shoppers -0.071
(0.925)
0.131
(0.860)
0.278
(0.721)
-0.158
(0.851)
Mixed Shoppers 1.524
(0.029)**
1.509
(0.027)**
0.866
(0.229)
0.458
(0.555)
Age group 1.266
(0.001)***
0.803
(0.058)*
0.990
(0.033)**
Male 1.527
(0.022)**
1.478
(0.031)**
1.790
(0.018)**
Education -0.019
(0.936)
-0.276
(0.326)
-0.410
(0.209)
Number of
household members
0.657
(0.034)**
0.753
(0.021)**
A child in
household
-0.712
(0.374)
-0.592
(0.482)
Own a car 1.115
(0.109)
0.976
(0.192)
Number of FT
workers
-0.217
(0.618)
-0.377
(0.421)
Days eat breakfast
outside
0.047
(0.738)
Days eat dinner
outside
0.105
(0.574)
Days eat Fast food 0.553
(0.073)*
Days eat western
snacks
0.160
(0.409)
Days drink sugary
beverage
0.102
(0.440)
Days drink alcohol -0.336
(0.300)
Days exercise 60
min or more
-0.157
(0.273)
Days sit at least 8
hours
0.092
(0.518)

164
b.) Percent Body Fat (PBF) and Shopping Destination
The second set of regression explores the association between PBF and shopping
destination.
The first model contains only the independent variables of interest Shopcat
(Modern_Shoppers, Traditional_Shoppers, and Mixed_Shoppers)
The second model contains the control variables Age, Male, and Educ.
The third model contains the control variables Age, Male, Educ, HHMem, Child, OwnCar,
and FTWrkrs.
The fourth model contains the control variables Age, Male, BrkfstOut, DinnerOut,
Fastfood, WstnSnacks, SwtDrinks, Alcohol, Exercise60Min, and Sit8Hrs.
In the second set of regressions with PBF as the dependent variable, none of the
shopper groups achieved significance in any of the models. Shopping destination does
not appear to play an important role in one’s PBF. As with BMI, age and sex are
consistently significant in all 3 models that they are included.
In terms of household characteristics, the number of household members one lives
with is not significant. Instead, people who own cars are significantly more likely to have
higher PBF than those who do not own cars.

165
Table 6.15: OLS Results of PBF and Shopper Groups
Model 1 Model 2 Model 3 Model 4
N 241 241 226 211
Traditional 1 1 1 1
Modern 0.014
(0.991)
0.050
(0.959)
0.356
(0.723)
-0.415
(0.714)
Mixed
Shoppers
0.407
(0.698)
0.568
(0.521)
0.043
(0.964)
-0.359
(0.731)
Age group 2.196
(0.000)***
1.695
(0.004)**
1.899
(0.002)***
Male -7.743
(0.000)***
-7.773
(0.000)***
-7.146
(0.000)***
Education 0.182
(0.572)
-0.346
(0.356)
-0.734
(0.094)*
Number of
household
members
0.195
(0.653)
0.393
(0.367)
A child in
household
0.021
(0.984)
0.387
(0.732)
Own a car 2.221
(0.030)*
1.771
(0.079)*
Number of FT
workers
0.446
(0.460)
0.027
(0.966)
Days eat
breakfast
outside
0.177
(0.355)
Days eat
dinner outside
0.382
(0.133)*
Days eat Fast
food
0.451
(0.275)
Days eat
western snacks
0.012
(0.963)
Days drink
sugary
beverage
0.176
(0.320)
Days drink
alcohol
-0.796
(0.068)*
Days exercise
60 min or more
-0.173
(0.366)
Days sit at
least 8 hours
-0.007
(0.970)

166
c.) Waist Circumference (WC) and Shopping Destination
The third set of regression explores the association between WC and shopping destination.
The first model contains only the independent variables of interest Shopcat
(Modern_Shoppers, Traditional_Shoppers, and Mixed_Shoppers).
The second model contains the control variables Age, Male, and Educ.
The third model contains the control variables Age, Male, Educ, HHMem, Child, OwnCar,
and FTWrkrs.
The fourth model contains the control variables Age, Male, BrkfstOut, DinnerOut,
Fastfood, WstnSnacks, SwtDrinks, Alcohol, Exercise60Min, and Sit8Hrs.

167
Table 6.16: OLS Results of WC and Shopper Groups
Model 1 Model 2 Model 3 Model 4
N 240 240 226 211
Traditional 1 1 1 1
Modern 0.707
(0.692)
0.769
(0.657)
1.050
(0.560)
0.122
(0.954)
Mixed
Shoppers
3.039
(0.075)*
2.968
(0.074)*
1.538
(0.401)
0.641
(0.742)
Age group 2.454
(0.005)***
1.498
(0.156)
1.775
(0.127)*
Male 6.394
(0.000)***
6.218
(0.000)***
7.119
(0.000)***
Education 0.623
(0.249)
0.099
(0.885)
-0.131
(0.873)
Number of
household
members
1.688
(0.060)*
1.965
(0.016)**
A child in
household
-2.006
(0.309)
-2.004
(0.342)
Own a car 1.789
(0.337)
1.315
(0.485)
Number of FT
workers
-0.826
(0.427)
-1.204
(0.305)
Days eat
breakfast
outside
0.457
(0.196)
Days eat
dinner outside
0.061
(0.896)
Days eat Fast
food
1.062
(0.170)
Days eat
western snacks
0.159
(0.743)
Days drink
sugary
beverage
0.214
(0.516)
Days drink
alcohol
-0.832
(0.306)
Days exercise
60 min or more
-0.693
(0.054)**
Days sit at
least 8 hours
0.254
(0.478)

168
Subsection 5.2: Frequent Shoppers
Tables 6.17 to 6.19 show results from Ordinary Least Squares regressions to examine the
relationship between obesity measures (BMI, percent body fat, and waist circumference)
and shopping frequency (whether one shops at a particular store type at least 3 times a
week). Each set of regressions contain four models using the same dependent variable
with varying control variables.
a.) BMI and Shopping Frequency
The first set of regression explores the association between BMI and shopping frequency.
The first model contains only the independent variables of interest Freq_Super,
Freq_ConvStr, and Freq_TradMkt. Note that these categories are NOT mutually
exclusive.
The second model contains the control variables Age, Male, and Educ.
The third model contains the control variables Age, Male, Educ, HHMem, Child, OwnCar,
and FTWrkrs.
The fourth model contains the control variables Age, Male, BrkfstOut, DinnerOut,
Fastfood, WstnSnacks, SwtDrinks, Alcohol, Exercise60Min, and Sit8Hrs.

169
Table 6.17: OLS Results of BMI and Shopping Frequency
Model 1 Model 2 Model 3 Model 4
N 325 324 293 271
FQ Modern
shoppers
0.325
(0.625)
0.369
(0.564)
0.486
(0.459)
0.247
(0.730)
FQ Traditional
shoppers
1.247
(0.036)**
1.216
(0.036)**
0.938
(0.122)
1.020
(0.120)*
FQ
convenience
store Shoppers
-0.018
(0.972)
0.411
(0.418)
0.679
(0.201)
0.273
(0.630)
Age group 1.339
(0.000)***
1.00
(0.007)***
1.212
(0.003)***
Male 1.756
(0.004)***
1.725
(0.005)***
2.327
(0.001)***
Education -0.152
(0.484)
-0.260
(0.300)
-0.429
(0.140)*
Number of HH
members
0.637
(0.021)**
0.681
(0.020)**
A child in HH -0.537
(0.420)
-0.314
(0.645)
Own a car 1.000
(0.089)*
0.733
(0.241)
Number of FT
workers
-0.503
(0.164)
-0.647
(0.103)*
Days eat
breakfast
outside
0.031
(0.814)
Days eat
dinner outside
-0.008
(0.956)
Days eat fast
foods
0.587
(0.023)**
Days eat
western snacks
0.157
(0.372)
Days drink
sugary
beverage
0.116
(0.295)
Days drink
alcohol
-0.341
(0.183)
Days exercise
60 min or
more
-0.150
(0.268)
Days sit at
least 8 hours
0.138
(0.246)

170
b.) PBF and Shopping Frequency
The second set of regression explores the association between PBF and shopping
frequency.
The first model contains only the independent variables of interest Freq_Super,
Freq_ConvStr, and Freq_TradMkt. Note that these categories are NOT mutually
exclusive.
The second model contains the control variables Age, Male, and Educ.
The third model contains the control variables Age, Male, Educ, HHMem, Child, OwnCar,
and FTWrkrs.
The fourth model contains the control variables Age, Male, BrkfstOut, DinnerOut,
Fastfood, WstnSnacks, SwtDrinks, Alcohol, Exercise60Min, and Sit8Hrs.

171
Table 6.18: OLS Results of PBF and Shopping Frequency
Model 1 Model 2 Model 3 Model 4
N 324 323 292 296
FQ Modern
shoppers
1.115
(0.298)
1.272
(0.201)
1.569
(0.128)
0.855
(0.180)
FQ Traditional
shoppers
1.716
(0.055)
1.187
(0.132)
1.077
(0.208)
1.539
(0.056)
FQ
convenience
store Shoppers
-2.443
(0.003)***
-0.293
(0.699)
-0.137
(0.864)
-0.812
(0.316)
Age group 1.951
(0.000)***
1.712
(0.002)***
2.138
(0.000)***
Male -7.578
(0.000)***
-7.464
(0.000)***
-6.255
(0.000)***
Education 0.154
(0.596)
-0.213
(0.531)
Number of HH
members
0.077
(0.848)
A child in HH -0.512
(0.596)
Own a car 2.094
(0.018)**
Number of FT
workers
0.172
(0.740)
Days eat
breakfast
outside
0.200
(0.251)
Days eat
dinner outside
-0.121
(0.515)
Days eat Fast
food
0.506
(0.103)
Days eat
western snacks
0.122
(0.591)
Days drink
sugary
beverage
0.216
(0.160)
Days drink
alcohol
-0.994
(0.000)***
Days exercise
60 min or more
-0.298
(0.083)*
Days sit at
least 8 hours
0.118
(0.478)

172
c.) WC and Shopping Frequency
The third set of regression explores the association between WC and shopping frequency.
The first model contains only the independent variables of interest Freq_Super,
Freq_ConvStr, and Freq_TradMkt. Note that these categories are NOT mutually
exclusive.
The second model contains the control variables Age, Male, and Educ.
The third model contains the control variables Age, Male, Educ, HHMem, Child, OwnCar,
and FTWrkrs.
The fourth model contains the control variables Age, Male, BrkfstOut, DinnerOut,
Fastfood, WstnSnacks, SwtDrinks, Alcohol, Exercise60Min, and Sit8Hrs.

173
Table 6.19: OLS Results of WC and Shopping Frequency
Model 1 Model 2 Model 3 Model 4
N 324 322 292 295
FQ Modern
shoppers
1.739
(0.408)
0.667
(0.700)
0.576
(0.745)
-0.030
(0.987)
FQ Traditional
shoppers
2.445
(0.122)
2.269
(0.113)
1.854
(0.221)
2.352
(0.218)
FQ
Convenience
store Shoppers
0.687
(0.594)
0.814
(0.524)
1.459
(0.280)
0.109
(0.936)
Age group -2.925
(0.001)***
2.145
(0.023)**
3.389
(0.000)***
Male 6.891
(0.000)***
6.477
(0.000)***
8.666
(0.000)***
Education 0.390
(0.398)
0.141
(0.798)
Number of HH
members
1.675
(0.030)**
A child in HH -1.785
(0.299)
Own a car 2.092
(0.156)
Number of FT
workers
-1.467
(0.101)
Days eat
breakfast
outside
0.457
(0.121)
Days eat dinner
outside
-0.499
(0.132)
Days eat Fast
food
1.650
(0.008)***
Days eat
western snacks
0.160
(0.682)
Days drink
sugary
beverage
0.268
(0.318)
Days drink
alcohol
-0.897
(0.097)*
Days exercise
60 min or more
-0.626
(0.037)**
Days sit at least
8 hours
0.366
(0.172)

174
Hypothesis H5 stating that those who shop primarily at modern grocery retailers will
score higher on obesity measures than those who shop primarily at traditional markets
and those who shop at both equally is not supported by this section’s findings. Modern
grocery retailer shoppers and traditional market shoppers were not associated
significantly with any obesity measures (BMI, PBF, and WC). Although mixed shoppers
were found to be significantly more likely to have higher BMI and WC in some models,
the effects were not consistent for all three measures of obesity. In addition, the
significance disappeared after controlling for household characteristics and health
behaviors.
Bangkok dwellers, especially, the young and single often eat out as a way to
socialize and be seen. Yasmeen (2000) termed the phenomenon ‘public eating’ and
observed that incredibly few people in Bangkok cook at home regularly given the
availability and affordability of prepared foods outside of home. Many apartments and
small condominiums also do not have full kitchen or lack proper ventilation for efficient
cooking of aromatic Thai cuisine. Another reason for the popularity of dining out is that
Thailand, and particularly Bangkok, has the highest female labor force participation rates
in Southeast Asia (Ibid.). Few women stay home and cook. For many people in the
sample, then, grocery shopping may not be the main source of caloric intake such that
grocery destination of choice does not influence health behavior in significant ways.
Hypothesis H6 stating that those who frequent modern grocery retailers will score
higher on obesity measures than those who frequent fresh markets was not only rejected

175
but was contradicted. Findings from this section suggest that frequent traditional shoppers
are more likely to have higher BMI than non-frequent traditional shoppers. The
association was quite strong at p<0.05 even after controlling for age, gender, and health
habits, but was not true with other obesity measures, PBF and WC, where association
was not significant. While BMI is the most common indicator of obesity, PBF and WC
are better indicators of health risks. A person with a high BMI but low PBF and small
WC are less likely to develop diabetes and hypertension, among other conditions, than
those who are centrally obese with normal BMI. This finding is, thus, not necessarily
alarming although further investigation is required. Stature was not looked at in this study
but could be a factor that explains this outcome. Traditional shoppers were found to be
significantly more likely to be in the lowest income category and thus are more likely to
face the problem of stunting which would affect their BMI. Another possible explanation
could be that traditional shoppers are more likely to be labor workers with high muscle
mass. Since muscle weighs more than fat, they would appear to be heavy for their height
while maintaining low PBF.
Convenience store frequent shoppers show strong negative association with PBF
suggesting that they are likely to have lower PBF. The effect, however, disappear when
age and gender were controlled for, telling us that those who frequent convenience stores
are probably significantly younger than those who do not. A person’s PBF is likely to
increase naturally with age. No significant relationship was observed for WC and
shopping frequency.

176
Conclusion
In this chapter, descriptive statistics show the sociodemographic discrepancies
between primary and non-primary grocery shoppers. The two groups differ significantly
in age, educational attainment, monthly salary, as well as household size. The proposed
hypotheses were supported, partially supported, rejected, or contradicted by the results of
the model analyses. H1 was supported by an exploratory spatial analysis revealing
unequal access to grocery stores and traditional markets in different areas of Bangkok.
The analysis is preliminary and requires further examination with more data to draw any
meaningful conclusions.
H2 was partially supported. Certain socio-demographic characteristics of primary
shoppers including educational attainment, monthly salary, residence type, household
size, and presence of a child in the family, are related to their choice of grocery
destination. In terms of spending, car owners, as expected, spend more per shopping trip
both to modern and traditional outlets. Amenities, service, and opportunity for
community relationship are store factors that differ between shopper groups.
H3 and H4 explore the relationship between health behavior and grocery shopping
destination and were also partially supported. Shopping frequency appears to matter more
than simply choice of grocery store. Those who shop at supermarkets and convenience
stores three or more times a week display significantly more undesirable health behavior,
compared with those who visit such stores less often. Frequent shoppers of traditional
markets, however, do not have similar tendencies.

177
The association between grocery destination choice and obesity measures was
tested with H5 and H6. Both hypotheses were not supported by the findings and H6 was
even contradicted. Modern grocery shoppers were not more likely than traditional or
mixed shoppers to be obese. Grocery destination choice did not significantly influence
shoppers’ BMI, PBF, and WC. When frequency of visits was taken into consideration,
those who visit traditional markets three or more times a week appeared to have
significantly higher BMI than infrequent traditional shoppers. Those who shop at
supermarkets or convenience stores three or more times a week did not show
significantly higher likelihood of scoring higher on any obesity measures.

178
REFERENCES
Aekplakorn, Wichai, Rungkarn Inthawong, Pattapong Kessomboon, Rassamee
Sangthong, Suwat Chariyalertsak, Panwadee Putwatana, and Surasak
Taneepanichskul. 2014. “Prevalence and Trends of Obesity and Association with
Socioeconomic Status in Thai Adults: National Health Examination Surveys,
1991–2009.” Journal of Obesity 2014 (March). doi:10.1155/2014/410259.
Dhingra, Ravi, Lisa Sullivan, Paul F. Jacques, Thomas J. Wang, Caroline S. Fox, James
B. Meigs, Ralph B. D’Agostino, J. Michael Gaziano, and Ramachandran S. Vasan.
2007. “Soft Drink Consumption and Risk of Developing Cardiometabolic Risk
Factors and the Metabolic Syndrome in Middle-Aged Adults in the Community.”
Circulation 116 (5): 480–88. doi:10.1161/CIRCULATIONAHA.107.689935.
Jitnarin, Nattinee, Vongsvat Kosulwat, Nipa Rojroongwasinkul, Atitada Boonpraderm,
Christopher K. Haddock, and Walker S.C. Poston. 2010. “Risk Factors for
Overweight and Obesity among Thai Adults: Results of the National Thai Food
Consumption Survey.” Nutrients 2 (1): 60–74. doi:10.3390/nu20100060.
Matsa, David A. 2011. “Competition and Product Quality in the Supermarket Industry.”
The Quarterly Journal of Economics, August, qjr031. doi:10.1093/qje/qjr031.
Niemeier, Heather M., Hollie A. Raynor, Elizabeth E. Lloyd-Richardson, Michelle L.
Rogers, and Rena R. Wing. 2006. “Fast Food Consumption and Breakfast Skipping:

179
Predictors of Weight Gain from Adolescence to Adulthood in a Nationally
Representative Sample.” Journal of Adolescent Health 39 (6): 842–49.
doi:10.1016/j.jadohealth.2006.07.001.
Pereira, Mark A, Alex I Kartashov, Cara B Ebbeling, Linda Van Horn, Martha L Slattery,
David R Jacobs, and David S Ludwig. 2005. “Fast-Food Habits, Weight Gain, and
Insulin Resistance (the CARDIA Study): 15-Year Prospective Analysis.” The Lancet
365 (9453): 36–42. doi:10.1016/S0140-6736(04)17663-0.
Pongchaiyakul, Chatlert, Tuan V Nguyen, Vongsvat Kosulwat, Nipa Rojroongwasinkul,
Somsri Charoenkiatkul, Choowong Pongchaiyakul, Patara Sanchaisuriya, and Rajata
Rajatanavin. 2006. “Defining Obesity by Body Mass Index in the Thai Population:
An Epidemiologic Study.” Asia Pacific Journal Of Clinical Nutrition 15 (3): 293–99.
Soh, Nerissa Li-Wey, Stephen Touyz, Timothy Dobbins, Lois Surgenor, Simon Clarke,
Michael Kohn, Ee Lian Lee, et al. 2008. “Body Image Disturbance in Young North
European and East Asian Women with and without Eating Disorders in Australia
and in Singapore.” European Eating Disorders Review: The Journal of the Eating
Disorders Association 16 (4): 287–96. doi:10.1002/erv.836.
Yasmeen, Gisèle. 2000. “Not ‘From Scratch’: Thai Food Systems and ‘public Eating.’”
Journal of Intercultural Studies 21 (3): 341–52. doi:10.1080/07256860020007494.

180
CHAPTER SEVEN: DISCUSSION AND IMPLICATIONS
This research provides both relevant and valuable information on the relationship
between the Bangkok food retail scene and diet-related behaviors and weight status. The
project has utilized several models to examine the characteristics of people who regularly
shop at traditional and/or modern outlets and how their grocery destination choice relates
to their health behavior and weight status. The analysis of the spatial and collected survey
data indicates unequal access to grocery stores in different parts of Bangkok. Each
shopper group has distinct socio-demographic characteristics. It also shows that while
shopping at modern grocery stores may not influence health behavior, the frequency at
which shoppers visit these outlets are related to certain unhealthy habits in similar ways
the previous study by Kelly et al. (2014) found. These unhealthy habits have not
translated to higher likelihood of obesity in this frequent shopper group. On the contrary,
the results show frequent traditional market shoppers to be more likely to have higher
BMI. Table 7.1 shows summary of findings.

181

182
This study is one of the first to examine the relationship between grocery
destination choice, health behavior, and weight status as the supermarket revolution is
taking place, changing the way people shop and consume. This chapter details the
limitations and applicability of the study. Policy implications and recommendations are
also discussed given the findings. The final section gives directions for future research
projects.
I: Limitations and Generalizability
As mentioned in chapter five, the survey for this study was adapted from the US
National Health and Nutrition Examination Survey (NHANES) and adjusted for cultural
relevancy which has its strengths and weaknesses. The NHANES has been in use since
1971 to assess the health and nutritional status of adults and children living in the US. It
has been tested and validated to measure and track changes over time but has never been
used with the Thai population. There may be important discrepancies between the
American and Thai populations not picked up by the survey.
The spatial analysis of Bangkok food landscape is rudimentary. While it is
visually interesting to see the spread and clustering of grocery outlets, conclusions cannot
be drawn using current data. First, the analysis does not take into account population
density and income in each district which would create varying demands for the number
and types of grocery stores. Second, traditional markets vary tremendously in size and the
products they carry. Some are publicly owned while others are privately owned. Many of

183
the private markets are not registered with the city. It is, therefore, difficult to have an
accurate count and picture of traditional markets in Bangkok.
The study has limited generalizability. It was conducted using a convenience
sample to represent working age individuals living in Bangkok, Thailand. This
undercoverage creates an “error of non-observation” where the sample characteristics and
responses deviate from those of the population the survey wishes to represent (Groves et
al. 2009). While the frame population come from three survey sites; an elementary school,
a hospital, and a telecommunication company, that are diverse industries, workers in
these industries have higher educational attainment than the general Bangkok population
as indicated by the high proportion of college graduates in the sample. Participants were
self-selected, as opposed to randomly-selected, and therefore were likely to be those who
are more health-conscious. Non-participants may be aware of their undesirable health
behavior and did not wish to be consulted by health professionals. In addition, although
participation was open to workers of lower income level within those institutions such as
housekeepers, security guards, and drivers, interest was low among the group, partly due
to their lack of reading proficiency.
A major difficulty with recruiting participants from more diverse populations is,
first and foremost, funding. A limited amount of fund available was sufficient to get a
pilot data collection for the project. Each event was run by approximately 20 health care
professionals and facilitators who were paid a daily rate. Several dietetics student interns
were used to minimize costs. Another obstacle was in the entrepreneurial nature of jobs
in Thailand. The meager Thai salary and benefits of being employed by a company often

184
gives people with lower level of education the economic incentives to set up their own
small business. Many people choose to own a food stall or a clothing or souvenir shop
that requires little capital and gives them work schedule flexibility and independence.
Because these people are not part of an organization, it is difficult to capture this segment
of the working population.
There is no accepted international standard for the measurement of obesity for
Asian populations and “construct validity”, or the “extent to which the measure is related
to the underlying construct” (Groves et al. 2009 p.49) may be of concern. BMI is the
most common measure of obesity but the cut-offs are arbitrary. Five indicators of obesity,
BMI, PBF, VCF, WC, and WHR were planned to be used as proxies for health status and
analyzed as continuous outcomes. However, we had access to different body composition
analysis machines during the first and second waves of data collection which yielded
differing units of measurements for visceral fat (VCF). Because the differences could not
be reconciled, the variable was dropped during the analysis. Waist-hip ratio (WHR) was
also dropped. It is low-cost but has not been a popular measure as there is high risk of
human error when measuring due to differences in understanding of where waist and hips
are. Waist-hip ratio is more likely to detect obesity in populations who store fat mid-body
but who are at a healthy weight. The final analysis, therefore, included only BMI, PBF,
and WC.
In a bigger picture, the generalizability of the study to other provinces of Thailand
is also limited. Bangkok, as the country’s capital city, is distinct in its population,
educational attainment, land use, as well as policy characteristics. The manner in which

185
other major cities in Thailand develop may not take the exact pattern as Bangkok. The
study may be more applicable to other capital cities in the Southeast Asian developing
region such as Laos, Cambodia, and Burma, as they have similar culture, political
dynamics and development pattern. As the region becomes a free trade zone under the
Asia Economic Community (AEC), the gaps will become even smaller.
II: Policy Implications and Recommendations
In examining the policy implications of this study, it is useful to look at the
parallels and lessons that can be learned from the smoking epidemic (Sacks et al. 2011).
The issue of obesity epidemic is often compared to cigarette smoking prevalence,
glorified by the media as a fashionable thing to do, during the 1950s and 1960s. It took
50 years of concerted efforts, lawsuits, studies, and intense pressure on the cigarette
industry to demonstrate the harm of smoking and curb the incidents of smoking-related
diseases. A large part of why it took so long for scientific evidence of the harm of
smoking to translate into health policies is due to conflicting interests of the powerful
cigarette industry.
Similarly, it’s undeniable that multibillion food and beverage industries have an
interest in keeping their most profitable products on the supermarket shelf. As it turns out,
these high margin products are usually not healthy options. In the US, concerns over
national health care costs solidified the issue of obesity into a “policy regime” with clear
stakeholders and public officials dominating the media coverage and the policy debates
(Kersh 2009). Unfortunately, health policies seem to be driven, in a large part, by

186
economic imperatives rather than scientific evidence. Now, obesity is in many ways
different from smoking. One obvious aspect is the fact that there is no clear villain in the
case as with cigarette smoking. Food is necessary for survival. Scientists and researchers
cannot agree on what constitutes bad foods and the connotation keeps changing from fat,
to specific kinds of fats like transfat, to sugar. New studies keep the field evolving and at
times present conflicting results. There is also an issue of lack of physical activity from
the proliferation of labor-saving innovations and increased screen time, on the television,
computer, as well as smart phone. As it is a multi-faceted condition, there is no simple
solution. Effective interventions must involve the collaboration of many stakeholders not
only in the health field but also in transportation, urban planning, education, among
others. Obesity is, thus, a much more complex issue.
The study findings have important policy implications regarding the control and
prevention of obesity and diet-related chronic diseases. Thailand is a rapidly developing
country that has yet to be free from third world diseases including undernutrition,
stunting, and wasting. Thai policymakers, therefore, face battles at both fronts and must
find a middle ground to address issues of nutrition backlog. The following paragraphs
details policy recommendations based on the dissertation’s literature review, the surveyed
populations, and mathematical analyses.
a.) Create a task force on obesity
Some of the findings in this study could not be explained with the included
control variables. Obesity is not a straight forward issue. Increased exposure to processed
foods and even unhealthy behaviors are not associated with a greater likelihood of being

187
obese. Obesity problem transcends the health field and a multidisciplinary task force is
necessary to effectively address the issue. The government must acknowledge that this is
no longer an issue of personal responsibility. Looking at the population and
understanding the people that need help is essential in creating a coordinated inter-agency
plan that includes participants from different fields, levels of government, as well as the
private and NGO sector. Community participation is crucial in finding solutions. Insights
from non-traditional disciplines will be helpful in tackling the issue from several angles
as eating is not only daily activity but also an integral part of core social processes. The
task force must establish a clear and achievable goal, identify key benchmarks, guidelines,
evaluation mechanisms, and provide a forum for idea-sharing both at the local and
national levels.
The task force should have funding allocated to design and validate a tool such as
the survey used in this study that would be available for researchers in this field. A
representative group of participants from regions of Thailand should be recruited for, first,
an in-depth interview, then to answer candidate questions for the survey questionnaire. A
validated survey that can be commonly used will allow for comparability between studies.
This is beneficial for program evaluation and longitudinal studies. In the long run, having
a standardized measurement tool is more economical and has communication advantages
because it eliminates the discrepancies in the wordings of surveys that could alter
participants’ understanding and responses.
Thailand already has the National Health Examination survey focusing on
identifying disease prevalence and risk factors such as physical activity, diet, tobacco and

188
alcohol use, and living conditions. This is one venue where questions regarding diet and
grocery shopping behavior can be added to investigate the issue of obesity.
A similar task force was created in the US to combat childhood obesity.
Following the Let’s Move campaign led by First Lady Michelle Obama, President Barack
Obama appointed a task force aimed at eradicating childhood obesity within a generation.
Members of the task force included authority figures from departments such as
Agriculture, Health and Human Services, Education, and Office of Management and
Budget. The objectives were broadly grouped into 1. Forming healthy path in early
childhood 2. Empowering parents and caregivers 3. Providing healthy food in schools 4.
Increasing access to healthy and affordable food, and 5. Increasing physical activity.
It is unclear what will happen to the task force once the Obama administration
term ends. The election cycle and change of administration in Thailand also has had
effects on funding for many programs rendering them unsuccessful due to interrupted
financial flow. Collaboration with the private and NGO sectors may help maintain
existence of the task force beyond the life of the administration that creates it. Evaluation
mechanisms will also allow for case studies and replications in various localities as well
as expansion of program scale.
b.) Utilize the Healthy Cities model to address diet-related risk behaviors and
environments
Literature review suggests there is a need for monitoring and evaluation which
affects the effectiveness and sustainability of health programs. Using existing health
promotion models and adapting to the local needs is one way to avoid trial and error each

189
time. The concept and importance of “healthy settings” is not new in Thailand. In 1996,
the Thai government launched Healthy Cities Project on World Health Day, in
collaboration with the WHO. The project receives an annual budget to improve
community environments to address sanitation and other health issues. The movement is
led by the National Steering Committee with subcommittees at both national and local
levels. Public and private organizations and the civil society actively work together to
establish and implement policies aimed at creating healthy environments (WHO 2003).
The decentralization approach of the model gives local administrative authorities the
power to identify and provide sustainable solutions to the problems in their own
communities.
Although the model has been successful in a number of areas, the focus is still
mainly on food and water safety and waste management to prevent infectious diseases
(ACFSb 2015). As Thailand experiences greater level of chronic conditions such as
hypertension, obesity, and diabetes, the Healthy Cities model can provide a promising
framework and network of authorities to address some of the food environments and
physical infrastructure that encourage risk behaviors such as the lack of footpath
discouraging people from walking. Building supportive environments for healthy living
should be made a priority in the face of rapid regional development. The task force on
obesity should take the role in advising how the healthy cities model could be adapted to
meet the local needs.

190
c.) Target women and young children
Seventy-five percent of surveyed primary shoppers in this study are women.
Women are often the primary grocery shopper and cook for the household. Getting
women to lead a healthy lifestyle will have positive influence on the family as a whole.
Nutrition education aimed at women with less than a bachelor’s degree can be a starting
point. Highly educated women with salary in the upper range are less likely to be primary
shoppers.
There is abundant evidence that the most effective way to form healthy habits is
by starting as early in life as possible (Brotman et al. 2012). This study also shows that
households with children are more likely to be mixed shopper. Mixed shoppers are more
likely to consume fast food and have higher BMI and WC than other shopper groups. It is
important that socially and culturally appropriate measures be identified to minimize
effects of changing food shopping and consumption patterns on children. This may
include encouraging employers to offer longer paid maternity leave which can lengthen
the duration of breastfeeding (Ogbuanu et al. 2011). Breastfeeding is shown to be a
significant protection against childhood obesity (Yan et al. 2014). If policymakers can
give children healthy early years, they will be less likely to develop undesirable
conditions later or be more resilient to illnesses.
The Health Promoting Schools Framework (HPSF) has been widely used in the
past decade to address childhood obesity. The model aims to create healthy school
environments, consistent with social ecological theories and the social cognitive theory.
Children spend significant amount of time in school which makes schools an intuitive

191
setting for interventions. Evidence also points towards potential long-term effects from
obesity interventions in school settings (Kelishadi and Azizi-Soleiman 2014). Local
authorities should set standards for school environment to promote healthy habits. For
example, soda and candies should not be sold in school. The HPSF encourages multilevel
interventions that do not only include environmental change but also community
participation and behavior modification programs. The stress on community involvement
and the understanding of the target population, in terms of their values and way of life, is
crucial to the success of the program. The model addresses many aspects of health
influences that are beneficial for obesity prevention efforts as well as forming healthy
habits in general (Gibbs and Waters 2011).
It is undeniable that today the media is a major actor in the issue of childhood
obesity widely utilized by both the industry and the government. Pediatricians,
researchers, and child development experts have found evidence linking media to
childhood obesity in various ways such as increasing sedentary time, exposing children to
advertisements that influence them to make unhealthy food choices, inducing excessive
snacking behavior while watching television (Kaiser Family Foundation, 2004; Hastings
et al. 2003). Given the influence the media has on its audience, it is clear that the media
can be used to make positive impact on children’s behavior modification. It is, however,
a tool that is operated by monetary power, and in that respect, the food and beverage
industry wields more power than the government does. The food and beverage industry
has been facing pressures from the international communities for its potential role in
promoting healthy diets. Many industry associations have demonstrated their social
192
responsibility by establishing industry standards and codes of conduct vis-à-vis such
issues as marketing to children. These self-regulations, while beneficial, are voluntary
and likely to not be properly complied, monitored, and reported (Hawkes 2005; Jensen et
al. 2015).
The political, social, and cultural environments play an important role in
determining the commitment to and effectiveness of self-regulations (Jensen et al. 2015).
Common nutrition standards on advertising to children were established for and adopted
by member countries of the European Union in 2007 per the European Commission’s
encouragement. In 2008, the International Food and Beverage Alliance (IFBA) adopted
similar guidelines at the global level. In the US, however, there is preference for
individual firm’s self-regulation, as opposed to industry’s self-regulations. In an ideal
world, food and beverage companies would join hands with the media and entertainment
industry in responsibly marketing to children by setting nutrition guidelines for
advertisements, commercial, and promotional materials. As this is unlikely to happen
voluntarily given the liberal history of advertising and the strength of advertising and
promotion agencies in Thailand (Hawkes 2007), the government may step in to regulate
the dissemination and disclosure of information. Children are not considered “rational
consumers.” Government’s interventions are therefore appropriate. Recently, there have
been independent efforts to monitor and report on activities of food and beverage
companies such as the Access to Nutrition Index (ATNI 2015) created by the Access to
Nutrition Foundation. Whether these initiatives will become fruitful remains to be seen
(Jensen et al. 2015).
193
d.) Use convenience stores as point of intervention
As the study findings show that those who frequent convenience stores are
significantly more likely to exhibit undesirable health behavior, this is a good point for
interventions. Convenience stores are extremely popular in Thailand. In addition to being
a place for people to grab a quick meal, snacks, breakfast or other daily essentials, people
can also pay their phone bills and utilities at Seven-Eleven. It is likely that impulse
purchases happen during these transactions. Educational, advertising, warnings, and other
health campaigns can be implemented at convenience stores to reach target audience. The
specifics of campaigns should be further researched.
e.) Avoid obesogenic environment in health-promoting settings
While the goal is to eliminate obesogenic environment completely, I recommend
starting with health promoting settings such as gyms and hospitals in addition to schools.
The government may impose nutritional standards for food items sold at these
establishments. Sale of sugar-sweetened drinks and bakery items should be limited
though not eliminated. Wherever possible, educational materials should be provided to
inform consumers of their potential harm. Gyms and hospitals typically have nutrition
experts in house that are able to offer consultation to interested individuals and provide
basic nutrition knowledge to the general public. With the growing health-conscious
population, healthy vending machines have become the newest trendy business that some
have claimed is “recession-proof.” Some selections of products include cereal bars,
string cheese, yogurt, pudding, trail mix, nuts, fruit cups, and sliced vegetables. Beverage
vending machines usually offer low-fat milk, water, and 100 percent fruit juice. Many

194
healthy vending companies were born in recent years and have experienced rapid growth
rates such as Atlanta-based HUMAN Healthy Vending, San Diego-based Yonaturals, Inc.,
and Healthy You Vending in Kaysville, Utah. Some companies have included eye-
catching technologies and marketing strategies to capture potential customers’ attention
such as a 23” LCD display, some of which have a touch screen that you can use to put in
your order. Competition is fierce and many have sought to diversify their products by
offering hot food vending machines, healthy gourmet coffee vending machines, and
healthy frozen food vending machines (Stephen, 2011).
III: Directions for Future Research
Few research projects on the connection between grocery store choice and health
in developing countries precede this study. A study by Kelly et al. 2014 reported
significant increase in people who regularly visit supermarkets and convenience stores.
Frequent modern grocery shoppers were also found to consume more “problem foods”
high in fat, salt, and energy. More research is needed on the specific case of Asian
populations. Currently nutrition implications on Asians are mostly drawn from Asian
ethnics living in the US or the UK. These people face a different set of factors
influencing their lifestyle and consumption. Research on food environment in developing
countries has come mainly from South America. In order to get an accurate picture to
inform policymakers, research on Asian populations in Asia is essential.
First, research needs to focus on what are the determinants of grocery store
selection. Understanding what drives people to shop at certain grocery outlets will inform

195
policymakers on how best to intervene to ensure people lead a healthy lifestyle while
maintaining economic development. This study initially included a component on
determinants of grocery destination choice but due to incompatibility of data and the
discrete choice statistical model, I was not able to conduct analysis. Literature shows that
modern and traditional grocery outlets have unique features that attract different
clienteles. While supermarkets/hypermarkets and convenience stores are on the rise,
however, the existence of traditional markets are being threatened. Policies should allow
for the control of modern grocery expansion and preservation of traditional markets.
Resources must be made available for stall owners in traditional markets to offer
competitive products at competitive prices and to maintain sanitation. Data and analysis
are needed to establish guide policymakers.
Second, future research should be longitudinal in order to examine the direction
of relationship between grocery shopping, health behavior, and subsequently weight
status. This study is cross-sectional due to the lack of existing longitudinal data and the
funding to conduct and longitudinal study. While associations were found between
grocery destination choice and health behavior, nothing can be said of causation. A
longitudinal study can reveal whether the targeted behaviors develop before or after
subjects start grocery shopping at their preferred stores. If the behaviors follow the store
selection, a closer look at what consumers purchase would guide policy formulation. If
the behaviors are pre-existing, then the question becomes what store characteristics
attract consumers with those behaviors. In addition, the weight status in this study did not

196
show statistical significance. However, if shopper groups practice different health
behaviors, it is likely that there would be discrepancies in their weight status over time.
Conclusion
According to the WHO, approximately 3.4 million people worldwide die annually
as a result of overweight status or obesity (WHO 2014). It is a preventable condition that
will reduce the burden of non-communicable diseases such as diabetes and heart diseases.
There are few other comparable studies linking shopping environments, health behavior,
and weight status in developing countries, and especially in Southeast Asia. As this study
and other existing literature show, however, obesity is not simply a matter of personal
responsibility. It is “the result of people responding normally to the obesogenic
environments they find themselves in,” (Swinburn et al. 2011; 804).
It is vital that policy makers, national and local authorities, understand the health
needs of their populations and utilize appropriate models and evidence to guide their
policy formulations in order to fully benefit from available resources. The issue of
obesity must be viewed within a context of family, community, and society at large.
Interventions must, therefore, be comprehensive and address multiple influencing factors.
Thailand, and other developing Southeast Asian countries, is facing nutrition backlog
where both malnutrition and obesity coexist, many times in a single household.
Prevention and control efforts must involve local communities and multidisciplinary
professionals that the locals trust. There can be unintended effects that must be
considered before policy or program implementations. For example, school-based obesity

197
interventions that target overweight children may create stigma and increase bullying
incidents in schools. If obesity patterns in Thailand follow the path of that in the Western
world, the epidemic will affect people of lower socioeconomic strata more severely than
their wealthy counterparts. As such, obesity is not only a health issue but is also a matter
of social justice where the less fortunate populations do not have equal access to healthy
diets (Marks 2015).
REFERENCES
ACFSb National Bureau of Agricultural Commodity and Food Standards. 2015. “Healthy
Market Handbook.” Accessed July 28.
http://foodsan.anamai.moph.go.th/download/D_market/Standard_M/%E0%B8%84%
E0%B8%B9%E0%B9%88%E0%B8%A1%E0%B8%B7%E0%B8%AD%E0%B8%
95%E0%B8%A5%E0%B8%B2%E0%B8%94%E0%B8%AA%E0%B8%94%E0%
B8%99%E0%B9%88%E0%B8%B2%E0%B8%8B%E0%B8%B7%E0%B9%89%E
0%B8%ADsmall.pdf.
Brotman, Laurie Miller, Spring Dawson-McClure, Keng-Yen Huang, Rachelle Theise,
Dimitra Kamboukos, Jing Wang, Eva Petkova, and Gbenga Ogedegbe. 2012. “Early
Childhood Family Intervention and Long-Term Obesity Prevention Among High-
Risk Minority Youth.” Pediatrics 129 (3): e621–28. doi:10.1542/peds.2011-1568.

198
Gibbs, Lisa, Elizabeth Waters. 2011. “A Settings-Based Theoretical Framework for
Obesity Prevention Community Interventions and Research.” Australian and New
Zealand Journal of Public Health 35 (2): 104–6. doi:10.1111/j.1753-
6405.2010.00688.x.
Groves, Robert M., Floyd J. Jr. Fowler, Mick P. Couper, James M. Lepkowski, Eleanor
Singer, and Roger Tourangeau. 2009. Survey Methodology. Second. New Jersey:
Wiley.
Jensen, Jørgen Dejgård, and Karsten Ronit. 2015. “Obesity, International Food and
Beverage Industries, and Self-Regulation: The Fragmentation of Information
Strategies.” World Medical & Health Policy 7 (3): 278–97. doi:10.1002/wmh3.145.
The Henry J. Kaiser Family Foundation. 2004. The Role of Media in Childhood Obesity.
(http://www.kff.org/entmedia/upload/The-Role-Of-Media-in-Childhood-Obesity.pdf.
Kelishadi, Roya, and Fatemeh Azizi-Soleiman. 2014. “Controlling Childhood Obesity: A
Systematic Review on Strategies and Challenges.” Journal of Research in Medical
Sciences : The Official Journal of Isfahan University of Medical Sciences 19 (10):
993–1008.
Kersh, Rogan. 2009. “The Politics of Obesity: A Current Assessment and Look Ahead.”
Milbank Quarterly 87 (1) (March 1): 295-316. doi:10.1111/j.1468-
0009.2009.00556.x.
Marks, David F. 2015. “Homeostatic Theory of Obesity.” Health Psychology Open 2 (1):
2055102915590692. doi:10.1177/2055102915590692.

199
Ogbuanu, Chinelo, Saundra Glover, Janice Probst, Jihong Liu, and James Hussey. 2011.
“The Effect of Maternity Leave Length and Time of Return to Work on
Breastfeeding.” Pediatrics 127 (6): e1414–27. doi:10.1542/peds.2010-0459.
Sacks, G., J. L. Veerman, M. Moodie, and B. Swinburn. 2011. “‘Traffic-Light’ Nutrition
Labelling and ‘junk-Food’ Tax: A Modelled Comparison of Cost-Effectiveness for
Obesity Prevention.” International Journal of Obesity 35 (7): 1001–9.
doi:10.1038/ijo.2010.228.
Stephen K. “What to Look for in a Healthy Vending Machines Business?”
http://www.healthyvendingmachinesbusiness.com/2011/07/what-vending-business-
is-right-for-you/.
Swinburn, Boyd A., Gary Sacks, Kevin D. Hall, Klim McPherson, Diane T. Finegood,
Marjory L. Moodie, and Steven L. Gortmaker. 2011. “The Global Obesity
Pandemic: Shaped by Global Drivers and Local Environments.” Lancet (London,
England) 378 (9793): 804–14. doi:10.1016/S0140-6736(11)60813-1.
World Health Organization. 2003. “Healthy Cities around the World: An Overview of the
Healthy Cities Movement in the Six WHO Regions.” In . United Kingdom: WHO.
http://www.euro.who.int/__data/assets/pdf_file/0015/101526/healthycityworld.pdf.
World Health Organization. 2014. “WPRO | Obesity.” WPRO.
http://www.wpro.who.int/mediacentre/factsheets/obesity/en/.
Yan, Jing, Lin Liu, Yun Zhu, Guowei Huang, and Peizhong Peter Wang. 2014. “The
Association between Breastfeeding and Childhood Obesity: A Meta-Analysis.” BMC
Public Health 14: 1267. doi:10.1186/1471-2458-14-1267.

200

201
APPENDIX A: GROCERY PURCHASING BEHAVIOR
QUESTIONNAIRE
Are you the primary grocery shopper in your household? (Check yes if you live by
yourself and shop for yourself)
___ Yes ___ No
I: Grocery shopping experience
1. What is your primary grocery shopping store/market? Please give the name and
location (ie. Lotus, Rama 4 Rd. or Klongtoey Market)
____________________________
2. How much time do you usually spend on grocery shopping per week excluding the
transportation time?
________ hours _______ minutes
3. How long does it usually take for you to get to the grocery store/market?
________ minutes
4. What mode of transportation do you usually use to get to the grocery store/market?
____ walk
____ bus
____ other, please specify
_______________
____ taxi
____ private vehicle
5. Do you usually read the nutrition label when available?
___ yes ___ no

202
On a scale of 1-5, 5 being “very important” and 1 being “not at all important,” How
important is each of the following grocery store characteristics when you shop?
Level of Importance
Highest Lowest
6. Pricing 5 4 3 2 1
7. Convenience of location 5 4 3 2 1
8. Facilities including parking lots and air conditioner 5 4 3 2 1
9. Store promotions 5 4 3 2 1
10. Store cleanliness and organization 5 4 3 2 1
11. Store product quality 5 4 3 2 1
12. The assortment of different brands and products 5 4 3 2 1
13. Store service; helpfulness, availability, and friendliness
of staff
5 4 3 2 1
14. Availability of product in large-size packaging 5 4 3 2 1
15. Opportunity to connect with the local community 5 4 3 2 1

203
How often do you shop for food items at the following grocery outlets?
Less
than
once a
month
Once a
month
1-2
times a
week
3-4
times a
week
More
than 4
times a
week
16. Hypermarket/Supermarkets
(ie. Lotus, Big C, Tops,
Gourmet)
17. Warehouse stores (Makro)
18. Convenience stores (7-
eleven, Family Mart)
19. Traditional wet markets
20. Mom-and-pop shops
How much do you spend on average per shopping trip at each of the following
places?
21. Hypermarket/Supermarkets (ie. Lotus, Big C, Tops, Gourmet)
____________ baht
22. Warehouse stores (Makro)
____________ baht
23. Convenience stores (7-eleven, Family Mart)
____________ baht
24. Traditional wet markets
____________ baht
25. Mom-and-pop shops
____________ baht

204
Where do you usually buy the following products? Check all that applies.
Hypermar
kets/super
markets
Warehouse
stores
Convenien
ce stores
Local
wet
market
Mom-and-
pop stores
Other,
specify
Do not
buy
26. Fresh fruits
27. Fresh vegetables
28. Meat products
29. Grain products
(ie rice)
30. Dairy products
31. Processed and
dried foods (ie.
instant noodle,
sausages)
32. Non-frozen ready
meals
33. Frozen meals ie.
S&P Quick
Meals
34. Frozen fruits and
vegetables
35. Pastries and
bread

205
II: Health Behaviors
How many days in the past 7 days did you do the following?
Number of days in the past 7
days
36. Have breakfast at home 0 1 2 3 4 5 6 7
37. Have breakfast elsewhere (not at home) 0 1 2 3 4 5 6 7
38. Have dinner that is prepared at home 0 1 2 3 4 5 6 7
39. Eat at restaurants for dinner (excluding cafeterias and
food courts)
0 1 2 3 4 5 6 7
40. Eat at fast food or pizza restaurants (KFC,
McDonalds, Pizza Hut)
0 1 2 3 4 5 6 7
41. Have food or fruits purchased from street stalls 0 1 2 3 4 5 6 7
42. Have fruits or Thai snacks between meals 0 1 2 3 4 5 6 7
43. Have Western snacks between meals (ie. potato chips,
pastries)
0 1 2 3 4 5 6 7
44. Drink soda or other sugary drinks (juice, energy
drinks, sweet tea)
0 1 2 3 4 5 6 7
45. Smoke cigarettes 0 1 2 3 4 5 6 7
46. Drink alcoholic beverages (liquor, beer, cocktails) 0 1 2 3 4 5 6 7
47. Be physically active for more than 60 minutes per day
(add up all the time that increase heart rate and make
you breathe hard some of the time)
0 1 2 3 4 5 6 7
48. Spend more than 8 hours sitting (at work, at home, in
a car, on a bus)
0 1 2 3 4 5 6 7

206
Do you agree or disagree with the following statements
Neither
Strongly agree nor Strongly
disagree Disagree disagree Agree Agree 49. I believe obesity is caused by factors
that are beyond my control such as
genetics
1 2 3 4 5
50. I believe obesity is caused by factors
that I have control over such as
overeating and lack of exercise
1 2 3 4 5
51. I believe I get enough exercise 1 2 3 4 5
52. I believe I eat nutritious diets 1 2 3 4 5
53. I believe I am at a healthy weight 1 2 3 4 5

207
III: Background Information
Individual
54. Name
_________please skip_________________
55. What is your district and zip code? (ie. Klongtoey 10110)
district_____________ zip code_____________
56. What is your gender?
____Male ___Female
57. What was your age at your last birthday?
____ years old
58. What is your marital status?
___ married ___ single
59. What is the highest level of education you attained?
___ Primary school
___ Junior high school
___ High school
___ Associate Degree/vocational
training
___ Bachelor’s degree
___ Master’s degree and beyond

208
Family
60. Approximately what is your family’s monthly income?
___ 10,000 baht or less
___ 10,000 – 30,000 baht
___ 30,001 – 50,000 baht
___ 50,000 – 100,000 baht
___ 100,000 baht or more
61. Which of the following describes your current residence?
_____ house _____ condominium _____ dorm/apartment _____ other, specify
____________
62. How many persons live in your household, including yourself?
___ persons
63. How many of them are children and their age?
___ children, ages ____________
64. How many people in your household work full-time?
___ persons
65. Does your family own a car?
___ yes ___ no

209
APPENDIX B: GROCERY STORE EVALUATION FORM
Name of store: ________________________ Address:
________________________________
What type of store is this? (choose one)
____ hypermarket ____ supermarket ____ convenience store
FOOD CATEGORY SCORE PRICE
Nonefat/low-fat Dairy (max 2 pts)
0 – none
+1 – if low-fat/non-fat milk is 50% or
more of shelf space
+1 – presence of low-fat/non-fat
yogurt
Lowest price per gallon of nonfat milk
Fruits and vegetables (max 4 pts)
0 – none
+2 – 10 or more fresh varieties
+1 – presence of locally-grown food
+1 – 10 or more varieties of frozen
varieties (not canned)
Lowest price per pound of fresh bananas
Lowest price per pound of fresh carrots
Lean Meat (max 3 pts)
0 – none
+1 – ground pork or ground chicken,
15% fat or less
+1 – skinless breast present
+1 – fresh ปลาท ปลากะพง ปลาทบทม
available
Lowest price per pound of lean ground
beef
Lowest price per pound of skinless
chicken breast
Lowest price per pound of filet of

210
salmon
Frozen foods (max 2 pts)
0 – none
+1 – low-calorie complete meals
available such as Lean Cuisine
พรานทะเล
+1 – ratio of vegetables to ice cream
shelf space great than 1:4
Lowest price per ounce of frozen peas
Lowest price per individual serving of
low-calorie complete meal (not multi-
serving)
Low-sodium soup กวยเตยวน ำ 0 – no low-sodium soup
+1 – low-sodium soup
Lowest cost per ounce of low-sodium
chicken noodle soup
ขำวกลอง (max 2 pts)
0 – no ขาวกลอง available
+2 – two or more varieties available
Lowest cost per ounce of whole-grain
bread. One once = 1 slice of bread
คกกธญพช ขนมปงธญพช (max 2 pts)
0 – none
+ 2 – two or more varieties with less
than 7g sugar/serving available
Lowest cost per ounce of low-sugar
cereal

211
APPENDIX C: BODY COMPOSITION ANALYSIS SAMPLE

212
APPENDIX D: STATA COMMANDS
Research Question II
Chi-squares test (Tables 6.3, 6.4, 6.5, 6.8)
The general Stata command used was
tab DepVar shopcat, chi2 column
where
DepVar represents the categorical variables
Male, Age, Educ, HHinc, Resid, FamMem, Child, and OwnCar
The option chi2 generates chi-squares values and the option column generates
column percentage
Table 6.3
tab Male shopcat, chi2 column
tab Age shopcat, chi2 column
tab Educ shopcat, chi2 column
Table 6.4
tab HHinc shopcat, chi2 column
tab Resid shopcat, chi2 column
Table 6.5
tab FamMem shopcat, chi2 column
tab Child shopcat, chi2 column
tab OwnCar shopcat, chi2 column
Table 6.8

213
The general Stata command used was
tab DepVar shopcat, chi2
where DepVar represents the categorical variables
Price, Location, Amenities, Promotion, CleanOrg, ProdQual, ProdVar, Service,
FamSizePac, and ComRel
tab Price shopcat, chi2
tab Location shopcat, chi2
tab Amenities shopcat, chi2
tab Promotion shopcat, chi2
tab CleanOrg shopcat, chi2
tab ProdQual shopcat, chi2
tab ProdVar shopcat, chi2
tab Service shopcat, chi2
tab FamSizePac shopcat, chi2
tab ComRel shopcat, chi2
ANOVA tests (Table 6.6)
The general Stata command used was
oneway DepVar shopcat, tabulate sidak bonferroni scheffe
where DepVar represents the continuous variables
SpendSuper, SpendMkt, SpendConvStr, MinShop, and MinTravel in four separate
tests
The option tabulate generates a table with means and standard deviations
The options sidak, Bonferroni, and scheffe generate Sidak, Bonferroni and
Scheffe post-hoc test statistics respectively
oneway SpendSuper shopcat, tabulate sidak bonferroni scheffe

214
oneway SpendMkt shopcat, tabulate sidak bonferroni scheffe
oneway SpendConvStr shopcat, tabulate sidak bonferroni scheffe
oneway MinShop shopcat, tabulate sidak bonferroni scheffe
oneway MinTravel shopcat, tabulate sidak bonferroni scheffe
t-tests (Table 6.7)
The general Stata command used was
ttest DepVar, by (OwnCar)
where DepVar represents the continuous variables
SuperFreq, MktFreq, ConvStrFreq, SpendSuper, SpendMkt, and SpendConvStr
ttest SuperFreq, by (OwnCar)
ttest MktFreq, by (OwnCar)
ttest ConvStrFreq, by (OwnCar)
ttest SpendSuper, by (OwnCar)
ttest SpendMkt, by (OwnCar)
ttest SpendConvStr, by (OwnCar)
Research Question III
Negative Binomial (Table 6.9)
The first set of regressions used the general Stata command
nbreg DepVar Shopcat Age Male Educ
The second set of regressions had frequent shoppers as independent variables of interest
and used the general Stata command
nbreg DepVar FreqMktShppr FreqSuperShppr FreqConvStrShppr Age Male Educ
Where DepVar represents ordinal variables (0-7 days)

215
BrkfstOut, DinnerOut, Fastfood, WstnSnacks, SwtDrinks, Alcohol, Exercise60Min, and
Sit8Hrs
Shopper Group
nbreg BrkfstOut Shopcat Age Male Educ
nbreg DinnerOut Shopcat Age Male Educ
nbreg Fastfood Shopcat Age Male Educ
nbreg WstnSnacks Shopcat Age Male Educ
nbreg SwtDrinks Shopcat Age Male Educ
nbreg Alcohol Shopcat Age Male Educ
nbreg Exercise60Min Shopcat Age Male Educ
nbreg Sit8Hrs Shopcat Age Male Educ
Frequent Shopper
nbreg BrkfstOut FreqMktShppr FreqSuperShppr FreqConvStrShppr Age Male
Educ
nbreg DinnerOut FreqMktShppr FreqSuperShppr FreqConvStrShppr Age Male
Educ
nbreg Fastfood FreqMktShppr FreqSuperShppr FreqConvStrShppr Age Male
Educ
nbreg WstnSnacks FreqMktShppr FreqSuperShppr FreqConvStrShppr Age Male
Educ
nbreg SwtDrinks FreqMktShppr FreqSuperShppr FreqConvStrShppr Age Male
Educ
nbreg Alcohol FreqMktShppr FreqSuperShppr FreqConvStrShppr Age Male Educ
nbreg Exercise60Min FreqMktShppr FreqSuperShppr FreqConvStrShppr Age
Male Educ
nbreg Sit8Hrs FreqMktShppr FreqSuperShppr FreqConvStrShppr Age Male Educ

216
Test 1 Histogram (Table 6.10)
Hist BrkfstOut
Hist DinnerOut
Hist Fastfood
Hist WstnSnacks
Hist SwtDrinks
Hist Alcohol
Hist Exercise60Min
Hist Sit8Hrs
Test 2 mean equal variance (Table 6.11)
summarize variable, detail
Test 3: Poisson Goodness of Fit (GOF) test
poisson depvar agegroup male Educ
estat gof
Test 4: The Likelihood Ratio Test of Alpha
nbreg DepVar Shopcat Age Male Educ
Research Question IV
BMI and shopping destination (Table 6.14)
The first model contains only the independent variables of interest Shopcat
(Modern_Shoppers, Traditional_Shoppers, and Mixed_Shoppers) and uses the following
Stata command

217
Regress bmi i.Shopcat
The second model contains the control variables Age, Male, and Educ, using the
following Stata command
Regress bmi i.Shopcat Age Male Educ
The third model contains the control variables Age, Male, Educ, HHMem, Child, OwnCar,
and FTWrkrs using the following Stata command
Regress bmi i.Shopcat Age Male Educ HHMem Child OwnCar FTWrkrs
The fourth model contains the control variables Age, Male, BrkfstOut, DinnerOut,
Fastfood, WstnSnacks, SwtDrinks, Alcohol, Exercise60Min, and Sit8Hrs using the
following Stata command
Regress bmi i.Shopcat Age Male BrkfstOut, DinnerOut, Fastfood, WstnSnacks,
SwtDrinks, Alcohol, Exercise60Min, and Sit8Hrs
PBF and shopping destination (Table 6.15)
The first model contains only the independent variables of interest Shopcat
(Modern_Shoppers, Traditional_Shoppers, and Mixed_Shoppers) and uses the following
Stata command
regress pbf i.Shopcat, robust
The second model contains the control variables Age, Male, and Educ, using the
following Stata command
regress pbf i.Shopcat Age Male Educ, robust
The third model contains the control variables Age, Male, Educ, HHMem, Child, OwnCar,
and FTWrkrs using the following Stata command
regress pbf i.Shopcat Age Male Educ HHMem Child OwnCar FTWrkrs, robust
The fourth model contains the control variables Age, Male, BrkfstOut, DinnerOut,
Fastfood, WstnSnacks, SwtDrinks, Alcohol, Exercise60Min, and Sit8Hrs using the
following Stata command
regress pbf i.Shopcat Age Male BrkfstOut, DinnerOut, Fastfood, WstnSnacks,
SwtDrinks, Alcohol, Exercise60Min, and Sit8Hrs, robust

218
Waist circumference and shopping destination (Table 6.16)
The first model contains only the independent variables of interest Shopcat
(Modern_Shoppers, Traditional_Shoppers, and Mixed_Shoppers) and uses the following
Stata command
regress WC i.Shopcat, robust
The second model contains the control variables Age, Male, and Educ, using the
following Stata command
regress WC i.Shopcat Age Male Educ, robust
The third model contains the control variables Age, Male, Educ, HHMem, Child, OwnCar,
and FTWrkrs using the following Stata command
regress WC i.Shopcat Age Male Educ HHMem Child OwnCar FTWrkrs, robust
The fourth model contains the control variables Age, Male, BrkfstOut, DinnerOut,
Fastfood, WstnSnacks, SwtDrinks, Alcohol, Exercise60Min, and Sit8Hrs using the
following Stata command
regress WC i.Shopcat Age Male BrkfstOut, DinnerOut, Fastfood, WstnSnacks,
SwtDrinks, Alcohol, Exercise60Min, and Sit8Hrs, robust
BMI and Shopping Frequency (Table 6.17)
The first model contains only the independent variables of interest Freq_Super,
Freq_ConvStr, and Freq_TradMkt. Note that these categories are NOT mutually
exclusive. The following Stata command was executed
regress bmi Freq_Super Freq_ConvStr Freq_TradMkt, robust
The second model contains the control variables Age, Male, and Educ, using the
following Stata command
regress bmi Freq_Super Freq_ConvStr Freq_TradMkt Age Male Educ, robust
The third model contains the control variables Age, Male, Educ, HHMem, Child, OwnCar,
and FTWrkrs using the following Stata command

219
regress bmi Freq_Super Freq_ConvStr Freq_TradMkt Age Male Educ HHMem Child
OwnCar FTWrkrs, robust
The fourth model contains the control variables Age, Male, BrkfstOut, DinnerOut,
Fastfood, WstnSnacks, SwtDrinks, Alcohol, Exercise60Min, and Sit8Hrs using the
following Stata command
regress bmi Freq_Super Freq_ConvStr Freq_TradMkt Age Male BrkfstOut, DinnerOut,
Fastfood, WstnSnacks, SwtDrinks, Alcohol, Exercise60Min, and Sit8Hrs, robust
PBF and Shopping Frequency (Table 6.18)
The first model contains only the independent variables of interest Freq_Super,
Freq_ConvStr, and Freq_TradMkt. Note that these categories are NOT mutually
exclusive. The following Stata command was executed
Regress PBF Freq_Super Freq_ConvStr Freq_TradMkt
The second model contains the control variables Age, Male, and Educ, using the
following Stata command
Regress PBF Freq_Super Freq_ConvStr Freq_TradMkt Age Male Educ
The third model contains the control variables Age, Male, Educ, HHMem, Child, OwnCar,
and FTWrkrs using the following Stata command
Regress PBF Freq_Super Freq_ConvStr Freq_TradMkt Age Male Educ HHMem Child
OwnCar FTWrkrs
The fourth model contains the control variables Age, Male, BrkfstOut, DinnerOut,
Fastfood, WstnSnacks, SwtDrinks, Alcohol, Exercise60Min, and Sit8Hrs using the
following Stata command
Regress PBF Freq_Super Freq_ConvStr Freq_TradMkt Age Male BrkfstOut, DinnerOut,
Fastfood, WstnSnacks, SwtDrinks, Alcohol, Exercise60Min, and Sit8Hrs
Waist Circumference and Shopping Frequency (Table 6.19)
The first model contains only the independent variables of interest Freq_Super,
Freq_ConvStr, and Freq_TradMkt. Note that these categories are NOT mutually
exclusive. The following Stata command was executed
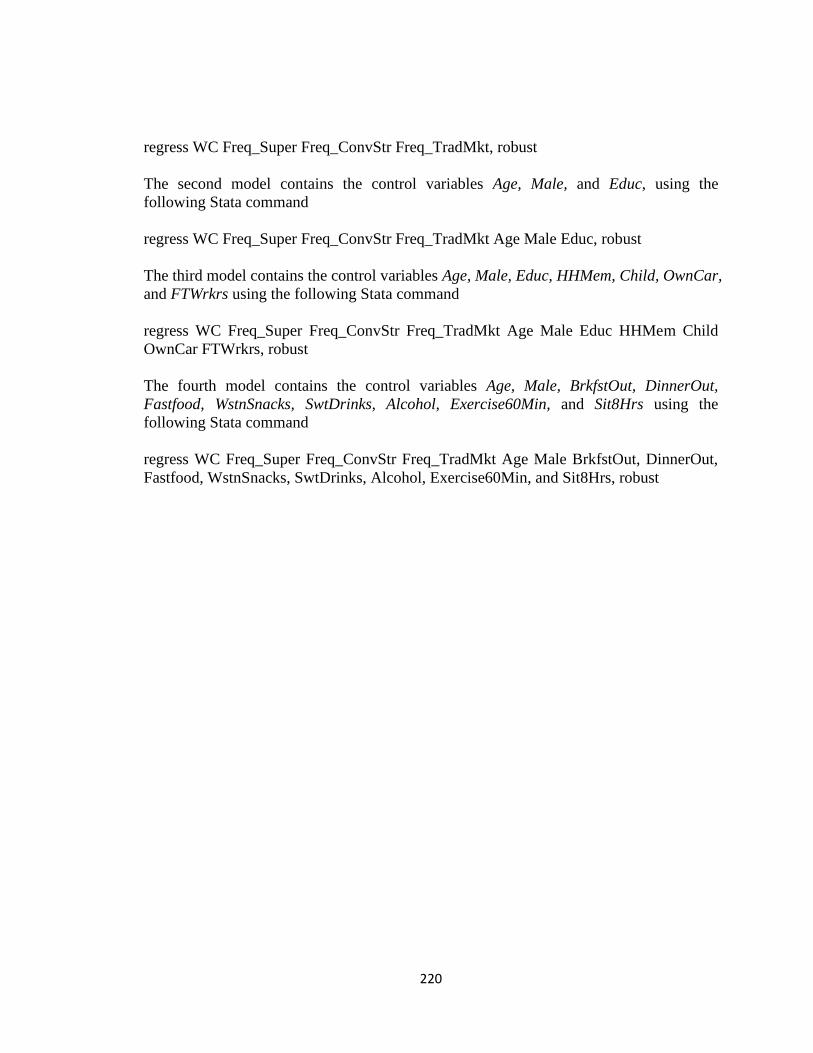
220
regress WC Freq_Super Freq_ConvStr Freq_TradMkt, robust
The second model contains the control variables Age, Male, and Educ, using the
following Stata command
regress WC Freq_Super Freq_ConvStr Freq_TradMkt Age Male Educ, robust
The third model contains the control variables Age, Male, Educ, HHMem, Child, OwnCar,
and FTWrkrs using the following Stata command
regress WC Freq_Super Freq_ConvStr Freq_TradMkt Age Male Educ HHMem Child
OwnCar FTWrkrs, robust
The fourth model contains the control variables Age, Male, BrkfstOut, DinnerOut,
Fastfood, WstnSnacks, SwtDrinks, Alcohol, Exercise60Min, and Sit8Hrs using the
following Stata command
regress WC Freq_Super Freq_ConvStr Freq_TradMkt Age Male BrkfstOut, DinnerOut,
Fastfood, WstnSnacks, SwtDrinks, Alcohol, Exercise60Min, and Sit8Hrs, robust

221
BIOGRAPHY
Tinapa Himathongkam grew up in Bangkok, Thailand. She attended Wesleyan University
in Middletown, Connecticut, where she received her Bachelor of Arts in East Asian
Studies with a concentration in Political Economy in 2005. She spent two years teaching
English in Japan before spending one year working in the healthcare industry in Thailand.
She went on to receive her Master of Public Policy in 2011 from Georgetown University
in Washington, DC. She then received her Doctor of Philosophy in Public Policy from
George Mason University in 2016.