Embed Size (px)
Citation preview
First flight of the Gamma-Ray Imager/Polarimeter for Solarflares (GRIPS) instrument
Nicole Duncana,b, P. Saint-Hilaireb, A. Y. Shihc, G. J. Hurfordb, H. M. Bainb, M. Ammand, B.A. Mochizukib, J. Hobermanb, J. Olsonb, B. A. Marucae,b, N. M. Godboleb, D. M. Smithf, J.Sampleg, N. A. Kelleyb, A. Zoglauerb, A. Caspih, P. Kaufmanni, S. Boggsb, and R. P. Linb
aUC Berkeley, 366 Leconte Hall, Berkeley, CA, 94720, USAbSpace Sciences Laboratory, UC Berkeley, 7 Gauss Way, Berkeley, CA, 94720, USAcHeliophysics Science Division, NASA Goddard SFC, Greenbelt, MD, 20771, USA
dLawrence Berkeley National Laboratory, 1 Cyclotron Road, Berkeley, CA, 94720, USAeDept of Physics and Astronomy, Univ. of Delaware, 4 Kent Way, Newark, DE, 19716, USA
gDept of Physics, UC Santa Cruz, 1156 High Street, Santa Cruz, CA, 95064, USAgDept of Physics, EPS building, Montana State University, Bozeman, MT, 59717, USA
hSouthwest Research Institute, 1050 Walnut Street, Suite 300, Boulder, CO, 80302, USAiUniversidade Presbiteriana Mackenzie, Sao Paulo, SP, Brazil
ABSTRACT
The Gamma-Ray Imager/Polarimeter for Solar flares (GRIPS) instrument is a balloon-borne telescope designedto study solar-flare particle acceleration and transport. We describe GRIPS’s first Antarctic long-duration flightin January 2016 and report preliminary calibration and science results.
Electron and ion dynamics, particle abundances and the ambient plasma conditions in solar flares can beunderstood by examining hard X-ray (HXR) and gamma-ray emission (20 keV to 10 MeV). Enhanced imaging,spectroscopy and polarimetry of flare emissions in this energy range are needed to study particle accelerationand transport questions. The GRIPS instrument is specifically designed to answer questions including: Whatcauses the spatial separation between energetic electrons producing hard X-rays and energetic ions producinggamma-ray lines? How anisotropic are the relativistic electrons, and why can they dominate in the corona? Howdo the compositions of accelerated and ambient material vary with space and time, and why?
GRIPS’s key technological improvements over the current solar state of the art at HXR/gamma-ray energies,the Reuven Ramaty High Energy Solar Spectroscopic Imager (RHESSI), include 3D position-sensitive germaniumdetectors (3D-GeDs) and a single-grid modulation collimator, the multi-pitch rotating modulator (MPRM). The3D-GeDs have spectral FWHM resolution of a few hundred keV and spatial resolution <1 mm3. For photonsthat Compton scatter, usually &150 keV, the energy deposition sites can be tracked, providing polarizationmeasurements as well as enhanced background reduction through Compton imaging. Each of GRIPS’s detectorshas 298 electrode strips read out with ASIC/FPGA electronics. In GRIPS’s energy range, indirect imagingmethods provide higher resolution than focusing optics or Compton imaging techniques. The MPRM grid-imaging system has a single-grid design which provides twice the throughput of a bi-grid imaging system likeRHESSI. The grid is composed of 2.5 cm deep tungsten-copper slats, and quasi-continuous FWHM angularcoverage from 12.5-162 arcsecs are achieved by varying the slit pitch between 1-13 mm. This angular resolutionis capable of imaging the separate magnetic loop footpoint emissions in a variety of flare sizes. In comparison,RHESSI’s 35-arcsec resolution at similar energies makes the footpoints resolvable in only the largest flares.
Keywords: GRIPS, solar flare, Sun, gamma-ray, HXR, hard x-ray, balloon, LDB
Further author information: (Send correspondence to Nicole Duncan)Nicole Duncan: E-mail: [email protected], Telephone: 1 510 642 1707Pascal Saint-Hilaire: E-mail: [email protected]

1. INTRODUCTION
The Gamma-Ray Imager/Polarimeter for Solar Flares (GRIPS) instrument is a balloon-borne solar observatorywhich flew on its first mission during the 2015/16 Antarctic summer season. GRIPS provides imaging (12.5–162 arcseconds), spectroscopy (∼30kev to &10MeV) and polarimetry of high energy emission during solar flares.Observations from the GRIPS instrument address questions concerning the acceleration and transport of particlesduring solar flares. GRIPS is a NASA Heliophysics Low Cost Access to Space mission led by Pascal Saint-Hilaireat UC Berkeley’s Space Science Laboratory (SSL). Most of the telescope and its support systems were designed,built and tested at SSL with contributions from Lawrence Berkeley National Laboratory (LBNL), NASA GoddardSpace Flight Center, and UC Santa Cruz.
The GRIPS payload (Figure 1) flew on a long-duration balloon over Antarctica on January 19–30, 2016.During GRIPS’ ∼12-day flight, 21 C-class flares occurred. Because of where the payload landed and the latenessof the season, recovery resources were limited. All flight data for the primary instrument and its three piggybackinstruments were recovered, but the instrument itself will remain in the Antarctic deep field during the 2016winter and will be recovered in the following (2016/17) summer season. All systems performed in flight asdesigned. This paper reports on the details of GRIPS’ first flight and provides updates on critical systemchanges and milestones since the previous GRIPS papers.1,2
Figure 1: The fully integrated GRIPS instrument payload. The gondola is suspended from ”The Boss” launchvehicle while the GRIPS and Columbia Scientific Ballooning Facility (CSBF) teams complete pre-flight checklistsduring a launch attempt.
1.1 Science Goals
Solar flares can release 1032–1033 ergs within 10s–1000s of seconds, imparting up to tens of percent of the energyinto particles.3 During these events, electrons can be accelerated to 100s of MeV and ions to 10s of GeV. Large-scale field reconfigurations resulting from magnetic reconnection in the corona are thought to power flares, but theprecise mechanisms that convert the stored magnetic energy into particle kinetic energy are poorly understood.
Accelerated particles either escape into interplanetary space or rain down into the solar atmosphere wherethey lose energy as they interact with the increasing particle densities. The particles emit photons in a variety ofprocesses4,5 which give clues to the underlying acceleration and transport mechanisms. High resolution imagingand spectroscopy of the hard X-ray/gamma-ray energy range during flares is required to build a complete pictureof these processes. The Reuven Ramaty High Energy Solar Spectroscopic Imager (RHESSI),6 launched in 2002,first opened the door to imaging and detailed spectroscopy in this energy range.
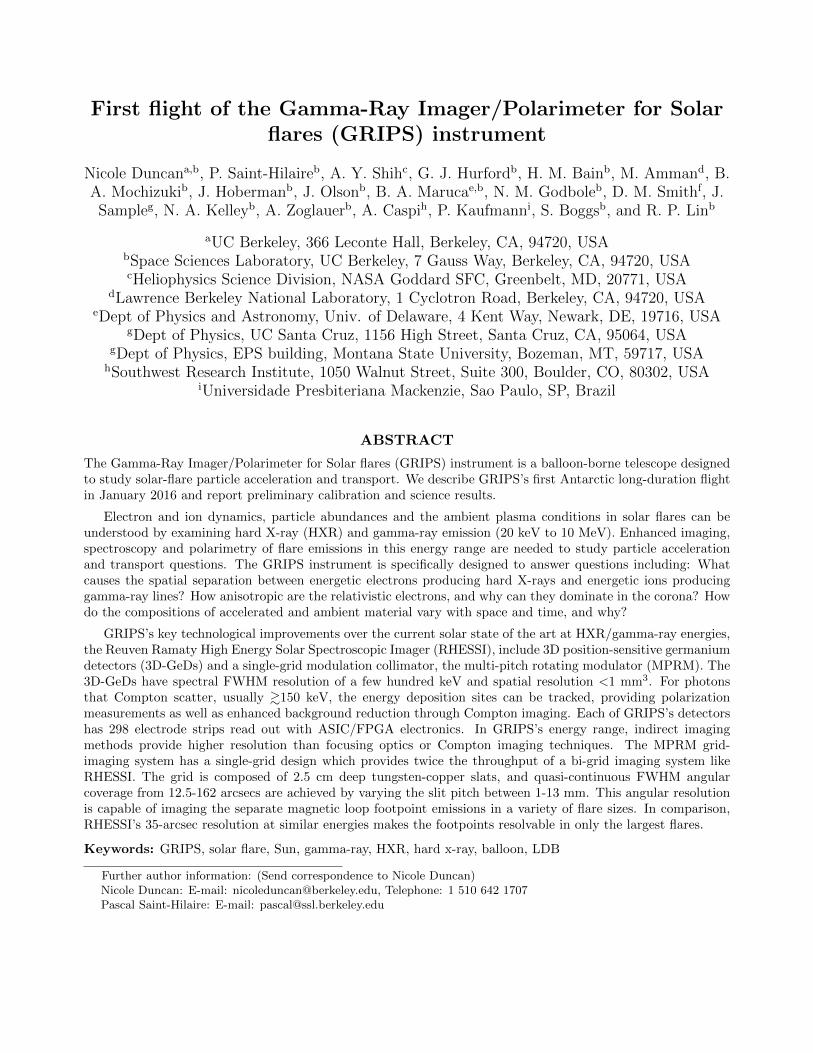
RHESSI observations linked the high-energy photon emission to observed spatial structures like magneticfields, verifying the overall geometry of the standard flare model. In the RHESSI and SMM datasets ion andrelativistic electron fluences were seen to be correlated, showing that flares accelerate ions and relativistic elec-trons proportionally7 and suggesting that these populations are accelerated together, and possibly by similarmechanisms. However, imaging of two of the largest flares of the last solar cycle show that the centroids of ionand relativistic electron emission were significantly displaced from one another.8,9 This result is surprising; ions
and electrons that are accelerated in the same region are thought to be transported out of the acceleration areaalong the same field lines, implying that they would enter the chromosphere together and have similar emissionsource locations. Figure 2 shows the correlated emission as well as the observed spatial displacement. Unfortu-nately RHESSI’s reduced imaging capabilities at gamma-ray energies limits these observations to the few largestand best observed flares of the past solar cycle.
RHESSI and other solar observatories have revealed a new set of flare particle questions, which GRIPS wasdesigned to address:
• What caused the observed spatial separation between the sites of relativistic electron and ion energydeposition in flare footpoints? Does this separation occur in all flares?
• Do all flares accelerate ions?
• Are relativistic electrons isotropic or beamed in the corona?
• What is the composition/variance of accelerated material in space and time?
electrons ions
Oct 28, 2003 14” & 17” separa4on
>~ 10,000 km
GRIPS
RHESSI Hurford et al, 2006
Shih et al, 2009
Figure 2: Left: The correlation between the relativistic electron bremsstrahlung and the 2.2 MeV line fluenceindicates that the same process may be accelerating protons and electrons. The correlation extends over 3 ordersof magnitude and two different missions.Right: RHESSI gamma-ray image in two different energy bands of the GOES class X17 flare on October 28,2003, overlaid on a TRACE 195 A image. The electron-associated bremsstrahlung emission is shown in redcontours, and the imaged 2.2 MeV line is shown in blue contours. The electron- and ion-associated centroidsare separated from one another by ∼17” in each footpoint. Inset is a comparison of the GRIPS and RHESSIminimum beam widths. At gamma-ray energies RHESSI can only separate footpoints in the largest flares. TheGRIPS resolution is fine enough to separate footpoints in a variety of flare sizes.
2. INSTRUMENT OUTLINE AND OVERVIEW
The GRIPS instrument consists of a germanium spectrometer/polarimeter and a single-grid imager, separatedby an eight-meter boom. GRIPS’s key technological advances over the current HXR/gamma-ray solar state ofthe art (RHESSI) are 3D position-sensitive germanium detectors (3D-GeDs), and a coded-aperture-style imagingsystem, the multi-pitch rotating modulator (MPRM). A detailed description of these components, the GRIPSscience instrument overall and its support systems can be found in earlier manuscripts.1,2 Figure 3 shows aschematic of the complete payload and its systems. In this section we give a general review of key systems,highlight instrumental milestones and discuss changes since we last reported on GRIPS.2

Figure 3: Schematic of the fully integrated GRIPS payload. The GRIPS and CSBF components are shown in redand the three piggyback instruments (see Section 11) are shown in blue. The flight computer, aspect computer,power distribution unit and the majority of the signal processing electronics are housed in the electronics bay.The electronics bay and telescope boom are both covered in opaque foam, but illustrated here as transparent tohighlight interior components. Antennas were provided by CSBF.
The GRIPS spectrometer is able to resolve the site of individual photon interactions within a crystal in threedimensions. When photons Compton scatter in the crystal, which is the dominant process above ∼150 keV,GRIPS can resolve each energy deposition site and reconstruct the complete scatter path. Determining thescattering track enables polarization measurements and coarse Compton imaging (∼1◦ resolution) that can beused to image extended sources or eliminate background.
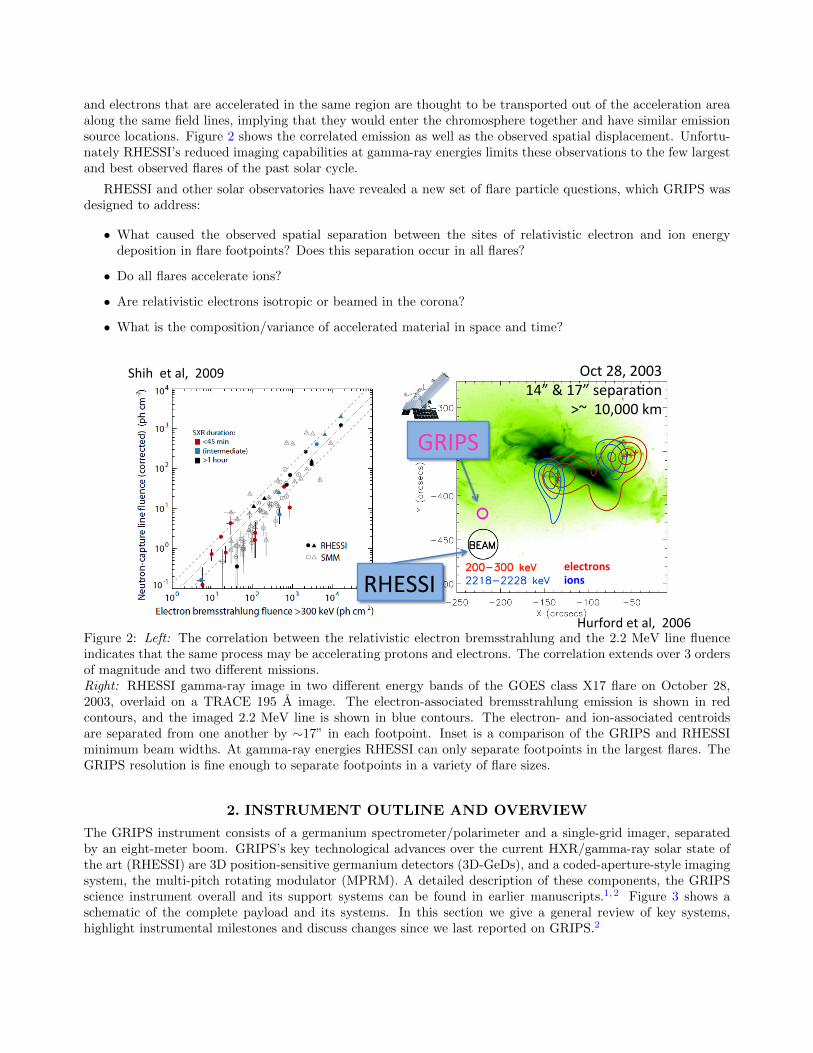
Detector position sensitivity is the enabling technology for GRIPS’s single-grid imaging system. The site ofthe first energy deposition for a given photon can be backprojected through the single grid to determine thepossible origination regions on the Sun. This arrangement yields ∼2x greater photon throughput than relatedbi-grid designs, such as RHESSI, which had detectors with no position sensitivity. GRIPS’s imaging grid has13 slit pitches (see Figure 4), which rotate through 360◦ orientation at ∼10 rpm, providing quasi-continuousimaging resolution between 12.5–162 arcseconds. At gamma-ray energies, RHESSI’s grids 6 & 9 provide only 2slit pitches, with a minimum angular resolution of ∼35 arcseconds. Quasi-continuous coverage in the UV planeimparts GRIPS with a nearly ideal point response function that is virtually free of side-lobes (Figure 4).
A single grid eases the tight engineering and manufacturing constraints of dual-grid designs, such as alignmentand precision tolerances. This allows the 8-m boom to be free to twist and flex during flight. Though the gridposition is not controlled, its location relative to the detectors is closely monitored by the GRIPS aspect system(see Section 8). The aspect system provides high-precision monitoring of telescope pitch, yaw and roll. Thisenables arcsecond-precision aspect knowledge with a boom pointed to only 0.5◦ rms by the pointing control
system (see Section 7).
GRIPS RHESSI 6&9
Figure 4: Left: The point response function of GRIPS’s 13 spatial frequencies in comparison to RHESSI’s twofrequencies at gamma-ray energies. Note that GRIPS’s response is virtually free of sidelobes.Right: The MPRM imaging grid contains a large number of parallel slats, each of which is made of a 70/30tungsten/copper alloy that is 2.54 cm thick along the line-of-sight to the Sun. The slit pitch varies between1–13 mm, quasi-continuously sampling between 12.5–162 arcsec resolution. Mounted along the grid diameter arethree optical lenses that project images of the Sun as part of the aspect system (see Section 8).
2.1 Flight Cryostat
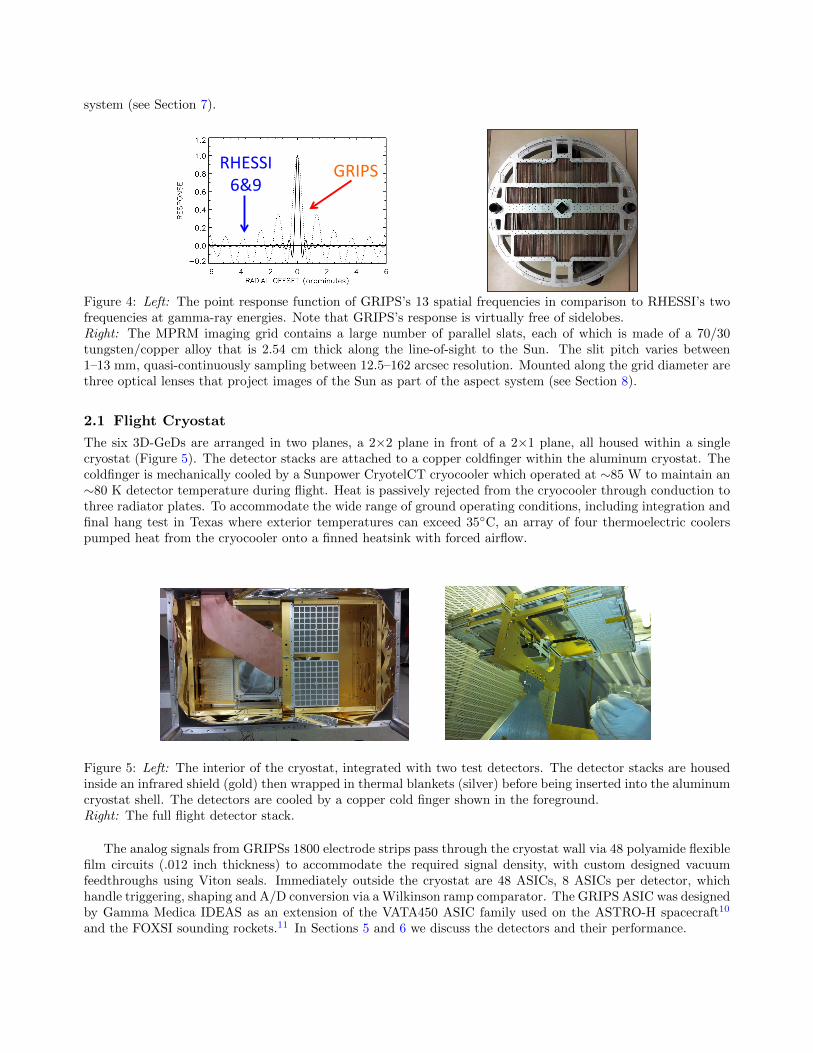
The six 3D-GeDs are arranged in two planes, a 2×2 plane in front of a 2×1 plane, all housed within a singlecryostat (Figure 5). The detector stacks are attached to a copper coldfinger within the aluminum cryostat. Thecoldfinger is mechanically cooled by a Sunpower CryotelCT cryocooler which operated at ∼85 W to maintain an∼80 K detector temperature during flight. Heat is passively rejected from the cryocooler through conduction tothree radiator plates. To accommodate the wide range of ground operating conditions, including integration andfinal hang test in Texas where exterior temperatures can exceed 35◦C, an array of four thermoelectric coolerspumped heat from the cryocooler onto a finned heatsink with forced airflow.
Figure 5: Left: The interior of the cryostat, integrated with two test detectors. The detector stacks are housedinside an infrared shield (gold) then wrapped in thermal blankets (silver) before being inserted into the aluminumcryostat shell. The detectors are cooled by a copper cold finger shown in the foreground.Right: The full flight detector stack.
The analog signals from GRIPSs 1800 electrode strips pass through the cryostat wall via 48 polyamide flexiblefilm circuits (.012 inch thickness) to accommodate the required signal density, with custom designed vacuumfeedthroughs using Viton seals. Immediately outside the cryostat are 48 ASICs, 8 ASICs per detector, whichhandle triggering, shaping and A/D conversion via a Wilkinson ramp comparator. The GRIPS ASIC was designedby Gamma Medica IDEAS as an extension of the VATA450 ASIC family used on the ASTRO-H spacecraft10
and the FOXSI sounding rockets.11 In Sections 5 and 6 we discuss the detectors and their performance.

The cryostat is surrounded by a 5-cm thick bismuth germanate (BGO) scintillator active anti-coincidenceshield consisting of a hexagonal well surrounding the sides and bottom of the cryostat and read out by 36individual PMTs. This shield was originally developed for the Max 91 HIgh REsolution Gamma-ray/hard X-ray Spectrometer (HIREGS), a balloon-borne predecessor to the RHESSI spacecraft, and has been successfullyre-flown for NCT, and now GRIPS. With a threshold of ∼100 keV, the BGO shields significantly reduce theinstrumental background even before the Compton imaging and the spectral signature techniques are applied.
3. PLUM BROOK THERMAL VACUUM TEST
It is critical to test subsystems to ensure that all mechanical and electrical systems survive the near-vacuum (∼3mbar) environment at stratospheric altitudes. In March 2015, the GRIPS gondola underwent a full instrumentthermal vacuum test at NASA Glenn’s Plum Brook Station to simulate the thermal environment at altitude. Thetest was carried out in the Spacecraft Propulsion Research Facility (B-2), which consists of a 33’×120’ chamber,and lasted 30 hours at ∼2 torr and 77K. The gondola was suspended from a specially built truss which allowedfor ±5◦ pointing maneuvers during the test (Figure 6).
The B-2 chamber’s cold wall and lid were cooled with liquid nitrogen to simulate a space-like radiationenvironment. It is impossible to fully recreate flight-like conditions, i.e., a very intense point-source striking thefront areas of the payload, and a large albedo source underneath. Instead, we used banks of calibrated IR lampsto simulate flight-like radiation on key areas of the payload. We simulated direct solar illumination with lampsplaced (1) in front of the electronics bay and (2) in front of the boom. The Earth albedo lamps were placed(3) under the electronics bay and (4) under the spectrometer. Heaters were applied to some elements that wereimpractical to illuminate with IR lamps.
The GRIPS thermal model predictions reasonably matched the readings from the ∼80 temperature sensorsused during the test. A critical parameter in making accurate predictions was properly accounting for theradiation environment of the B2 chamber’s interior, namely that it cannot be modeled as a perfect black bodydue to degraded paint on the walls and the grated metal floor. Component temperatures in flight were inreasonable agreement with the overall GRIPS thermal model.
Figure 6: Images of the GRIPS payload in the Plum Brook B-2 chamber. The blue support truss suspendedthe payload within the chamber and allowed for ±5◦ pointing maneuvers. Calibrated IR lamps were used tosimulate direct solar illumination and Earth’s albedo.
4. FLIGHT CAMPAIGN
Beginning on October 31, 2015, the GRIPS gondola underwent a period of integration, pointing control andaspect system testing, and instrument calibration at the NASA Columbia Scientific Balloon Facility’s (CSBF)Long Duration Balloon (LDB) camp on the Ross Ice Shelf near McMurdo Station, Antarctica. While mostof the instrument was transported by ship to Antarctica, the more delicate GRIPS cryostat was flown by the

United States Air National Guard (ANG) to McMurdo, stopping at several locations enroute. Due to logisticalcomplications with requiring access to power to keep the cryostat cold, the cryostat was instead transportedwarm, at the expense of extending the period of integration in Antarctica by ∼2 weeks to cool the cryostat backdown to ∼80 K.
After a pre-flight compatibility test, GRIPS was declared flight ready on the December 26, 2015. Over thefollowing weeks, surface weather conditions needed for launch were scarce; in particular, even on clear days, strongsurface winds exceeded the required 5 knot upper threshold for launch. During this time the payload had sevenaborted launch attempts (“roll-outs”) before successfully launching on the January 19, 2016, at 01:41 UTC. Eachroll-out consisted of a gondola pickup by CSBF’s launch vehicle “The Boss”, followed by a full communicationsand instrument checkout.During several roll-outs, the payload was subjected to colder temperatures than itwould encounter during flight, including freezing fog and light snow.
0
1
2
3
4
5678
9
1011
GRIPS Flight Path 2016
19 20 21 22 23 24 25 26 27 28 29 30
Start Time 18-Jan-2016 18:27 (UTC)
0.0e+005.0e+031.0e+041.5e+042.0e+042.5e+043.0e+043.5e+044.0e+044.5e+04
Alt
itude (
m)
Balloon Altitude
Figure 7: Top: GRIPS flight path with time represented by the color gradient progressing from red, at launchto blue on landing. Numerical annotation indicates the number of days at float.Bottom: Balloon altitude from launch with the color progression indicating time at float.
After ∼5 hours of ascent, the balloon reached a float altitude of ∼39,000 m (bottom of Figure 7). During theflight, the balloon altitude varied diurnally, reaching a maximum altitude of 39,459m at 03:06 UT on January20 and a minimum altitude of 35,873 m at 20:08 UT on January 21. Figure 7 (top) shows the balloon flightpath around the Antarctic continent, with days at float annotated and represented in the color gradient (red atlaunch, blue/purple on landing).
Over the flight, solar activity was relatively low, producing 21 GOES C class flares, the largest of which

was a C9.6 flare on January 28, 2016, at ∼12:00 UT. Figure 8 shows the GOES X-ray lightcurves at 0.5–4.0A(blue) and 1.0–8.0 A(red) for this time period. The corresponding GOES flare classifications are noted on theright-hand axis. GRIPS also observed two extended periods of electrons precipitating from the radiation beltsin events known as microbursts.
19 20 21 22 23 24 25 26 27 28 29 30 31Start Time 18 January 2016 UTC
10-9
10-8
10-7
10-6
10-5
10-4
10-3
Watt
s m
−2
GOES Xray Flux
0.5--4.0 Å1.0--8.0 Å
A
B
C
M
X
Micro
burst
Micro
burst
C9
.6
Figure 8: GOES X-ray lightcurve for the duration of the GRIPS flight (marked by the horizontal black line).The vertical dashed line indicates the largest solar flare, GOES class C9.6, and the shaded areas indicate theperiods of extended microburst activity.
After nearly 12 days at float, preparations were made for landing. Detector data acquisition ended at 19:51UT on January 30, with flight termination occurring shortly after, at 20:51 UT. The balloon landed at 21:30 UTin the Queen Maud Land region of the Antarctic continent, at 83◦6.18 S, 40◦54.08 W. Due to landing occurringlate in the 2015/2016 Antarctic summer season, only the data vaults were recovered. The remainder of theinstrument will be recovered in the following austral 2016/2017 summer.
5. DETECTORS
GRIPS’s 3D-GeDs are high-purity germanium cross-strip detectors that can be used to locate and measure eachenergy deposition in three dimensions. These detectors extend the virtually pixelated detector concept that wassuccessfully demonstrated on the NCT missions in 200512 and 200913 and on the COSI mission in 2016. TheGRIPS detectors are of the same size (7.5 cm×7.5 cm×1.5 cm), but have a 4× finer (0.5 mm) electrode pitch.As with the earlier generations, these detectors were developed and fabricated at Lawrence Berkeley NationalLaboratory.
Each 3D-GeD is fabricated from a single germanium crystal. Orthogonal electrode strips are used to applya 500–750 V bias across the crystal. A photoelectron creates a cloud of electrons and holes within the detector,which drift to opposite detector faces under the applied bias. Figure 9 depicts how the site of photon depositionis determined. The location of the energy deposition in two dimensions is determined by which anode strip and
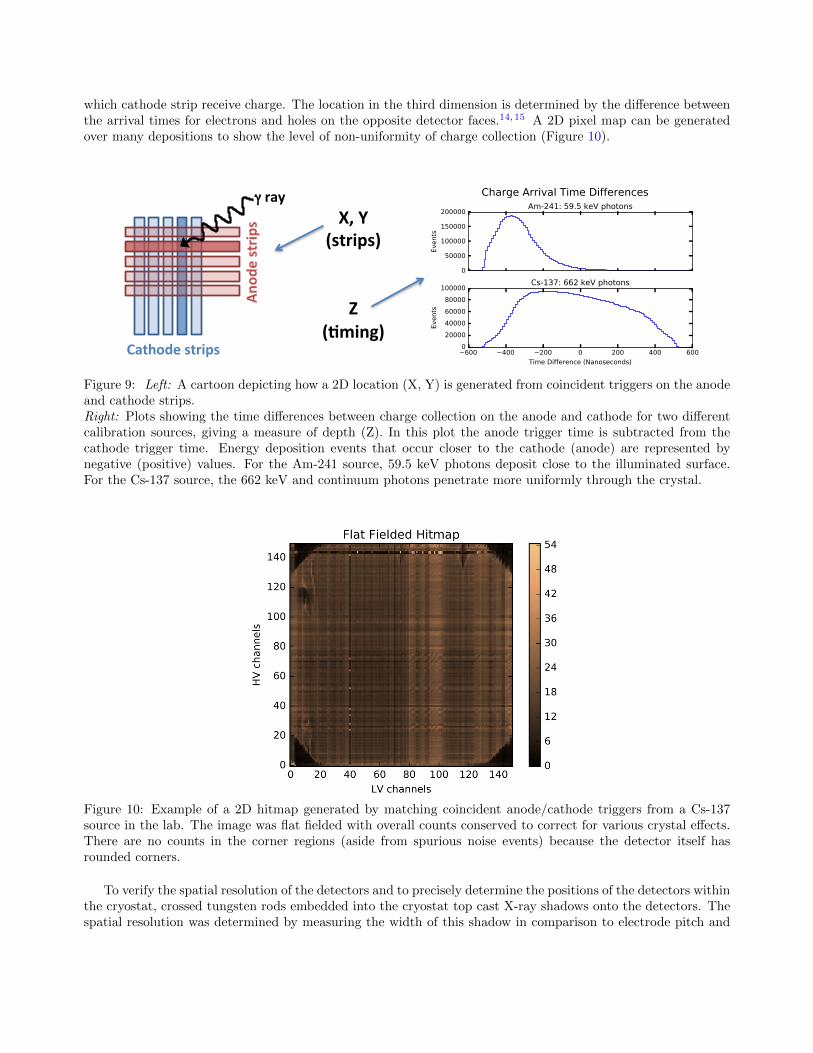
which cathode strip receive charge. The location in the third dimension is determined by the difference betweenthe arrival times for electrons and holes on the opposite detector faces.14,15 A 2D pixel map can be generatedover many depositions to show the level of non-uniformity of charge collection (Figure 10).
Cathode strips
Anod
e strip
s
γ ray X, Y
(strips) Z
(6ming)
Figure 9: Left: A cartoon depicting how a 2D location (X, Y) is generated from coincident triggers on the anodeand cathode strips.Right: Plots showing the time differences between charge collection on the anode and cathode for two differentcalibration sources, giving a measure of depth (Z). In this plot the anode trigger time is subtracted from thecathode trigger time. Energy deposition events that occur closer to the cathode (anode) are represented bynegative (positive) values. For the Am-241 source, 59.5 keV photons deposit close to the illuminated surface.For the Cs-137 source, the 662 keV and continuum photons penetrate more uniformly through the crystal.
Figure 10: Example of a 2D hitmap generated by matching coincident anode/cathode triggers from a Cs-137source in the lab. The image was flat fielded with overall counts conserved to correct for various crystal effects.There are no counts in the corner regions (aside from spurious noise events) because the detector itself hasrounded corners.
To verify the spatial resolution of the detectors and to precisely determine the positions of the detectors withinthe cryostat, crossed tungsten rods embedded into the cryostat top cast X-ray shadows onto the detectors. Thespatial resolution was determined by measuring the width of this shadow in comparison to electrode pitch and

rod diameter (0.46 mm). Figure 11 shows counts summed along the detector diagonals for two flight detectors.The dips at pixels 125 and 175 indicate the location and width of the tungsten rod shadow, showing that it isapproximately the width of one strip pitch. In cases of charge sharing, the extent of charge sharing between twoneighbor strips could be used to determine sub-strip level position accuracy. GRIPSs timing difference resolutionof 50 ns FWHM translates into roughly ∼1 mm FWHM depth resolution within the crystal. These calibrationsindicate a 0.5×0.5×1 mm voxel size for determining photon interactions sites within the GRIPS detectors.
80 90 100 110 120 130
Diagonal Number
0
2
4
6
8
10Normalized Counts
100 110 120 130 140 150
Diagonal Number
Tungsten X-ray Shadows
Figure 11: Crossed tungsten rods were used to cast X-ray shadows along the detector diagonals. These plotsshow a the sum of counts along the diagonals for an Am-241 source in the lab, normalized to show two differentdetectors (D0 in red and D4 in blue) in single plot. The rods can be seen as dark ”X”’s in Fig 14. The quantityof pixels in a diagonal decreases with increasing diagonal number, giving the plots an overall decreasing counttrend. The smaller count fluctuations are primarily due to variations in the energy thresholds for each pixel.
6. SPECTRA
We provide here a preliminary evaluation of the performance of GRIPS’s six flight detectors, with a detailedreport to be provided in a forthcoming calibration paper. GRIPS’s analysis is particularly challenging due toits ∼1,800 detector channels that must be individually calibrated. A complete description of the signal readoutchain, including the ASIC electronics, can be found in an earlier manuscript.2
Preliminary line-width measurements show a typical energy resolution of 5 keV FWHM at 59.5 keV, but weare still refining our approach to subtracting common-mode noise. Due to the fine strip pitch and dense circuittraces, there is significant correlated noise between multiple channels that can be quantified and removed. Thiscommon-mode subtraction is implemented in post-processing of the raw data for each individual triggered eventand has been extremely successful, reducing line-widths by 10s of keV.
The dominant source of common-mode noise is low-frequency noise resulting from the mechanical cryocoolerand its associated power supply. The ASIC has limited low-frequency filtering capabilities, and it was not feasibleto introduce high-pass filtering in the analog-signal chain. When the cryocooler was briefly turned off, we wereable to achieve line widths comparable to that previously reported for the GRIPS signal readout chain in a testcryostat cooled via liquid nitrogen: 3.5 keV FWHM at 59.5 keV.2
The ∼30 keV low-energy spectral cutoff was determined by a combination of triggering thresholds, set tominimize spurious triggers, and the atmospheric energy cutoff, determined by the payload altitude and solarelevation in the sky. Due to the size of the ionization clouds and associated effects, there are not significantsingle-strip energy depositions above ∼1 MeV. The full 10 MeV energy range is achieved by summing overmultiple strips in a scatter track. Four types of radioactive sources (Am-241, Co-60, Ba-133 and Cs-137) wereused to determine the detector energy response. Figure 12 shows an example barium-133 single strip spectrumacquired as part of ground calibration. Figure 13 shows a preliminary Antarctic background spectrum integratedover 52 hours in flight.

0 200 400 600 800 1000
Bins
0
200
400
600
800
1000
1200
Counts
81
276
303
356
384
Line energies in keV
Ba-133 spectrum
Figure 12: Single-strip spectrum for a barium-133 source, plotted in raw bin space. The low-energy threshold isset to ∼40 keV in this dataset. Incomplete charge collection of higher-energy events creates the wide bump-likefeature around bin 375.
100
101
102
103
104
Events
HV Channel 45
0 500 1000 1500 2000
Bins
100
101
102
103
104
Events
LV Channel 146
Flight Background Detector 4
Figure 13: Antarctic background for an anode and cathode strip on Detector 4 integrated over 52 hours in flight.The spectra look as expected, peaking around the lower energy threshold and smoothly decreasing.
7. POINTING CONTROL SYSTEM
GRIPS’s pointing control system relied on a Sun sensor consisting of a quad-cell photodiode, with a 3.5 cm tubeending with a 5 mm square aperture mounted in front of it. The differences in voltage between photo-diodequadrants yields the accurate position of the Sun, down to a resolution of about 2 arcmin, corresponding to thesmallest increment of the 11-bit ADC of micro-controller input. The Sun sensor had an 8◦ primary field of view(FOV), where the direction and distance of the Sun with respect to the Sun Sensor axis can be determined, anda secondary FOV extending to 24◦. When in the secondary FOV, it can be determined in which direction theSun is, but not how far it is from the optical axis.
Elevation was controlled by a linear actuator that would push/pull the boom as needed, and the positionwas measured by both an incremental encoder and an absolute encoder. The default elevation control logic isa simple ”PD” (proportional & derivative) loop. An alternate elevation control logic used a simpler constant-velocity (∼0.1◦/s) control loop. The target elevation is computed by calculating the solar elevation at the timeand location provided by GPS and correcting for differences with the Sun sensor output (accumulated over fiveminutes).
Azimuth was controlled by a motor attached to the main rotator, with no direct feedback of the position of
the motor. The azimuth control logic is a classical PID control loop, and the ”X” component of the Sun Sensoris the sole input. This control loop operates mostly independently from the elevation control loop, and beginsseeking the Sun at a speed of about 0.5◦/s once the boom is at the proper elevation. Once the Sun enters theFOV, the azimuth control loop adjusts the motor as needed to maintain tracking of the Sun.
The pointing control system functioned extremely well in flight. An angular offset (azimuth + elevation)below 0.5◦ rms was the requirement (driven mostly by imaging), and an average of 0.2◦ rms was achieved. Whilesolar tracking performed well, acquiring the Sun in the first place proved to be difficult. We concluded that theSun Sensor’s FOV was too small for the whole system to properly damp a large-amplitude oscillation in azimuth(∼ ±90◦). As a result, it took longer than expected to acquire the Sun during ascent, and it took ∼5 hours tore-acquire the Sun partway through the flight following a commanded reboot of the flight computer, fortunatelywith no loss to science. Ground testing did not reveal this difficulty due to the limited azimuthal movementsavailable in enclosed (wind-free) facilities.
8. ASPECT SYSTEM
The GRIPS aspect system provides the high-cadence, high-resolution pointing knowledge necessary for imagereconstruction, thus allowing for the relaxed pointing-control requirements and mechanical requirements (e.g.,twist). The aspect system makes three primary measurements: the pitch/yaw offset of the optical bench to Suncenter, the orientation of the MPRM, and the absolute roll of the optical bench. Compared to earlier descriptionsof the aspect system,2 the final aspect system and its testing incorporated lessons learned from the Solar AspectSystem (SAS) of the HEROES balloon instrument,16 whose design was adapted from the original GRIPS design.Furthermore, the HEROES project graciously contributed components for the roll sensor, as discussed below.
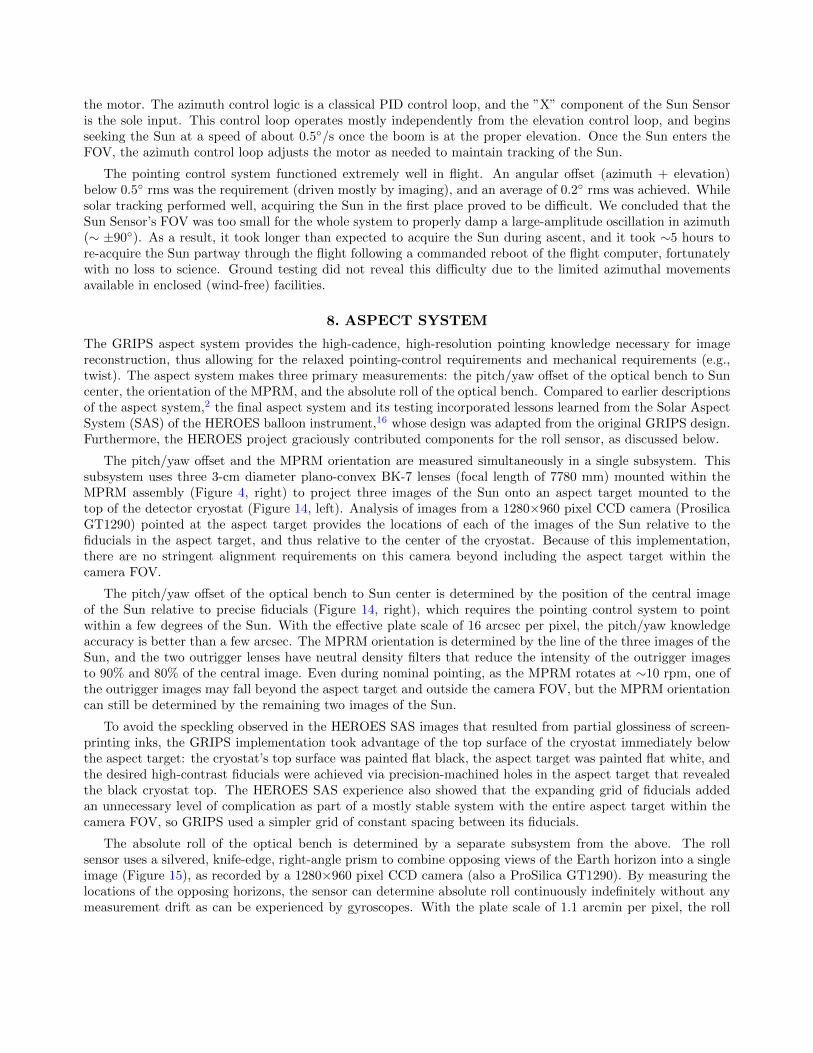
The pitch/yaw offset and the MPRM orientation are measured simultaneously in a single subsystem. Thissubsystem uses three 3-cm diameter plano-convex BK-7 lenses (focal length of 7780 mm) mounted within theMPRM assembly (Figure 4, right) to project three images of the Sun onto an aspect target mounted to thetop of the detector cryostat (Figure 14, left). Analysis of images from a 1280×960 pixel CCD camera (ProsilicaGT1290) pointed at the aspect target provides the locations of each of the images of the Sun relative to thefiducials in the aspect target, and thus relative to the center of the cryostat. Because of this implementation,there are no stringent alignment requirements on this camera beyond including the aspect target within thecamera FOV.
The pitch/yaw offset of the optical bench to Sun center is determined by the position of the central imageof the Sun relative to precise fiducials (Figure 14, right), which requires the pointing control system to pointwithin a few degrees of the Sun. With the effective plate scale of 16 arcsec per pixel, the pitch/yaw knowledgeaccuracy is better than a few arcsec. The MPRM orientation is determined by the line of the three images of theSun, and the two outrigger lenses have neutral density filters that reduce the intensity of the outrigger imagesto 90% and 80% of the central image. Even during nominal pointing, as the MPRM rotates at ∼10 rpm, one ofthe outrigger images may fall beyond the aspect target and outside the camera FOV, but the MPRM orientationcan still be determined by the remaining two images of the Sun.
To avoid the speckling observed in the HEROES SAS images that resulted from partial glossiness of screen-printing inks, the GRIPS implementation took advantage of the top surface of the cryostat immediately belowthe aspect target: the cryostat’s top surface was painted flat black, the aspect target was painted flat white, andthe desired high-contrast fiducials were achieved via precision-machined holes in the aspect target that revealedthe black cryostat top. The HEROES SAS experience also showed that the expanding grid of fiducials addedan unnecessary level of complication as part of a mostly stable system with the entire aspect target within thecamera FOV, so GRIPS used a simpler grid of constant spacing between its fiducials.
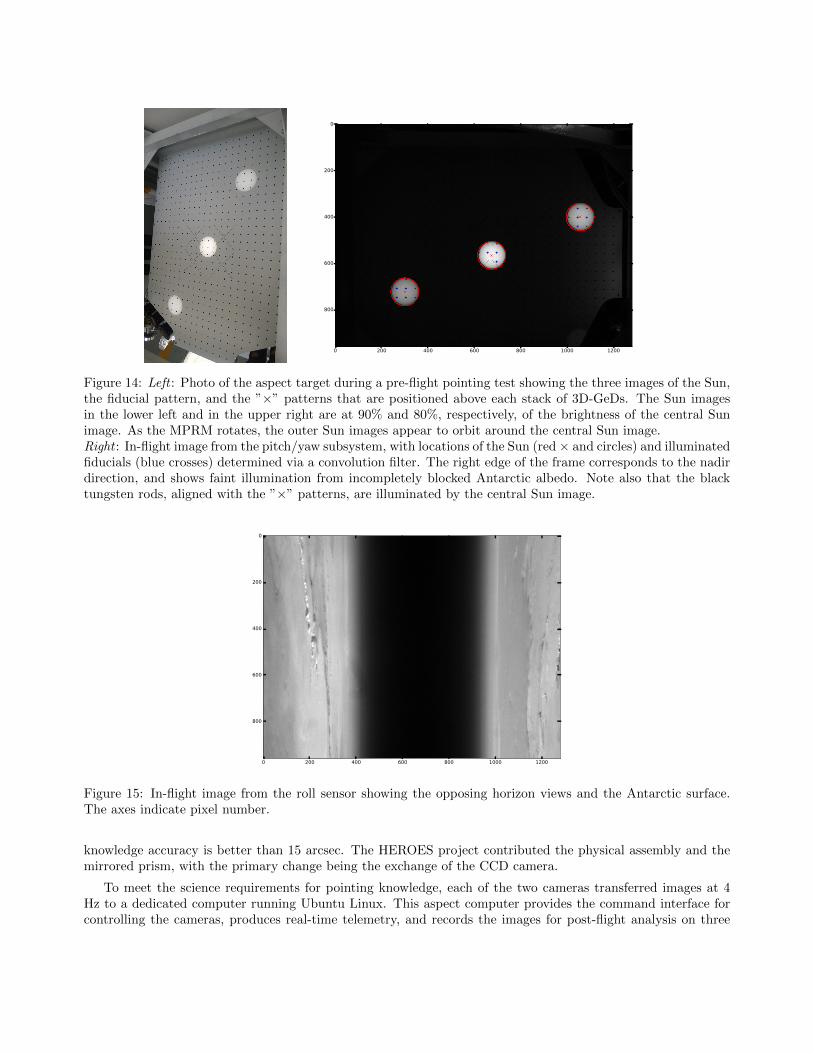
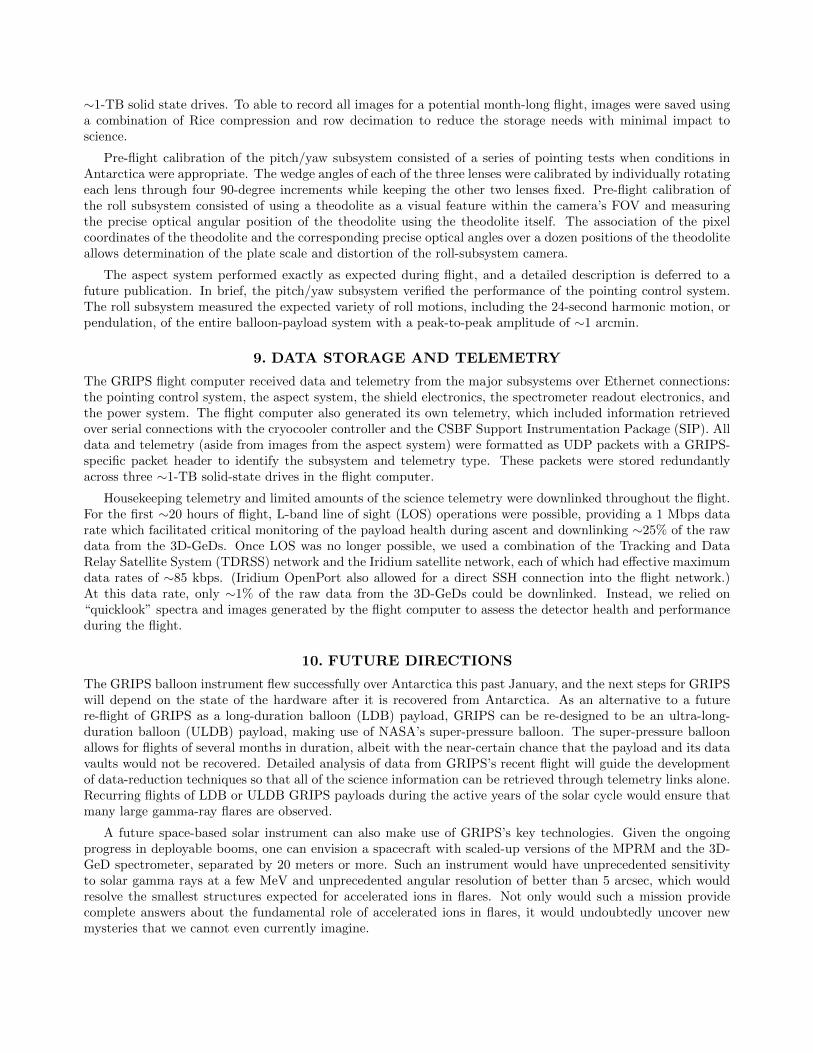
The absolute roll of the optical bench is determined by a separate subsystem from the above. The rollsensor uses a silvered, knife-edge, right-angle prism to combine opposing views of the Earth horizon into a singleimage (Figure 15), as recorded by a 1280×960 pixel CCD camera (also a ProSilica GT1290). By measuring thelocations of the opposing horizons, the sensor can determine absolute roll continuously indefinitely without anymeasurement drift as can be experienced by gyroscopes. With the plate scale of 1.1 arcmin per pixel, the roll
0 200 400 600 800 1000 1200
0
200
400
600
800
Figure 14: Left : Photo of the aspect target during a pre-flight pointing test showing the three images of the Sun,the fiducial pattern, and the ”×” patterns that are positioned above each stack of 3D-GeDs. The Sun imagesin the lower left and in the upper right are at 90% and 80%, respectively, of the brightness of the central Sunimage. As the MPRM rotates, the outer Sun images appear to orbit around the central Sun image.Right : In-flight image from the pitch/yaw subsystem, with locations of the Sun (red × and circles) and illuminatedfiducials (blue crosses) determined via a convolution filter. The right edge of the frame corresponds to the nadirdirection, and shows faint illumination from incompletely blocked Antarctic albedo. Note also that the blacktungsten rods, aligned with the ”×” patterns, are illuminated by the central Sun image.
0 200 400 600 800 1000 1200
0
200
400
600
800
Figure 15: In-flight image from the roll sensor showing the opposing horizon views and the Antarctic surface.The axes indicate pixel number.
knowledge accuracy is better than 15 arcsec. The HEROES project contributed the physical assembly and themirrored prism, with the primary change being the exchange of the CCD camera.
To meet the science requirements for pointing knowledge, each of the two cameras transferred images at 4Hz to a dedicated computer running Ubuntu Linux. This aspect computer provides the command interface forcontrolling the cameras, produces real-time telemetry, and records the images for post-flight analysis on three
∼1-TB solid state drives. To able to record all images for a potential month-long flight, images were saved usinga combination of Rice compression and row decimation to reduce the storage needs with minimal impact toscience.
Pre-flight calibration of the pitch/yaw subsystem consisted of a series of pointing tests when conditions inAntarctica were appropriate. The wedge angles of each of the three lenses were calibrated by individually rotatingeach lens through four 90-degree increments while keeping the other two lenses fixed. Pre-flight calibration ofthe roll subsystem consisted of using a theodolite as a visual feature within the camera’s FOV and measuringthe precise optical angular position of the theodolite using the theodolite itself. The association of the pixelcoordinates of the theodolite and the corresponding precise optical angles over a dozen positions of the theodoliteallows determination of the plate scale and distortion of the roll-subsystem camera.
The aspect system performed exactly as expected during flight, and a detailed description is deferred to afuture publication. In brief, the pitch/yaw subsystem verified the performance of the pointing control system.The roll subsystem measured the expected variety of roll motions, including the 24-second harmonic motion, orpendulation, of the entire balloon-payload system with a peak-to-peak amplitude of ∼1 arcmin.
9. DATA STORAGE AND TELEMETRY
The GRIPS flight computer received data and telemetry from the major subsystems over Ethernet connections:the pointing control system, the aspect system, the shield electronics, the spectrometer readout electronics, andthe power system. The flight computer also generated its own telemetry, which included information retrievedover serial connections with the cryocooler controller and the CSBF Support Instrumentation Package (SIP). Alldata and telemetry (aside from images from the aspect system) were formatted as UDP packets with a GRIPS-specific packet header to identify the subsystem and telemetry type. These packets were stored redundantlyacross three ∼1-TB solid-state drives in the flight computer.
Housekeeping telemetry and limited amounts of the science telemetry were downlinked throughout the flight.For the first ∼20 hours of flight, L-band line of sight (LOS) operations were possible, providing a 1 Mbps datarate which facilitated critical monitoring of the payload health during ascent and downlinking ∼25% of the rawdata from the 3D-GeDs. Once LOS was no longer possible, we used a combination of the Tracking and DataRelay Satellite System (TDRSS) network and the Iridium satellite network, each of which had effective maximumdata rates of ∼85 kbps. (Iridium OpenPort also allowed for a direct SSH connection into the flight network.)At this data rate, only ∼1% of the raw data from the 3D-GeDs could be downlinked. Instead, we relied on“quicklook” spectra and images generated by the flight computer to assess the detector health and performanceduring the flight.
10. FUTURE DIRECTIONS
The GRIPS balloon instrument flew successfully over Antarctica this past January, and the next steps for GRIPSwill depend on the state of the hardware after it is recovered from Antarctica. As an alternative to a futurere-flight of GRIPS as a long-duration balloon (LDB) payload, GRIPS can be re-designed to be an ultra-long-duration balloon (ULDB) payload, making use of NASA’s super-pressure balloon. The super-pressure balloonallows for flights of several months in duration, albeit with the near-certain chance that the payload and its datavaults would not be recovered. Detailed analysis of data from GRIPS’s recent flight will guide the developmentof data-reduction techniques so that all of the science information can be retrieved through telemetry links alone.Recurring flights of LDB or ULDB GRIPS payloads during the active years of the solar cycle would ensure thatmany large gamma-ray flares are observed.
A future space-based solar instrument can also make use of GRIPS’s key technologies. Given the ongoingprogress in deployable booms, one can envision a spacecraft with scaled-up versions of the MPRM and the 3D-GeD spectrometer, separated by 20 meters or more. Such an instrument would have unprecedented sensitivityto solar gamma rays at a few MeV and unprecedented angular resolution of better than 5 arcsec, which wouldresolve the smallest structures expected for accelerated ions in flares. Not only would such a mission providecomplete answers about the fundamental role of accelerated ions in flares, it would undoubtedly uncover newmysteries that we cannot even currently imagine.

11. PIGGYBACK INSTRUMENTS
In addition to the primary instrument, the GRIPS gondola also carried three piggyback instruments, and two ofthese instruments had solar-science objectives related to GRIPS’s objectives. The solar instruments, SOLAR-Tand SMASH, specifically mounted to the telescope boom to ensure that they would be continuously pointed atthe Sun during the long-duration flight.
11.1 SOLAR-T
SOLAR-T (PI: Pierre Kaufmann) was built to observe the full-disk Sun at 3 and 7 THz with high sensitivityand sub-second time resolution. Golay cell detectors are placed at the foci of two 7.6 cm Cassegrain telescopes.Low-pass filters consist of rough surface primary mirrors and membranes followed by metal mesh band-passfilters and choppers. Its redundant data acquisition system included Iridium telemetry for monitoring duringthe flight.
The SOLAR-T performed successfully during the GRIPS flight. Solar disk brightness temperatures weredetermined: 5300K at 3 THz and 4700K at 7 THz. Burst detection sensitivity was 1% of the full solar disk levelat both frequencies. One impulsive event was detected from AR14289 on January 28, 2016, at 3 and 7 THz,peaking at 12:12:10 UT, time-coincident with bursts detected at 0.2 and 0.4 THz by the ground-based SST inArgentina, in Hα by HASTA also in Argentina, and in EUV by SDO. One EUV bright blob forms at the top ofan arch, falls, and hits the footpoint precisely at the same time of the THz impulsive burst. Fluxes at sub-THzand THz bands increase with frequency at both ranges, with a possible break in intensity somewhere between0.4 and 3 THz.
11.2 SMASH: The SwRI Miniature Assembly for Solar Hard X-rays
SMASH (PI: Amir Caspi) was a technological demonstration of a new miniaturized hard X-ray (HXR) detectorfor future use on CubeSats and other small spacecraft, including the proposed CubeSat Imaging X-ray SolarSpectrometer (CubIXSS?). SMASH demonstrated the space-borne application of the commercial off-the-shelfAmptek X123-CdTe, a miniature cadmium telluride photon-counting HXR spectrometer. The detector has aphysical area of 25 mm2 and 1 mm fully-depleted thickness and is nominally sensitive to solar photons from ∼5to ∼100 keV with ∼0.5–1.0 keV FWHM resolution, but for the GRIPS flight, the effective low-energy limit was∼20 keV due to atmospheric attenuation.
Photons are accumulated into histogram spectra with customizable energy binning and integration time(cf.17); for SMASH, we used 1024 bins (∼0.1 keV/bin) and 10 s integrations. SMASH flew two identical detectorsfor redundancy and increased collecting area. The supporting electronics (power, CPU) were largely build-to-print using the Miniature X-ray Solar Spectrometer (MinXSS;18) CubeSat design. Data was stored on boardand also telemetered to the GRIPS flight computer for selective downlink to the ground.
All of the observed C-class flares during the mission were below SMASH’s sensitivity requirements for strato-spheric flight, but a space-borne application would be sensitive to these smaller flares. Analysis of the microburstperiods is pending. Crucially, however, the X123 detectors operated nominally during the entire ∼12-day flight,with no anomalies or upsets recorded, thus proving the operation of these detectors in a near-space environment.
11.3 TILDAE: Turbulence and Intermittency Long-Duration Atmospheric Experiment
The Turbulence and Intermittency Long-Duration Atmospheric Experiment [TILDAE: Co-PIs: Raffaele Marino(NCAR, ENS Lyon) and Bennett A. Maruca (U. Delaware, UC Berkeley)], encompassed a sonic anemometer(manufactured by Applied Technologies, Longmont, CO) to measure the propagation time of sound waves, toinfer wind velocity and air temperature at a 200 Hz cadence.19 TILDAE was designed to observe the inter-mittent structures (including ”bursts” of turbulence) that develop in the stratification layers of the lower andmid stratosphere.20 Its flight on GRIPS was one of the first attempts to use this type of anemometer in thestratosphere, taking advantage of the gondola’s long-duration flight, gradual changes in altitude, and orientation(azimuth) control. In general, sonic anemometers have good sensitivity and excellent calibration.21

ACKNOWLEDGMENTS
The GRIPS project was funded in large part by NASA grants NNX08BA28G and NNX13AJ21G. N. Dun-can’s work was partially supported by a NASA Graduate Student Researchers Program (GSRP) fellowship. B.Maruca’s work on both GRIPS and TILDAE was supported by the Charles Hard Townes Postdoctoral Fellow-ship. TILDAE was also supported by the University of Calabria via the Turboplasmas project (Marie CurieFP7 PIRSES-2010-269297). SMASH was supported by an internal R&D grant at Southwest Research Institute.SOLAR-T was supported by multiple grants from Sao Paulo Research Foundation (FAPESP).
REFERENCES
[1] Shih, A. Y., Lin, R. P., Hurford, G. J., Duncan, N. A., Saint-Hilaire, P., Bain, H. M., Boggs, S. E., Zoglauer,A. C., Smith, D. M., Tajima, H., Amman, M. S., and Takahashi, T., “The Gamma-Ray Imager/Polarimeterfor Solar flares (GRIPS),” in [Space Telescopes and Instrumentation 2012: Ultraviolet to Gamma Ray ],Proceedings of the SPIE 8443, 84434H (Sept. 2012).
[2] Duncan, N., Shih, A., Hurford, G., Saint-Hilaire, P., Zoglauer, A., Bain, H., Amman, M., Boggs, S., andLin, R., “Detector and imaging systems for the gamma-ray imager/polarimeter for solar flares (GRIPS)instrument,” in [Solar Physics and Space Weather Instrumentation V ], Proceedings of the SPIE 8862,88620W (Sept. 2013).
[3] Emslie, A. G., Dennis, B. R., Shih, A. Y., Chamberlin, P. C., Mewaldt, R. A., Moore, C. S., Share, G. H.,Vourlidas, A., and Welsch, B. T., “Global Energetics of Thirty-eight Large Solar Eruptive Events,” ApJ 759,71 (Nov. 2012).
[4] Murphy, R. J. and Share, G. H., “What gamma-ray deexcitation lines reveal about solar-flares,” Advancesin Space Research 35, 1825–1832 (2005).
[5] Murphy, R. J., “Solar Gamma-Ray Spectroscopy,” ssr 130, 127–138 (June 2007).
[6] Lin, R. P., Dennis, B. R., Hurford, G. J., Smith, D. M., Zehnder, A., Harvey, P. R., Curtis, D. W., Pankow,D., Turin, P., Bester, M., Csillaghy, A., Lewis, M., Madden, N., van Beek, H. F., Appleby, M., Raudorf,T., McTiernan, J., Ramaty, R., Schmahl, E., Schwartz, R., Krucker, S., Abiad, R., Quinn, T., Berg, P.,Hashii, M., Sterling, R., Jackson, R., Pratt, R., Campbell, R. D., Malone, D., Landis, D., Barrington-Leigh,C. P., Slassi-Sennou, S., Cork, C., Clark, D., Amato, D., Orwig, L., Boyle, R., Banks, I. S., Shirey, K.,Tolbert, A. K., Zarro, D., Snow, F., Thomsen, K., Henneck, R., McHedlishvili, A., Ming, P., Fivian, M.,Jordan, J., Wanner, R., Crubb, J., Preble, J., Matranga, M., Benz, A., Hudson, H., Canfield, R. C., Holman,G. D., Crannell, C., Kosugi, T., Emslie, A. G., Vilmer, N., Brown, J. C., Johns-Krull, C., Aschwanden, M.,Metcalf, T., and Conway, A., “The Reuven Ramaty High-Energy Solar Spectroscopic Imager (RHESSI),”solphys 210, 3–32 (Nov. 2002).
[7] Shih, A. Y., Lin, R. P., and Smith, D. M., “RHESSI Observations of the Proportional Acceleration ofRelativistic 0.3 MeV Electrons and 30 MeV Protons in Solar Flares,” apjl 698, L152–L157 (June 2009).
[8] Hurford, G. J., Schwartz, R. A., Krucker, S., Lin, R. P., Smith, D. M., and Vilmer, N., “First Gamma-RayImages of a Solar Flare,” apjl 595, L77–L80 (Oct. 2003).
[9] Hurford, G. J., Krucker, S., Lin, R. P., Schwartz, R. A., Share, G. H., and Smith, D. M., “Gamma-RayImaging of the 2003 October/November Solar Flares,” apjl 644, L93–L96 (June 2006).
[10] Takahashi, T., e., “The ASTRO-H X-ray Observatory,” in [Space Telescopes and Instrumentation 2012:Ultraviolet to Gamma Ray ], procspie 8443, 84431Z (Sept. 2012).
[11] Krucker, S., Christe, S., Glesener, L., Ishikawa, S., Ramsey, B., Gubarev, M., Saito, S., Takahashi, T.,Watanabe, S., Tajima, H., Tanaka, T., Turin, P., Glaser, D., Fermin, J., and Lin, R. P., “The focus-ing optics x-ray solar imager (FOXSI): instrument and first flight,” in [Solar Physics and Space WeatherInstrumentation V ], procspie 8862, 88620R (Sept. 2013).
[12] Coburn, W., Boggs, S. E., Bowen, J. D., Bandstra, M. E., Amman, M. S., Burks, M. T., Craig, W., Jean, P.,Lin, R. P., Luke, P. N., Madden, N. W., Smith, D. M., and von Ballmoos, P., “First results from the balloonflight of the NCT prototype,” in [Society of Photo-Optical Instrumentation Engineers (SPIE) ConferenceSeries ], Siegmund, O. H. W., ed., Society of Photo-Optical Instrumentation Engineers (SPIE) ConferenceSeries 5898, 13–21 (Aug. 2005).

[13] Bandstra, M. S., Bellm, E. C., Boggs, S. E., Perez-Becker, D., Zoglauer, A., Chang, H.-K., Chiu, J.-L.,Liang, J.-S., Chang, Y.-H., Liu, Z.-K., Hung, W.-C., Huang, M.-H. A., Chiang, S. J., Run, R.-S., Lin,C.-H., Amman, M., Luke, P. N., Jean, P., von Ballmoos, P., and Wunderer, C. B., “Detection and Imagingof the Crab Nebula with the Nuclear Compton Telescope,” apj 738, 8 (Sept. 2011).
[14] Amman, M. and Luke, P., “Three-dimensional position sensing and field shaping in orthogonal-strip germa-nium gamma-ray detectors,” Nuclear Instruments and Methods in Physics Research Section A: Accelerators,Spectrometers, Detectors and Associated Equipment 452(12), 155 – 166 (2000).
[15] Amrose, S., Boggs, S., Coburn, W., Lin, R., and Smith, D., “Calibration of 3d positioning in a ge cross-stripdetector,” Nuclear Instruments and Methods in Physics Research Section A: Accelerators, Spectrometers,Detectors and Associated Equipment 505(12), 170 – 173 (2003). ¡ce:title¿Proceedings of the tenth Sympo-sium on Radiation Measurements and Applications¡/ce:title¿.
[16] Christe, S., Shih, A., Rodriguez, M., Gregory, K., Cramer, A., Edgerton, M., Gaskin, J., O’Connor, B., andSobey, A., “A Solar Aspect System for the HEROES mission.,” IEEE , 1–9 (2014).
[17] Caspi, A., Woods, T. N., and Warren, H. P., “New Observations of the Solar 0.5-5 keV Soft X-Ray Spec-trum,” The Astrophysical Journal, Letters 802, L2 (Mar. 2015).
[18] Mason, J. P., Woods, T. N., Caspi, A., Chamberlin, P. C., Moore, C., Jones, A., Kohnert, R., Li, X.,Palo, S., and Solomon, S. C., “Miniature X-Ray Solar Spectrometer: A Science-Oriented, University 3UCubeSat,” Journal of Spacecraft and Rockets 53, 328–339 (Mar. 2016).
[19] Kaimal, J. C., “Sonic anemometer measurement of atmospheric turbulence,” in [Proceedings of the DynamicFlow Conference ], 551–565 (1978).
[20] Theuerkauf, A. and Gerding, M. Lubken, F.-J., “Litos – a new balloon-borne instrument for fine-scaleturbulence soundings in the stratosphere,” Atmospheric Measurement Techniques 4, 55–66 (January 2011).
[21] Cuerva, A. and Sanz-Andres, A., “On sonic anemometer measurement theory,” Journal of Wind Engineeringand Industrial Aerodynamics 88, 25–55 (November 2000).


