Embed Size (px)
Citation preview

Utility/Lab Workshop on PV Technology and Systems
November 8-9, 2010Tempe, Arizona
Grid Operations and High Penetration PVAbraham Ellis ([email protected])
Sandia National Laboratories
Sandia is a multiprogram laboratory operated by Sandia Corporation, a Lockheed Martin Company, for the United States Department of Energy’s National Nuclear Security Administration under contract DE-AC04-94AL85000.

Outline
• How to measure “PV Penetration”
• What is “High PV Penetration”
• Thoughts about “Penetration Limits”
• System Operations with High Penetration– Distribution system issues
– Bulk system issues
• Conclusions
• Definitions– DG = distributed generation; VG = variable generation
2Utility/Lab Workshop, Nov. 2010, Tempe, AZ
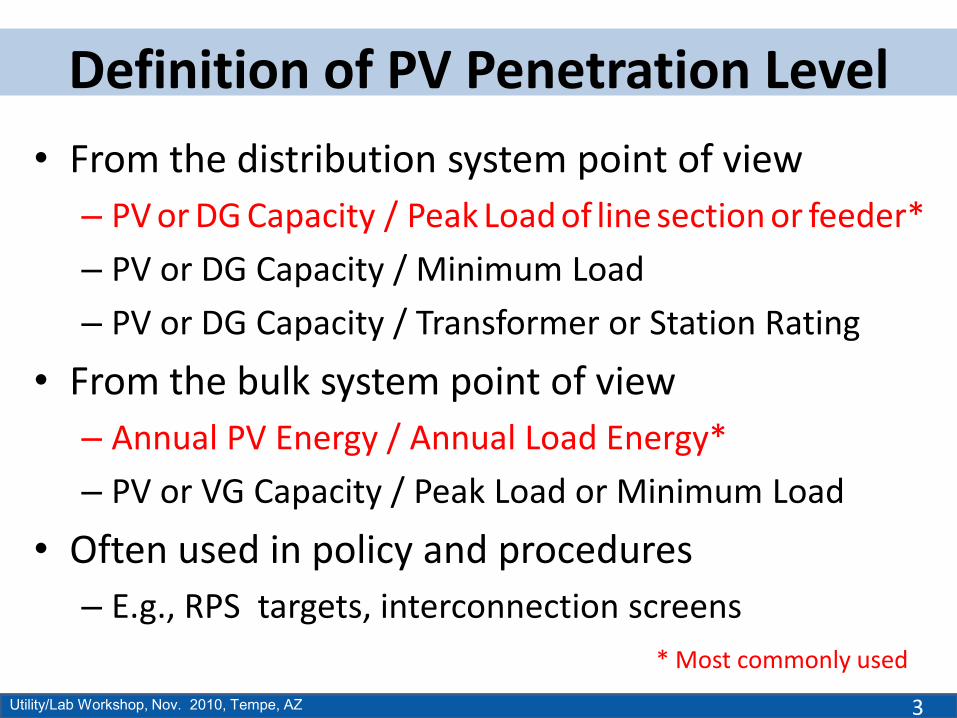
Definition of PV Penetration Level
• From the distribution system point of view– PV or DG Capacity / Peak Load of line section or feeder*
– PV or DG Capacity / Minimum Load
– PV or DG Capacity / Transformer or Station Rating
• From the bulk system point of view– Annual PV Energy / Annual Load Energy*
– PV or VG Capacity / Peak Load or Minimum Load
• Often used in policy and procedures– E.g., RPS targets, interconnection screens
3Utility/Lab Workshop, Nov. 2010, Tempe, AZ
* Most commonly used

Definition of PV Penetration Level
• Example for distribution system
• Example for bulk system
4Utility/Lab Workshop, Nov. 2010, Tempe, AZ
Peak / Min (MW) Penetration for 1 MW PV
Feeder Load 3 / 0.9 1 33% / 111%
Station Load 10 / 3 1 10% / 33%
Station Rating 20 5%
Load Penetration for 1 GW PV
Peak/Min (GW) Energy (GWh) By Capacity By Energy 3
Utility (LSE) 5 /2 1 24,000 1 20% / 50% 6%
Balancing Area 50 / 20 2 240,000 2 2% / 5% 0.6%1 e.g., SDGE, 2009 2 e.g., CAISO, 2009 3Assumes 16% annual capacity factor
1 Minimum Load may be in the range of 20% to 40% of Peak Load

What is High PV Penetration?
• It depends!– With respect to what part of the system?
• Feeder or Local Grid? >50% by capacity?
• BA/Market? Interconnection? >5% by energy?
– Assuming Business-As-Usual or Best Practices?• Technology, Standards, Procedures, Market, Regulatory…
• High penetration is a concern when…– There is a technical risk that system performance and
reliability would be objectionable and
– Cost of mitigation, allocation would be unreasonable
5Utility/Lab Workshop, Nov. 2010, Tempe, AZ

Are There Penetration Limits?
• There are no absolute technical limits– Cost and technical risk may increase
6Utility/Lab Workshop, Nov. 2010, Tempe, AZ
Cost
of o
r Ri
sk
Penetration Level
System A System B
System B with evolving best practices

Distribution Operations Issues
• Possible impacts depend on factors including…– Feeder characteristics impedance
– Penetration level, DG location on feeder
– Type of voltage control and protection
– Load characteristics
• Most common operations concerns include…– Customer voltage regulation, power quality
– Excessive operation of voltage control equipment
– Protection
7Utility/Lab Workshop, Nov. 2010, Tempe, AZ

Voltage Control• High voltage at end of feeder with high PV
generation at the end of a long feeder– Operate PV generators at lower power factor
– Adjust LTC/VR settings; adjust capacitor schedule
Volta
ge
UtilitySubstation
LTC/VR
ANSI C.84.1 range
Reverse Flow
Large PV generation at end of feeder

• Low voltage at end of long feeder due to large PV ahead of load– Account for PV injection in LTC/VR control logic
– PV on dedicated feeder
– Install VR ahead of PV
Voltage Control
Utility/Lab Workshop, Nov. 2010, Tempe, AZ
Source: DOE RSI study, “Advanced Grid Planning and Operations” (EPRI)

• Excessive LTC/VR tap activity or flicker due to PV variability (centralized PV, long feeder)– Review and adjust VR/LTC settings (dead band, timer)
– Enable PV inverters to provide dynamic var support, passively or actively
Voltage Control
Utility/Lab Workshop, Nov. 2010, Tempe, AZ
Source: EPRI/Sandia Inverter Interoperability Project
DOE RSI study, “Advanced Grid Planning and Operations”
Volt/Var Droop Characteristic
Variable PF based on PV Output

01 02 03 04 05 06 07 08 09
64
66
68
70
72
74
Vol
tage
(kV
)
Days01 02 03 04 05 06 07 08 09
-5-4-3-2-10123456789101112131415161718192021222324252627282930
Rea
l Pow
er (k
W)
P V (rms)
Load profile level without PV
Voltage Control• Voltage issues are much less problematic in short
urban feeders, even at very high penetration!30
25
20
15
10
5
0
-5
76
74
72
70
68
66
64
62
Sta
tion
Load
, MW
Bus
Vol
tage
, kV

Other Distribution Operations Issues
• Other power quality
• Protection and islanding– Relay desensitization, nuisance tripping
• Reduction in fault current from utility source, reverse flow
– Risk of islanding• Customer exposure to high voltages (ferro-resonance)
• Recloser coordination
• Management and control– Visibility and controllability of distributed PV
– Interoperability, Cyber-security
12Utility/Lab Workshop, Nov. 2010, Tempe, AZ

Nuisance Tripping
• Inverter fault contribution is relatively small, but could cause unnecessary relay operation– Review reverse current protection scheme
DOE RSI study, “Advanced Grid Planning and Operations”

DG Connection Standards
• Harmonics, DC injection, flicker
14Utility/Lab Workshop, Nov. 2010, Tempe, AZ

DG Connection Standards
15Utility/Lab Workshop, Nov. 2010, Tempe, AZ

Impact on Bulk System Operations
• Impacts depend on factors such as…– Penetration level
– Aggregated output characteristics (short-term, daily, seasonal variability)
– System characteristics (size, maneuverability of generation resources, market flexibility)
• Most common operations concerns include…– Increase in cost (regulation, ramping, scheduling, UC)
– Degradation of Balancing Area performance
– Wear-and-tear on regulating units
16Utility/Lab Workshop, Nov. 2010, Tempe, AZ

Increase in Operating Cost
$0
$1
$2
$3
$4
$5
$6
$7
$8
$9
$10
0% 5% 10% 15% 20% 25% 30% 35%
Wind Penetration (Capacity Basis)
Inte
grat
ion
Cos
t ($/
MW
h)
Arizona Public Service
Avista Utilities
California RPS
Idaho Power
MN-MISO
Pacificorp-2004
Pacificorp-2007
Puget Sound Energy
We Energies
Xcel-MNDOC
Xcel-PSCo-2006
Xcel-PSCo-2008
Xcel-UWIG
Xcel-PSCo-2008 at 2006 Gas Prices

• There are many effective strategies to mitigate additional variability; some – Larger BA footprint, better cooperation among BAs
– Access to formal and flexible markets
– Application of forecasting
– Active power controls
– Plan for flexibility
– Energy storage
– …
Possible Increase in Operating Cost

• System with high penetration PV looks different– Daytime output makes issues less problematic
– Generation flexibility is key for High Penetration
Possible Increase in Operating Cost
DOE RSI study, “Production Cost Modeling with High Levels of
Photovoltaics Penetration”

Other Bulk System Operation Issues
• Sympathetic tripping of PV generation due to transmission disturbances– Voltage and frequency tolerance standards
• Voltage stability (locally)– Reactive power standards
• Frequency performance due to displacement of inertia (with very high penetration of inverters)– Active power controls—market-based incentives?
– Synthetic inertia
20Utility/Lab Workshop, Nov. 2010, Tempe, AZ

• Voltage and Fre2quency ride-through standards– Proposed NERC PRC-024
– Technology-neutral
(applies to all generators)
– What about DG?
Sympathetic PV Generation Tripping

Examples of Very High PV Penetration
Ota City, Japan: 2 MW PV on single feeder (553 homes, 3.85 kW average PV system)
Lanai , Hawaii: 1.2 MW PV system on 4.5 MW island grid supplied by old diesel generators
High Penetration on Feeder
High Penetration on (Small) System

Examples of Very High Penetration
Ireland: >1 GW wind capacity in 7 GW peak load island system
Penetration level by energy approaching 15%
Instantaneous penetration level reaches 50%
Source: Mark O’Malley

Conclusions
• Penetration Levels– Different definitions for different purposes
• There are no absolute “penetration limits”– Issues boil down to cost and risk
• Technical and process challenges are real– Embracing best practices and change is the key
– Technology and standards need to evolve constructively
– Procedures and policies should keep up!
24Utility/Lab Workshop, Nov. 2010, Tempe, AZ


![Modeling High-Penetration PV for Distribution ......penetration PV at the distribution level (e.g, hosting capacity determinations) [1,2,3]. Likewise, EPRI has also, over the past](https://img.dokumen.tips/doc/110x75/5ebb8c6543b978030f22c9e2/modeling-high-penetration-pv-for-distribution-penetration-pv-at-the-distribution.jpg)