Embed Size (px)
Citation preview
(IJACSA) International Journal of Advanced Computer Science and Applications,
Vol. 8, No. 6, 2017
299 | P a g e
www.ijacsa.thesai.org
Grid Connected PV Plant based on Smart Grid
Control and Monitoring
Ibrahim Benabdallah
Faculty of Sciences of Tunis
Laboratory of Electric and Energetic
Systems
El-Manar University, 10609
Tunis-Tunisia
Abeer Oun
Faculty of Sciences of Tunis
Laboratory of Electric and Energetic
Systems
El-Manar University, 10609
Tunis-Tunisia
Adnène Cherif
Faculty of Sciences of Tunis
Laboratory of Electric and Energetic
Systems
El-Manar University, 10609
Tunis-Tunisia
Abstract—Today, smart grid is considered as an attractive
technology for monitoring and management of grid connected
renewable energy plants due to its flexibility, network
architecture and communication between providers and
consumers. Smart grid has been deployed with renewable energy
resources to be securely connected to the grid. Indeed, this
technology aims to complement the demand for power generation
and distributed storage. For this reason, a system powered by a
photovoltaic (PV) has been chosen as an interesting solution due
to its competitive cost and technical structure. To achieve this
goal, a realistic smart grid configuration design is presented and
evaluated using a radial infrastructure. Three-voltage models are
used to demonstrate the grid design. Smart Meters are included
via a SCADA to acquire and monitor the electrical signal
characteristics during the day and to evaluate it through a
statistical report. An operational data center (ODC) is used to
collect the SMs statistical report and to review the demand-offer
(DO) powers balance. The obtained results with Matlab/Simulink
are validated by the famous ETAP software.
Keywords—Distributed generation systems (DGS); smart grid
(SG); smart meters (SM); photovoltaic systems (PVS)
I. INTRODUCTION
The integration of renewable energy sources, such as photovoltaic systems (PVS) into the electrical power grid (either low or medium voltage) throws up several technical troubles like instability, energy quality degradation, signal parameter fluctuation (current, voltage and frequency) and the renowned phenomenon of mismatch between load supply and demand. The economic problem of PV integration is the high installation cost due to lower PV penetration rate of these decentralized power stations. Indeed, electricity grids are stable systems contrarily to renewable energy plants (PV and Wind) which are decentralized, unpredictable and their connection to the grid could lead to instability while coupling them. These phenomena limit the integration of renewable energies into conventional grids and harm their sustainability [1]-[2].
This work aims to study these problems and propose some appropriate solutions to optimize production, control connection and stability via flexible smart grid architecture.
That is why it is indispensable to upgrade an ingenious power grid. There is twice, dealing ways to overpass this issue. The first way is the costly extension of transmission
and distribution power systems to congregate overload demand shape. Or else, integrating decentralized renewable energy generators in co-generation seems to be the backing solution. Conversely, from the reviewed literature, earlier studies had proved that with the considerable integration, several drawbacks [3]-[7] concerning reliability of these systems appears to be real boundaries towards their integration.
With the considerable advancement reached in digital communication and IT technologies the concept of smart grid (SG) submerged. Its main concern is creating a communication between the power utility and the grid components throughout smart meters (SM). The main actors of the SG are SM, digital sensors, monitoring and control tools, automated actuators and bidirectional protection devices from production to plug or downstream path. Hence, the traditional grid is modernized into the bidirectional smart grid [8]-[10].
II. RELATED WORKS
Many simulations and modeling works have been conducted based on smart grid backbone structure over the last decade. In general, They discuss smart grid concept and applications, design, sizing and optimal placement of the energy mix, small scale test-bed implementations in order to choose the best strategy to its implementation, voltage stability, overall system integration rate, global losses and many other factors which help economical and technical decision-making [11].
One of the key features of the SG is the demand response dispatch. In this same context a smart grid is conceived by the authors in [12] by performing the smart demand-response dispatching. It implicitly promotes the reliability and sustainability of the power supply and lowering the peak demand. They presented a survey of potentials and benefits when enabling technologies such as energy controllers, smart meters and communication systems with reference to real industrial studies courses.
For example, authors of [13] conducted a systematic review of communication and networking technology architecture for a smart grid. Several technologies are used for the evaluation of the quality of service (QoS), control and management strategies.
(IJACSA) International Journal of Advanced Computer Science and Applications,
Vol. 8, No. 6, 2017
300 | P a g e
www.ijacsa.thesai.org
In [14], a storage application based on renewable energies for green vehicle (P2V) and vehicle-to-grid (V2G) is developed. This study analyzed all service interactions between energy operators and other actors in smart grids such as consumers, distribution and transport.
Other study such as [15] is interested to present the solutions of the connection and the integration of renewable energy sources in the electric grid and their architectures.
In this context, we can note the work of [16] which used a Data Center Networks DCN as an efficient power management of SMART Grids modeled on OPNET 14.5 software. Besides, Data Center Networks (DCNs) cost-effectiveness and implementation challenges are discussed.
In [17] a new platform using SCADA software and XBEE wireless communication based on smart grid is presented. It combines software and hardware simulation. The implemented algorithm performs communication between buses and the ODC via Xbee.
III. METHODOLOGY
In this paper, we present two main novelties in comparison with last cited works. At first, we will present an improved electrical grid model dedicated to any smart grid based on power load profiles estimation which can be integrated with grid connected PV plants and conventional power generation stations. At a second plan, a realistic case study of a 500KW grid connected PV plant is developed. The PV chain is based on steady state modeling of the PVS connected to the MV level by means of the LV/MV transformer to the point of connection (POC).
The paper is divided as: Section VI presents an overview of the overall system design. Section V highlights interactions of the smart grid platform under variable daily climatic changes and sustainable load profiles. In Section IV, a validation using ETAP software is performed. Finally, in the last section conclusions are picked out from the presented work.
IV. GENERAL SYSTEM DESIDN
(a)
(b)
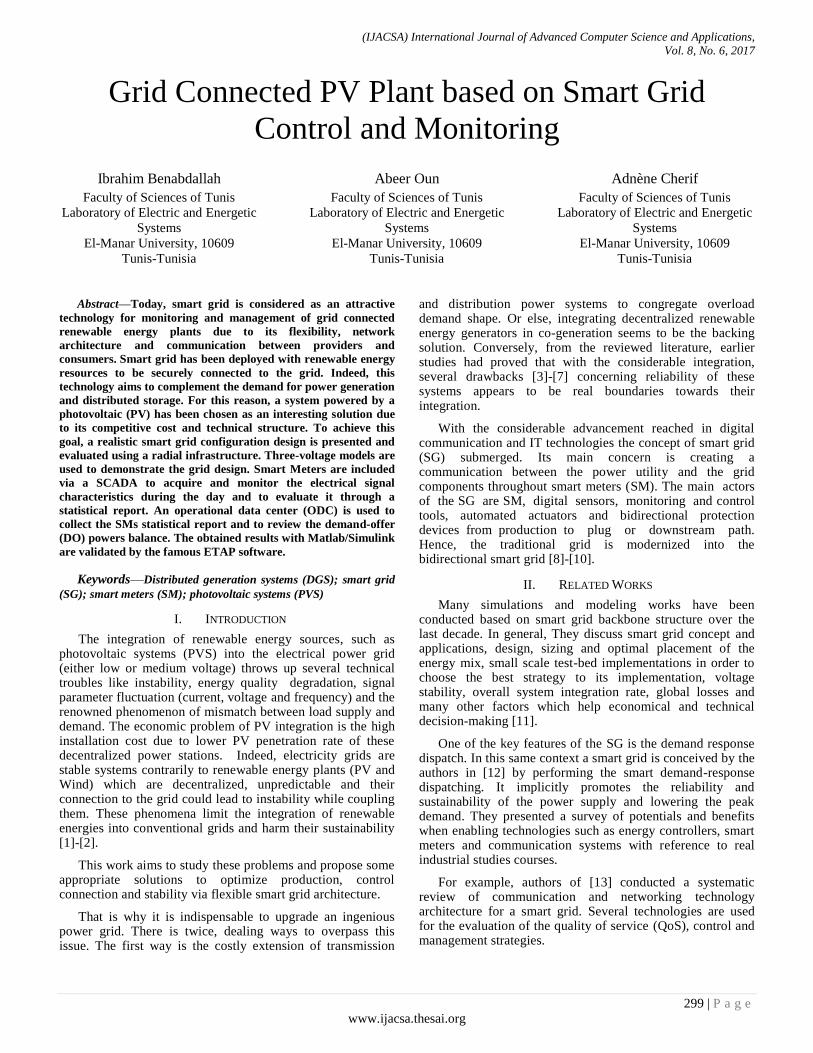
Fig. 1. (a) Overall System design (b) Equivalent one line diagram grid
The grid model described by Fig. 1(a) is composed of a conventional HTB power source delivering 220 KV per-phases and directly deserves ―load 4‖. Then, the voltages are stepping down from 220 KV to 90 KV by transformer 3. The grounding transformer generates neutral wire. ‗‘load 3‖ is the equivalent overall set of loads connected at 90 KV. Transformers 2 raised down the voltage from 90 KV to 30KV where ―load1‖ and ―load 2‖ are connected. The PVG is coupled to the POC throughout the first transformer. The observation and data operation center intercept wireless broadcast SMs information.
A. Traditional power source
A traditional power source produces typically from 35KW (micro turbine) to 400 MW (combined cycle gas) depending on load needs [18]. The power source is modeled as a set of ideal voltage source with internal inductance and resistance connected in (Yg) [19]. The short circuit level parameter leads us to indirectly compute the internal impedance:
2
22 1500 ,f 500 ,
1*
2sc
PS
PS
KV Psc MV VA hz
VL
P f
(1)
Once we evaluate L, R is then calculated fromX
R.
B. Transformers
In every leg of the transformer we have an entrance winding and an output one. Thus, they are in number of 6 winding, two for every leg.
Consequently, we have six resistances modeling joule effect, and six self and mutual inductance modeling inter and intra magnetic effects.
The equation of the transformer model is given by [19], [20]:
(IJACSA) International Journal of Advanced Computer Science and Applications,
Vol. 8, No. 6, 2017
301 | P a g e
www.ijacsa.thesai.org
1
1
21
32
3
1 1
2 2
63 3 3
14 4 4 4
4
5
5
6
6
5 5 5
6 6 6
*
**
*
**
*
* *
*
*
*
j
j
j
j
j
j
j
j
j
j
j
j
j
dI
L dt
dI
L dtV R I
dIV R I
L dtV R I
V R I dI
V R I L dt
V R I dI
L dt
dI
L dt
(2)
With:
iR Windings‘ resistances, i=1..6.
,ii ijL L Are proper and mutual Windings‘ inductances?
i, j =1..6.
The parameters are calculated from the open and short-circuit tests applied to the transformer.
C. Equivalent Load profiles
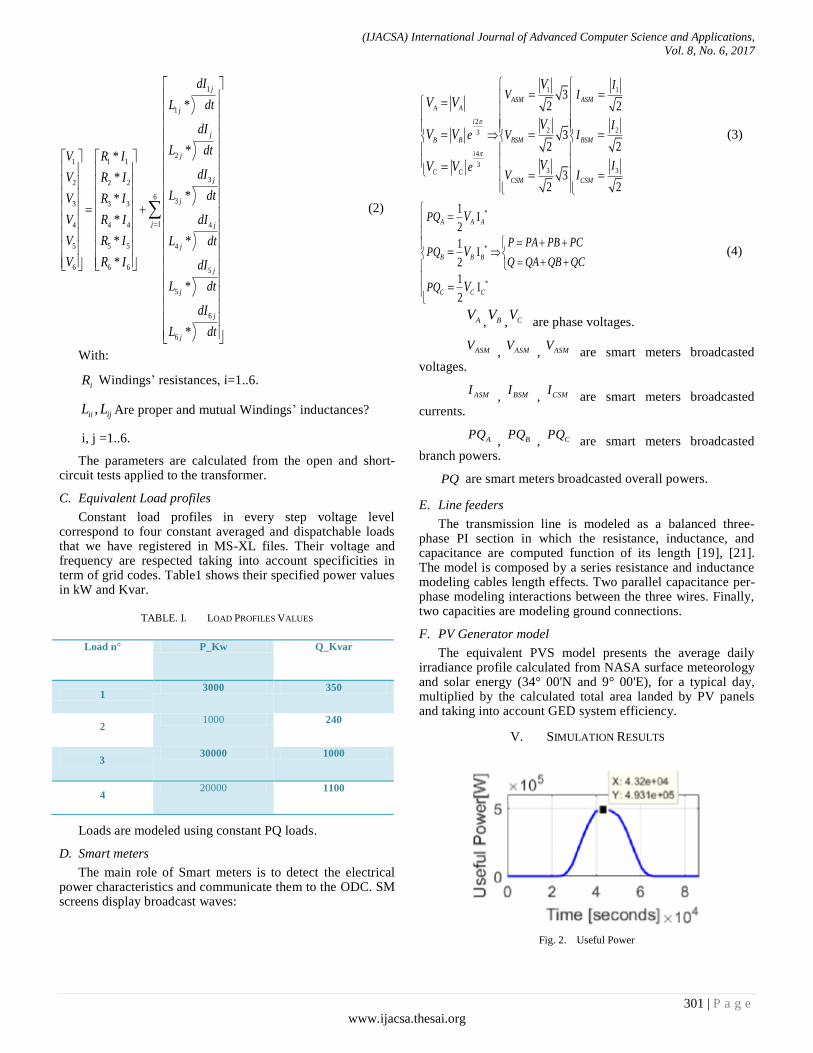
Constant load profiles in every step voltage level correspond to four constant averaged and dispatchable loads that we have registered in MS-XL files. Their voltage and frequency are respected taking into account specificities in term of grid codes. Table1 shows their specified power values in kW and Kvar.
TABLE. I. LOAD PROFILES VALUES
Loads are modeled using constant PQ loads.
D. Smart meters
The main role of Smart meters is to detect the electrical power characteristics and communicate them to the ODC. SM screens display broadcast waves:
1 1
22 23
4
33 3
32 2
32 2
32 2
ASM ASMA A
i
B B BSM BSM
i
C CCSM CSM
IV I
Ie V I
IeV I
V
V V
VV V
VV V
(3)
*
*
*
1I
2
1I
2
1I
2
A A A
B B B
C C C
PQ
P PA PB PCPQ
Q QA QB QC
PQ
V
V
V
(4)
AV, BV
, CV are phase voltages.
ASMV, ASMV
, ASMV are smart meters broadcasted
voltages.
ASMI, BSMI
, CSMI are smart meters broadcasted
currents.
APQ, BPQ
, CPQ are smart meters broadcasted
branch powers.
PQ are smart meters broadcasted overall powers.
E. Line feeders
The transmission line is modeled as a balanced three-phase PI section in which the resistance, inductance, and capacitance are computed function of its length [19], [21]. The model is composed by a series resistance and inductance modeling cables length effects. Two parallel capacitance per-phase modeling interactions between the three wires. Finally, two capacities are modeling ground connections.
F. PV Generator model
The equivalent PVS model presents the average daily irradiance profile calculated from NASA surface meteorology and solar energy (34° 00'N and 9° 00'E), for a typical day, multiplied by the calculated total area landed by PV panels and taking into account GED system efficiency.
V. SIMULATION RESULTS
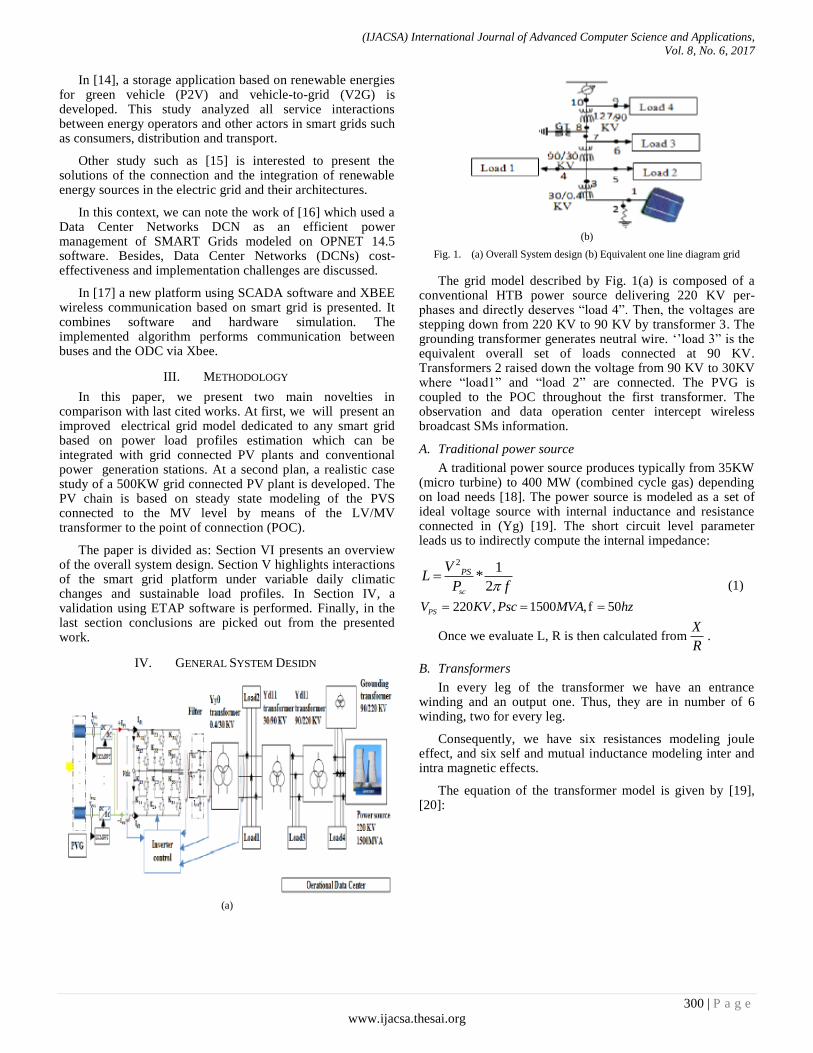
Fig. 2. Useful Power
Load n° P_Kw Q_Kvar
1 3000 350
2 1000 240
3 30000 1000
4 20000 1100
(IJACSA) International Journal of Advanced Computer Science and Applications,
Vol. 8, No. 6, 2017
302 | P a g e
www.ijacsa.thesai.org
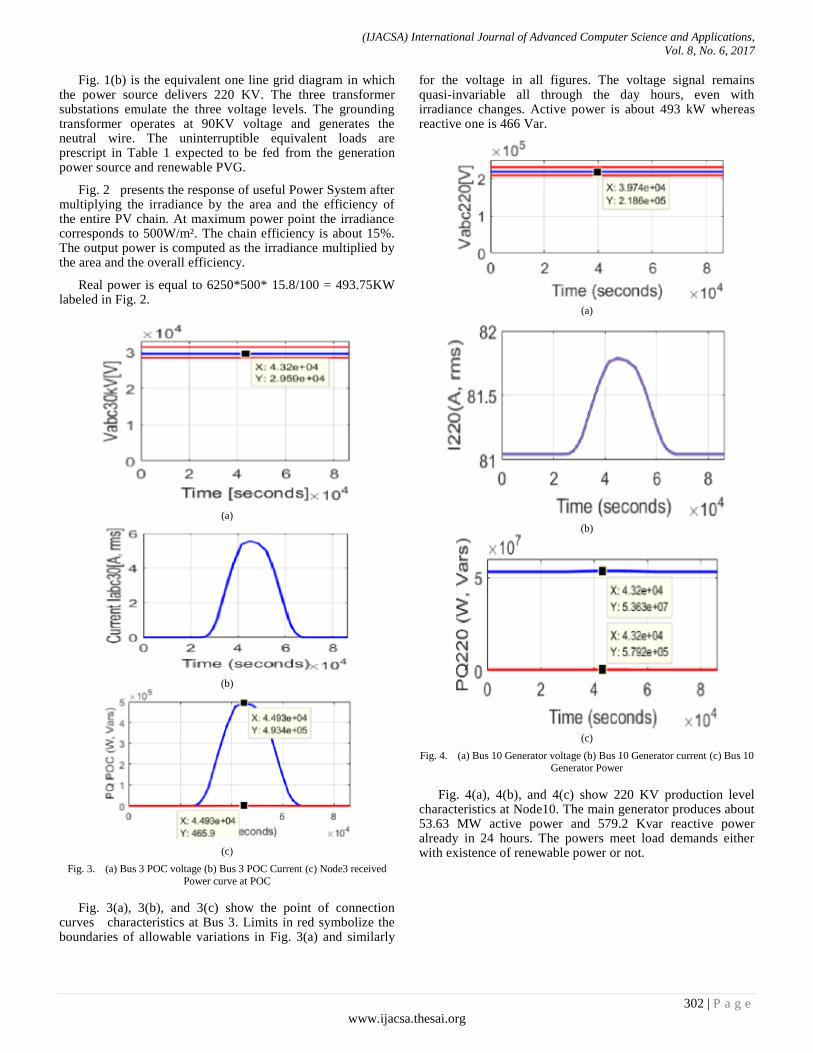
Fig. 1(b) is the equivalent one line grid diagram in which the power source delivers 220 KV. The three transformer substations emulate the three voltage levels. The grounding transformer operates at 90KV voltage and generates the neutral wire. The uninterruptible equivalent loads are prescript in Table 1 expected to be fed from the generation power source and renewable PVG.
Fig. 2 presents the response of useful Power System after multiplying the irradiance by the area and the efficiency of the entire PV chain. At maximum power point the irradiance corresponds to 500W/m². The chain efficiency is about 15%. The output power is computed as the irradiance multiplied by the area and the overall efficiency.
Real power is equal to 6250*500* 15.8/100 = 493.75KW labeled in Fig. 2.
(a)
(b)
(c)
Fig. 3. (a) Bus 3 POC voltage (b) Bus 3 POC Current (c) Node3 received
Power curve at POC
Fig. 3(a), 3(b), and 3(c) show the point of connection curves characteristics at Bus 3. Limits in red symbolize the boundaries of allowable variations in Fig. 3(a) and similarly
for the voltage in all figures. The voltage signal remains quasi-invariable all through the day hours, even with irradiance changes. Active power is about 493 kW whereas reactive one is 466 Var.
(a)
(b)
(c)
Fig. 4. (a) Bus 10 Generator voltage (b) Bus 10 Generator current (c) Bus 10
Generator Power
Fig. 4(a), 4(b), and 4(c) show 220 KV production level characteristics at Node10. The main generator produces about 53.63 MW active power and 579.2 Kvar reactive power already in 24 hours. The powers meet load demands either with existence of renewable power or not.
(IJACSA) International Journal of Advanced Computer Science and Applications,
Vol. 8, No. 6, 2017
303 | P a g e
www.ijacsa.thesai.org
(a)
(b)
(c)
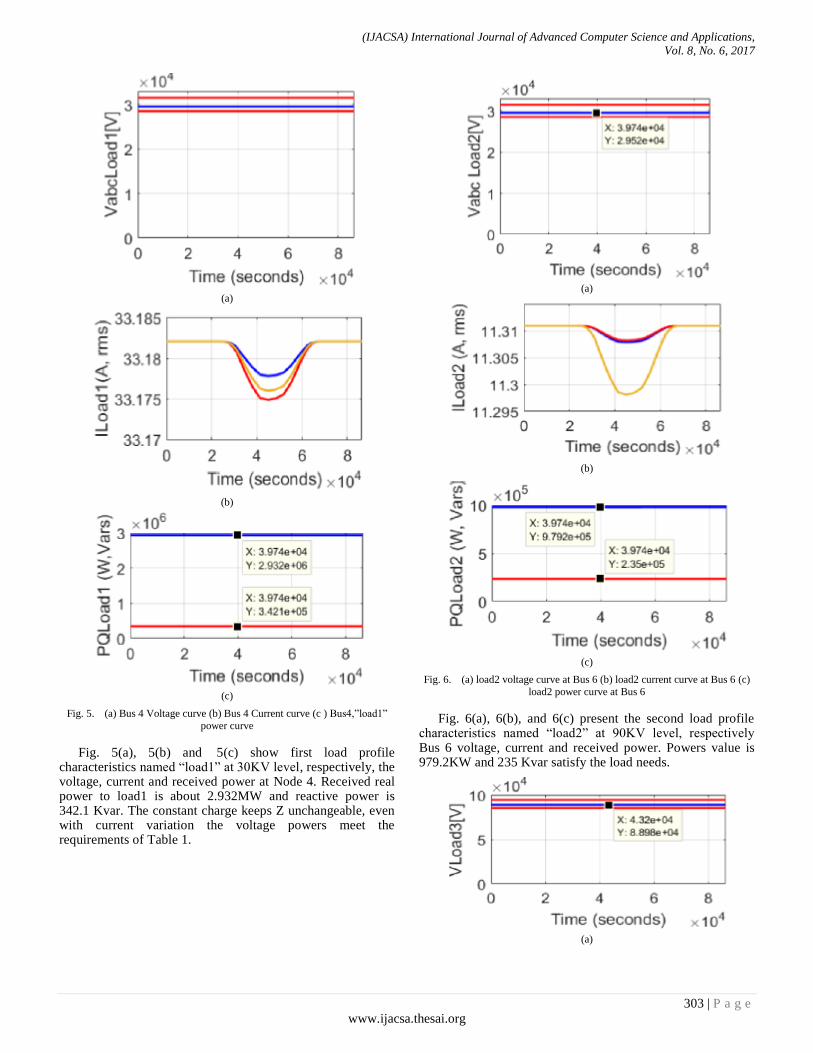
Fig. 5. (a) Bus 4 Voltage curve (b) Bus 4 Current curve (c ) Bus4,‖load1‖
power curve
Fig. 5(a), 5(b) and 5(c) show first load profile characteristics named ―load1‖ at 30KV level, respectively, the voltage, current and received power at Node 4. Received real power to load1 is about 2.932MW and reactive power is 342.1 Kvar. The constant charge keeps Z unchangeable, even with current variation the voltage powers meet the requirements of Table 1.
(a)
(b)
(c)
Fig. 6. (a) load2 voltage curve at Bus 6 (b) load2 current curve at Bus 6 (c)
load2 power curve at Bus 6
Fig. 6(a), 6(b), and 6(c) present the second load profile characteristics named ―load2‖ at 90KV level, respectively Bus 6 voltage, current and received power. Powers value is 979.2KW and 235 Kvar satisfy the load needs.
(a)

(IJACSA) International Journal of Advanced Computer Science and Applications,
Vol. 8, No. 6, 2017
304 | P a g e
www.ijacsa.thesai.org
(b)
(c)
Fig. 7. (a) load3 power curve at Bus 9 (b) load3 current curve at Bus 9 (c)
load3 power curve at Bus 9
Fig. 7(a), 7(b) and 7(c) are the third load profile named ―load3‖ at 220 KV level, Bus9 characteristics. Same as load 2 the consumption demand is guaranteed; powers values 29 MW and 966.5 Kvar.
(a)
(b)
(c)
Fig. 8. (a) load4 voltage curve at Bus 5 (b) load4 current curve at Bus 5 (c)
load4 power curve at Bus 5
Fig. 8(a), 8(b) and 8(c) introduce the fourth load profile characteristics named ―load4‖ at 30KV level, respectively, the voltage, current and received power at Bus5. Received real power for load4 is about 19.75MW and reactive real power is 1.086 MVar. The constant charge keeps PQ unchangeable even with current variation. The voltage changes slightly and remains inside regulatory limits.
The power of the traditional generator and the PV system represents the total production from both sides. Thence coherence of power dispatching with the load needs is maintained and the sustainability of the grid even in high load demands is guaranteed with a minimum of losses.
We have to always find the power equation balance given by:
10 3 4 5 6 9
10 3 4 5 6 9
]
[ ]
[
Bus Bus Bus Bus Bus Bus
Bus Bus Bus Bus Bus BusQ
P P
Q
(5)
To depict the information, digital sensor agents are used. Each agent acts rapidly to send the required data from all smart agent groups. The received data were treated and monitored in the data center. To assess the extracted wave forms and power flows the intelligent actuators and wireless communications are included. These included component deals to detect abnormalities, helps decision-making and self-healing of smart grid.
VI. RESULTS VALIDATION ON ETAP SOFTWARE
Fig. 9 presents the identical grid architecture modeled in MATLAB software aiming to validate the obtained results by comparing the output results pertaining to power flows through the grid then prove the DO response equilibrium.

(IJACSA) International Journal of Advanced Computer Science and Applications,
Vol. 8, No. 6, 2017
305 | P a g e
www.ijacsa.thesai.org
Fig. 9. One line diagram load flow analysis on ETAP
Fig. 9 presents the identical grid architecture modeled in MATLAB software aiming to validate the obtained results by comparing the output results pertaining to power flows through the grid then prove the DO response equilibrium
TABLE. II. COMPARISON OF RESULTS MATLAB VS ETAP
Bus P_MAT. Kw P_ET.Kw Q_MAT.K
var
Q_ET.Kvar
1 493 504 0.6931 0
3 493 503.9 0.466 0
4 2932 3047 342.1 355
5 979.2 1016 235 244
6 29000 30485 966.5 1016
9 19750 20428 1086 1124
10 53630 55062 579.2 4404
The similar outcome results of Table 2 are by a very small margin acquired excluding Bus 10 for the reactive produced powers (579.2-4404 Kvar), which correspond to the transformers and cable losses (of different models), are less in Matlab simulation case. DO equilibrium has been proved and results have been drawn in Fig. 10.
Fig. 10. DO equilibrium.
VII. CONCLUSIONS
In this paper, we have proposed an accurate distribution
system based on smart grid technology. The presented system
was treated and discussed in detail under various climatic
conditions. Several assumptions were assessed and explained
throughout the smart meter data.
To supervise and manage the required energy demand and
the energy supply, an accurate platform was proposed. The
proposed platform aimed to collect and treat the information
according to smart meters.
Moreover, obtained results presented in the above section
prove the reliability and sustainability of our proposed
design.
The future works are aimed at implementing our accurate
model in an embedded system using a Raspberry PI
prototype.
REFERENCES
[1] Xi Fang, Satyajayant Misra, Guoliang Xue, Dejun Yang, ―The New and Improved Power Grid: A Survey‖, IEEE Communications Surveys & Tutorials, Vol. 14, No. 4, pp. 944-980, 2012.
[2] Wided Medjroubia, Ulf Philipp Müllerb, Malte Scharfb, Carsten Matkea, David Kleinhansa, ―Open Data in Power Grid Modelling: New Approaches Towards Transparent Grid Models‖, Elseiver Energy Reports, Vol.3, pp. 14-21, November 2017.
[3] Hany E. Farag ,E.F. El-Saadany,Ramadan El Shatshat,Aboelsood Zidan, ―A generalized power flow analysis for distributed systems with high penetration of distributed generation‖, Elseiver, Electric Power Systems Research, Volume 81, Issue 7, pp.1499-1506, July 2011.
[4] Abbas Azarpour, Suardi Suhaimi, Gholamreza Zahed, Alireza Bahadori, ―A Review on the Drawbacks of Renewable Energy as a Promising Energy Source of the Future‖, IEEE power & energy magazine, Vol. 38, Issue 2, pp 317–328, February 2013.
[5] Jan von Appen, Martin Braun, Thomas Stetz,Konrad Diwold and Dominik Geibel, ―The Challenge of High PV Penetration in the German
(IJACSA) International Journal of Advanced Computer Science and Applications,
Vol. 8, No. 6, 2017
306 | P a g e
www.ijacsa.thesai.org
Electric Grid‖, IEEE Power and Energy Magazine,Vol. 11 Issue: 2, pp. 55-64, 2013.
[6] Rakibuzzaman Shah, N. Mithulananthan, R.C. Bansal, V.K. Ramachandaramurthy, ―A review of key power system stability challenges for large-scale PV integration‖, ELSEVIER, Renewable and Sustainable Energy Reviews, vol. 41, issue C, pp. 1423-1436, 2015.
[7] J. Arrinda, J. A. Barrena, M. A. Rodríguez, A. Guerrero, ―Analysis of massive integration of renewable power plants under new regulatory frameworks‖, IEEE International Conference on Renewable Energy Research and Application (ICRERA), Octobre 2015.
[8] Steve G. Hauser, Kelly Crandall, ―Chapter 1 – Smart Grid is a Lot More than Just ―Technology‖, Sience Direct, Smart Grid, Integrating Renewable, Distributed & Efficient Energy, pp. 3–28, November 2012 .
[9] Jayavardhana Gubbi, Rajkumar Buyya, Slaven Marusic, Marimuthu Palaniswami, ―Internet of Things (IoT): A vision, architectural elements, and future directions‖, Elseiver, Future Generation Computer Systems, Vol.29, Issue 7, pp. 1645-16602013, September 2013.
[10] Smita Mahindrakar, Ravi K. Biradar, ―Internet of Things: Smart Home Automation System using Raspberry Pi‖, International Journal of Science and Research (IJSR), Vol. 6, Issue 1, pp. 901-905, January 2017.
[11] N. Phuangpornpitak, S. Tia, ―Opportunities and Challenges of Integrating Renewable Energy in Smart Grid System‖, Elseiver Energy Procedia, Vol.34, pp. 282-290, 2013.
[12] Pierluigi Siano, ―Demand response and smart grids—A survey‖, Elsevier, Renewable and Sustainable energy Reviews, Vol. 30, pp. 461-478, February 2014.
[13] Jingcheng Gaoa, Yang Xiao,Jing Liua,Wei Liangb,C.L. Philip Chenc, ―A survey of communication/networking in Smart Grids‖, Elsevier, Future Generation Computer Systems, Vol.28, Issue 2, pp. 391-404, February 2012.
[14] Junjie Hu, Hugo Morais, Tiago Sousa,Morten Lind, ―Electric vehicle fleet management in smart grids: A review of services, optimization and control aspects‖, Elsevier, Renewable and Sustainable Energy Reviews, Volume 56, pp. 1207-1226 , April 2016.
[15] Y. V. Pavan Kumara, Ravikumar Bhimasingua, ―Key Aspects of Smart Grid Design for Distribution System Automation: Architecture and Responsibilities‖, Elsevier, SMART GRID Technologies, Vol. 21, pp. 352-3592015, 2015.
[16] Okafor Kennedy .C, Udeze Chidiebele. C, E. C. N. Okafor, C. C. Okezie, ―Smart Grids: A New Framework for Efficient Power Management in Datacenter Networks‖, (IJACSA) International Journal of Advanced Computer Science and Applications, Vol. 3, No. 7, 2012.
[17] Aryuanto Soetedjo, Abraham Lomi, Yusuf Ismail Nakhoda, ―Smart Grid Testbed using SCADA Software and Xbee Wireless Communication‖, (IJACSA) International Journal of Advanced Computer Science and Applications, Vol. 6, No. 8, 2015.
[18] Thomas Ackermann, Go¨ran Andersson, Lennart Soder, ―Distributed Generation: a definition‖, Electric Power Systems Research, Vol. 57 pp. 195–204, 2001.
[19] Ben Abdallah, I., Jraidi, M., Hamrouni, N., Cherif A., ―Modeling, Control and Simulation of a grid connected PV system‖, IEEE 2014 International Conference on Electrical Sciences and Technologies in Maghreb (CISTEM), April2015.
[20] Mamdouh Abdel-Akher, Karar Mahmoud, ―Implementation of three-phase transformer model in radial load-flow analysis‖, Elseiver, Ain Shams Engineering Journal, Vol.4, Issue 1, pp. 65-73, March 2013.
[21] Semlyen, A and Deri, A, ―Time domain modeling of frequency dependent three- phase transmission line impedance‖, IEEE Transactions on Power Apparatus and Systems,Vol. 104(6), pp.1549 – 1555, July 1985.