Embed Size (px)
Citation preview

1
Gresham Mining Services Quarterly
Chris Branston
We are pleased to present Edition 16 of the Gresham Mining Services Quarterly (GMSQ), a snapshot of the performance, news and trends across the resources (including oil & gas) services sector.
The Gresham Mining Services Index (GMSI) increased by 15.9% during the March 2016 quarter, the largest improvement since the September 2013 quarter. The positive start to 2016 was driven by the strong performance of the larger companies, particularly CIMIC, which recorded a 43% share price increase. Small companies generally continued to struggle, with 12 of the 18 sub-$50m market capitalisation businesses subject to share price falls during the period.
For companies that performed well, we believe there have been two main contributing factors:
1. A modest increase in commodity prices. Iron ore, oil and base metals have bounced from their lows in December/January, and the gold price continued to be strong with global uncertainty. There has also been some capital raising activity by gold juniors, providing hope for additional spending and new projects.
2. The first half reporting season showed that while mining services earnings were generally lower than 1H FY15, there are some signs that conditions are stabilising and the restructuring activities of 2014-2015 are starting to yield benefits. This was most evident for mining contractors, with results for Ausdrill, Macmahon, NRW, and Mineral Resources well received.
Earnings multiples ticked up on average, reflecting the share price increases. While equity values improved (off a low base), the consensus view is that the challenging environment will continue for some time, with fewer available construction contracts and fierce competition for production services.
Balance sheets are generally in reasonable shape, but a number of the more highly geared companies are pursuing strategies to reduce debt. For those companies with cash, the focus in 2016 has been more on capital management than M&A (7 companies are currently undertaking on-market buybacks). However, we expect to see some further consolidation as companies seek additional cost savings through merger synergies.
In this edition’s Quarterly Focus, we look at a few examples of what ASX-listed services companies are doing on the technology and innovation front. With the automation trend being driven by the major miners and their global equipment suppliers, developing themes amongst service providers include use of wireless technology, real time analytics and energy efficiency. This trend will continue as the industry’s focus starts to turn from cost and capex cutting to improving productivity.
Editorial Team
Gresham Advisory Partners Ltd is a leading Australian mergers and acquisitions/corporate advisory business and one of Australia’s largest and highest ranking independent corporate advisors.
Edition 16
April 2016
(1) The Gresham Mining Services Index is a market capitalisation weighted index comprising 50 mining services companies selected by Gresham at the date of this report. Brad Hancock
Tom Waddell

2
Share Price Movements
GRESHAM MINING SERVICES INDEX CONSTITUENTS (DEC15 – MAR 16)
LEADERS & LAGGERS (SHARE PRICE) (DEC15 – MAR 16)
PERFORMANCE OVER TIME
PERFORMANCE RELATIVE TO S&P 200 INDICES (DEC15 – MAR 16)
Source: FactSet, IRESS.
2
Ranks
Mar Dec 31 Mar 16 31 Dec 15
1 1 CIMIC Group Ltd. (ASX:CIM) 11,460 8,226 43%
2 2 Orica Ltd. (ASX:ORI) 5,740 5,788 -1%
3 3 ALS Ltd. (ASX:ALQ) 2,012 1,901 6%
4 4 Downer EDI Ltd. (ASX:DOW) 1,637 1,551 7%
5 5 WorleyParsons Ltd. (ASX:WOR) 1,319 1,135 16%
6 6 Mineral Resources Ltd. (ASX:MIN) 1,123 753 50%
7 9 Monadelphous Group Ltd. (ASX:MND) 666 614 8%
8 7 Broadspectrum Ltd. (ASX:BRS) 607 717 -15%
9 10 UGL Ltd. (ASX:UGL) 518 405 28%
10 11 Tox Free Solutions Ltd. (ASX:TOX) 434 376 9%
11 8 Programmed Maintenance Services Ltd. (ASX:PRG) 369 616 -40%
12 13 Cardno Ltd. (ASX:CDD) 277 287 -3%
13 15 MACA Ltd. (ASX:MLD) 211 170 24%
14 12 RCR Tomlinson Ltd. (ASX:RCR) 193 307 -37%
15 16 Pacific Energy Ltd. (ASX:PEA) 155 146 6%
16 24 Ausdrill Ltd. (ASX:ASL) 151 80 90%
17 20 MMA Offshore Ltd. (ASX:MRM) 145 95 53%
18 17 GR Engineering Services Ltd. (ASX:GNG) 140 119 17%
19 18 Macmahon Holdings Ltd. (ASX:MAH) 135 109 26%
20 14 Decmil Group Ltd. (ASX:DCG) 131 178 -26%
21 23 Bradken Ltd. (ASX:BKN) 103 83 25%
22 19 Global Construction Services Ltd. (ASX:GCS) 94 99 -5%
23 25 Neptune Marine Services Ltd. (ASX:NMS) 84 77 10%
24 28 Boart Longyear Ltd. (ASX:BLY) 83 57 46%
25 21 AJ Lucas Group Ltd. (ASX:AJL) 81 94 -34%
26 26 Fleetwood Corp. Ltd. (ASX:FWD) 77 76 1%
27 29 Southern Cross Electrical Engineering Ltd. (ASX:SXE) 72 57 26%
28 22 RungePincockMinarco Ltd. (ASX:RUL) 69 83 -14%
29 47 NRW Holdings Ltd. (ASX:NWH) 60 24 150%
30 27 Alliance Aviation Services Ltd. (ASX:AQZ) 54 60 -10%
31 31 Lycopodium Ltd. (ASX:LYL) 54 48 11%
32 30 Imdex Ltd. (ASX:IMD) 53 50 8%
33 32 SRG Ltd. (ASX:STS) 47 48 -2%
34 34 OTOC Ltd. (ASX:OTC) 45 46 -3%
35 38 Ausenco Ltd. (ASX:AAX) 45 41 9%
36 33 Saunders International Ltd. (ASX:SND) 43 46 -9%
37 36 Boom Logistics Ltd. (ASX:BOL) 37 44 -16%
38 48 Tempo Australia Ltd. (ASX:TPP) 36 23 54%
39 43 Swick Mining Services Ltd. (ASX:SWK) 36 27 32%
40 37 Matrix Composites & Engineering Ltd. (ASX:MCE) 31 42 -26%
41 35 LogiCamms Ltd. (ASX:LCM) 30 44 -33%
42 40 Mitchell Services Ltd. (ASX:MSV) 26 28 -10%
43 44 Austin Engineering Ltd. (ASX:ANG) 25 27 -9%
44 51 Hughes Drilling Ltd. (ASX:HDX) 23 19 22%
45 45 Brierty Ltd. (ASX:BYL) 23 25 -10%
46 49 VDM Group Ltd. (ASX:VMG) 22 19 -
47 41 XRF Scientific Ltd. (ASX:XRF) 21 27 -22%
48 39 Onterran Ltd. (ASX:OTR) 18 30 -40%
49 46 Emeco Holdings Ltd. (ASX:EHL) 17 25 -29%
50 52 McAleese Ltd. (ASX:MCS) 16 14 16%
Market Cap (A$m) Share
price chg
%
Company
-4%-4%
16%
5%5%5%3%2%
0%-2%-3%-3%-4%
-6%-11%
All
Ord
inar
ies
S&P
/ASX
20
0
GM
SI
A-R
EIT
Indu
stri
als
Uti
litie
s
Mat
eria
ls
Res
ou
rces
Con
s. D
isc.
Hea
lth
Car
e
Ener
gy
Telc
o S
ervi
ces
Con
s. S
tapl
esIT
Fina
ncia
l-x-A
-RE
IT
20
40
60
80
100
120
Mar13 Sep13 Mar14 Sep14 Mar15 Sep15 Mar16
Gresham Mining Services Index (GMSI)
S&P/ASX 200
S&P/ASX 200 Resources
GMSI (excl. top 5)
150%
90%
54% 53% 50%
-33% -33% -37% -40% -40%
NR
W
Au
sdri
ll
Tem
po
MM
A O
ffsh
ore
Min
eral
Res
ou
rces
Logi
Cam
ms
AJ
Luca
s
RC
R T
om
linso
n
Pro
gram
me
d
On
terr
an
Leaders Laggers

3
Large Cap (>$1bn) Mid Cap (between $200m and $1bn) Small Cap (<$200m)
Notes: (1) Share price reaction based on closing price on the first full trade day post results announcement and closing price on the last trade day prior to announcement. Source: FactSet, Company announcements.
1H FY16 Results Wrap
Median sector revenue fell during 1H FY16, with only 15 companies recording revenue growth over the prior corresponding period. The trend for EBITDA was similar, with median margins falling slightly relative to 1H FY15. Share price reactions to the first half results were mixed. The results of a number of mining contractors (eg NRW, Ausdrill, Mineral Resources and Macmahon) were well received.
REPORTED REVENUE GROWTH (1H16 VS 1H15)
REPORTED EBITDA GROWTH (1H16 VS 1H15)
3
SHARE PRICE REACTION (1 DAY PRIOR)
CHANGE IN EBITDA MARGINS (1H16 VS 1H15)
(30%)
(20%)
(10%)
0%
10%
20%
30%
NW
H
ASL
VM
G
MIN
MSV
UG
L
OTC
CIM
DO
W
BR
S
MA
H
TOX
SWK
BO
L
MN
D
LYL
TPP
OR
I
AJL
CD
D
ALQ
GC
S
NM
S
SXE
RU
L
AQ
Z
IMD
HD
X
OTR
EHL
MC
S
STS
PEA
FWD
SND
AN
G
MR
M
BYL
PR
G
MC
E
GN
G
BLY
XR
F
BK
N
WO
R
AA
X
DC
G
MLD
RC
R
LCM
v
(100%)
(80%)
(60%)
(40%)
(20%)
0%
20%
40%
60%
OTR TP
P
OTC
MSV
MIN
GN
G
GC
S
ASL
PEA
IMD
FWD
SWK
LYL
ALQ
CD
D
PR
G
OR
I
TOX
EHL
BR
S
DO
W
UG
L
SXE
NM
S
WO
R
AN
G
BYL
BLY ST
S
XR
F
AQ
Z
RU
L
RC
R
LCM
SND
HD
X
BK
N
MC
E
MC
S
CIM
AA
X
AJL
BO
L
MN
D
MR
M
MLD
MA
H
DC
G
NW
H
VM
G
v
Median: -6%
(100%)
(80%)
(60%)
(40%)
(20%)
0%
20%
40%
60%
OTC
NW
H
AN
G
EHL
AJL
PEA BR
S
TOX
GN
G
ASL
SWK
GC
S
ALQ
UG
L
MIN
CIM
NM
S
PR
G
DO
W
BYL ST
S
LYL
OR
I
HD
X
BK
N
AQ
Z
SXE
MN
D
RC
R
XR
F
BO
L
WO
R
SND
MC
E
MLD
MR
M
IMD
CD
D
FWD
MA
H
DC
G
BLY
RU
L
AA
X
v
Median: -13%
(10%)
(8%)
(6%)
(4%)
(2%)
0%
2%
4%
6%
8%
10%
NW
H
OTC AJL
EHL
AN
G
PEA
TOX
CIM
HD
X
BR
S
UG
L
NM
S
ALQ
SWK
BK
N
PR
G
ASL
STS
BYL
DO
W
MN
D
LYL
MA
H
SXE
GN
G
RC
R
BO
L
WO
R
AQ
Z
OR
I
GC
S
BLY
RU
L
MLD
DC
G
MIN
MC
E
SND
MR
M
CD
D
XR
F
FWD
IMD
v
Median: -0.6%
4
Forecast Profitability & Gearing
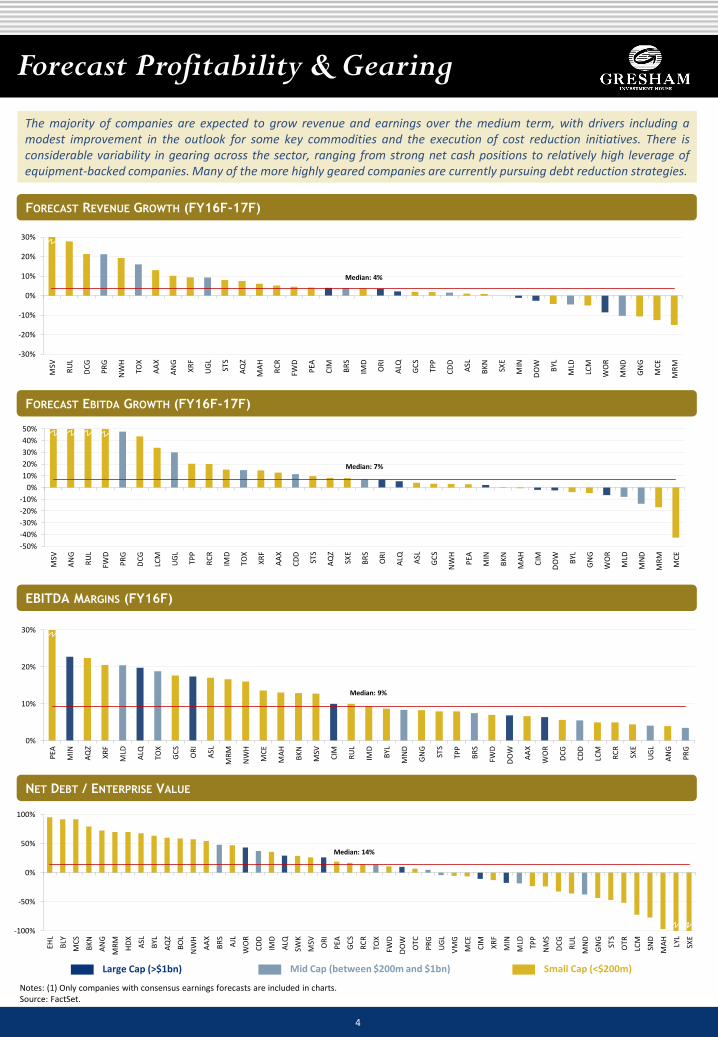
The majority of companies are expected to grow revenue and earnings over the medium term, with drivers including a modest improvement in the outlook for some key commodities and the execution of cost reduction initiatives. There is considerable variability in gearing across the sector, ranging from strong net cash positions to relatively high leverage of equipment-backed companies. Many of the more highly geared companies are currently pursuing debt reduction strategies.
4
FORECAST REVENUE GROWTH (FY16F-17F)
FORECAST EBITDA GROWTH (FY16F-17F)
Large Cap (>$1bn) Mid Cap (between $200m and $1bn) Small Cap (<$200m)
Notes: (1) Only companies with consensus earnings forecasts are included in charts. Source: FactSet.
EBITDA MARGINS (FY16F)
NET DEBT / ENTERPRISE VALUE
0%
10%
20%
30%
PEA
MIN
AQ
Z
XR
F
MLD
ALQ
TOX
GC
S
OR
I
ASL
MR
M
NW
H
MC
E
MA
H
BK
N
MSV
CIM
RU
L
IMD
BYL
MN
D
GN
G
STS
TPP
BR
S
FWD
DO
W
AA
X
WO
R
DC
G
CD
D
LCM
RC
R
SXE
UG
L
AN
G
PR
GMedian: 9%
-100%
-50%
0%
50%
100%
EHL
BLY
MC
S
BK
N
AN
G
MR
M
HD
X
ASL
BYL
AQ
Z
BO
L
NW
H
AA
X
BR
S
AJL
WO
R
CD
D
IMD
ALQ
SWK
MSV OR
I
PEA
GC
S
RC
R
TOX
FWD
DO
W
OTC
PR
G
UG
L
VM
G
MC
E
CIM XR
F
MIN
MLD
TPP
NM
S
DC
G
RU
L
MN
D
GN
G
STS
OTR
LCM
SND
MA
H
LYL
SXE
Median: 14%
-30%
-20%
-10%
0%
10%
20%
30%
MSV
RU
L
DC
G
PR
G
NW
H
TOX
AA
X
AN
G
XR
F
UG
L
STS
AQ
Z
MA
H
RC
R
FWD
PEA
CIM BR
S
IMD
OR
I
ALQ
GC
S
TPP
CD
D
ASL
BK
N
SXE
MIN
DO
W
BYL
MLD
LCM
WO
R
MN
D
GN
G
MC
E
MR
M
Median: 4%
-50%
-40%
-30%
-20%
-10%
0%
10%
20%
30%
40%
50%
MSV
AN
G
RU
L
FWD
PR
G
DC
G
LCM
UG
L
TPP
RC
R
IMD
TOX
XR
F
AA
X
CD
D
STS
AQ
Z
SXE
BR
S
OR
I
ALQ ASL
GC
S
NW
H
PEA
MIN
BK
N
MA
H
CIM
DO
W
BYL
GN
G
WO
R
MLD
MN
D
MR
M
MC
E
Median: 7%

5 Notes: (1) Only companies with consensus earnings forecasts are included in charts; (2) Share prices are as at 31 Mar 2016; (3) Earnings multiples are not calendarised; (4) Companies exhibiting negative multiples have been excluded from the above analysis. Source: FactSet.
Valuation Multiples
PE multiples are currently sitting slightly above the long term median, and have generally trended up since the September 2015 quarter. This has been driven by a combination of recent share price improvements and continued resetting of analyst earnings expectations.
1 YEAR FORWARD PRICE EARNINGS RATIO OVER TIME
PRICE EARNINGS RATIO (FY16F)
5
Large Cap (>$1bn) Mid Cap (between $200m and $1bn) Small Cap (<$200m)
DIVIDEND YIELD (FY16F)
2x
4x
6x
8x
10x
12x
14x
16x
18x
Mar 08 Sep 08 Mar 09 Sep 09 Mar 10 Sep 10 Mar 11 Sep 11 Mar 12 Sep 12 Mar 13 Sep 13 Mar 14 Sep 14 Mar 15 Sep 15 Mar 16
Gresham Mining Services PER
All Ordinaries Index PER
Gresham Mining Services Median
Gresham Mining Services Median: 9.3x
-
5x
10x
15x
20x
25x
AA
X
MSV
CIM
ALQ
TOX
CD
D
SXE
DC
G
MC
E
OR
I
UG
L
MIN
PEA
RU
L
DO
W
PR
G
LCM
MN
D
RC
R
STS
WO
R
GN
G
ASL
XR
F
NW
H
BR
S
GC
S
MLD
TPP
BK
N
AQ
Z
BYL
Median: 9.9x
0%
2%
4%
6%
8%
10%
12%
14%
HD
X
GC
S
GN
G
MLD
MN
D
PR
G
SXE
DO
W
PEA OR
I
AQ
Z
STS
DC
G
MIN
ALQ
TOX
BR
S
CIM
FWD
XR
F
RC
R
ASL
Median: 5.5%
1-yr fwd median as at: Mar 15: 9.1x (FY15) Jun 15: 9.5x (FY16) Sep 15: 9.2x (FY16) Dec 15: 9.5x (FY16)
1-yr fwd median as at: Mar 15: 5.8% (FY15) Jun 15: 6.0% (FY16) Sep 15: 6.7% (FY16) Dec 15: 6.8% (FY16)

6
Notes: (1) Only companies with consensus earnings forecasts are included in charts; (2) Share prices are as at 31 Mar 2016; (3) Earnings multiples are not calendarised; (4) Enterprise Value is based on market capitalisation plus minority interests and last reported net debt adjusted for capital raisings and acquisitions. (5) Companies exhibiting negative multiples have been excluded from the above analysis. Source: FactSet.
Valuation Multiples
Forecast EBIT and EBITDA multiples have also edged upwards, currently sitting at 7.3x and 4.6x respectively. A significant number of companies continue to trade below reported NTA.
EV/EBIT (FY16F)
EV/EBITDA (FY16F)
6
Large Cap (>$1bn) Mid Cap (between $200m and $1bn) Small Cap (<$200m)
PRICE/NTA
-
5x
10x
15x
20x
MA
H
MSV
ALQ
IMD
CD
D
AA
X
CIM
TOX
OR
I
RU
L
ASL
BK
N
DC
G
PEA
WO
R
MC
E
MIN
RC
R
UG
L
DO
W
NW
H
AQ
Z
BR
S
PR
G
XR
F
LCM
MN
D
GC
S
SXE
GN
G
STS
TPP
BYL
MLD
Median: 7.3x
v
-
2x
4x
6x
8x
10x
ALQ
AN
G
MSV OR
I
CIM
CD
D
TOX
RU
L
WO
R
MR
M
AA
X
PEA
UG
L
DC
G
IMD
BK
N
PR
G
GN
G
XR
F
RC
R
TPP
MN
D
BR
S
FWD
MIN
DO
W
ASL
GC
S
AQ
Z
LCM
NW
H
SXE
BYL ST
S
MA
H
MC
E
MLD
Median: 4.6x
v
0%
100%
200%
300%
400%
AA
X
VM
G
UG
L
OR
I
TOX
CD
D
TPP
CIM
GN
G
OTR
OTC
PR
G
SND
RU
L
BR
S
MN
D
DO
W
RC
R
LCM
PEA XR
F
MSV AJL
NM
S
MIN LY
L
SXE
MLD ST
S
DC
G
MA
H
GC
S
FWD
IMD
BK
N
AQ
Z
NW
H
SWK
MC
S
BYL
AN
G
HD
X
ASL
MC
E
BO
L
MR
M
EHL
Median: 112% Companies trading at a discount to NTA
1-yr fwd median as at: Mar 15: 6.7x (FY15) Jun 15: 7.5x (FY16) Sep 15: 6.8x (FY16) Dec 15: 6.2x (FY16)
1-yr fwd median as at: Mar 15: 4.4x (FY15) Jun 15: 4.2x (FY16) Sep 15: 3.9x (FY16) Dec 15: 4.0x (FY16)

7
Contract Awards
7
MAJOR CONTRACT AWARDS
Very few major contracts were awarded in the first quarter. One of the most significant domestic jobs awarded was Maca’s $115m contract to provide open pit mining services at Regis Resources’ Moolart Well Project.
Ausdrill and Ausenco secured offshore work during the period, with the latter awarded preferred contractor status for a $89m EPC contract at Atlantic Gold’s Moose River gold project in Nova Scotia, Canada.
Notes: (1) Contract awarded to African Underground Mining Services, in which Ausdrill holds a 50% interest Source: Company announcements.
Date
Announced Company Client Project/Facility Location Services Value (A$m) Commodity
29 Mar 16 Hughes Drilling Ramelius Resources Mt Magnet WA Grade control drilling n/a Gold
29 Mar 16 Hughes Drilling South32 Boddington WA Blast hole drilling n/a Bauxite
24 Mar 16 Swick Independence Group Jaguar / Nova WA Underground diamond
drilling n/a Nickel
11 Mar 16 Macmahon Moreton Resources South Burnett QLD Mining services n/a Coal
3 Mar 16 GR Engineering Vimy Resources Mulga Rock WA Feasibility Study n/a Uranium
24 Feb 16 Ausenco Atlantic Gold Moose River Canada EPC 89 Gold
24 Feb 16 Pacific Energy Doray Minerals Deflector WA BOO of power station n/a Gold
23 Feb 16 Toxfree BHP Olympic Dam SA Industrial services & total
waste management n/a Copper
17 Feb 16 SCEE SCJV Jimblebar WA E&I services 10 Iron Ore
12 Feb 16 Alliance Aviation Santos Cooper Basin SA Jet transport services n/a O&G
11 Feb 16 GR Engineering Gold Road Gruyere WA Feasibility Study n/a Gold
8 Feb 16 NRW Golding Contractors Isaac Plains QLD Drill and Blast services 40 Coal
4 Feb 16 Mitchell Services South32 Cannington WA Surface / Underground
mining 14 Silver / Lead
28 Jan 16 Ausdrill1 AngloGold Ashanti Geita Gold Mine Tanzania Underground mining US$70 Gold
19 Jan 16 GR Engineering Dacian Gold Mt Magnet WA Feasibility Study n/a Gold
12 Jan 16 Decmil QGC Pty Ltd Various QLD Wellsite installation 35 CSG
7 Jan 16 Ausenco Golding Contractors Isaac Plains QLD Plant operations and
maintenance 15 Coal
7 Jan 16 Ausenco Unknown NSW coal facility NSW Plant upgrade 17 Coal
4 Jan 16 Maca Regis Resources Moolart Well WA Open pit mining 115 Gold

8
Corporate Activity
8
Despite a quiet start to the year for corporate activity, foreign interest in the sector continued. German underground mining and construction company DYWIDAG-Systems acquired Jenmar Australia, whilst French electrical engineering group VINCI Energies acquired J&P Richardson, a Brisbane-based E&I contractor.
A number of companies continue share repurchases, with likely motivators perceived share price weakness and caution around allocating capital to acquisitions.
Date Announced
Status Target Business Target
HQ Seller Acquirer
Value (A$m) Forum
Interest (%)
Cons.
24 Mar 16 Completed Scope Australia EPC (Res / Infra) WA n/a Decmil 1.7 Private 100% Cash
17 Mar 16 Completed DT HiLoad Truck tray manufacturing WA Ausdrill Schlam
Engineering 2.6 Private 100% Cash
11 Feb 16 Completed Sedgman Minerals processing QLD n/a CIMIC 119 Public 100% Cash
8 Feb 16 Completed J&P Richardson Electrical engineering QLD Founders VINCI Energies n/a Private 100% Cash
2 Feb 16 Completed Jenmar Australia Ground control products NSW Jenmar Corp DYWIDAG-
Systems n/a Private 100% Cash
7 Jan 16 Completed Broadsword
Marine Offshore support services WA Programmed
Bhagwan Marine
25 Private 100% Cash
MERGERS & ACQUISITIONS
CAPITAL RAISINGS
Date Announced
Status Company Type Amount Raised
(A$m)
(Discount) / Premium to
Last Price (%) Purpose Underwritten
21 Mar 16 Completed Toxfree Placement / SPP 24 1.9% Acquisition funding Yes
17 Mar 16 Completed AJ Lucas Entitlement Offer 21.1 16% Debt repayment & working
capital Yes
Source: Mergermarket, company announcements.
ACTIVE SHARE BUYBACKS
Date Announced Company Type Size Purpose
14 Dec 15 CIMIC On-market Up to 10% Improve shareholder returns and enhance
capital efficiency
4 Dec 15 RCR Tomlinson On-market Up to 2m shares Capital management
30 Nov 15 Swick On-market Up to 10% Capital management
20 Nov 15 RungePincockMinarco On-market Up to 10% Capital management
19 Nov 15 Mineral Resources On-market Up to 10% Capital management
6 Oct 15 Macmahon On-market Up to 10% Capital management
20 Aug 15 Downer EDI On-market Up to 43m shares Capital management

9 Note: (1) Excludes alternate appointments; (2) Internal appointment. Source: Company announcements.
Executive Movements
EXECUTIVE & DIRECTOR APPOINTMENTS1
Date Announced Company Name Role Date Effective
11 Mar 16 Cardno Robert Prieto NED Not Stated
11 Mar 16 Cardno Gary Jandegian NED Not Stated
9 Mar 16 NRW Michael Arnett2 Chairman 9 Mar 16
29 Feb 16 Onterran Lachlan McIntosh2 Executive Chairman 1 Mar 16
17 Feb 16 Austin Engineering Peter Pursey2 Executive Chairman Not Stated
15 Feb 16 Bradken Paul Zuckerman CEO 1 Mar 16
3 Feb 16 Programmed Lisa Paul NED 3 Feb 16
1 Feb 16 VDM Sam Diep CEO & MD 29 Feb 16
29 Jan 16 Boart Longyear Philip Mackey2 Company Secretary Not Stated
28 Jan 16 Cardno Steven Sherman NED 27 Jan 16
28 Jan 16 Cardno Jeffrey Forbes NED 27 Jan 16
22 Jan 16 CIMIC Louise Griffiths2 Company Secretary Not Stated
13 Jan 16 Lycopodium Steven Chadwick NED Not Stated
9
EXECUTIVE & DIRECTOR RESIGNATIONS / RETIREMENTS
Date Announced Company Name Role Date Effective
31 Mar 16 ALS Nerolie Withnall NED & Chairman 26 July 16
29 Feb 16 Onterran Heather Gardner CEO 29 Feb 16
24 Feb 16 Brierty Alan Brierty NED Not Stated
17 Feb 16 Austin Engineering Michael Buckland CEO & MD 30 Jun 16
1 Feb 16 VDM Dongyi Hua CEO & MD 28 Feb 16
29 Jan 16 Boart Longyear Paul Blewett Company Secretary Not Stated
22 Jan 16 CIMIC John Easy Company Secretary Not Stated

10
Quarterly Focus: Technology & Innovation
10
The world has seen significant technological advancements that have transformed many industries over the last 50 years. However, the hard-rock mining sector has long been regarded as lagging in major innovation. This has been attributed to a number of factors, including:
1. Inherent existing risks in developing new mines (orebody uncertainty, commodity price) making the further risks of new and unproven technologies intolerable;
2. The profits generated during good periods making it hard to justify downtime required to implement new technology; and
3. The information challenges associated with moving and metering non-homogenous solids (as opposed to liquids and gases in the oil and gas sector).(1)
It has been estimated that the mining and metals sector spends 90% less on technology and innovation than the petroleum sector as a ratio of revenue.(2)
But this trend is changing, with the large mining companies and their equipment suppliers investing heavily in research and development, clearly illustrated in remote control centres and autonomous trucks and trains at major projects. Mining services companies are also increasingly playing their part, adopting current technology and new processes to improve safety and productivity. This is likely to become more evident as we enter the next phase of the commodity cycle. Having been through the early stages of the downturn involving cost cutting and capital restrictions, we are now reaching the stage where companies will invest in making tasks and processes more efficient.
Below are a few examples of new technologies currently being marketed by ASX-listed services companies.
Company Current Innovation Initiatives
Orica Orica has developed the world’s first commercial wireless electronic blasting system.
The company notes that the requirement to manage wires and connections in current initiation systems is the last remaining barrier to remotely managing all of the drill and blast cycle. Wireless blasting presents opportunities for “non-entry mining methods, automating the blasting process, improving cycle times, and recovering ore locked in pillars or blocks that would otherwise be stranded”.
Mineral Resources
Mineral Resources is investing in a range of technologies, including:
its Bulk Ore Transportation System (BOTSTM) encompassing an elevated below rail structure, which reduces required earthworks and involves less disturbance to natural landscapes;
carbon fibre structural components which have significant weight saving advantages over steel products; and
LNG and solar power at remote mine sites.
Imdex Imdex has developed cloud-based data collection and analysis software (Reflex Hub). The platform transfers data from the company’s instruments and mobile devices and runs analytics that can be accessed anywhere. This enhances data accuracy and provides real-time or near-real time information to assist in decision making.
Emeco Emeco has developed a fleet management platform called Emeco Operating System (EOS). EOS provides insight down to individual assets, operators or materials and allows clients to measure fleet payload performance, dig rates, operational efficiency and time utilisation detail.
EOS is designed to be a cost effective tool to provide smaller miners with access to information and analysis that helps drive productivity improvements. The system’s first client, junior miner Alkane Resources, has achieved unit cost reductions for the load and haul system of c.20%.
Note: (1) For further discussion, see Andrew Shook, “Innovation in mining”, AUSIMM Bulletin, April 2015; (2) Ernst & Young, “Mining uncovered: The role of innovation in mining”, September 2015.

11
Gresham’s Credentials
LANDMARK MERGERS & ACQUISITIONS
TAKEOVER DEFENCE
STRATEGIC ADVISORY, JOINT VENTURES AND CAPITAL MARKETS
Advised Little World Beverages on its acquisition
by Lion
Advised Magma
Metals in relation to the
unsolicited takeover offer
from Panoramic Resources
Advised David
Jones in relation to acquisition by
Woolworths
Advised LinQ Capital on its acquisition by IMC Resources
Holdings
Advised BHP Billiton on its proposed iron ore production joint venture with Rio Tinto
Introduced
Denham Capital to Trans Tasman
Resources resulting in NZ
iron sands investment
Advised BHP Billiton on the disposal of the Yabulu Nickel
refinery
Advised
Bannerman Resources on its
financing with Resource Capital
Funds
Advised Iluka on its institutional placement and
accelerated rights issue
Advised Boral on its joint venture
with USG Corporation
AWARDS & ACCOLADES
2011 M&A Deal of the Year
SABMiller’s
acquisition of Foster’s Group
2009 Most
Innovative Deal
Babcock & Brown
Infrastructure’s recapitalisation
Secondary Market Equity Raising of
the Year
Wesfarmers’ $2.6bn equity
raising
2007 Best M&A
Deal
Wesfarmers’ acquisition of
Coles
Best M&A Deal
in Australia
Wesfarmers’ acquisition of
Coles
Advised Foster’s on the demerger
of its wine business
2011
Joint lead adviser to Japan Post on the acquisition of
Toll Holdings
2015
2012
Advised Coffey in
relation to acquisition by
Tetra Tech
2014
Advised Clough
in relation to acquisition by
Murray & Roberts
2013 2012
2010 2010 2009 2008 2009/08 2013
2013
Advised Platinum Equity in relation to the acquisition of a 70% stake in
the Sensis directories
business from Telstra
2014
Advised Wesfarmers on the sale of its
underwriting and insurance broking
businesses
2014
Advised Bank of Queensland on
the acquisition of loan portfolio from Investec
2014
Excellence in Corporate
Advisory - 2012
Boutique / Independent
Lead
Independent financial adviser to the Board of BHP Billiton on
the demerger of South32
2015
2015

12
Contact Details
Gresham Advisory Partners Limited ABN 88 093 611 413
Level 17, 167 Macquarie Street
Sydney NSW 2000
Telephone: +61 2 9221 5133
Facsimile: +61 2 9221 6814
Level 39, 120 Collins Street
Melbourne VIC 2000
Telephone: +61 3 9664 0300
Facsimile: +61 3 9650 7722
Level 3, 28 The Esplanade
Perth WA 6000
Telephone: +61 8 9486 7077
Facsimile: +61 8 9486 7024
www.gresham.com.au
Michael Lishman Managing Director, Perth E: [email protected] T: +61 8 9213 0289
Terms and Conditions Information contained in this publication The opinions, advice, recommendations and other information contained in this publication, whether express or implied, are published or made by Gresham Advisory Partners Limited (ABN 88 093 611 413), Australian financial services license (247113), and by its officers and employees (collectively “Gresham Advisory Partners”) in good faith in relation to the facts known to it at the time of preparation. Gresham Advisory Partners has prepared this publication without consideration of the investment objectives, financial situation or particular needs of any individual investor, and you should not rely on the publication for the purpose of making a financial decision. To whom this information is provided This publication is only made available to persons who are wholesale clients within the meaning of section 761G of the Corporations Act 2001. This publication is supplied on the condition that it is not passed on to any person who is a retail client within the meaning of section 761G of the Corporations Act 2001. Disclaimer and limitation of liability To the maximum extent permitted by law, Gresham Advisory Partners will not be liable in any way for any loss or damage suffered by you through use or reliance on this information. Gresham Advisory Partners’ liability for negligence, breach of contract or contravention of any law, which cannot be lawfully excluded, is limited, at Gresham Advisory Partners’ option and to the maximum extent permitted by law, to resupplying this information or any part of it to you, or to paying for the resupply of this information or any part of it to you. No warranties made as to content Gresham Advisory Partners makes no warranty, express or implied, concerning this publication. The publication provided by us on an “AS IS” basis at your sole risk. Gresham Advisory Partners expressly disclaims, to the maximum extent permitted by law, any implied warranty of merchantability or fitness for a particular purpose, including any warranty for the use or the results of the use of the publication with respect to its correctness, quality, accuracy, completeness, or reliability. Copyright Copyright in this publication is owned by Gresham Advisory Partners. You may use the information in this publication for your own personal use, but you must not (without Gresham Advisory Partners’ consent) alter, reproduce or distribute any part of this publication, transmit it to any other person or incorporate the information into any other document. General matters These Terms and Conditions are governed by the law in force in the State of Victoria, and the parties irrevocably submit to the non-exclusive jurisdiction of the courts of Victoria and courts of appeal from them for determining any disputes concerning the Terms and Conditions. If the whole or any part of a provision of these Terms and Conditions are void, unenforceable or illegal in a jurisdiction it is severed for that jurisdiction. The remainder of the Terms and Conditions have full force and effect and the validity or enforceability of that provision in any other jurisdiction is not affected. This clause has no effect if the severance alters the basic nature of the Terms and Conditions or is contrary to public policy. If Gresham Advisory Partners do not act in relation to a breach by you of these Terms and Conditions, this does not waive Gresham Advisory Partners’ right to act with respect to subsequent or similar breaches.
Chris Branston Executive Director, Perth E: [email protected] T: +61 8 9213 0290
Matt Keenan Managing Director, Melbourne E: [email protected] T: +61 3 9664 0353
Charlie Graham Managing Director, Sydney E: [email protected] T: +61 2 9224 0247
Michail Lagogiannis Executive Director, Melbourne E: [email protected] T: +61 3 9664 0375
Neville Spry Managing Director, Sydney E: [email protected] T: +61 2 9224 0237