Embed Size (px)
Citation preview

1
28 February 2017
PRELIMINARY RESULTS FOR THE 52 WEEKS ENDED 31 DECEMBER 2016
Greggs is the leading bakery food-on-the-go retailer in the UK,
with over 1,750 retail outlets throughout the country
A STRONG PERFORMANCE AND FURTHER STRATEGIC PROGRESS
2016 Financial highlights
Total sales up 7.0% to £894.2m (2015: £835.7m)
Company-managed shop like-for-like sales* up 4.2% (2015: 4.7%)
Operating profit excluding property profits** and exceptional items*** up 8.6% to £78.1m (2015: £71.9m)
Pre-tax profit excluding exceptional items*** £80.3m (2015: £73.0m)
Pre-tax profit £75.1m (2015: £73.0m)
Strong cash generation enabling significant, self-funded capital investment to support growth
Total ordinary dividend per share up 8.4% to 31.0p (2015: 28.6p)
* like-for-like sales in Company-managed shops (excluding franchises) with a calendar year’s trading history
** freehold property disposal gains of £2.2m in 2016 (2015: £1.2m)
*** exceptional pre-tax charge of £5.2m in 2016 (2015: £ nil)
Strategic progress
Growing strength in the food-on-the-go market
Further improvements to product range, including extended choice in hot drinks
and hot food
‘Balanced Choice’ range of healthier options now accounts for over 10% of sales
208 shops refurbished – 92% of shop estate now transformed to food-on-the-go
format
145 new shops opened, 79 closures (66 net openings); 1,764 shops trading at 31
December 2016
Investment in upgraded operating systems progressing well – finance system
implemented and shop replenishment successfully trialled
£100m, five-year investment programme in manufacturing and distribution
operations commenced
Current trading
2017 has started in line with our expectations
Company-managed shop like-for-like sales up by 2.0% in 8 weeks to 25 February
2017
Underlying (excluding New Year trading pattern) Company-managed shop like-
for-like sales in weeks 2 to 8 up by 2.9%
2
“In 2016 we delivered another strong performance as we continued on our journey to transform Greggs from a traditional bakery business into a modern, attractive food-on-the-go retailer. Our product offer is evolving to meet the changing needs of our customers and our shop estate and service levels have benefited from significant investment. “The UK consumer outlook is more challenging than we have seen in recent years, with industry-wide pressures emerging in commodities as well as labour costs. However we are confident of making further progress as we implement our plan to grow Greggs as a contemporary food-on-the-go brand.”
- Roger Whiteside, Chief Executive
ENQUIRIES: Greggs plc Roger Whiteside, Chief Executive Richard Hutton, Finance Director Tel: 0191 281 7721
Hudson Sandler Wendy Baker / Alex Brennan/Fern Duncan Tel: 020 7796 4133
An audio webcast of the analysts’ presentation will be available to download later today at http://corporate.greggs.co.uk/
3
Chairman’s statement
Greggs performed strongly in 2016, benefiting from the investments that we have made in recent years and the continued implementation of changes in line with our strategic plan. The food-on-the-go market continues to grow and is highly competitive and fast-moving. This requires us to constantly evolve and develop our offer to customers. Our clear plan and record of delivery is bringing sustainable long-term growth for the benefit of all stakeholders. Overview In 2016 Greggs demonstrated once again its ability to manage a major change agenda whilst delivering a strong trading and financial performance. The Greggs brand is increasingly relevant to consumers in the food-on-the-go market as a result of our investments in the shop estate and the quality of our food and drink offer. We have made notable progress in the overhaul of our processes and systems and this will continue in the year ahead, alongside significant investment to transform our internal supply chain to support further growth in shop numbers and deliver a more efficient business. The Chief Executive’s report provides greater detail on performance in 2016 and progress against our strategic plan. Our people and values Consumers have many options in the food-on-the-go market, and we have to ensure that all aspects of our business support our purpose and strategy. This has required us to make some difficult decisions, particularly regarding the organisation of our manufacturing and logistics operations, which the Board has considered carefully and which are outlined in this report. In all its discussions the Board has been clear to ensure that any changes are implemented with due regard to our values; being open, honest, and treating people with consideration and respect. These values are also reflected in our approach to conducting business responsibly. We have made further improvements to our already strong reputation in areas such as environmental management, animal welfare and support for the communities where we trade. Acting responsibly and conducting business in a sustainable manner by looking after the interests of all stakeholders is ultimately in the best interests of shareholders. I would like to thank everyone who has worked for Greggs during the past year and contributed to such a strong performance on so many levels. Their commitment to delivering outstanding service and value to our customers every day was clearly reflected in customer satisfaction and sales in 2016. The Board The composition of the Board was unchanged in 2016. Much of our time has been spent overseeing the major programmes of change that support the Company’s strategic plan, particularly the significant investment under way to grow our internal supply chain. We also continued to focus on the development of our people and our understanding of the needs of customers. Directors continue to be encouraged to get out into the business, sample our products and talk with colleagues and customers. In doing so we ensure that Non-Executive Directors’ contributions to Board discussions are well informed, supporting open and constructive dialogue with the management team.

4
The Board oversees the allocation of resources for the business and this includes the level of investment in its operations, taking account of shareholder returns as well as a fair reward to staff, responsible funding of pension obligations and equitable treatment of suppliers. The business is highly cash-generative and continues to operate without external financial debt, a position considered appropriate given the lease obligations inherent in our business model. Further details of the Board’s work can be found in the Governance and Committee sections of the Annual Report. Dividend Our progressive dividend policy targets an ordinary dividend that is two times covered by earnings, with any further surplus capital being returned to shareholders. Our Finance Director, Richard Hutton, outlines the expected application of the distribution policy in more detail in the Financial review. In line with its progressive dividend policy the Board intends to recommend at the Annual General Meeting a final dividend of 21.5p per share (2015: 21.2p), giving a total ordinary dividend for the year of 31.0p (2015: 28.6p), an increase of 8.4%. Looking ahead The Board recognises the need to engage with, and balance the interests of, many different stakeholders including customers, employees, pensioners, suppliers and shareholders. There is an overriding priority to maintain and enhance the competitiveness of the business in order to equip Greggs for long-term sustained success. In the short term we face a period of greater economic uncertainty and increased pressure from cost inflation. We have highlighted the changes necessary to support the ongoing strategic realignment of the business, including the major investment programme under way to grow our supply chain. This will involve some difficult changes for some of our colleagues, as detailed in the Chief Executive’s report, but is essential to support the long-term competitiveness of the business. Greggs is a strong business with a great team. I am confident that we can build on our recent success and make further progress in the year ahead. Ian Durant Chairman 28 February 2017
5
Chief Executive’s report In 2016 we delivered another strong performance as we continued on our journey to transform Greggs from a traditional bakery business into a modern, attractive food-on-the-go retailer. Our product offer is evolving to meet the changing needs of our customers and our shop estate and service levels have benefited from significant investment. We have made good progress in the modernisation of our systems and processes and have commenced the investment programme that will transform our supply chain capability and increase capacity to support our ambitions for shop growth. Financial performance Total sales grew to £894.2 million in 2016, up 7.0 per cent. Within this company-managed shop like-for-like sales grew by 4.2 per cent. Underlying operating profit, excluding property profits and exceptional items, grew by 8.6 per cent to £78.1 million (2015: £71.9 million). Pre-tax profit (including exceptional items) grew by 2.9 per cent to £75.1 million. Market background: Growing food-on-the-go market The overall market for food-on-the-go continued to be favourable during 2016, with growing consumer disposable income supporting demand despite uncertainty in the economic outlook. Customer footfall remained challenging in a number of shopping locations, supporting our strategy of progressively reducing our dependence on general shopping activity through alternative shop location and enhancing our offer to meet customers’ needs at different times of the day. The market for food-on-the-go remains highly competitive but we saw like-for-like sales and transaction growth throughout 2016, demonstrating the strength of the Greggs brand, its relevance and our quality, value and differentiated offer. Strategic direction: Focus on food-on-the-go Our strategic plan, first announced in 2013, set out to show that Greggs could be a winning brand in the highly competitive food-on-the-go market. Our business has been transformed in that time delivering an unbroken record of positive like-for-like sales and new levels of profit. It is now time to set a higher aspiration for the business, our purpose being to make good freshly prepared food accessible to everyone, with the aim of becoming the customers’ favourite for food-on-the-go. For this next phase we have refreshed our plan to reinforce our commitment to putting the customer at the heart of our strategy – it has four key pillars:
1. Great-tasting freshly prepared food 2. Best customer experience 3. Competitive supply chain 4. First class support teams
These pillars are all supported by our long-standing approach to conducting our business in a responsible manner, and in doing so making a positive impact on people’s lives.

6
Delivering our strategy 1. Great-tasting freshly prepared food Greggs is a strong and trusted brand and we draw on our heritage in fresh bakery to compete successfully in the food-on-the-go market. The Greggs product offer is differentiated by the way we freshly prepare food each day in our shops and by offering outstanding value for money for good quality, great-tasting food-on-the-go. Making good freshly prepared food accessible to all income levels is embedded in our core purpose as a brand, with outstanding value meal deals setting us apart from the competition. We maintained the price of our breakfast meal deal for the seventh year running and saw increased participation in our range of all-day meal deals offering any savoury or sweet product plus any hot drink. We have continued to make improvements to our product ranges that have helped drive positive like-for-like sales growth for thirteen consecutive quarters. Breakfast This continues to be the fastest growing part of our trading day, linked predominantly with customers travelling, thereby lessening our dependence on general shopping footfall. The value of our breakfast meal deal remains market leading and we have successfully built on this to offer greater menu choice, encouraging increased spend and visit frequency. Hot drinks Our reputation for great-tasting coffee continues to grow both alongside our breakfast offer and, increasingly, as an accompaniment to food at any time of the day. ‘Any hot drink’ features across our meal deal offers and is proving increasingly popular. Significant investment in additional coffee machines is driving speed of service and, as our reputation in this category builds, we are successfully extending choice in our coffee options. Balanced Choice Demand for healthier choices in food-on-the-go continues to grow and our Balanced Choice range, offering fewer than 400 calories and good nutritionals, has been growing to match. Sales last year exceeded £100m showing how our reach as a brand can have real impact in encouraging people to make healthier food-on-the-go choices. In the summer we built on our early success in sandwiches and ‘no added sugar’ drinks by launching a range of freshly prepared salads followed by a new range of savoury bakes in the autumn. Alongside these developments we extended the availability of fresh fruit, freshly prepared yoghurts, fruit and nut snacks and our first gluten-free products. Hot food This is another area of growing customer demand where we are investing in our capability to offer choice and speed of service. Hot sandwiches have proved particularly popular and we have invested in additional ovens in response to demand. This opens up opportunities for menu development which last year included burritos. Hot soup has been another source of growth lending itself well to full-flavoured Balanced Choice development.
7
Good food Customers increasingly care where their food comes from. Because we make the majority of the food we sell ourselves we are well placed to reassure customers that we deliver food they can trust. As a large-scale food manufacturer buying base ingredients we are one step closer to the source than many of our competitors who buy finished products. We are investing more in telling our story to customers, extending our association with Fairtrade, promoting our Good Egg award, committing to sustainable tuna fishing and gaining accreditation in animal welfare. Alongside this we are setting out to lead the food-on-the-go sector in eliminating or reducing unnecessary ingredients including salt, fat and sugar. In addition, we want our customers to be able to make informed choices and are the only major food-on-the-go brand providing full traffic light nutritional information on all products via our website. Looking ahead We have a strong pipeline of new product developments planned for 2017, offering more choice in growth areas while making sure that we continue to deliver a great customer experience with our traditional best-selling favourites. 2. Best customer experience Investing in service Great products alone will not succeed in food-on-the-go without great customer service. Our busy customers demand convenience with fast and friendly service and we continue to invest to improve in these areas. Extended opening hours, particularly early in the morning and on Sundays, are meeting increased demand as our popularity for food-on-the-go grows. Investment in coffee machines, hot food ovens and new systems to free up more staff time are all contributing to our speed of service. Working in a Greggs shop can be very demanding so we rely on great people to deliver friendly service under pressure. Making Greggs a great place to work is key to a great customer experience and we are investing in training and systems to help us release time for customer-facing activities. Alongside our internal measures used to reward teams who deliver great standards we were pleased to be ranked best in sector and 6th overall in the Institute of Customer Service’s January 2017 Customer Satisfaction Index. Greggs Rewards The latest release of our award-winning mobile customer loyalty scheme allowing fully flexible payment has created a step change in customer participation. Customer data capture is now at a level that allows us to analyse behaviour and develop targeted marketing campaigns. We have recently appointed our first Customer Director with experience in digital multi-channel marketing who will lead development of our capabilities in this area. Greggs Delivered Food-on-the-go delivery is a growing market channel offering growth potential for Greggs by targeting the workplace sector. A pilot lunchtime delivery service targeted at offices has been launched in trial locations from which we intend to learn and grow. Whilst we do not see an opportunity in home delivery we do believe that a smartphone-based order and collect service for customers offers future opportunity.
8
Looking ahead Further investment this year in new systems and process improvement will deliver additional gains, making shop operations simpler and supporting improved service levels. Rapid growth in Greggs Rewards recruitment will see this become an increasingly important source of customer insight and marketing opportunities. Building experience with customer delivery will enable us to develop this channel with the initial aim of converting our existing lunch time platter business to a digital platform. Estate changes and refurbishments We continue to see opportunities to increase our estate to substantially more than 2,000 shops and in 2016 we opened 145 new shops (including 56 franchised units) and closed 79, growing the estate to 1,764 shops trading as at 31 December 2016. At the end of 2016 we had 157 franchised shops operating in travel and other convenience locations, with a particular focus on motorway services and petrol forecourts. We expanded our presence in Northern Ireland in the year, opening seven company-managed shops and two franchised units, bringing our total shop numbers there to ten at the end of 2016. We completed 208 shop refurbishments during the year and in total 92 per cent of our shop estate now operates in a food-on-the-go format. The results of our refurbishment programme continue to be strong, both in terms of return on investment and the repositioning of the Greggs brand as a contemporary place to buy and eat food-on-the-go. In the year ahead we plan to refurbish another 200 shops, completing the conversion of our legacy bakery shops and starting to refresh older food-on-the-go shops to the latest look and facilities. In 2017 we expect to open 140-150 shops, including further development of our franchise partnerships, and to close 40-50 shops. We will continue to relocate shops to rebalance our estate, increasing our presence in travel, leisure and work-centred catchments. In 2013 only 20 per cent of our estate was located in these location types and by the end of 2016 this proportion had risen to 30 per cent. 3. Competitive supply chain In March 2016 we announced a major £100m programme of investment to support growth in shop numbers and reshape our supply chain in order to compete more effectively in the food-on-the-go market. The first phase of this programme involves the closure of three bakeries before going on to invest in our remaining supply sites to create centres of excellence in manufacturing and distribution. In 2016 we successfully opened our new distribution centre in Enfield and closed both our Twickenham and Sleaford bakeries. Good progress was also made with the extension of our bakery in Glasgow, enabling us to plan for the closure of our Edinburgh Bakery in the second quarter of 2017. Alongside this work we have undertaken detailed planning for the subsequent investment phase across our remaining bakery sites. In January 2017 we communicated our proposals to staff at each of our sites, including the planned impact of consolidating our manufacturing operations. Overall our expansion plans will create thousands of new roles in retail and distribution operations, but will result in fewer roles in manufacturing. We have therefore entered into consultation with trade unions and employee representatives over the detail of these proposals.
9
Our investment programme will create increased capacity and efficiency in shop distribution to support substantial shop growth alongside improved quality and efficiency in bakery manufacturing by centralising production. This is a complicated investment phase, transforming the use of space and equipment across our bakery network and is expected to take approximately two years to implement. Strategic decisions of this magnitude impacting jobs are always difficult and I am grateful for the contribution and professionalism of our teams who have been making these changes whilst maintaining service standards to our shops. Once implemented this new supply chain platform will substantially improve product quality, our competitiveness and, alongside system investment, will complete our transformation from traditional bakery to food-on-the-go. This is our largest ever investment in our supply chain, reaffirming our strategic commitment to the competitive advantage offered through vertical integration and delivering an attractive return on investment. 4. First class support teams We have made further significant progress in the third year of our major process and systems investment programme. Last year we successfully deployed SAP Finance as the core platform for integrated system development, and went on to pilot central forecasting and replenishment in trial shops in the second half of the year. The roll out of central forecasting and replenishment will replace shop-based ordering in 2017 and will be our largest ever new system roll out. Our business change programme team have now moved on to plan for the next stage of system development, centralising logistics and manufacturing to replace our current devolved local bakery solutions. We are aiming to launch pilots for both logistics and manufacturing by the end of 2017 with roll out to other sites in 2018. In addition to this core activity our teams have successfully deployed supporting SAP modules in procurement, product lifecycle management and human resource management, which together are transforming our working practices and effectiveness. Having a positive impact on people’s lives Greggs has a long-standing tradition and reputation as a socially responsible business and as such we want our actions to have a positive impact on people’s lives. This ambition covers a broad range of stakeholders and is focused on five areas:
Customer health – We encourage healthier food-on-the-go choices.
Responsible sourcing – We care about where our ingredients come from.
Community – We share our success with the people around us.
Environment – We aim to use energy efficiently and minimise waste.
People – We are committed to creating a great place to work. These ambitions are championed separately but embedded in the core strategic pillars of our business plan. In 2016 we made further improvements in all areas and were pleased to achieve an increase to a ‘four star’ rating in the Business In The Community CR index. Customer health Customers are increasingly aware of our Balanced Choice range and in 2016 we introduced traffic light labelling on our website and app. The Institute of Grocery Distribution have recognised our Balanced Choice range as having a positive impact on the health and wellness

10
of customers and we will continue to extend the range of products that meet this need. We recently launched a ‘healthier shop’ format at New Cross Hospital in Wolverhampton, designed to meet NHS England, PHE and DEFRA guidelines. Responsible sourcing All the tea, coffee, hot chocolate, sugar sachets, orange juice, apple juice and bananas we sell are certified Fairtrade. We source our prawns and tuna from sustainable sources and have recently moved up to ‘tier two’ in the Business Benchmark on Farm Animal Welfare. All of our manufacturing sites have achieved top marks on v7 of the British Retail Consortium’s global standard for food safety. Community We continue to share our success with the local communities in which we operate. In 2016 this included doubling the amount of end-of-day food that we donated to good causes and continuing to support the work of the Greggs Foundation. Staff and customers raised £613,000 for the Foundation in 2016 and this, combined with donations from the Company and the proceeds of carrier bag charges, enabled the Greggs Foundation to distribute £2.8 million to support a wide range of initiatives that improve the quality of life in our local communities. These included the award-winning Greggs Breakfast Club programme which, with support from 72 partner organisations, now provides five million free wholesome breakfasts each year to children in more than 400 primary schools. Environment We hold the Carbon Trust Standard in recognition of our work on carbon efficiencies and our Environmental Management System was certificated to ISO 14001 standard in 2016. We continue to trial technologies that could help to reduce our carbon footprint even further in the years ahead. People We pay all of our people more than the National Living Wage, including those under the age of 25. We share ten per cent of our profits with employees and our people will be sharing a record £8.8 million as a result of our strong performance in 2016. Our Employee Opinion Survey engagement score has increased by five percentage points over the last two years; 80 per cent of our people say they feel committed to Greggs and to helping us achieve our goals. However we are not complacent and in the year ahead will be working towards achieving the National Equality Standard as part of our commitment to make Greggs an even better place to work. Further details of all of our actions in these areas are described in the Annual Report. Outlook for 2017 The year has started in line with our expectations, with company-managed shop like-for-like sales in the eight weeks to 25 February 2017 up by 2.0 per cent, and total sales up 5.8 per cent. As expected the year to date position has been impacted by the timing of the New Year public holiday, which fell outside of the comparative period in 2016. Excluding the effect of this, company-managed shop like-for-like sales have grown by 2.9 per cent in weeks two to eight of the current year.

11
The UK consumer outlook is more challenging than we have seen in recent years, with industry-wide pressures emerging in commodities as well as labour costs. As previously stated we expect this to have a modest impact on margins in the short term. 2017 will be another busy year of change as we continue to progress our investment in better systems and the transformation and development of our supply chain. Over the medium term we are confident of making further progress as we implement our plan to grow Greggs as a contemporary food-on-the-go brand.
Roger Whiteside Chief Executive
28 February 2017

12
Financial review In 2016 we delivered another strong financial performance, increasing the rate of sales growth whilst controlling costs well. Continued good cash generation is supporting our programme of investment for further growth whilst allowing us to also increase dividends to shareholders. 2016
£m 2015
£m Revenue 894.2 835.7 Operating profit (excluding exceptional items and property profits)
78.1 71.9
Property profits 2.2 1.2
Operating profit (excluding exceptional items) 80.3 73.1 Operating margin (excluding exceptional items) 9.0% 8.7% Finance expense (0.0) (0.1) Exceptional items (5.2) 0.0
Profit before taxation 75.1 73.0
Sales Total Group sales for the 52 weeks ended 31 December 2016 were £894.2 million (2015: £835.7 million), an increase of 7.0 per cent. Sales in company-managed shops with more than one calendar year’s trading history (“like-for-like”) grew by 4.2 per cent to £777.2 million (2015: £745.6 million). We also saw like-for-like and total sales growth in our franchised shop estate. Profit Operating profit before exceptional items was £80.3 million (2015: £73.1 million), a 9.9 per cent increase on an underlying basis. The result reflects good sales growth combined with actions to make the business simpler and more efficient, plus a higher than normal £2.2 million contribution from property disposals (2015: £1.2 million). Pre-tax profit before exceptional items was £80.3 million (2015: £73.0 million). Including exceptional items pre-tax profit was £75.1 million (2015: £73.0 million). Exceptional items As noted in the Chief Executive’s report, in 2016 we commenced the first phase of our major investment programme to reshape our internal supply chain. This involved the closure of our Twickenham and Sleaford bakeries in 2016, with Edinburgh due to close in 2017. As a result in 2016 we incurred £6.4 million of redundancy and other employment-related costs, asset write-offs and impairment charges and other costs arising directly as a result of the closure of the three sites. These were partly offset by credits arising from the settlement of property and redundancy transactions treated as exceptional in prior years. The components of the net £5.2 million charge were as follows:

13
2016 £’m Supply chain restructuring: - redundancy costs 4.1 - asset-related costs 1.9 - transfer of operations 0.4
Restructuring of support functions 0.4
Release of prior years’ exceptional items: - dilapidations (0.5) - property provisions (0.9) - restructuring of support functions (0.2)
Total exceptional items 5.2
In January 2017 we communicated proposals for the next phase of this programme, which will invest in greater distribution capacity across our remaining sites whilst consolidating our existing manufacturing operations. The total one-off cash exceptional costs of this major change programme are expected to be in the region of £25.0 million, as previously communicated. This includes £6.4 million charged in 2016 and we expect to charge a further £12.0 million in 2017 as a result of the proposals for the next phase of consolidation. Any property gains resulting from the disposal of our sites in Twickenham and Edinburgh will also be treated as exceptional. Our Twickenham property has now been marketed and discussions with interested parties are ongoing. Operating margin Operating margin before exceptional items was 9.0 per cent (2015: 8.7 per cent). Including exceptional items operating margin was 8.4 per cent (2015: 8.7 per cent). Within this gross margin before exceptional items increased to 63.7 per cent (2015: 63.5 per cent) reflecting benign input cost conditions for most of the year, although these became inflationary in the fourth quarter. Including exceptional items gross margin was 63.2 per cent (2015: 63.5 per cent). We continue to see savings from our actions to make the business simpler and more efficient. In 2016 we delivered savings of £7.1 million, slightly ahead of the targets we had set. Benefits were achieved through better procurement and as a result of investments made to simplify our operations across retail and supply chain. In 2017 we expect to make a similar level of progress as we see initial benefits from our supply chain restructuring and continue to invest in improved processes and systems. As noted above in 2016 we recognised gains on the disposal of freehold properties totalling £2.2 million (2015: £1.2 million) as a result of the sale of freehold shops on closure and the disposal of former office buildings. In 2017 we expect property disposal gains will be in the range of £0.5 to £1.0 million. Financing charges There was a net financing expense of £nil million in the year (2015: £0.1 million) reflecting finance income of £0.2 million and a £0.2 million charge in respect of the funding position of the defined benefit pension scheme. In the year ahead we expect to incur a financing expense of around £0.6 million relating to the net liability of the pension scheme at the end

14
of the year. As discussed below the scheme’s net liability increased substantially over the year as a result of market conditions. Taxation The Company has a simple corporate structure, carries out its business entirely in the UK and all taxes are paid there. We aim to act with integrity and transparency in respect of our taxation obligations. Excluding the effect of exceptional items the Group’s underlying effective tax rate was 22.5 per cent (2015: 21.1 per cent). The overall tax rate for the year including exceptional items was 22.8 per cent (2015: 21.1 per cent). The effective rate primarily reflected reductions in the headline rate of corporation tax and the impact of the Group’s share price on allowances for share scheme costs. We expect the effective rate for 2017 to be around 21.25 per cent, the reduction from 2016 reflecting the lowering of the headline rate to 19% with effect from April 2017. We expect the effective rate to remain around two per cent above the headline corporation tax rate going forward due, principally, to disallowed expenditure such as depreciation on non-tax-deductible qualifying properties and costs of acquisition of new shops. Earnings per share Diluted earnings per share before exceptional items were 60.8 pence (2015: 55.8 pence), an increase of 9.0 per cent. Basic earnings per share before exceptional items were 62.0 pence (2015: 57.3 pence). Including exceptional items diluted earnings per share were 56.7 pence (2015: 55.8 pence) and basic earnings per share were 57.8 pence (2015: 57.3 pence). Dividend The Board recommends a final ordinary dividend of 21.5 pence per share (2015: 21.2 pence). Together with the interim dividend of 9.5 pence (2015: 7.4 pence) paid in October 2016, this makes a total ordinary dividend for the year of 31.0 pence (2015: 28.6 pence). This is covered two times by diluted earnings per share before exceptional items in line with our progressive dividend policy. In July 2015 the Group paid a special dividend of 20.0 pence per share. Our policy on special distributions is outlined below under “Cash flow and capital structure”. Subject to the approval of shareholders at the Annual General Meeting, the final dividend will be paid on 26 May 2017 to shareholders on the register on 28 April 2017. Balance sheet Capital expenditure We invested a total of £80.4 million (2015: £71.7 million) on capital expenditure in the business during 2016. This included £42.6 million on 208 shop refurbishments and the opening of 89 new company-managed shops. We continued to invest in shop equipment to support further growth in sales of coffee and hot sandwiches, totalling £5.1 million, and also invested £5.7 million in our programme of process and systems improvement. Investment in our supply chain of £21.1 million included completion of the refurbishment of our new distribution centre in Enfield and the commencement of works to extend the capacity of our Glasgow site. Depreciation and amortisation in the year was £45.6 million (2015: £40.1 million).

15
In 2017 we plan capital expenditure of around £85 million. This will support continued growth and diversification of our shop estate and the next phase of investment in our supply chain (see below). We plan to refurbish around 200 shops in 2017 and expect to invest in c.110 new Company-managed shops, with further openings funded by franchise partners. Our proposed £100 million investment programme in manufacturing and distribution operations comprises £75 million of capital expenditure and £25 million of one-off cash-related change costs over a five-year period. In 2016 we invested £3 million of capital expenditure relating to this programme. In 2017 we expect to invest around £20 million, followed by c.£27 million in 2018 as we execute the most capital-intensive phase of the programme. Working capital Group net current liabilities increased to £28.8 million at the end of 2016 (2015: £20.6 million). Inventory levels were stable and receivables rose by £3.1 million in the year, principally as a result of growth in the number of franchised shops. The £14.8 million increase in current liabilities largely reflected a higher level of trade payables as a result of growth in the business, plus capital creditors and restructuring provisions resulting from the changes made to our supply chain in the year. Pension scheme liability The net liability shown on the balance sheet for the Company’s closed defined benefit pension scheme has risen to £22.9 million (2015: £3.9 million). Despite appreciation of the scheme’s assets in 2016 the present value of the expected liabilities has risen considerably as a result of significant falls in corporate bond yields, which are used to determine the discount rate applied. The scheme is due to undergo a full actuarial revaluation in April 2017. Return on capital We manage return on capital against predetermined targets and monitor performance through our Investment Board, where all capital expenditure is subject to rigorous appraisal before and after it is made. For investments in new shops we target an average cash return on invested capital of 25 per cent, with a hurdle rate of 22.5 per cent, over an average investment cycle of seven years. Other investments are appraised using discounted cash flow analysis. The results of our refurbishment expenditure in the year were good, with 2016 investments delivering results ahead of our target. The performance of new shops was excellent, with prior year openings maturing well and newer shops making a very strong start. In the year ahead we will increase the rate of openings further, as long as we continue to see strong investment returns. We delivered an overall return on capital employed (ROCE) for 2016 of 28.1 per cent excluding exceptional items (2015: 26.8 per cent). The stronger ROCE reflects the improved operating performance in the year as well as good capital investment returns. Cash flow and capital structure The net cash inflow from operating activities in the year was £117.6 million (2015: £103.7 million). At the end of the year the Group had net cash and cash equivalents of £46.0 million (2015: £42.9 million).
16
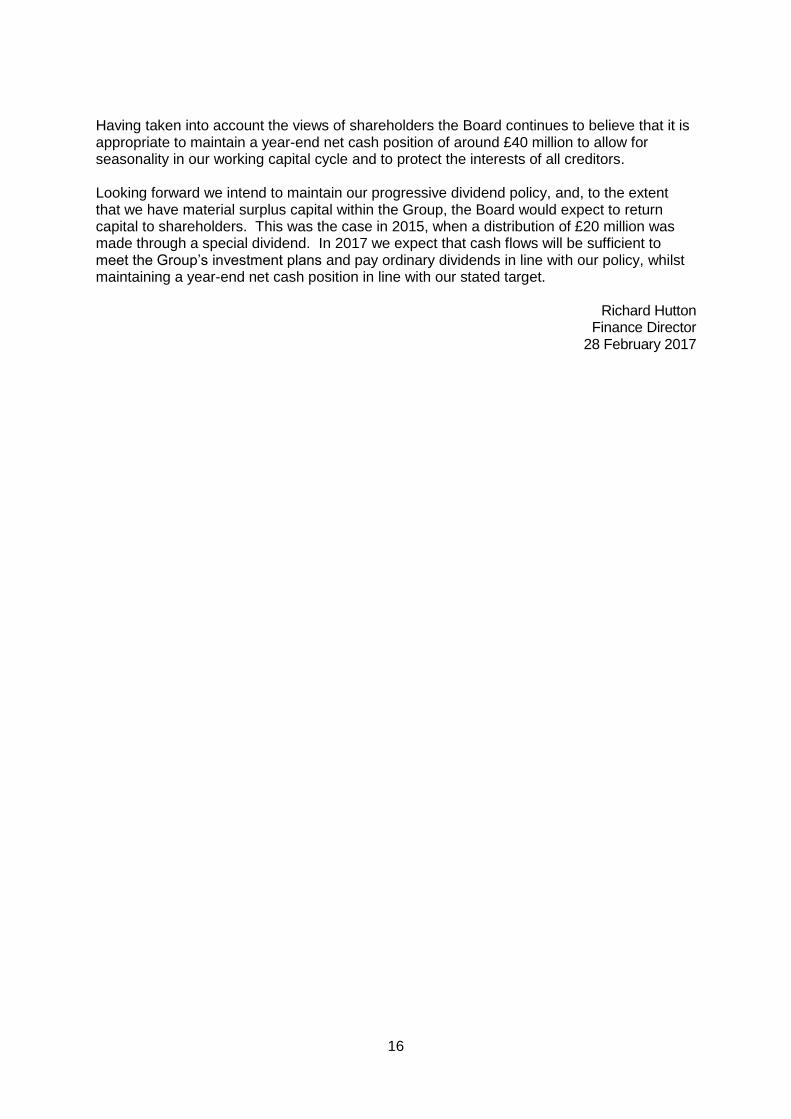
Having taken into account the views of shareholders the Board continues to believe that it is appropriate to maintain a year-end net cash position of around £40 million to allow for seasonality in our working capital cycle and to protect the interests of all creditors. Looking forward we intend to maintain our progressive dividend policy, and, to the extent that we have material surplus capital within the Group, the Board would expect to return capital to shareholders. This was the case in 2015, when a distribution of £20 million was made through a special dividend. In 2017 we expect that cash flows will be sufficient to meet the Group’s investment plans and pay ordinary dividends in line with our policy, whilst maintaining a year-end net cash position in line with our stated target.
Richard Hutton Finance Director
28 February 2017

17
Greggs plc Consolidated income statement for the 52 weeks ended 31 December 2016 (2015: 52 weeks ended 2 January 2016)
Note 2016 2016 2016 2015 Excluding
exceptional items
Exceptional items
(see Note 3)
Total
Total
£’000 £’000 £’000 £’000 Revenue 2 894,195 - 894,195 835,749 Cost of sales (324,289) (4,367) (328,656) (305,116) ________ ________ ________ ________ Gross profit 569,906 (4,367) 565,539 530,633 Distribution and selling costs
(441,246) (594) (441,840) (412,426)
Administrative expenses
(48,315) (216) (48,531) (45,094)
________ ________ ________ ________ Operating profit 80,345 (5,177) 75,168 73,113 Finance expense (26) - (26) (85) ________ ________ ________ ________ Profit before tax 80,319 (5,177) 75,142 73,028 Income tax 4 (18,064) 915 (17,149) (15,428) ________ ________ ________ ________ Profit for the financial year attributable to equity holders of the Parent
62,255
(4,262)
57,993
57,600
======= ======= ======= ======= Basic earnings per share
5 62.0p (4.2p) 57.8p 57.3p
Diluted earnings per share
5 60.8p (4.1p) 56.7p 55.8p

18
Greggs plc Consolidated statement of comprehensive income for the 52 weeks ended 31 December 2016 (2015: 52 weeks ended 2 January 2016)
2016 2015 £’000 £’000 Profit for the financial year 57,993 57,600
Other comprehensive income Items that will not be recycled to profit and loss: Re-measurements on defined benefit pension plans
(18,791) 4,915
Tax on re-measurements on defined benefit pension plans
3,194 (885)
________ ________ Other comprehensive income for the financial year, net of income tax
(15,597) 4,030
________ ________ Total comprehensive income for the financial year
42,396 61,630
======= =======
19
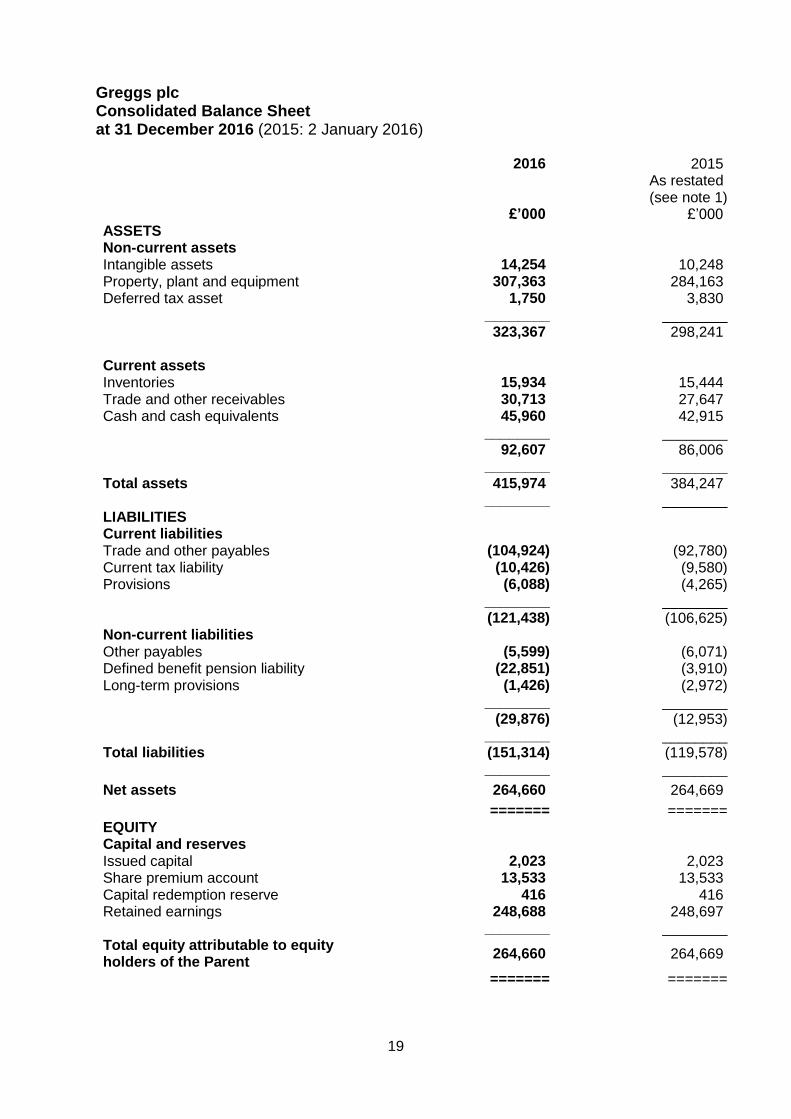
Greggs plc Consolidated Balance Sheet at 31 December 2016 (2015: 2 January 2016) 2016 2015 As restated
(see note 1) £’000 £’000 ASSETS Non-current assets Intangible assets 14,254 10,248 Property, plant and equipment 307,363 284,163 Deferred tax asset 1,750 3,830 ________ ________ 323,367 298,241 Current assets Inventories 15,934 15,444 Trade and other receivables 30,713 27,647 Cash and cash equivalents 45,960 42,915 ________ ________ 92,607 86,006 ________ ________ Total assets 415,974 384,247 ________ ________ LIABILITIES Current liabilities Trade and other payables (104,924) (92,780) Current tax liability (10,426) (9,580) Provisions (6,088) (4,265) ________ ________ (121,438) (106,625) Non-current liabilities Other payables (5,599) (6,071) Defined benefit pension liability (22,851) (3,910) Long-term provisions (1,426) (2,972) ________ ________ (29,876) (12,953) ________ ________ Total liabilities (151,314) (119,578) ________ ________
Net assets 264,660 264,669
======= ======= EQUITY Capital and reserves Issued capital 2,023 2,023 Share premium account 13,533 13,533 Capital redemption reserve 416 416 Retained earnings 248,688 248,697 ________ ________ Total equity attributable to equity holders of the Parent
264,660 264,669
======= =======

20
Greggs plc Consolidated statement of changes in equity for the 52 weeks ended 31 December 2016 (2015: 52 weeks ended 2 January 2016) 52 weeks ended 2 January 2016 Attributable to equity holders of the Company Issued
capital Share
premium Capital
redemption reserve
Retained earnings
Total
As restated (see note 1)
As restated (see note 1)
£’000 £’000 £’000 £’000 £’000 Balance at 4 January 2015
2,023 13,533 416 230,731 246,703
Total comprehensive income for the year
Profit for the financial year
- - - 57,600 57,600
Other comprehensive income
- - - 4,030 4,030
________ ________ ________ ________ ________ Total comprehensive income for the year
- - - 61,630 61,630
Transactions with owners, recorded directly in equity
Sale of own shares - - - 3,876 3,876 Purchase of own shares - - - (11,125) (11,125) Share-based payment transactions
- - - 2,057 2,057
Dividends to equity holders
- - - (43,714) (43,714)
Tax items taken directly to reserves
- - - 5,242 5,242
________ ________ ________ ________ ________ Total transactions with owners
- - - (43,664) (43,664)
________ ________ ________ ________ ________ Balance at 2 January 2016
2,023 13,533 416 248,697 264,669
======= ======= ======= ======= =======

21
Greggs plc Consolidated statement of changes in equity (continued) 52 weeks ended 31 December 2016 Issued
capital Share
premium Capital
redemption reserve
Retained earnings
Total
£’000 £’000 £’000 £’000 £’000 Balance at 3 January 2016
2,023 13,533 416 248,697 264,669
Total comprehensive income for the year
Profit for the financial year
- - - 57,993 57,993
Other comprehensive income
- - - (15,597) (15,597)
________ ________ ________ ________ ________ Total comprehensive income for the year
- - - 42,396 42,396
Transactions with owners, recorded directly in equity
Sale of own shares - - - 4,063 4,063 Purchase of own shares - - - (12,398) (12,398) Share-based payment transactions
- - - 1,994 1,994
Dividends to equity holders
- - - (30,936) (30,936)
Tax items taken directly to reserves
- - - (5,128) (5,128)
________ ________ ________ ________ ________ Total transactions with owners
- - - (42,405) (42,405)
________ ________ ________ ________ ________ Balance at 31 December 2016
2,023 13,533 416 248,688 264,660
======= ======= ======= ======= =======
22
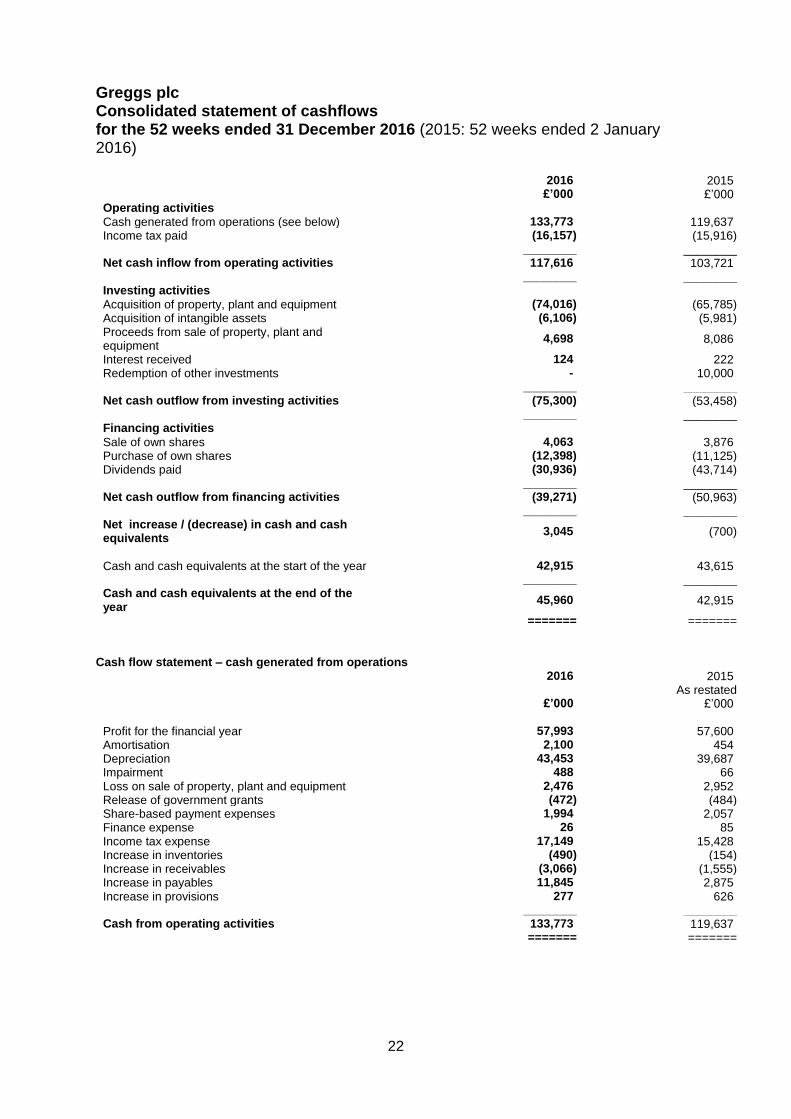
Greggs plc Consolidated statement of cashflows for the 52 weeks ended 31 December 2016 (2015: 52 weeks ended 2 January 2016)
2016 2015 £’000 £’000 Operating activities Cash generated from operations (see below) 133,773 119,637 Income tax paid (16,157) (15,916) ________ ________ Net cash inflow from operating activities 117,616 103,721 ________ ________ Investing activities Acquisition of property, plant and equipment (74,016) (65,785) Acquisition of intangible assets (6,106) (5,981) Proceeds from sale of property, plant and equipment
4,698 8,086
Interest received 124 222 Redemption of other investments - 10,000 ________ ________ Net cash outflow from investing activities (75,300) (53,458) ________ ________ Financing activities Sale of own shares 4,063 3,876 Purchase of own shares (12,398) (11,125) Dividends paid (30,936) (43,714) ________ ________ Net cash outflow from financing activities (39,271) (50,963) ________ ________ Net increase / (decrease) in cash and cash equivalents
3,045 (700)
Cash and cash equivalents at the start of the year 42,915 43,615 ________ ________ Cash and cash equivalents at the end of the year
45,960 42,915
======= =======
Cash flow statement – cash generated from operations
2016 2015 As restated £’000 £’000 Profit for the financial year 57,993 57,600 Amortisation 2,100 454 Depreciation 43,453 39,687 Impairment 488 66 Loss on sale of property, plant and equipment 2,476 2,952 Release of government grants (472) (484) Share-based payment expenses 1,994 2,057 Finance expense 26 85 Income tax expense 17,149 15,428 Increase in inventories (490) (154) Increase in receivables (3,066) (1,555) Increase in payables 11,845 2,875 Increase in provisions 277 626 ________ ________ Cash from operating activities 133,773 119,637 ======= =======

23
Greggs plc Notes 1. Basis of preparation and accounting policies The preliminary announcement has been prepared in accordance with the recognition and measurement principles of International Financial Reporting Standards as adopted by the EU ("adopted IFRSs"), IFRIC interpretations and the Companies Act 2006 applicable to companies reporting under IFRS. It does not include all the information required for full annual accounts.
The financial information set out above does not constitute the Company's statutory accounts for the years ended 31 December 2016 or 2 January 2016 but is derived from these accounts. Statutory accounts for the 52 weeks ended 2 January 2016 have been delivered to the registrar of companies, and those for the 52 weeks ended 31 December 2016 will be delivered in due course. The auditor has reported on those accounts; the audit reports were (i) unqualified, (ii) did not include a reference to any matters to which the auditor drew attention by way of emphasis without qualifying their report and (iii) did not contain a statement under section 498 (2) or (3) of the Companies Act 2006.
The preliminary announcement has been prepared using the accounting policies published in the Group’s accounts for the 52 weeks ended 2 January 2016, which are available on the Company’s website www.greggs.co.uk, with the exception of the adoption of the following relevant standards, amendments and interpretations:
Amendments to IAS 16 and IAS 38 - Clarification of Acceptable Methods of Depreciation and Amortisation
Annual Improvements to IFRSs – 2012-2014 Cycle
Disclosure Initiative – Amendments to IAS 1 The adoption of the above has not had a significant impact on the Group’s profit for the year or equity.
Restatement of comparatives During 2015 a provision was recognised for the future employers’ national insurance costs on share-settled option schemes where there is no requirement for the employee to reimburse these costs. This accounting is in accordance with IFRS 2. The charge was included within the share-based payments charge within the income statement with the credit being taken directly to reserves in line with the rest of the charge. It has been determined that the element of the charge relating to future national insurance costs should have been accounted for as a provision rather than directly to reserves. The impact of this for the 52 weeks ended 2 January 2016 is that the closing retained earnings reserve has been reduced by £1,605,000, current liability provisions have increased by £590,000 and long-term provisions have increased by £1,015,000. There is no impact on profit or cash flows.

24
2. Segmental analysis The Board is considered to be the “chief operating decision maker” of the Group in the context of the IFRS 8 definition. In addition to its retail activities, the Group generates revenues from franchise and wholesale. However, these elements of the business are not sufficiently significant to be “Reportable Segments” in the context of IFRS 8.
Products and services - the Group sells a consistent range of fresh bakery goods, sandwiches and drinks in its shops. The Group also provides frozen bakery products to its wholesale customers.
Major customers - the majority of sales are made to the general public on a cash basis. A small proportion of sales are made on credit to certain organisations, including wholesale customers, but these are immaterial in a Group context.
Geographical areas - all results arise in the UK.
The Board has carefully considered the requirements of IFRS 8 and concluded that, as there is only one reportable segment whose revenue, profits, assets and liabilities are measured and reported on a consistent basis with the Group accounts, no additional numerical disclosures are necessary.
3. Exceptional items 2016 2015
£’000 £’000
Cost of sales
Supply chain restructuring - redundancy costs 3,028 -
- asset-related costs 1,852 - - other contractual obligations 44
Prior year items - dilapidations (557) - __________ __________
4,367 Distribution and selling
Supply chain restructuring - redundancy costs 1,108 -
- transfer of operations 356 Prior year items - property related (870) - __________ __________
594 - Administrative expenses
Restructuring of support functions 391 -
Prior year items - restructuring of support functions (175)
__________ __________
216 - ________ ________
Total exceptional items 5,177 -
======= =======

25
3. Exceptional items (continued) Supply chain restructuring
This charge arises from the decision, announced in March 2016, to invest in and reshape the Company’s supply chain in order to support future growth. The costs relate to the closure of three bakery sites and include redundancy and other employment-related costs, asset write-offs, impairment and transfer and other contractual obligations that arise as a result of the closure of the sites.
Restructuring of support functions
This charge relates to redundancy costs arising from the restructuring of bakery administration and payroll functions. Prior year items
These relate to the movement on costs treated as exceptional in prior years and arise from the settlement of various property and redundancy transactions. 4. Taxation Recognised in the income statement Excluding
exceptional items
Exceptional items
Total Total
2016 2016 2016 2015 £’000 £’000 £’000 £’000 Current tax Current year 18,716 (767) 17,949 17,970 Adjustment for prior years (946) - (946) (530) ________ ________ ________ ________ 17,770 (767) 17,003 17,440 ________ ________ ________ ________ Deferred tax Origination and reversal of temporary differences
(342) (148) (490) (1,038)
Reduction in tax rate 239 - 239 (254) Adjustment for prior years 397 - 397 (720) ________ ________ ________ ________ 294 (148) 146 (2,012) ________ ________ ________ ________ Total income tax expense in income statement
18,064 (915) 17,149 15,428
======= ======= ======= =======

26
5. Earnings per share Basic earnings per share
Basic earnings per share for the 52 weeks ended 31 December 2016 is calculated by dividing profit attributable to ordinary shareholders by the weighted average number of ordinary shares outstanding during the 52 weeks ended 31 December 2016 as calculated below.
Diluted earnings per share
Diluted earnings per share for the 52 weeks ended 31 December 2016 is calculated by dividing profit attributable to ordinary shareholders by the weighted average number of ordinary shares, adjusted for the effects of all dilutive potential ordinary shares (which comprise share options granted to employees) outstanding during the 52 weeks ended 31 December 2016 as calculated below. Profit attributable to ordinary shareholders
2016 2016 2016 2015 Excluding
exceptional items
Exceptional items
Total Total
£’000 £’000 £’000 £’000
Profit for the financial year attributable to equity holders of the Parent
62,255 (4,262) 57,993 57,600
======= ======= ======= ======
Basic earnings per share 62.0p (4.2p) 57.8p 57.3p Diluted earnings per share 60.8p (4.1p) 56.7p 55.8p
Weighted average number of ordinary shares 2016 2015 Number Number Issued ordinary shares at start of year 101,155,901 101,155,901
Effect of own shares held (710,295) (551,314) __________ __________ Weighted average number of ordinary shares during the year
100,445,606 100,604,587
Effect of share options on issue 1,921,344 2,616,364
__________ __________ Weighted average number of ordinary shares (diluted) during the year
102,366,950 103,220,951
========= =========

27
6. Dividends The following tables analyse dividends when paid and the year to which they relate: 2016 2015 Per share Per share pence pence 2014 final dividend - 16.0p 2015 interim dividend - 7.4p 2015 special dividend - 20.0p 2015 final dividend 21.2p - 2016 interim dividend 9.5p - ________ ________ 30.7p 43.4p ======= =======
The proposed final dividend in respect of 2016 amounts to 21.5 pence per share (£21,560,000). This proposed dividend is subject to approval at the Annual General Meeting and has not been included as a liability in these accounts. 2016 2015
£’000 £’000
2014 final dividend - 16,090
2015 interim dividend - 7,463
2015 special dividend - 20,161
2015 final dividend 21,326 -
2016 interim dividend 9,610 -
________ ________
30,936 43,714
======= =======
7. Related parties
The Group has a related party relationship with its subsidiaries, associates and its Directors and executive officers.
There have been no related party transactions in the year which have materially affected the financial position or performance of the Group. There have been no related party transactions in the year which have materially affected the financial position or performance of the Group. 8. Events after the reporting period As noted in the Chief Executive’s report above, in January 2017 the Company communicated further restructuring proposals to staff relating to the previously communicated investment in its supply chain. This communication included the planned impact of consolidating manufacturing operations and announced a consultation with trade unions and employee representatives over the detail of the proposals. The total one-off exceptional costs of this major change programme are expected to be in the region of £25 million. This includes £6.4 million charged in 2016 (see note 3) and we expect to charge a further £12 million in 2017, of which £6 million will be a cash cost.

28
9. Principal risks and uncertainties
The Board has carried out a robust assessment of the principal risks facing the company, including those that would threaten its business model, future performance, solvency and liquidity. These risks are described below, together with a brief description of mitigating activity. Greggs is exposed to a wider range of risks than those listed. However, these are the risks which are considered to be the most important to the business’ future development, performance or position. The risks identified are those to which the Board considers there is a disproportionate exposure, relative to the food-on-the-go sector. The impact of these risks occurring has been considered in developing the scenarios tested as part of the financial viability statement. The risks are not set out in any particular order.
Area of principal risk or uncertainty Mitigating actions and controls Risk rating Business change - Greggs is implementing a strategic plan to transform the business from a decentralised traditional bakery to a centralised modern food-on-the-go brand. This is a major programme of business change involving restructuring, new systems, significant capital investment and a major overhaul of every aspect of the business, particularly supply chain. Progress may not be in line with plans, disruption could occur and financial returns may fall short of expectation.
The project delivery is overseen by the Operating Board, under the guidance of a project sponsor, providing robust governance. Regular updates are provided to the Board, to monitor progress against clearly defined timelines and financial forecasts.
Increasing
Product quality and safety - Greggs is unusual in the food-on-the-go sector in that it is vertically integrated, owning its own manufacturing and supply chain operations. In addition, we freshly prepare food on our retail premises. This exposes us to greater risk in ensuring good food safety than many of our competitors.
Procedures are in place throughout our operations to ensure that food safety is maintained. These procedures are supported by robust audit processes, both internally, and by regulatory bodies.
No change
Food scare - Greggs may suffer from a loss of customer confidence due to a major food scare beyond its control. Dependent upon the nature of this, it may have a disproportionate impact on Greggs.
The majority of products for sale in our shops have been manufactured by our staff in our bakeries. Checks are carried out to confirm the integrity of our products and ingredients as part of routine processes.
No change
Loss of production - Some of our products are produced in one location and distributed nationwide. Any disruption to supply would have a significant impact on our customers.
Contingency plans are in place for our supply sites, and these are regularly tested. Our property insurers carry out annual site inspections, which help to protect our facilities from loss. We have alternative supply sources for key products, and these are periodically tested.
No change
29
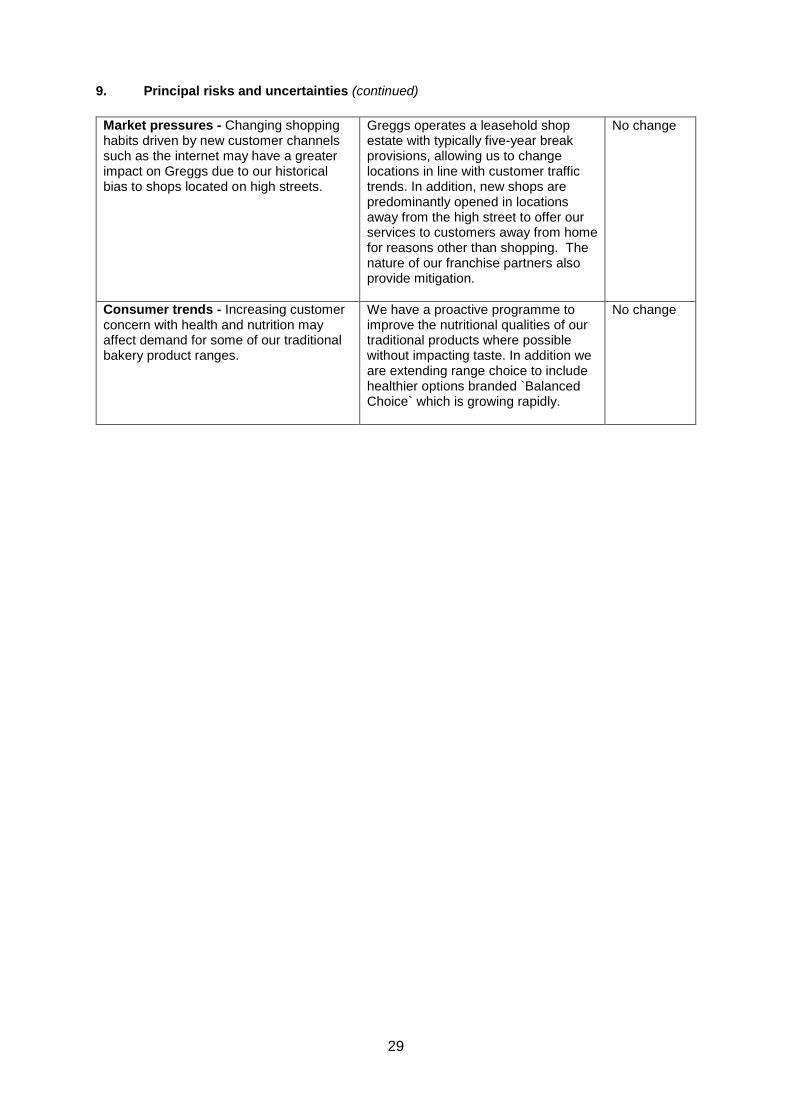
9. Principal risks and uncertainties (continued)
Market pressures - Changing shopping habits driven by new customer channels such as the internet may have a greater impact on Greggs due to our historical bias to shops located on high streets.
Greggs operates a leasehold shop estate with typically five-year break provisions, allowing us to change locations in line with customer traffic trends. In addition, new shops are predominantly opened in locations away from the high street to offer our services to customers away from home for reasons other than shopping. The nature of our franchise partners also provide mitigation.
No change
Consumer trends - Increasing customer concern with health and nutrition may affect demand for some of our traditional bakery product ranges.
We have a proactive programme to improve the nutritional qualities of our traditional products where possible without impacting taste. In addition we are extending range choice to include healthier options branded `Balanced Choice` which is growing rapidly.
No change