Embed Size (px)
Citation preview
GREET Development and Applications for Life-Cycle Analysis of Vehicle/Fuel Systems
Michael Wang, Amgad Elgowainy, Jeongwoo Han, Hao Cai Argonne National Laboratory The 2013 DOE Vehicle Technologies Program Annual Merit Review and Peer Evaluation Meeting
Arlington, VA May 16, 2013
Project ID: van002
This presentation does not contain any proprietary, confidential, or otherwise restricted information
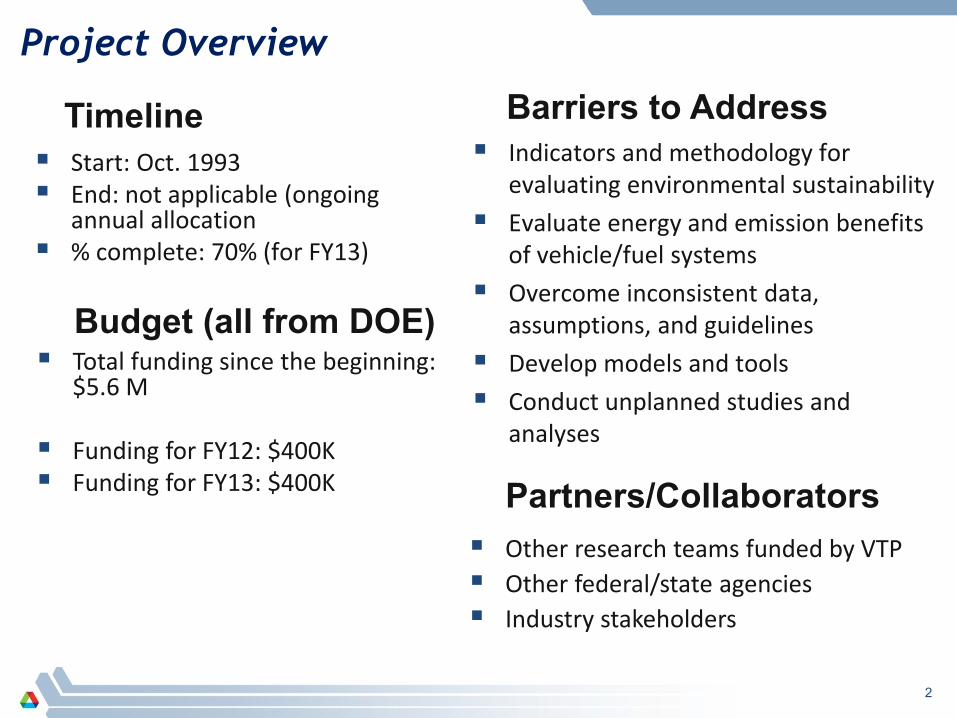
Project Overview
Start: Oct. 1993 End: not applicable (ongoing
annual allocation % complete: 70% (for FY13)
Indicators and methodology for evaluating environmental sustainability
Evaluate energy and emission benefits of vehicle/fuel systems
Overcome inconsistent data, assumptions, and guidelines
Develop models and tools Conduct unplanned studies and
analyses
Total funding since the beginning: $5.6 M
Funding for FY12: $400K Funding for FY13: $400K
Timeline
Budget (all from DOE)
Barriers to Address
Other research teams funded by VTP Other federal/state agencies Industry stakeholders
Partners/Collaborators
2
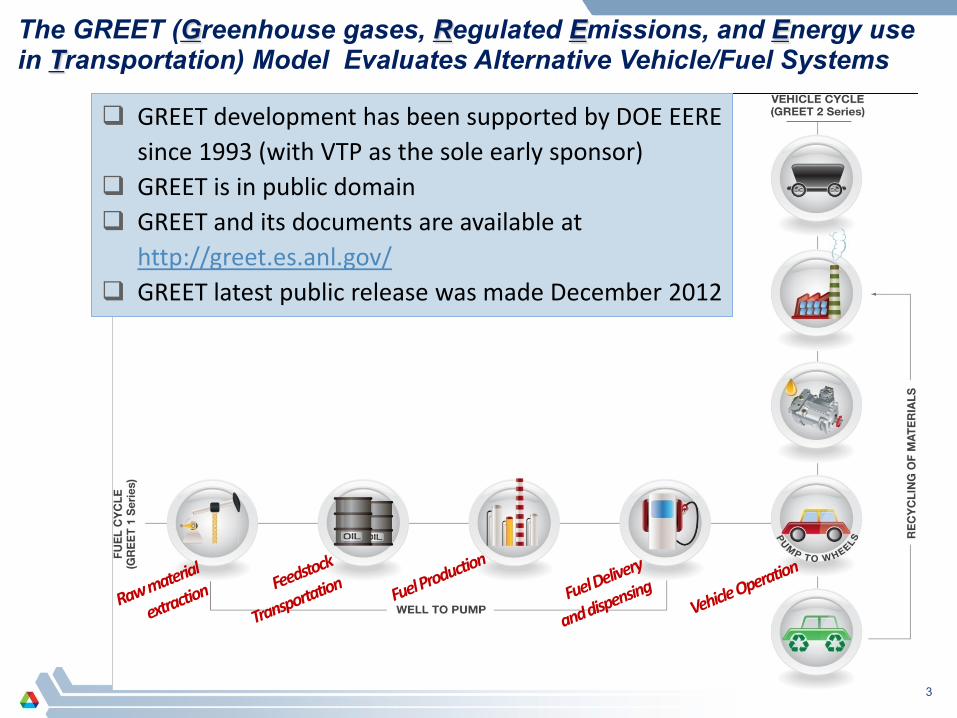
The GREET (Greenhouse gases, Regulated Emissions, and Energy use in Transportation) Model Evaluates Alternative Vehicle/Fuel Systems
GREET development has been supported by DOE EERE since 1993 (with VTP as the sole early sponsor)
GREET is in public domain GREET and its documents are available at
http://greet.es.anl.gov/ GREET latest public release was made December 2012
3
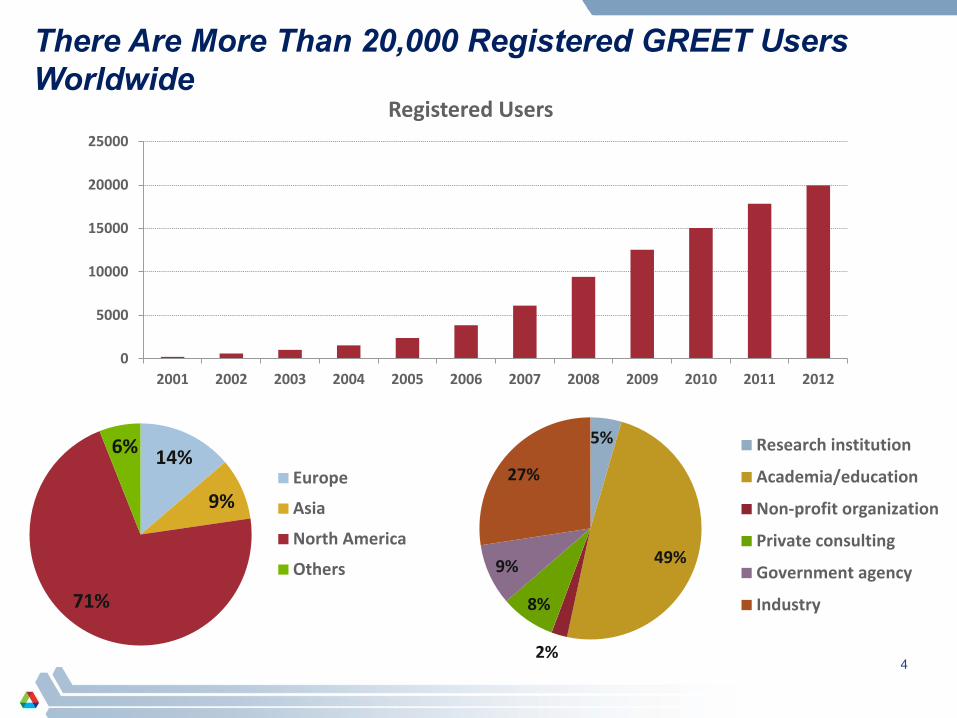
There Are More Than 20,000 Registered GREET Users Worldwide
14%
9%
71%
6% Europe
Asia
North America
Others
5%
49%
2%
8%
9%
27%
Research institution
Academia/education
Non-profit organization
Private consulting
Government agency
Industry
4
0
5000
10000
15000
20000
25000
2001 2002 2003 2004 2005 2006 2007 2008 2009 2010 2011 2012
Registered Users
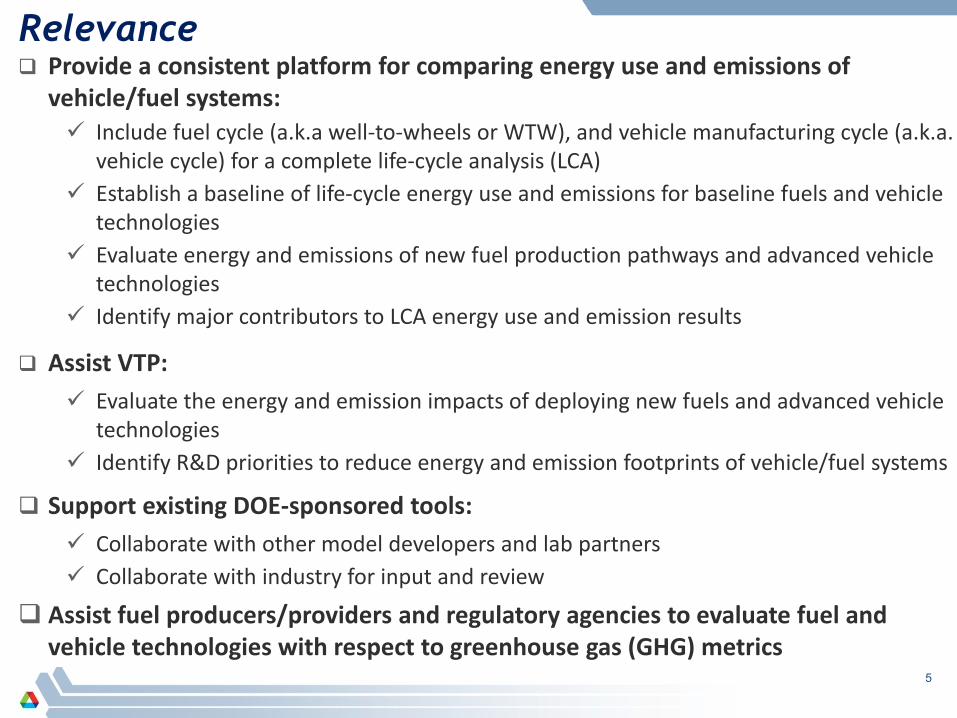
Relevance Provide a consistent platform for comparing energy use and emissions of
vehicle/fuel systems: Include fuel cycle (a.k.a well-to-wheels or WTW), and vehicle manufacturing cycle (a.k.a.
vehicle cycle) for a complete life-cycle analysis (LCA) Establish a baseline of life-cycle energy use and emissions for baseline fuels and vehicle
technologies Evaluate energy and emissions of new fuel production pathways and advanced vehicle
technologies Identify major contributors to LCA energy use and emission results
Assist VTP: Evaluate the energy and emission impacts of deploying new fuels and advanced vehicle
technologies Identify R&D priorities to reduce energy and emission footprints of vehicle/fuel systems
Support existing DOE-sponsored tools: Collaborate with other model developers and lab partners Collaborate with industry for input and review
Assist fuel producers/providers and regulatory agencies to evaluate fuel and vehicle technologies with respect to greenhouse gas (GHG) metrics
5
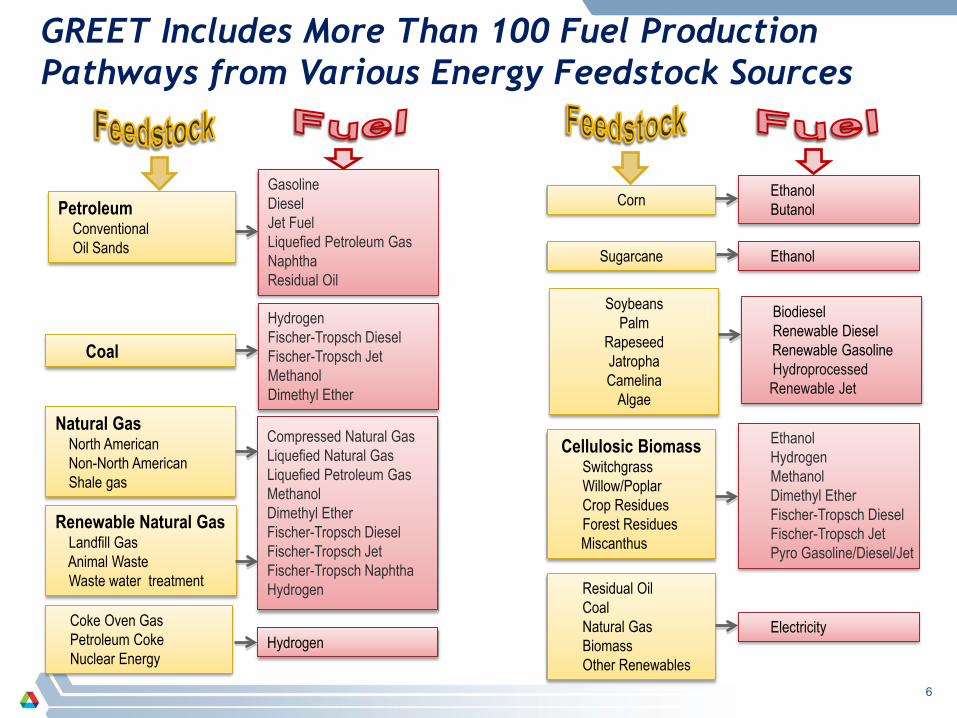
GREET Includes More Than 100 Fuel Production Pathways from Various Energy Feedstock Sources
Petroleum Conventional Oil Sands
Compressed Natural Gas Liquefied Natural Gas Liquefied Petroleum Gas Methanol Dimethyl Ether Fischer-Tropsch Diesel Fischer-Tropsch Jet Fischer-Tropsch Naphtha Hydrogen
Natural Gas North American Non-North American Shale gas
Coal
Soybeans Palm
Rapeseed Jatropha Camelina
Algae
Gasoline Diesel Jet Fuel Liquefied Petroleum Gas Naphtha Residual Oil
Hydrogen Fischer-Tropsch Diesel Fischer-Tropsch Jet Methanol Dimethyl Ether
Biodiesel Renewable Diesel Renewable Gasoline Hydroprocessed Renewable Jet
Sugarcane
Corn
Cellulosic Biomass Switchgrass Willow/Poplar Crop Residues Forest Residues Miscanthus
Residual Oil Coal Natural Gas Biomass Other Renewables
Ethanol Butanol
Ethanol
Ethanol Hydrogen Methanol Dimethyl Ether Fischer-Tropsch Diesel Fischer-Tropsch Jet Pyro Gasoline/Diesel/Jet
Electricity
Renewable Natural Gas Landfill Gas Animal Waste Waste water treatment
6
Coke Oven Gas Petroleum Coke Nuclear Energy
Hydrogen
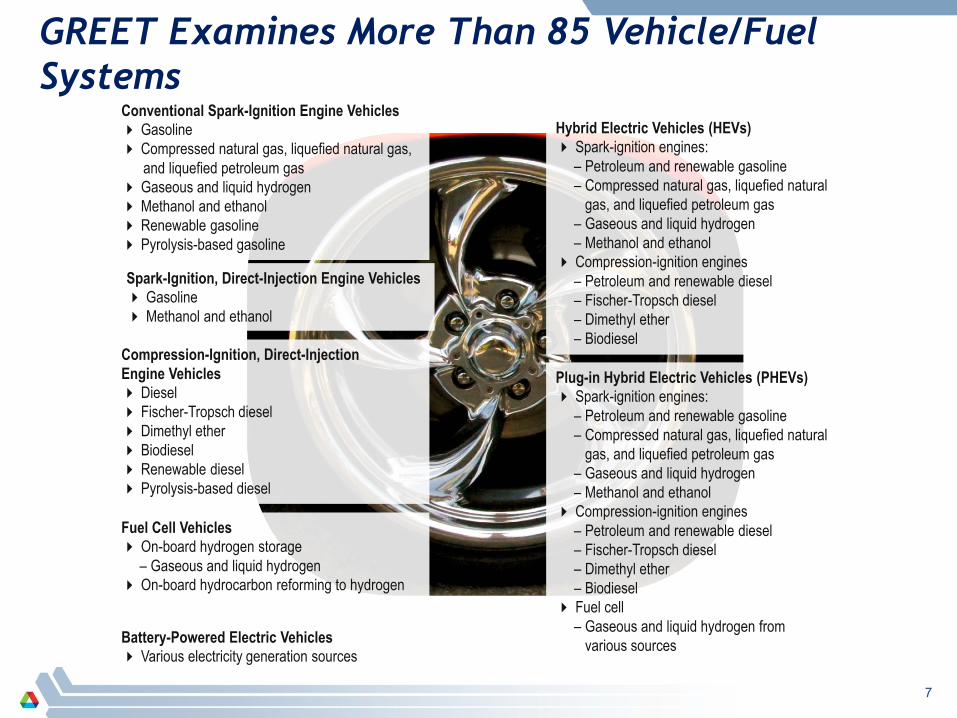
GREET Examines More Than 85 Vehicle/Fuel Systems
Conventional Spark-Ignition Engine Vehicles Gasoline Compressed natural gas, liquefied natural gas, and liquefied petroleum gas Gaseous and liquid hydrogen Methanol and ethanol Renewable gasoline Pyrolysis-based gasoline
Spark-Ignition, Direct-Injection Engine Vehicles Gasoline Methanol and ethanol
Compression-Ignition, Direct-Injection Engine Vehicles Diesel Fischer-Tropsch diesel Dimethyl ether Biodiesel Renewable diesel Pyrolysis-based diesel
Fuel Cell Vehicles On-board hydrogen storage – Gaseous and liquid hydrogen On-board hydrocarbon reforming to hydrogen
Battery-Powered Electric Vehicles Various electricity generation sources
Hybrid Electric Vehicles (HEVs) Spark-ignition engines: – Petroleum and renewable gasoline – Compressed natural gas, liquefied natural gas, and liquefied petroleum gas – Gaseous and liquid hydrogen – Methanol and ethanol Compression-ignition engines – Petroleum and renewable diesel – Fischer-Tropsch diesel – Dimethyl ether – Biodiesel
Plug-in Hybrid Electric Vehicles (PHEVs) Spark-ignition engines: – Petroleum and renewable gasoline – Compressed natural gas, liquefied natural gas, and liquefied petroleum gas – Gaseous and liquid hydrogen – Methanol and ethanol Compression-ignition engines – Petroleum and renewable diesel – Fischer-Tropsch diesel – Dimethyl ether – Biodiesel Fuel cell – Gaseous and liquid hydrogen from various sources
7
Approach, Data Sources, and General Assumptions
Approach: build LCA modeling capacity with the GREET model Build a consistent LCA platform with reliable, widely accepted methods/protocols Address emerging LCA issues related to vehicle/fuel systems Maintain openness and transparency of LCAs with availability of GREET
Data Sources: Data for fuel production pathways
• Open literature and results from other researchers • Simulation results with models such as ASPEN Plus • Fuel producers and technology developers
Data for vehicle systems • Open literature and results from other researchers • Simulation results from models such as Autonomie • Auto makers and system components producers
General Assumptions: Baseline technologies and energy systems: EIA AEO projections, EPA eGrid for
electric systems, etc. Evolution of both baseline technologies and new technologies over time Consideration of effects of regulations already adopted by agencies
8
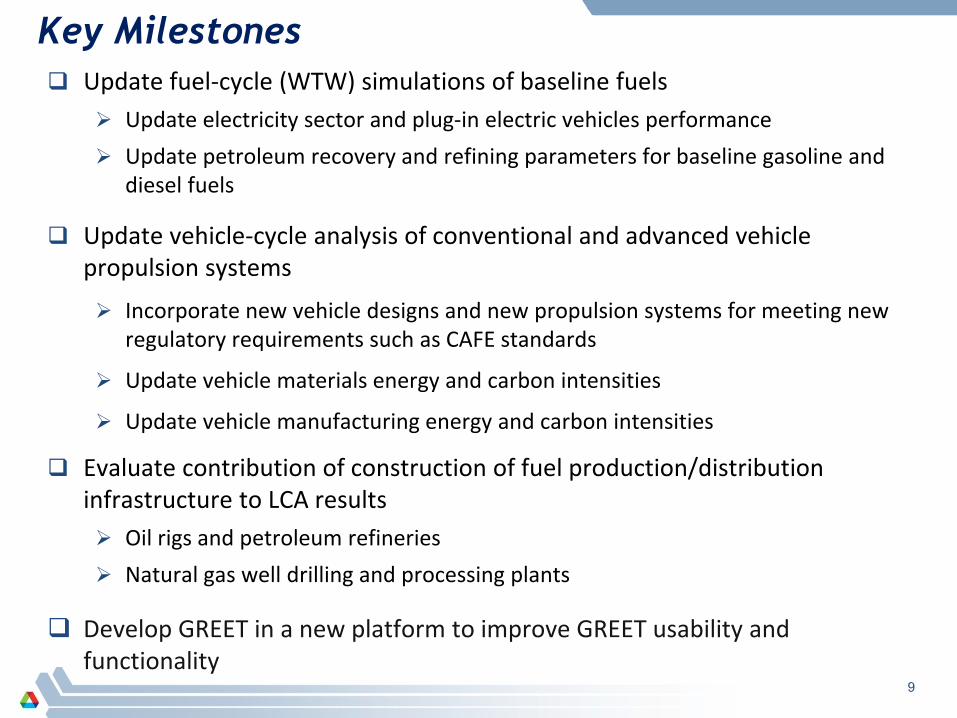
Key Milestones Update fuel-cycle (WTW) simulations of baseline fuels
Update electricity sector and plug-in electric vehicles performance Update petroleum recovery and refining parameters for baseline gasoline and
diesel fuels
Update vehicle-cycle analysis of conventional and advanced vehicle propulsion systems
Incorporate new vehicle designs and new propulsion systems for meeting new regulatory requirements such as CAFE standards
Update vehicle materials energy and carbon intensities
Update vehicle manufacturing energy and carbon intensities
Evaluate contribution of construction of fuel production/distribution infrastructure to LCA results Oil rigs and petroleum refineries Natural gas well drilling and processing plants
Develop GREET in a new platform to improve GREET usability and functionality
9
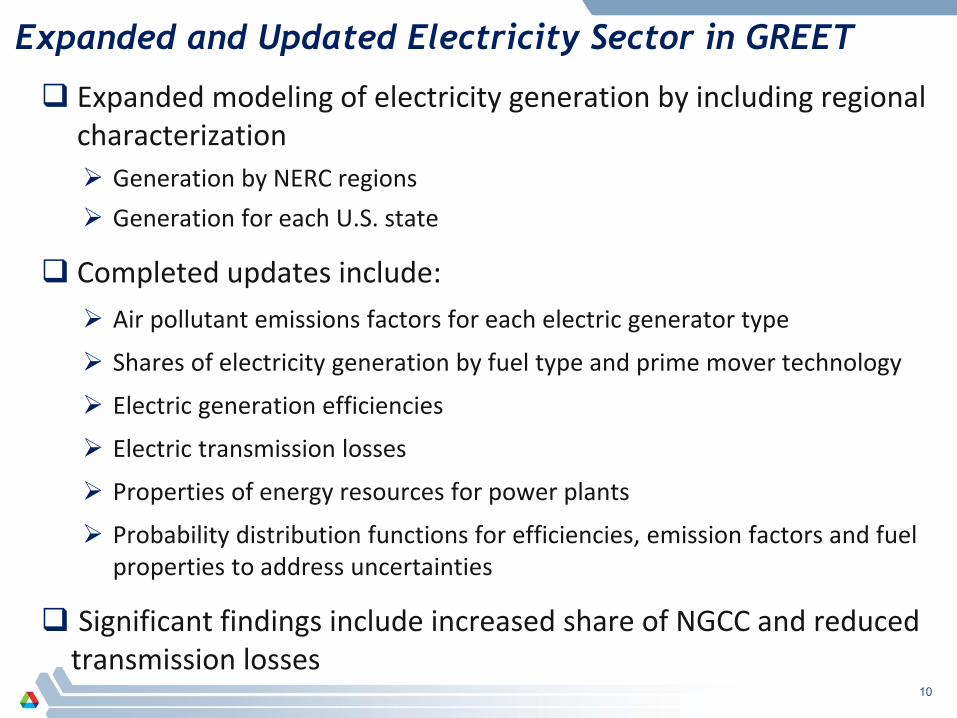
Expanded and Updated Electricity Sector in GREET
Expanded modeling of electricity generation by including regional characterization Generation by NERC regions Generation for each U.S. state
Completed updates include: Air pollutant emissions factors for each electric generator type
Shares of electricity generation by fuel type and prime mover technology
Electric generation efficiencies
Electric transmission losses
Properties of energy resources for power plants
Probability distribution functions for efficiencies, emission factors and fuel properties to address uncertainties
Significant findings include increased share of NGCC and reduced transmission losses
10
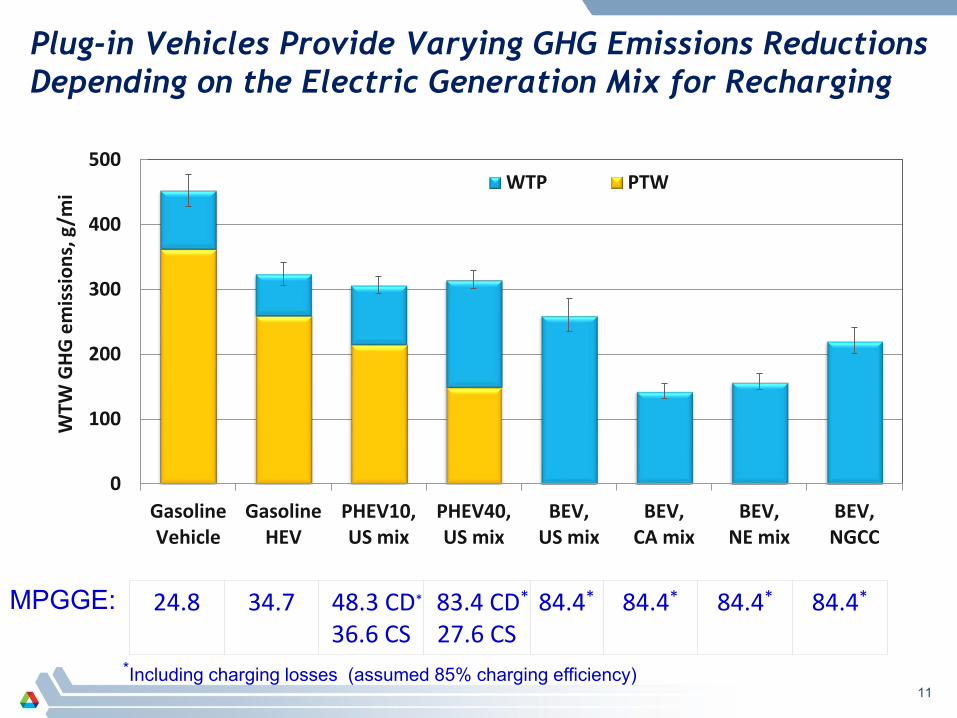
Plug-in Vehicles Provide Varying GHG Emissions Reductions Depending on the Electric Generation Mix for Recharging
11
0
100
200
300
400
500
GasolineVehicle
GasolineHEV
PHEV10,US mix
PHEV40,US mix
BEV,US mix
BEV,CA mix
BEV,NE mix
BEV,NGCC
WTW
GHG
em
issi
ons,
g/m
i WTP PTW
24.8 34.7 48.3 CD*
36.6 CS 83.4 CD*
27.6 CS 84.4* 84.4* 84.4* 84.4* MPGGE:
*Including charging losses (assumed 85% charging efficiency)
0.00%
0.02%
0.04%
0.06%
0.08%
0.10%
0.12%
0.14%
-400 -350 -300 -250 -200 -150 -100 -50
Prob
abili
ty o
f GH
G e
mis
sion
s cha
nge
WTW GHG emissions change relative to gasoline ICEV, g/mi
BEV, US Mix BEV,
NE Mix BEV, CA Mix
PHEV10
PHEV40
BEV, NGCC
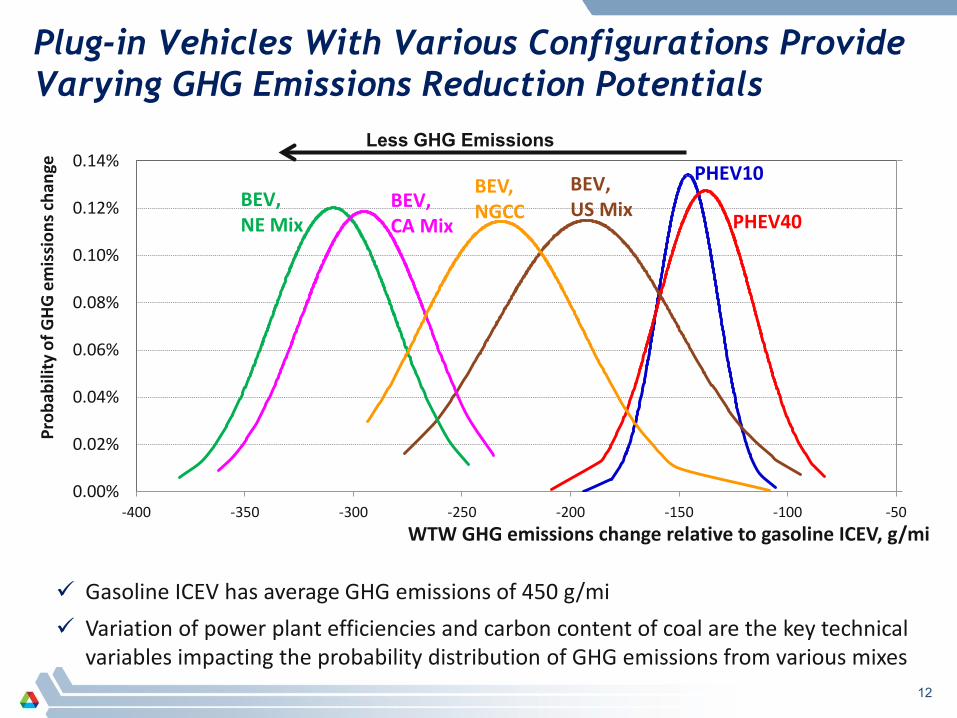
Plug-in Vehicles With Various Configurations Provide Varying GHG Emissions Reduction Potentials
Gasoline ICEV has average GHG emissions of 450 g/mi Variation of power plant efficiencies and carbon content of coal are the key technical
variables impacting the probability distribution of GHG emissions from various mixes 12
Less GHG Emissions
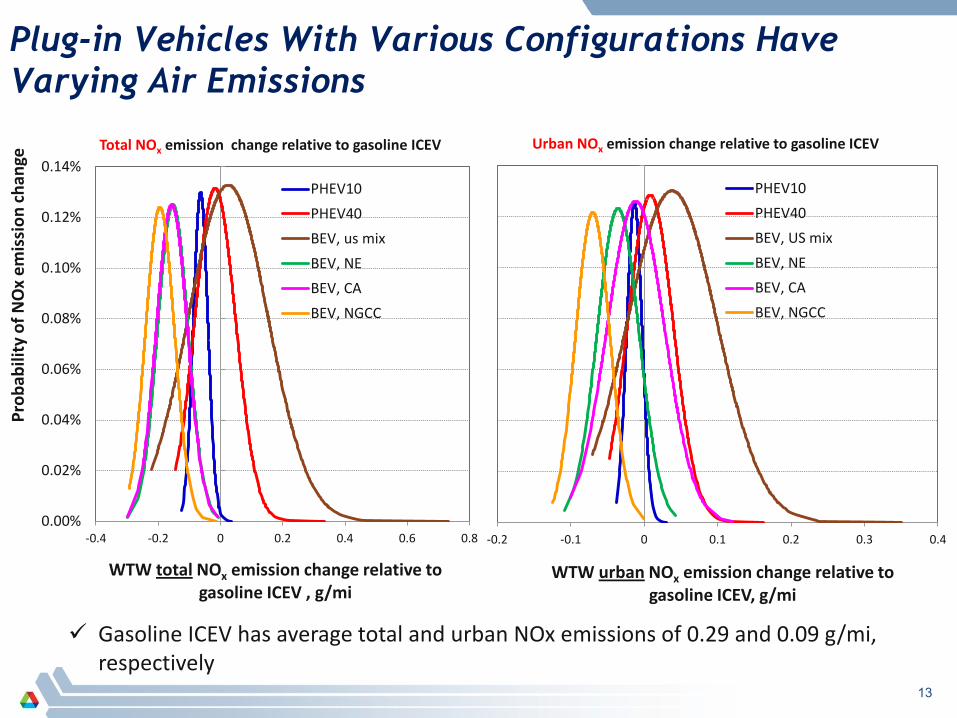
Plug-in Vehicles With Various Configurations Have Varying Air Emissions
13
0.00%
0.02%
0.04%
0.06%
0.08%
0.10%
0.12%
0.14%
-0.4 -0.2 0 0.2 0.4 0.6 0.8
Prob
abili
ty o
f NO
x em
issi
on ch
ange
WTW total NOx emission change relative to gasoline ICEV , g/mi
Total NOx emission change relative to gasoline ICEV
PHEV10PHEV40BEV, us mixBEV, NEBEV, CABEV, NGCC
-0.2 -0.1 0 0.1 0.2 0.3 0.4
WTW urban NOx emission change relative to gasoline ICEV, g/mi
Urban NOx emission change relative to gasoline ICEV
PHEV10PHEV40BEV, US mixBEV, NEBEV, CABEV, NGCC
Gasoline ICEV has average total and urban NOx emissions of 0.29 and 0.09 g/mi, respectively
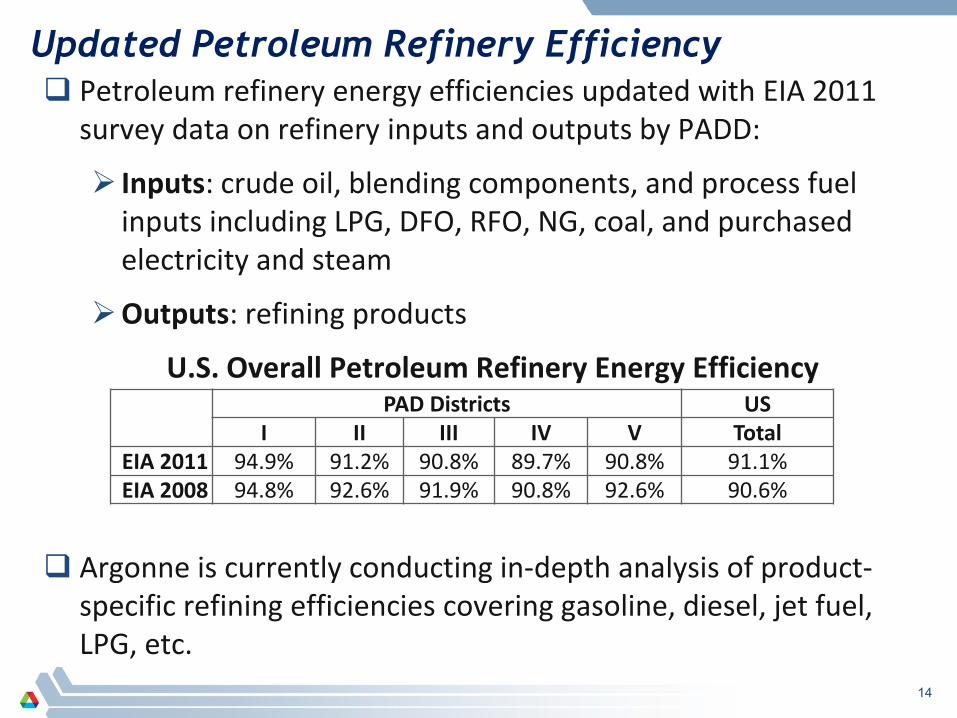
Updated Petroleum Refinery Efficiency Petroleum refinery energy efficiencies updated with EIA 2011
survey data on refinery inputs and outputs by PADD:
Inputs: crude oil, blending components, and process fuel inputs including LPG, DFO, RFO, NG, coal, and purchased electricity and steam
Outputs: refining products
U.S. Overall Petroleum Refinery Energy Efficiency
Argonne is currently conducting in-depth analysis of product-
specific refining efficiencies covering gasoline, diesel, jet fuel, LPG, etc. 14
PAD Districts US I II III IV V Total
EIA 2011 94.9% 91.2% 90.8% 89.7% 90.8% 91.1% EIA 2008 94.8% 92.6% 91.9% 90.8% 92.6% 90.6%
15
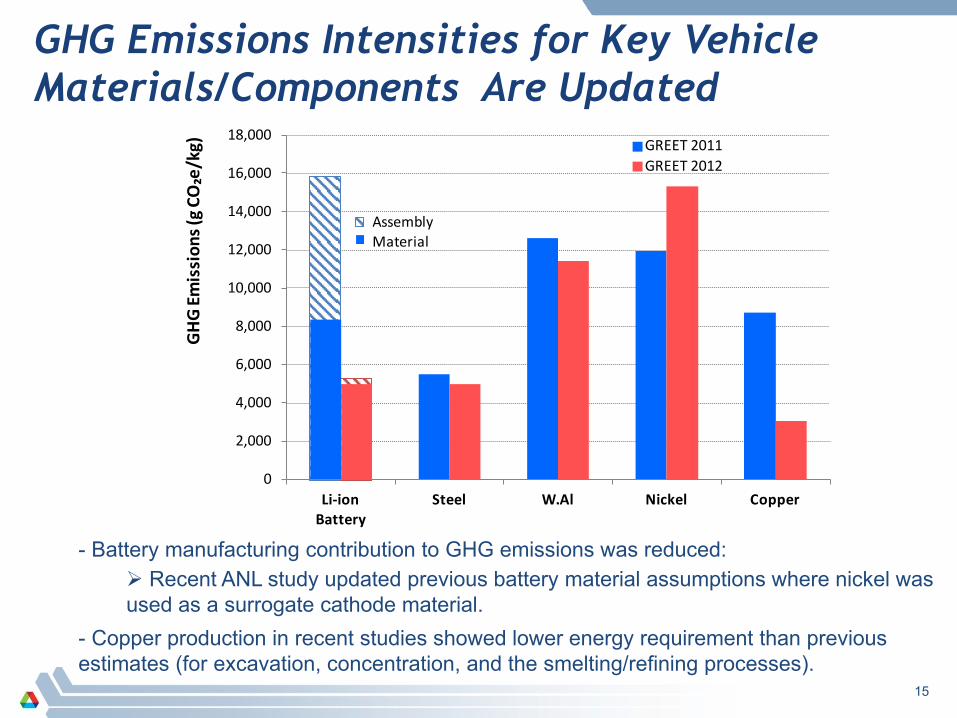
GHG Emissions Intensities for Key Vehicle Materials/Components Are Updated
0
2,000
4,000
6,000
8,000
10,000
12,000
14,000
16,000
18,000
Li-ion Battery
Steel W.Al Nickel Copper
GHG
Emis
sion
s (g C
O₂e
/kg) GREET 2011
GREET 2012
AssemblyMaterial
- Battery manufacturing contribution to GHG emissions was reduced: Recent ANL study updated previous battery material assumptions where nickel was used as a surrogate cathode material.
- Copper production in recent studies showed lower energy requirement than previous estimates (for excavation, concentration, and the smelting/refining processes).
16
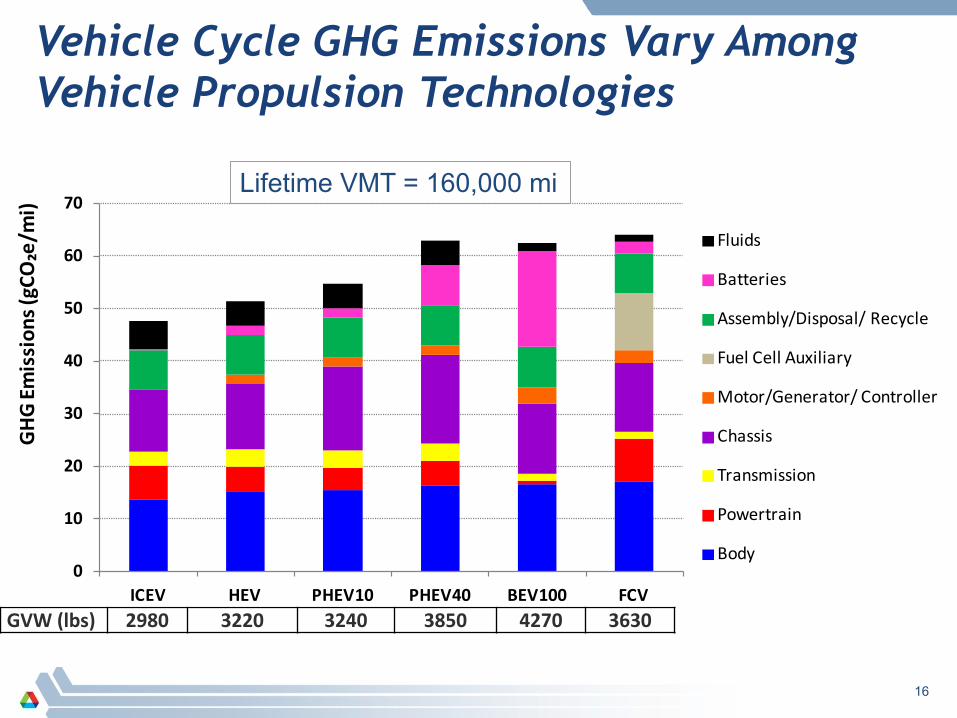
Vehicle Cycle GHG Emissions Vary Among Vehicle Propulsion Technologies
GVW (lbs) 2980 3220 3240 3850 4270 3630
0
10
20
30
40
50
60
70
ICEV HEV PHEV10 PHEV40 BEV100 FCV
GHG
Emis
sion
s (gC
O₂e
/mi)
Fluids
Batteries
Assembly/Disposal/ Recycle
Fuel Cell Auxiliary
Motor/Generator/ Controller
Chassis
Transmission
Powertrain
Body
Lifetime VMT = 160,000 mi
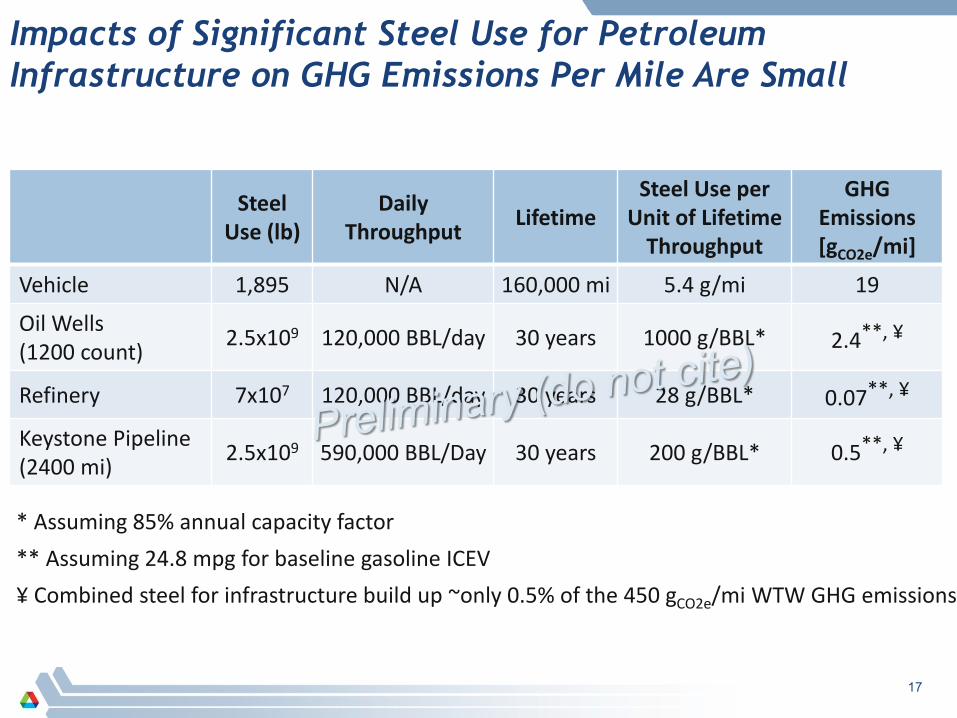
Impacts of Significant Steel Use for Petroleum Infrastructure on GHG Emissions Per Mile Are Small
* Assuming 85% annual capacity factor ** Assuming 24.8 mpg for baseline gasoline ICEV ¥ Combined steel for infrastructure build up ~only 0.5% of the 450 gCO2e/mi WTW GHG emissions
Steel Use (lb)
Daily Throughput Lifetime
Steel Use per Unit of Lifetime
Throughput
GHG Emissions [gCO2e/mi]
Vehicle 1,895 N/A 160,000 mi 5.4 g/mi 19
Oil Wells (1200 count) 2.5x10⁹ 120,000 BBL/day 30 years 1000 g/BBL* 2.4**, ¥
Refinery 7x10⁷ 120,000 BBL/day 30 years 28 g/BBL* 0.07**, ¥ Keystone Pipeline (2400 mi) 2.5x10⁹ 590,000 BBL/Day 30 years 200 g/BBL* 0.5**, ¥
17
050
100150200250300350400450500
GRE
ET.n
et R
egis
tere
d U
sers
GREET.net (Beta) Users Growth
Alpha release
Beta release
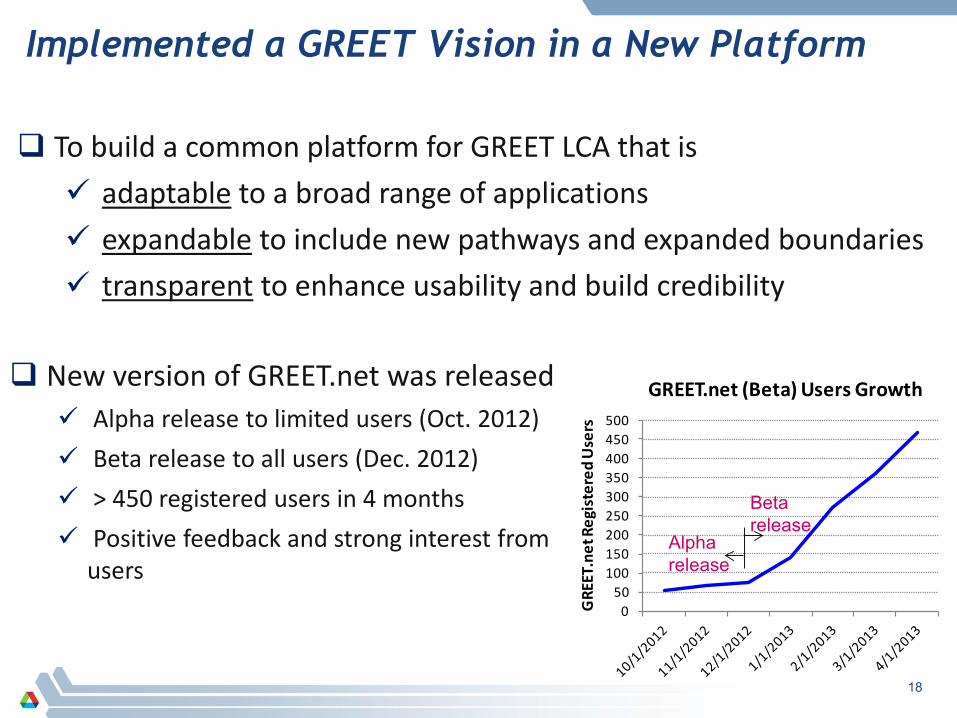
Implemented a GREET Vision in a New Platform
To build a common platform for GREET LCA that is adaptable to a broad range of applications expandable to include new pathways and expanded boundaries transparent to enhance usability and build credibility
New version of GREET.net was released Alpha release to limited users (Oct. 2012) Beta release to all users (Dec. 2012) > 450 registered users in 4 months Positive feedback and strong interest from
users
18
19
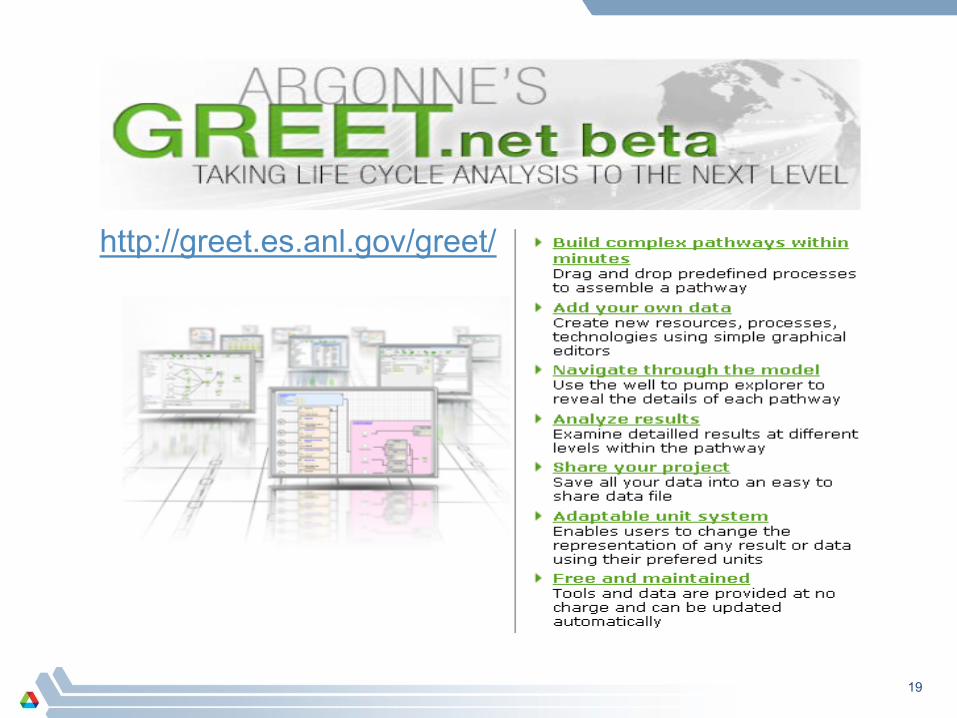
http://greet.es.anl.gov/greet/
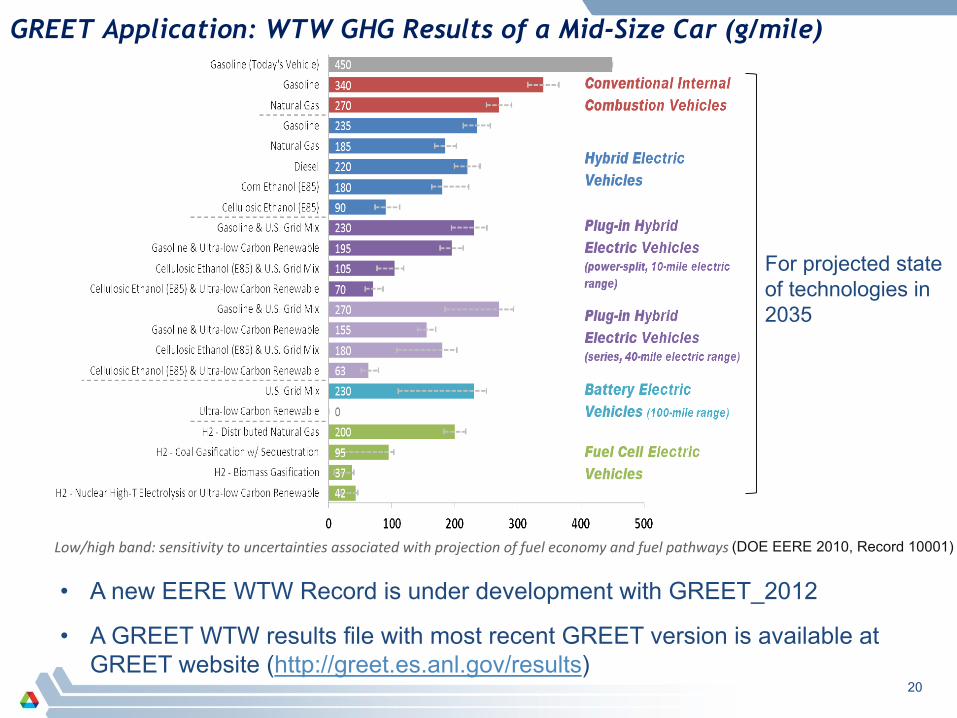
GREET Application: WTW GHG Results of a Mid-Size Car (g/mile)
(DOE EERE 2010, Record 10001)
• A new EERE WTW Record is under development with GREET_2012
• A GREET WTW results file with most recent GREET version is available at GREET website (http://greet.es.anl.gov/results)
For projected state of technologies in 2035
Low/high band: sensitivity to uncertainties associated with projection of fuel economy and fuel pathways
20
Summary Electricity sector in GREET has been expanded and updated
GHG emissions of plug-in electric vehicles with various configurations have been updated
GHG emissions intensities for key vehicle materials/components have been updated
Vehicle cycle GHG emissions have been updated for advanced vehicle technologies
GHG emissions of infrastructure build up for petroleum and natural gas production/distribution have been evaluated
GREET in a new platform has been developed and (beta) released
Argonne will continue to update and upgrade GREET to serve DOE and the community
21
Future Work
21
Update petroleum refinery efficiencies by crude type, refinery complexity and product slate
Investigate materials for vehicle lightweighting to meet future CAFE standards
Investigate LCA of water consumption for petroleum fuels and electric vehicles and add water consumption into GREET
Incorporate short-lived GHGs such as black carbon into GREET
22
23
Acronyms AEO: Annual Energy Outlook
ANL: Argonne National Laboratory
BEV: Battery Electric Vehicle
BBL: Barrels
CA: California
CAFE: Corporate Average Fuel Economy
CD: Charge Depletion operation
CS: Charge Sustaining operation
DFO: Distillate Fuel Oil
DOE: Department of Energy
EERE: Energy Efficiency and Renewable Energy
eGRID: Emissions & Generation Resource Integrated Database
EIA: Energy Information Administration
EPA: Environmental Protection Agency
FCV: Fuel Cell Vehicle
GHG: Greenhouse Gases
GREET: Greenhouse gases, Emissions, and Energy use in Transportation
HEV: Hybrid Electric Vehicle
ICEV: Internal Combustion Engine Vehicle
LCA: Life Cycle Analysis
LPG: Liquefied Petroleum Gas
Mi: Mile
MPGGE: Miles Per Gallon of Gasoline Equivalent
NE: North Eastern United State
NERC: North American Electric Reliability Corporation
NG: Natural Gas
NGCC: Natural Gas Combined Cycle
NOx: Nitrogen Oxides
PADD: Petroleum Administration for Defense Districts
PHEV10: Plug-in Hybrid Electric Vehicle with 10 miles range on urban driving cycle
PTW: Pump-To-Wheels
RFO: Residual Fuel Oil
VTP: Vehicle Technologies Program
W. Al: Wrought Aluminum
WTP: Well-To-Pump
WTW: Well-To-Wheels