Embed Size (px)
Citation preview

1
Stakeholder Advisory Group Workshop
November 2009
Greenhouse Gas Protocol
Product/Supply Chain Initiative
1© WRI & WBCSD, 2009

2
Update stakeholders on standard
development process
Explain requirements and guidance in draft
standards
Seek feedback on key decisions
Workshop Objectives
© WRI & WBCSD, 2009 2
3
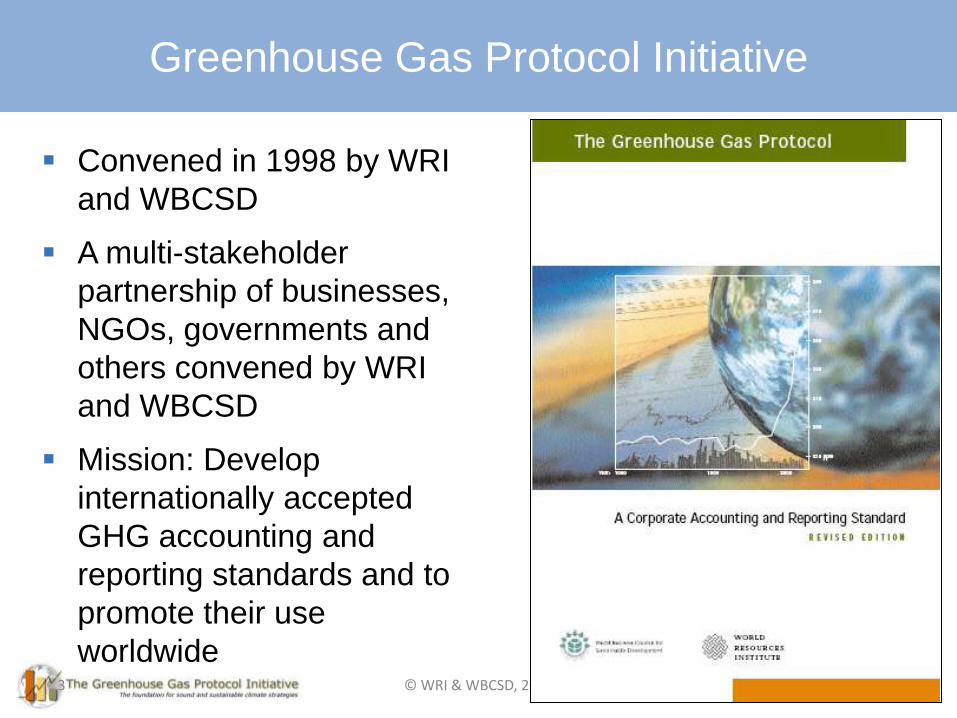
Convened in 1998 by WRI
and WBCSD
A multi-stakeholder
partnership of businesses,
NGOs, governments and
others convened by WRI
and WBCSD
Mission: Develop
internationally accepted
GHG accounting and
reporting standards and to
promote their use
worldwide
Greenhouse Gas Protocol Initiative
© WRI & WBCSD, 2009
4
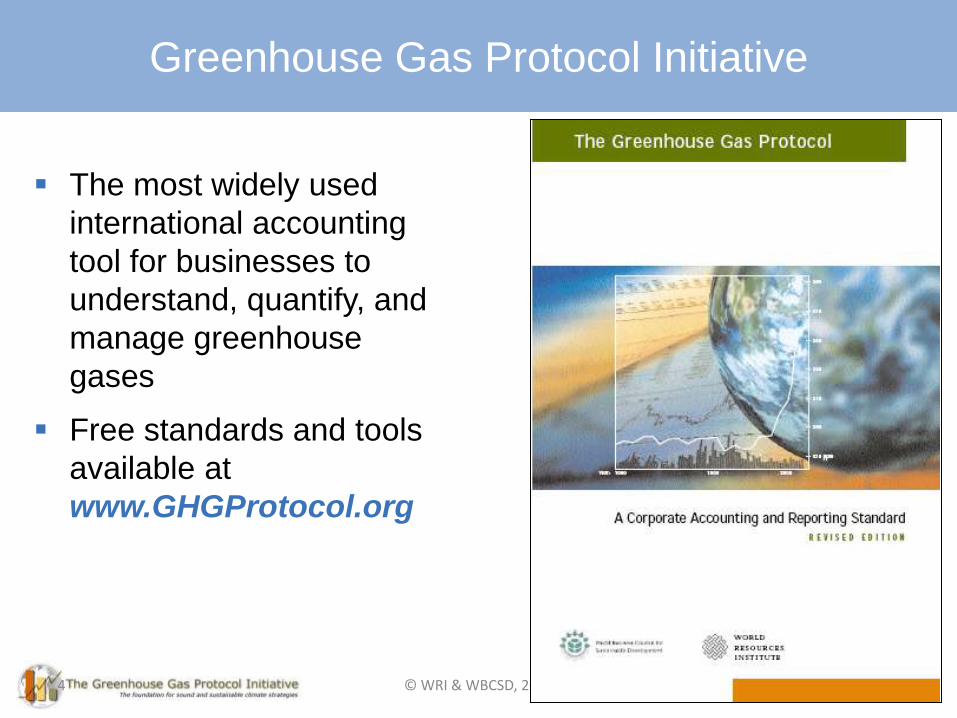
The most widely used
international accounting
tool for businesses to
understand, quantify, and
manage greenhouse
gases
Free standards and tools
available at
www.GHGProtocol.org
Greenhouse Gas Protocol Initiative
© WRI & WBCSD, 2009
5
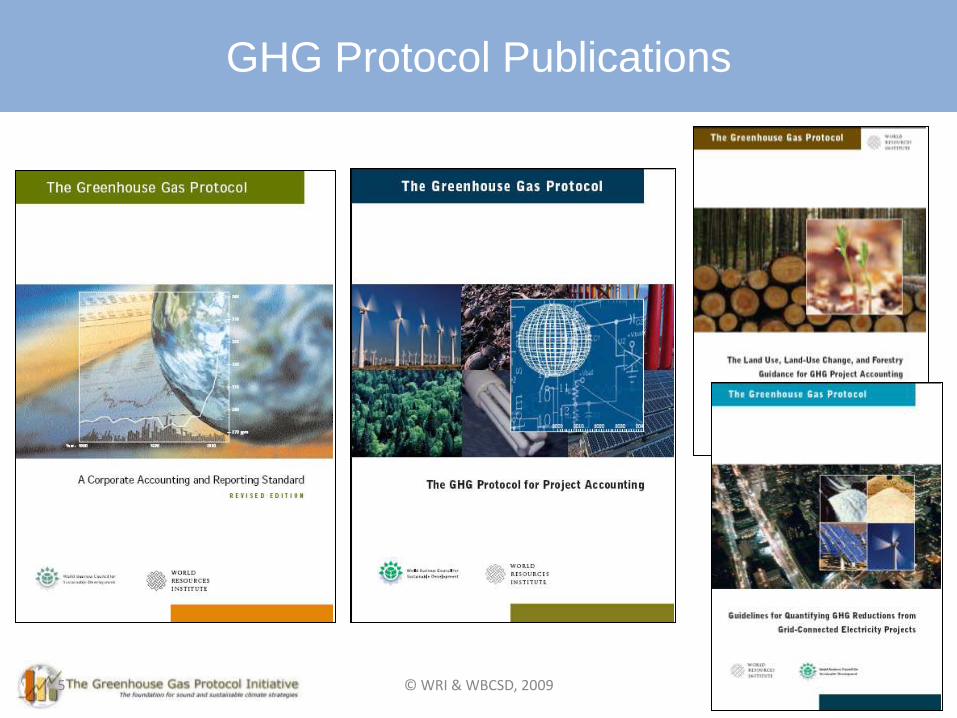
GHG Protocol Publications
© WRI & WBCSD, 2009
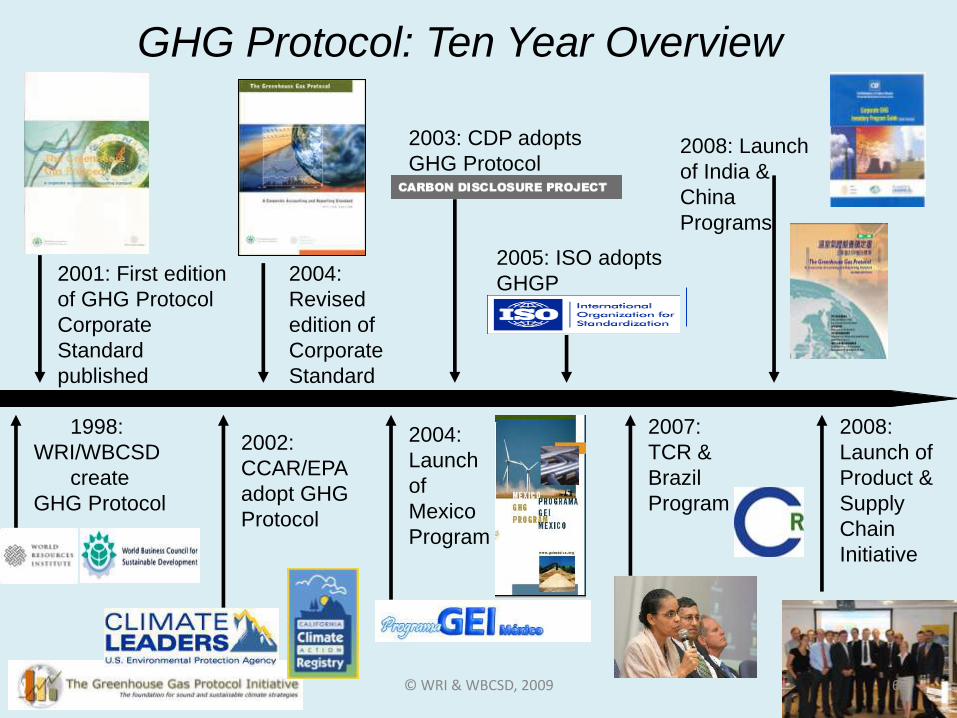
2001: First edition
of GHG Protocol
Corporate
Standard
published
2004:
Revised
edition of
Corporate
Standard
2003: CDP adopts
GHG Protocol
2005: ISO adopts
GHGP
2008: Launch
of India &
China
Programs
1998:
WRI/WBCSD
create
GHG Protocol
2002:
CCAR/EPA
adopt GHG
Protocol
2004:
Launch
of
Mexico
Program
2007:
TCR &
Brazil
Program
2008:
Launch of
Product &
Supply
Chain
Initiative
GHG Protocol: Ten Year Overview
6© WRI & WBCSD, 2009

7 7
Product
Life Cycle
Standard
New GHG Protocol Standards
Scope 3
(Corporate
Value Chain)
Standard
Under
develop-
ment
© WRI & WBCSD, 2009

Mission of Product/Supply Chain
Initiative
8
Develop internationally accepted product and
Scope 3 accounting and reporting standards
through a broad, multi-stakeholder, inclusive
process
Develop relevant, credible, and user-friendly
standards to ensure their broad adoption for
managing and mitigating emissions
Mission of Product/Supply Chain Initiative
8© WRI & WBCSD, 2009

9
New Standards in Development
Scope 3 (Corporate Value Chain)
Accounting & Reporting Standard
Quantify and report major GHG
emissions in the value chain at the
company/organization level (scope 3)
To understand, manage, and report
GHG emissions across the entire
value chain
Build on GHG Protocol Corporate
Standard
Quantify and report product-level
emissions
To understand, manage, and report
the life cycle GHG emissions
associated with individual products
Build on existing life cycle
assessment standards
Product Life Cycle
Accounting & Reporting Standard
© WRI & WBCSD, 2009 9

10
Corporate GHG management and reporting moving beyond
companies’ own operations (i.e., scope 1 and 2), toward the full
value chain
Increasing focus on GHG emissions associated with production
and consumption of goods and services
Increasing need for disclosure and management of climate-
related risk in the value chain
Increase in business-to-business requests for GHG information
throughout the supply chain
Increasing public reporting of product and scope 3 GHG
emissions
Increasing inclusion of scope 3 emissions in corporate GHG
reduction goals
Drivers for New Standards
© WRI & WBCSD, 2009 10

11
The GHG Protocol Initiative follows an independent,
multi-stakeholder, open, and inclusive process to
develop standards
Participation from businesses, government
agencies, nongovernmental organizations, and
academic institutions from around the world
Standard Development Process
© WRI & WBCSD, 2009 11
12
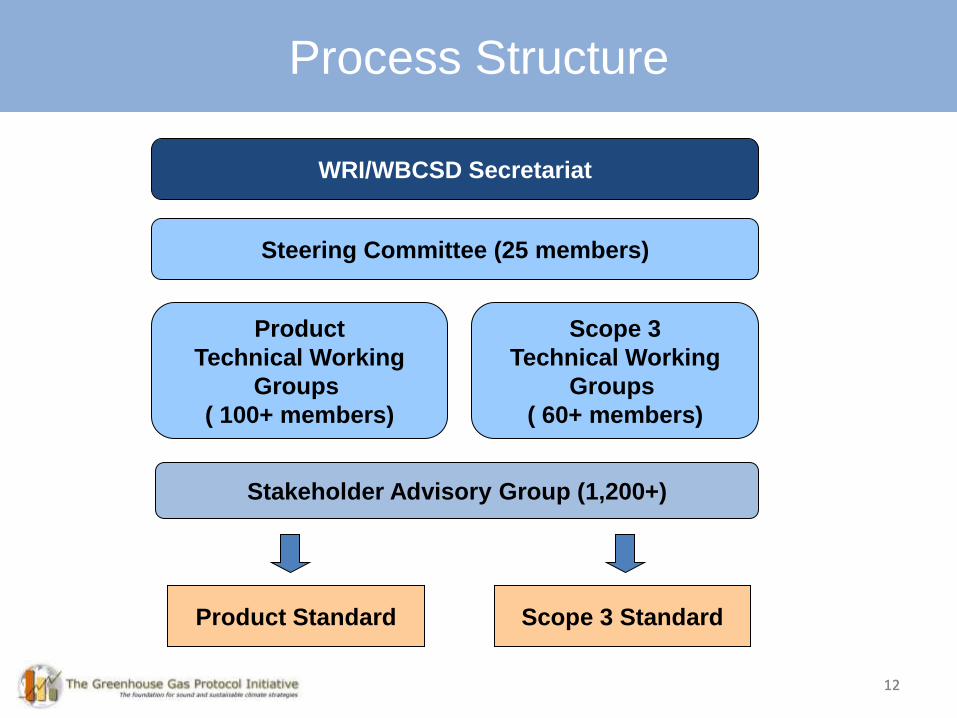
Process Structure
WRI/WBCSD Secretariat
Steering Committee (25 members)
Product
Technical Working
Groups
( 100+ members)
Scope 3
Technical Working
Groups
( 60+ members)
Stakeholder Advisory Group (1,200+)
Product Standard Scope 3 Standard
12

1313
Setting Boundaries:
What do you include in scope 3?Steering Committee Members
Alcan Packaging
Carbon Disclosure Project
Carbon Trust
Carnegie Mellon University
Dow Chemical Company
DNV
Energy Research Institute, China
Environmental Defense Fund
ERM
European Commission, Joint
Research Centre
General Electric
Georgia Pacific
Harvard School of Public Health
Natural Resources Defense Council
New Zealand Ministry of Agriculture
and Forestry
Product Carbon Footprint Pilot
Project, Germany
PricewaterhouseCoopers
Shell
Tsinghua University, China
UNEP/SETAC Life Cycle Initiative
Unilever
UK Department for Environment,
Food and Rural Affairs
US Environmental Protection Agency
ISO TC207 - US TAG
Walmart13
© WRI & WBCSD, 2009

14
Timeline
14
Date ActivityNovember 2007 Survey and consultations to assess need for new standards
September 2008 Steering Committee Meeting #1 (Washington DC)
Technical Working Group Meeting #1 (London)
January 2009 Working groups begin drafting
March 2009 Steering Committee Meeting #2 (Geneva)
June 2009 Technical Working Group Meeting #2 (Washington DC)
August 2009 Stakeholder webinar and comment period
October 2009 Steering Committee Meeting #3 (Washington DC)
November -
December 2009
First draft of standards released for stakeholder review
Five stakeholder workshops (in Berlin, Germany; Guangzhou, China;
Beijing, China; London, UK; Washington, DC, USA)
Stakeholder comment period on first drafts
January - June
2010 Pilot testing by several companies
Summer 2010 Public comment period on second drafts
December 2010 Publication of final standards

15
Scope 3 Accounting & Reporting Standard
15© WRI & WBCSD, 2009

16
Accounting for Corporate Emissions
Scope 1 emissions = All direct
emissions, i.e. owned or controlled by
your company
Scope 2 emissions = Indirect
emissions from use of electricity,
steam, heating and cooling
Scope 3 emissions = All other indirect
emissions upstream & downstream of
a company, e.g. production of
purchased goods & services; third-
party transportation; use and disposal
of a company’s products; etc.
© WRI & WBCSD, 2009 16

17
Scopes Across the Value Chain
© WRI & WBCSD, 2009 17
18 18
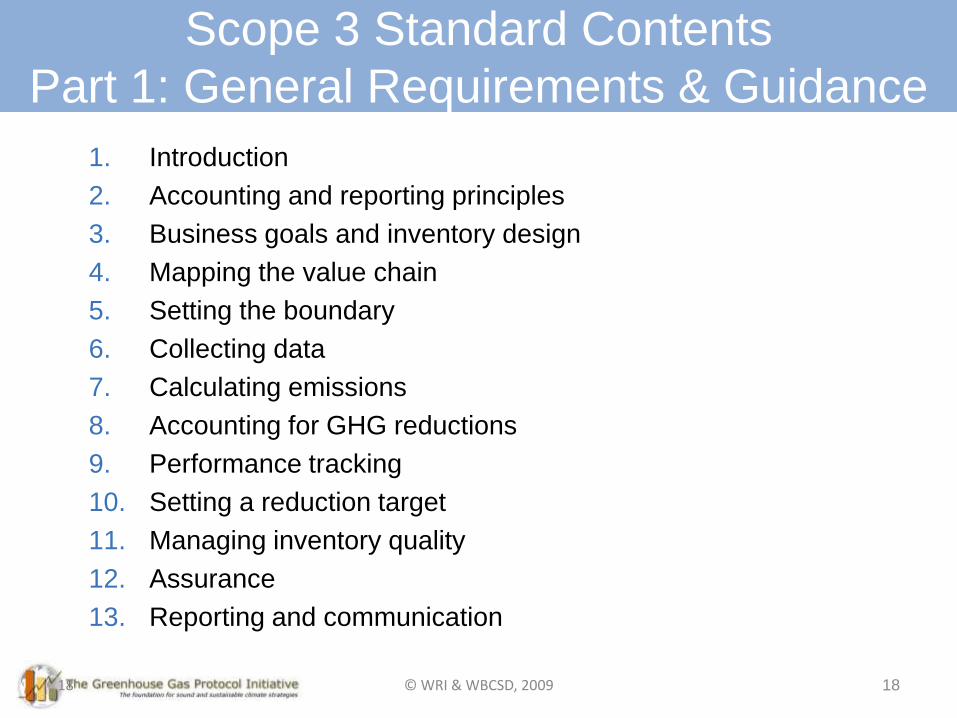
Scope 3 Standard Contents
Part 1: General Requirements & Guidance
1. Introduction
2. Accounting and reporting principles
3. Business goals and inventory design
4. Mapping the value chain
5. Setting the boundary
6. Collecting data
7. Calculating emissions
8. Accounting for GHG reductions
9. Performance tracking
10. Setting a reduction target
11. Managing inventory quality
12. Assurance
13. Reporting and communication
© WRI & WBCSD, 2009
19 19
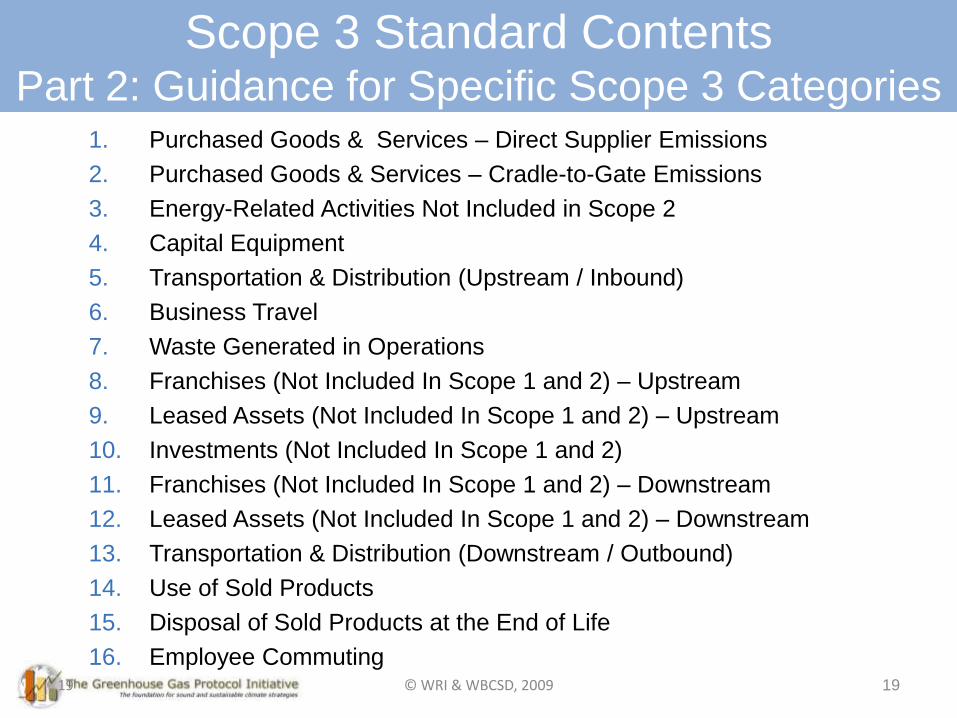
Scope 3 Standard ContentsPart 2: Guidance for Specific Scope 3 Categories
1. Purchased Goods & Services – Direct Supplier Emissions
2. Purchased Goods & Services – Cradle-to-Gate Emissions
3. Energy-Related Activities Not Included in Scope 2
4. Capital Equipment
5. Transportation & Distribution (Upstream / Inbound)
6. Business Travel
7. Waste Generated in Operations
8. Franchises (Not Included In Scope 1 and 2) – Upstream
9. Leased Assets (Not Included In Scope 1 and 2) – Upstream
10. Investments (Not Included In Scope 1 and 2)
11. Franchises (Not Included In Scope 1 and 2) – Downstream
12. Leased Assets (Not Included In Scope 1 and 2) – Downstream
13. Transportation & Distribution (Downstream / Outbound)
14. Use of Sold Products
15. Disposal of Sold Products at the End of Life
16. Employee Commuting© WRI & WBCSD, 2009

Standard Terminology
• “Shall” indicates a requirement in order to be in
conformance with the standard
• “Should” indicates a recommendation, but not a
requirement
• “May” indicates an option that is permissible or
allowable
20
Standard Terminology
© WRI & WBCSD, 2009

21 21
GHG Protocol Reporting Requirements
Report in conformance with the
GHG Protocol Corporate Standard
and Scope 3 Standard
Shall report all scope 1 and
2 emissions
Should optionally report
scope 3 emissions
Shall report all scope 1 and 2
emissions
Shall report scope 3
emissions (following the
requirements/guidance in this
standard)
Report in conformance with the
GHG Protocol Corporate Standard
© WRI & WBCSD, 2009

22
Review Principles
Chapter 2
Define Business
Goals
Chapter 3
Map the Value Chain
Chapter 4
Set the Boundary
Chapter 5
Collect Data
Chapter 6
Calculate Emissions
Chapter 7
Report Emissions
Chapter 13
Steps in Scope 3 Accounting and ReportingScope 3: Steps in Accounting & Reporting
…
© WRI & WBCSD, 2009 22

23 23
Business Goals of
Scope 3 Accounting & Reporting
A. GHG management, including identifying GHG reduction
opportunities in the value chain; guiding investment and
procurement decisions; and managing climate-related risk
B. Performance tracking, including setting a baseline, setting
GHG reduction goals, and tracking progress over time
C. Engaging partners in the value chain to expand GHG
accountability, transparency and management throughout the
value chain
D. Public reporting of GHG emissions to meet the decision-
making needs of stakeholders (e.g., policy-makers, investors,
purchasers, customers, suppliers, employees, NGOs, etc.),
as well as participation in corporate-level GHG reporting
programs and registries
© WRI & WBCSD, 2009

Principle Definition
Relevance Ensure the GHG inventory appropriately reflects the GHG emissions of the
company and serves the decision-making needs of users – both internal and
external to the company.
Completeness Account for and report on all GHG emission sources and activities within the
chosen inventory boundary. Disclose and justify any specific exclusions.
Consistency Use consistent methodologies to allow for meaningful comparisons of
emissions over time. Transparently document any changes to the data,
inventory boundary, methods, or any other relevant factors in the time series.
Transparency Address all relevant issues in a factual and coherent manner, based on a
clear audit trail. Disclose any relevant assumptions and make appropriate
references to the accounting and calculation methodologies and data sources
used.
Accuracy Ensure that the quantification of GHG emissions is systematically neither over
nor under actual emissions, as far as can be judged, and that uncertainties
are reduced as far as practicable. Achieve sufficient accuracy to enable users
to make decisions with reasonable assurance as to the integrity of the
reported information.
Accounting & Reporting Principles
24© WRI & WBCSD, 2009

25 25
Mapping the Value Chain:
Upstream & Downstream Emissions
A. Upstream emissions are the emissions that occur in the life cycle of
purchased or acquired goods, services, materials, and fuels up
through receipt by the reporting company
― These include the emissions of your suppliers
B. Downstream emissions are the emissions that occur in the life
cycle of sold goods and services subsequent to sale by the
reporting company
― These include the emissions of your customers
C. Other scope 3 emissions: employee commuting
© WRI & WBCSD, 2009

26 26
Mapping the Value Chain:
Upstream & Downstream
Emissions
Associated With
What The
Company:
Value Chain
Position:
Scope 1
Emissions of:
Accounted by
the Reporting
Company As:
UpstreamOwn
OperationsDownstream
PurchasesOwns or Controls
Sells
SuppliersReportingCompany
Customers
Scopes 2 and 3 Scope 1 Scope 3
© WRI & WBCSD, 2009

27
Tier 1 Suppliers
Reporting Company
CradleGrave
Cradle to Gate emissions of
purchased products and services
Gate to Grave emissions from
sold products and services
Gate
Gate
Raw Materials
Energy Activities
Capital Equipment
Transportation
Product Distribution
Product Use
Product Disposal
Scope 2 and 3 Scope 3Scope 1
Purchase Sale
Emissions from the
company’s operations
© WRI & WBCSD, 2009

Scope 1
Corporate Boundary
Emissions from sources
owned or controlled by the
company (including stationary
combustion, mobile
combustion, process, &
fugitive emissions)
UPSTREAM ACTIVITIES
Employee commuting
Leased assets
(reported by lessee)
Transportation & distribution of sold
products, including warehousing &
retail, not included in scope 1 &2
Use of sold
products &
services
Disposal of
sold
products at
the end of
their life
Scope 3
Scope 1
Scope 2
Leased assets (reported by lessor)
Franchises (reported
by franchisee)
Franchises (reported by franchisor)
DOWNSTREAM ACTIVITIES
Scope 2
Generation of
purchased electricity,
steam, heating &
cooling for own
consumption
Energy-related scope 3
emissions: T&D losses;
extraction, production
& transport of fuels
used in generation;
purchased power sold
to end users
Extraction and
production of inputs
(Direct suppliers: tier 1)
Transportation &
distribution of inputs,
including warehousing
Disposal of waste
generated in the
production of inputs
Capital equipment
Business travel
Disposal/treatment and
of waste generated in
operations
Extraction and
production of inputs
(Upstream suppliers:
tier 2, 3, 4…)
Supplier capital
equipment
Sale2Purchase1
Directly PurchasedFurther Upstream
Further
Downstream
1 Receipt of purchased goods and services
2 Delivery of sold goods and services
Transportation &
distribution of inputs,
including warehousing
Investments (equity,
fixed asset), not
included in scope 1 & 2
Generation of energy
consumed by suppliers
28© WRI & WBCSD, 2009
29 29
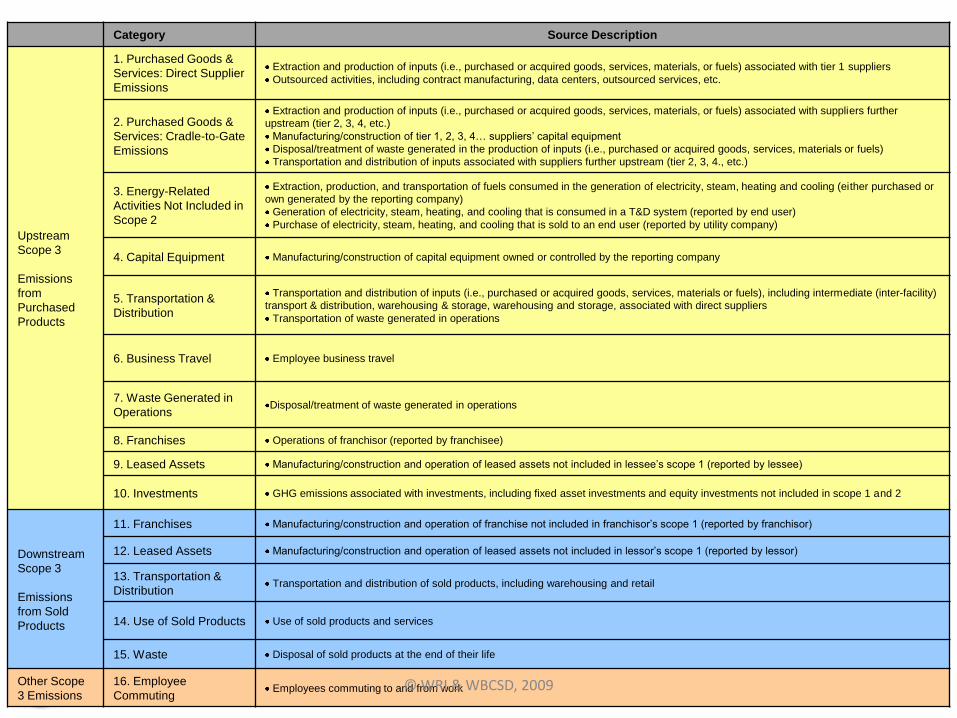
Category Source Description
Upstream
Scope 3
Emissions
from
Purchased
Products
1. Purchased Goods &
Services: Direct Supplier
Emissions
Extraction and production of inputs (i.e., purchased or acquired goods, services, materials, or fuels) associated with tier 1 suppliers
Outsourced activities, including contract manufacturing, data centers, outsourced services, etc.
2. Purchased Goods &
Services: Cradle-to-Gate
Emissions
Extraction and production of inputs (i.e., purchased or acquired goods, services, materials, or fuels) associated with suppliers further
upstream (tier 2, 3, 4, etc.)
Manufacturing/construction of tier 1, 2, 3, 4… suppliers’ capital equipment
Disposal/treatment of waste generated in the production of inputs (i.e., purchased or acquired goods, services, materials or fuels)
Transportation and distribution of inputs associated with suppliers further upstream (tier 2, 3, 4., etc.)
3. Energy-Related
Activities Not Included in
Scope 2
Extraction, production, and transportation of fuels consumed in the generation of electricity, steam, heating and cooling (either purchased or
own generated by the reporting company)
Generation of electricity, steam, heating, and cooling that is consumed in a T&D system (reported by end user)
Purchase of electricity, steam, heating, and cooling that is sold to an end user (reported by utility company)
4. Capital Equipment Manufacturing/construction of capital equipment owned or controlled by the reporting company
5. Transportation &
Distribution
Transportation and distribution of inputs (i.e., purchased or acquired goods, services, materials or fuels), including intermediate (inter-facility)
transport & distribution, warehousing & storage, warehousing and storage, associated with direct suppliers
Transportation of waste generated in operations
6. Business Travel Employee business travel
7. Waste Generated in
OperationsDisposal/treatment of waste generated in operations
8. Franchises Operations of franchisor (reported by franchisee)
9. Leased Assets Manufacturing/construction and operation of leased assets not included in lessee’s scope 1 (reported by lessee)
10. Investments GHG emissions associated with investments, including fixed asset investments and equity investments not included in scope 1 and 2
Downstream
Scope 3
Emissions
from Sold
Products
11. Franchises Manufacturing/construction and operation of franchise not included in franchisor’s scope 1 (reported by franchisor)
12. Leased Assets Manufacturing/construction and operation of leased assets not included in lessor’s scope 1 (reported by lessor)
13. Transportation &
DistributionTransportation and distribution of sold products, including warehousing and retail
14. Use of Sold Products Use of sold products and services
15. Waste Disposal of sold products at the end of their life
Other Scope
3 Emissions
16. Employee
CommutingEmployees commuting to and from work© WRI & WBCSD, 2009

30
After mapping the value chain, companies should identify which scope 3
emissions are most relevant for the company
Companies shall account for and report all relevant scope 3 emissions of
the reporting company
Relevance means the GHG inventory:
Appropriately reflects the GHG emissions of the company, and
Serves the decision-making needs of users – both internal and
external to the company
Which scope 3 activities are most relevant differs by industry sector and
by reporting company
Setting the Boundary
© WRI & WBCSD, 2009 30

31
Scope 3 activities shall be considered relevant and reported if they are
large (or expected to be large) compared to the reporting company’s other
sources of emissions
To determine which scope 3 activities are most significant in size,
companies should follow these steps:
1. Use screening methods to individually estimate the emissions from all
scope 3 activities (examples provided in Part 2 of the standard for
each category)
2. Express each individual scope 3 activity’s estimated emissions as a
fraction of total anticipated scope 3 emissions
3. Rank all scope 3 activities from largest to smallest to determine which
activities are most significant
Setting the Boundary
© WRI & WBCSD, 2009 31

32
Companies shall account for and report:
The largest scope 3 sources that collectively account for at least
80%* of total anticipated scope 3 emissions;
The use phase emissions of select product types; and
All scope 1 and scope 2 emissions, as required by the GHG
Protocol Corporate Standard
* The selection of an 80% threshold is tentative pending road testing
Setting the Boundary: Boundary Requirements
© WRI & WBCSD, 2009 32
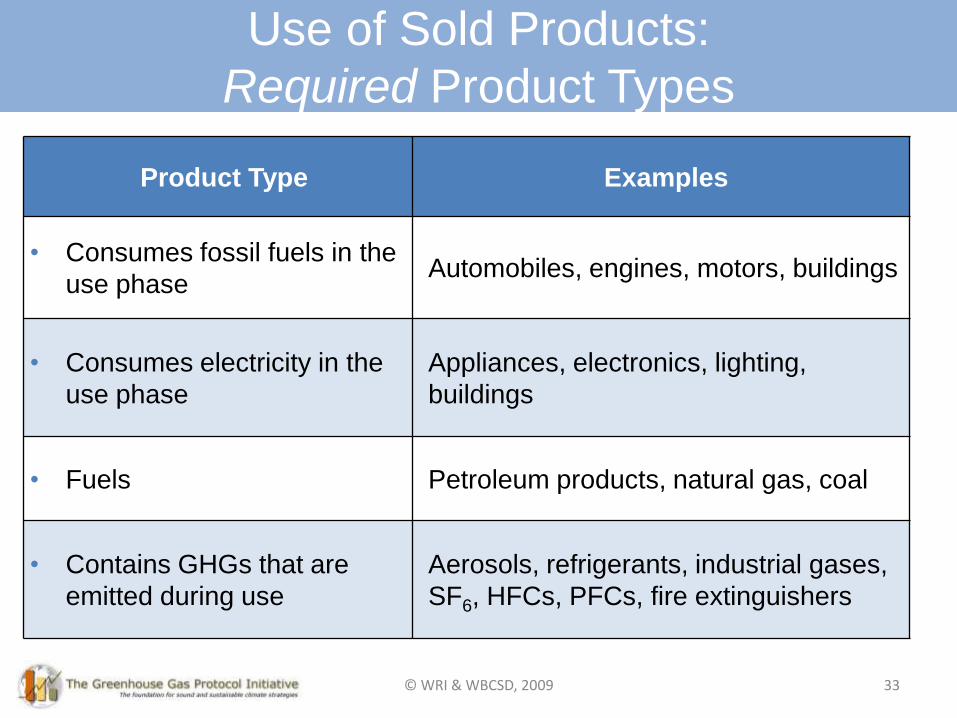
33
Product Type Examples
• Consumes fossil fuels in the
use phaseAutomobiles, engines, motors, buildings
• Consumes electricity in the
use phase
Appliances, electronics, lighting,
buildings
• Fuels Petroleum products, natural gas, coal
• Contains GHGs that are
emitted during use
Aerosols, refrigerants, industrial gases,
SF6, HFCs, PFCs, fire extinguishers
Use of Sold Products:
Required Product Types
© WRI & WBCSD, 2009

34
Product Type Examples
• Indirectly consumes energy in the
use phase
Pots & pans (heating), textiles
(washing), food (refrigeration)
• Other products that emit GHGs
directly or indirectly during use
Fertilizers
Financial products/services
• When used, reduces the GHGs
of other entities compared to a
baseline
Wind turbine or solar panel
(compared to coal plant); ICT
(compared to air travel); CFL bulb
(compared to incandescent bulb)
• No GHG impact in the use phase Furniture
• Raw materials and intermediate
goods where the eventual end
use is unknown
Iron ore, cement
Use of Sold Products:
Optional Product Types
© WRI & WBCSD, 2009

35
Prioritizing Relevant Emissions
Based on Other Criteria
• Additional scope 3 activities (below the threshold) should be
considered relevant if they meet any of the following criteria:
Criteria Description
Influence There are potential emissions reductions that could be
undertaken or influenced by the company
Risk They contribute to the company’s risk exposure
Stakeholders They are deemed critical by key stakeholders (e.g.
customers, suppliers, investors or civil society)
Outsourcing They are outsourced activities typically insourced by
other companies in the reporting company’s sector
Other They meet additional criteria developed by the company
or industry sector
35© WRI & WBCSD, 2009

36
Collecting Data
Four-step process for collecting and evaluating data:
Prioritize
activities
1
Assess
data sources
2
Collect
data
3
Evaluate
collected data
4
© WRI & WBCSD, 2009

37
Collecting Data: Data Types
Data Type Description Examples
Primary Data
Observed data collected from
specific facilities owned or
operated by the reporting
company or a company in its
supply chain
The reporting company
surveys its suppliers and
collects product-level data
or scope 1 and 2
emissions data from
specific facilities in its
supply chain.
Secondary Data
Generic or industry average data
from published sources that are
representative of a company’s
operations, activities, or products
Data from life cycle
inventory databases,
literature studies,
environmentally-extended
input-output models;
default IPCC emission
factors; industry
associations; etc.
© WRI & WBCSD, 2009
38
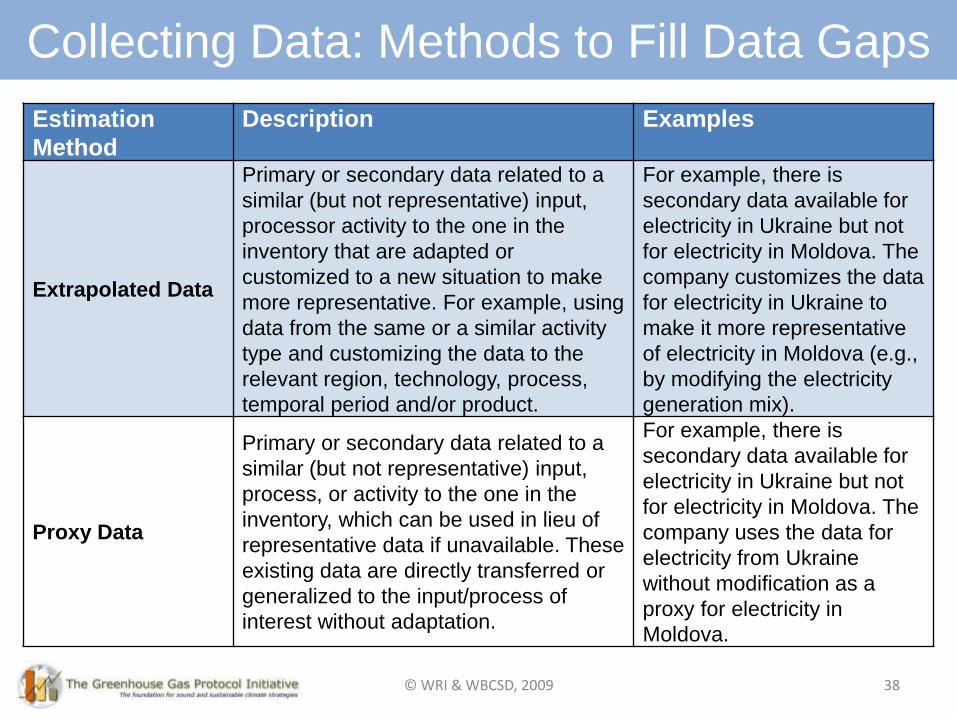
Collecting Data: Methods to Fill Data Gaps
Estimation
Method
Description Examples
Extrapolated Data
Primary or secondary data related to a
similar (but not representative) input,
processor activity to the one in the
inventory that are adapted or
customized to a new situation to make
more representative. For example, using
data from the same or a similar activity
type and customizing the data to the
relevant region, technology, process,
temporal period and/or product.
For example, there is
secondary data available for
electricity in Ukraine but not
for electricity in Moldova. The
company customizes the data
for electricity in Ukraine to
make it more representative
of electricity in Moldova (e.g.,
by modifying the electricity
generation mix).
Proxy Data
Primary or secondary data related to a
similar (but not representative) input,
process, or activity to the one in the
inventory, which can be used in lieu of
representative data if unavailable. These
existing data are directly transferred or
generalized to the input/process of
interest without adaptation.
For example, there is
secondary data available for
electricity in Ukraine but not
for electricity in Moldova. The
company uses the data for
electricity from Ukraine
without modification as a
proxy for electricity in
Moldova.
© WRI & WBCSD, 2009

39
Collecting Data
• As a general rule, companies should apply the
following hierarchy in collecting data:
1. Primary data
2. Secondary data
3. Extrapolated data
4. Proxy data
© WRI & WBCSD, 2009

3. Are extrapolated
data or proxy data
available of
sufficient quality?
2. Is secondary data
available of
sufficient quality?
1a. Is the value
chain partner able
and willing to
supply primary
data of sufficient
quality?
5. Calculate, roll-
up and report
emissions
6. Report data gap
Y Y
1b. Can primary
data be combined
with one or more of
the other data types
of sufficient quality?
2b. Can the secondary
data be combined with
the use of extrapolated
data or proxy data to
obtain sufficient data
quality?
Y Y
N NN N
YN
Collecting Data: Decision Tree
40© WRI & WBCSD, 2009

• When collecting primary data from value chain partners,
companies should obtain the most product-specific data
available, according to the following hierarchy:
1. Product-level data
2. Process-level data
3. Facility-level data
4. Business unit-level data
5. Corporate-level data
41
Collecting Supplier Data
© WRI & WBCSD, 2009

42
•The degree to which the data represents the relevant activity
•The percentage of locations for which site specific or generic data are available and used
out of the total number that relate to a specific activity. Generally, a percent target is
identified for the number of sites from which data is collected for each activity
Technological
representativeness
Completeness
•Degree to which the data set reflects the actual technology(ies) used
Criteria Description
Temporal
representativeness
•Degree to which the data set reflects the actual time (e.g., year) or age of
the activity or whether an appropriate time period is used (e.g.,
annual/seasonal averages may be appropriate to smooth out data variability
due to factors such as weather conditions)
Geographical
representativeness
•Degree to which the data set reflects actual geographic location of the
activity, e.g., country or site
Precision
•Measure of the variability of the data points used to derive the GHG
emissions from an activity (e.g., low variance = high precision). Relates
mostly to where direct measurements have been used.
Data Quality Criteria
© WRI & WBCSD, 2009

A public GHG emissions report shall include:
Total scope 1 emissions, total scope 2 emissions, and all required scope
3 emissions, separately reported for each scope
Emissions for all six Kyoto GHGs (CO2, CH4, N2O, HFCs, PFCs, SF6)
Scope 3 emissions reported separately for each scope 3 category
List of excluded scope 3 emission sources with justification
Emissions reported separately for sources calculated using primary data
and sources calculated using secondary data
Methodologies used to calculate or measure emissions
Description of the uncertainties of reported emissions data
Summary of data types used to calculate the inventory (e.g., the
percentages of scope 3 emissions calculated using primary data,
secondary data, and extrapolated/proxy data)
43
Reporting Requirements
© WRI & WBCSD, 2009

44
Illustrative GHG Reporting Form Primary Secondary Total Uncertainty
Scope 1: Direct Emissions from Owned/Controlled Operations
Scope 2: Indirect Emissions from the Use of Purchased
Electricity, Steam, Heating and Cooling
Scope 3: Other Indirect Emissions
a. Indirect Emissions from Purchased Products (Upstream)
1. Purchased Goods & Services (Cradle-to-Gate Emissions)
(Not Otherwise Included in Categories 2-10)
2. Energy-Related Emissions (Not Included in Scope 2)
3. Capital Equipment
4. Transportation & Distribution
5. Waste Generated in Operations
6. Business Travel
7. Franchises (Not Included in Scope 1 or 2)
8. Leased Assets (Not Included in Scope 1 or 2)
9. Investments (Not Included in Scope 1 or 2)
10. Other
b. Indirect Emissions from Sold Products (Downstream)
1. Franchises (Not Included in Scope 1 or 2
2. Leased Assets (Not Included in Scope 1 or 2
3. Distribution of Sold Products
4. Use of Sold Products
5. Disposal of Sold Products at the End of Life
6. Other
c. Other Indirect Emissions
1. Employee Commuting
2. Other
Direct (Tier 1) Supplier Emissions N/A
% of suppliers accounted for (as a % of total spend)
CO2 from Biomass Combustion 44© WRI & WBCSD, 2009
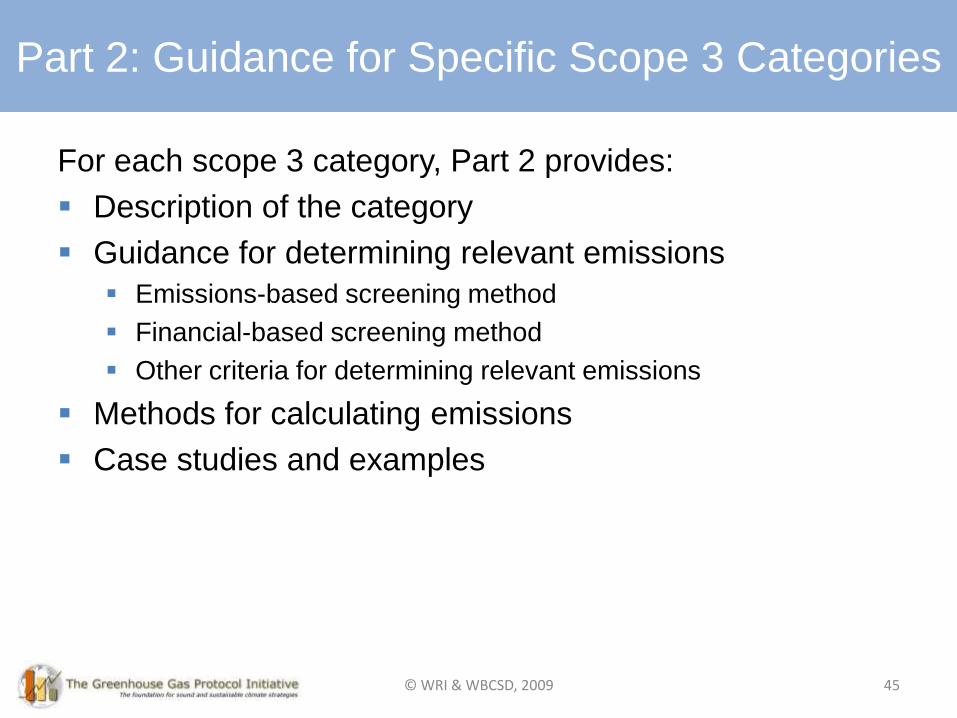
For each scope 3 category, Part 2 provides:
Description of the category
Guidance for determining relevant emissions
Emissions-based screening method
Financial-based screening method
Other criteria for determining relevant emissions
Methods for calculating emissions
Case studies and examples
45
Part 2: Guidance for Specific Scope 3 Categories
© WRI & WBCSD, 2009

46
Product Life Cycle
Accounting & Reporting Standard
46© WRI & WBCSD, 2009

Goal and Scope
47
The primary goal of the standard is public disclosure of
product level GHG emissions
Implementing the standard may support additional
business goals:
Identification of GHG reduction opportunities in the
supply chain of a product
Performance tracking
Supply chain engagement and improved disclosure
practices
Product differentiation
The standard is intended for all product types and for
companies in all sectors and sizes
Goal & Scope of Product Standard
© WRI & WBCSD, 2009

Goal and Scope
• The standard does not fully support product comparison
• Valid product comparison, comparative assertion, and labeling
require more sector-specific detail than is provided in the
standard
• The standard will include guidance on how programs,
product category rule (PCR) developers and
organizations can create sector level consistency so that
valid product comparisons and claims can be made
48
Goal & Scope of Product Standard
© WRI & WBCSD, 2009

Principle Definition
Relevance Ensure the product GHG report serves the decision-making needs of all
users identified within the report.
Present information in the report in a way that is readily understandable
by the intended users.
Completeness Ensure that the GHG report covers all product life cycle emissions within
the specified boundaries
Consistency Use methodologies to allow for meaningful comparisons of subsequent
GHG inventories over time.
Transparency Address and document all relevant issues in a factual and coherent
manner, based on a clear audit trail.
Accuracy Ensure that reported GHG emissions are not consistently greater than or
less than actual emissions and that uncertainties are reduced as far as
practicable.
Achieve sufficient accuracy to enable users to make decisions with
reasonable assurance as to the reliability of the reported information.
Accounting & Reporting Principles
49© WRI & WBCSD, 2009

Steps to Performing a GHG Inventory
50
Establish the
Method-ology
Define the Functional
Unit
Set the Boundary
Collect Data
Allocate Emissions
Assess Data
Quality
Calculate GHG
Emissions
Conduct Assurance
Report the GHG
Inventory
Steps to Conducting a GHG Inventory
© WRI & WBCSD, 2009

51
Life Cycle Approach
© WRI & WBCSD, 2009

• Companies shall follow the process life cycle accounting approach
Quantify and aggregate the emissions from each specific process within
the established boundary
• Companies shall report emissions of all six Kyoto Protocol
greenhouse gases
• Companies shall use an attributional approach to assign life cycle
GHG emissions to an individual product
An attributional approach provides information about the GHGs emitted
directly by a product and its lifecycle
Companies should consult existing sector specific or program guidance
to determine if any indirect or consequential emissions sources are
applicable to a specific product
52
Establishing the Methodology
© WRI & WBCSD, 2009

• Companies shall define the unit of analysis as the
functional unit of the product
• Companies shall indentify the following elements when
determining the functional unit:
– The function or performance characteristics provided by the
product system
– Reference flow (i.e., amount of product necessary to fulfill the
function and the quantity to which assessment results will be
normalized)
– Relevance to the study goal (i.e., why a particular functional unit
was chosen in the context of a particular goal)
53
Defining the Functional Unit
© WRI & WBCSD, 2009
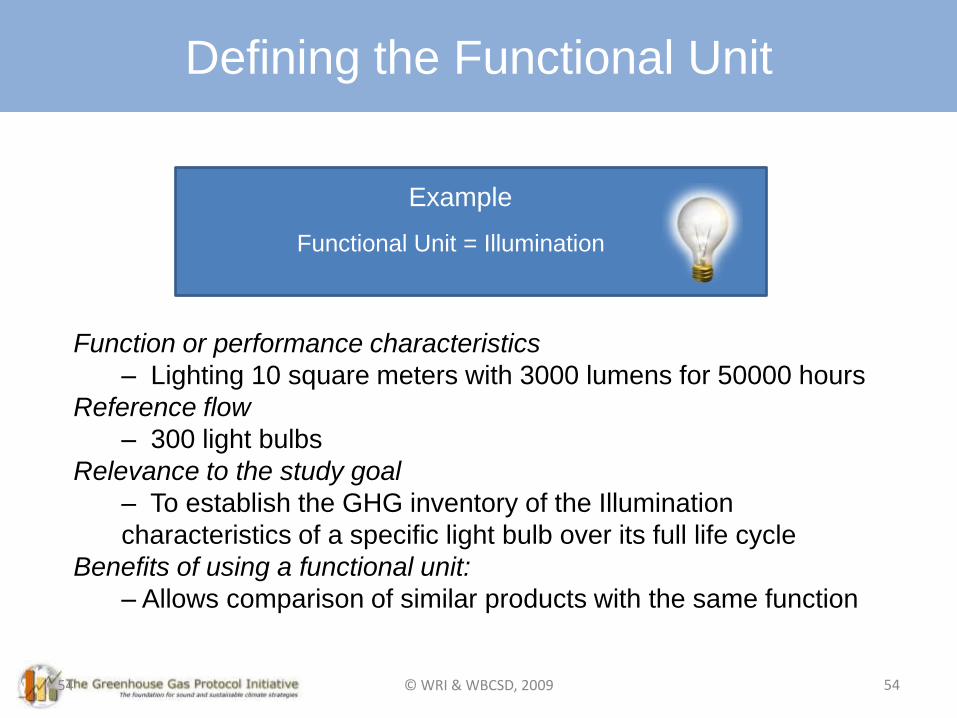
54
Defining the Functional Unit
Functional Unit = Illumination
54
Function or performance characteristics
– Lighting 10 square meters with 3000 lumens for 50000 hours
Reference flow
– 300 light bulbs
Relevance to the study goal
– To establish the GHG inventory of the Illumination
characteristics of a specific light bulb over its full life cycle
Benefits of using a functional unit:
– Allows comparison of similar products with the same function
Example
© WRI & WBCSD, 2009

Key Requirements: Setting the Boundary
• Companies shall account for all processes that are directly
connected over the product’s life cycle by material or energy flows
• Capital goods shall be included in the product system if deemed
significant for the studied product or product sector
• Facility operations and corporate activities not directly connected to
the product are optional
• Companies shall conduct a cradle-to-grave assessment for all final
products
• Companies may conduct a cradle-to-gate assessment for
intermediate products when the eventual fate of a product is
unknown
55
Setting the Boundary
© WRI & WBCSD, 2009
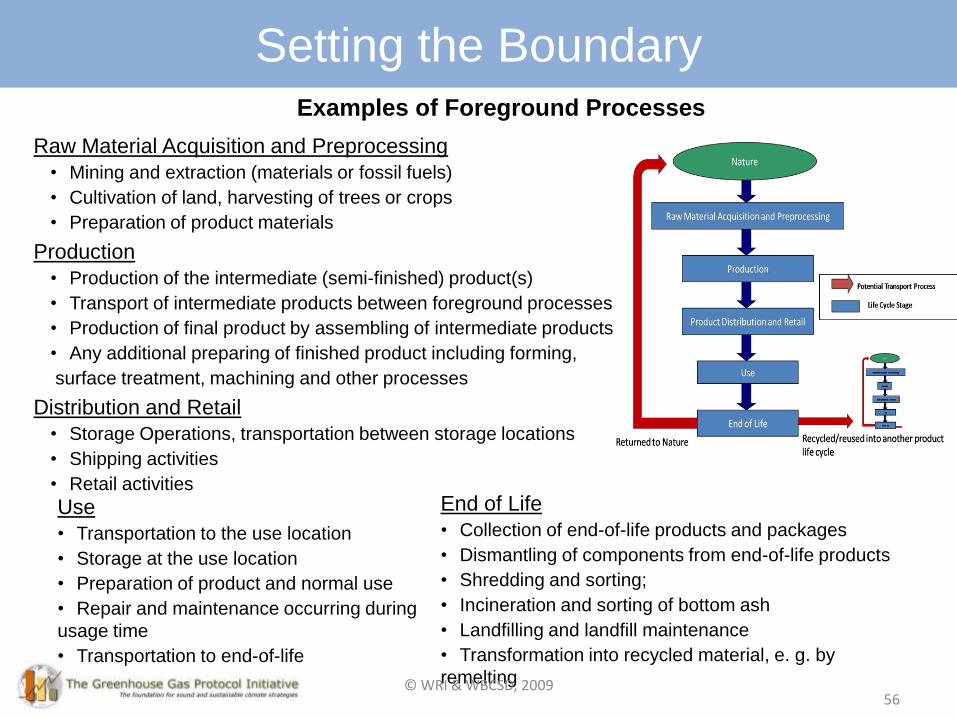
56
Raw Material Acquisition and Preprocessing
• Mining and extraction (materials or fossil fuels)
• Cultivation of land, harvesting of trees or crops
• Preparation of product materials
Production
• Production of the intermediate (semi-finished) product(s)
• Transport of intermediate products between foreground processes
• Production of final product by assembling of intermediate products
• Any additional preparing of finished product including forming,
surface treatment, machining and other processes
Distribution and Retail
• Storage Operations, transportation between storage locations
• Shipping activities
• Retail activities
Use
• Transportation to the use location
• Storage at the use location
• Preparation of product and normal use
• Repair and maintenance occurring during
usage time
• Transportation to end-of-life
End of Life
• Collection of end-of-life products and packages
• Dismantling of components from end-of-life products
• Shredding and sorting;
• Incineration and sorting of bottom ash
• Landfilling and landfill maintenance
• Transformation into recycled material, e. g. by
remelting
Examples of Foreground Processes
Setting the Boundary
© WRI & WBCSD, 2009

Setting the Boundary: Capital Goods
Sector
Capital Goods
Impact on Climate Change
fossil energy minor
nuclear energy substantial
biomass energy substantial
renewable energy, not else
covered
(hydro, wind, solar)major
metals minor
mineral construction materials minor
wood products minor
agricultural products minor
transport services substantial
waste incineration minor
landfilling substantial
wastewater treatment major
57
The influence of Capital Goods on
Specific Sectors (Frieschknecht et al., 2007)
• Companies shall include capital goods if
significant; companies may exclude capital
goods if determined to be insignificant
• Companies are encouraged to collect data
or estimate emissions for capital goods
before testing significance
• Companies shall first look to sector-specific
guidance or literature to determine
qualitative significance
• If no information is available, use a
quantitative significance test
Setting the Boundary:
Capital Goods
© WRI & WBCSD, 2009

Setting the Boundary: Intermediate Products
• Companies should first try to identify
a use and end-of-life profile for the
product
• If not possible, a company may
perform a cradle-to-gate inventory
• The inventory report shall:
– Clearly state that a cradle-to-
gate inventory was performed
– Justify why a cradle-to-grave
inventory was not applicable
58
Intermediate products: goods and services that are used as inputs in the
production of other goods and services. Intermediate goods do not enter the use stage in their current
form, but are instead inputs to other products and require further
transformation within the system. Examples include a steel bar,
microchip, and electrical motor.
Final products: goods and services that are ultimately consumed by the end
user rather than used in the production of another good or service.
Final goods enter the use stage in its current form without further
transformation. Examples include a car, laptop computer, or vacuum
cleaner.
Setting the Boundary:
Intermediate Products
© WRI & WBCSD, 2009

• Allocation problems exist when a process involves multiple inputs and/or multiple outputs
59
Allocation
© WRI & WBCSD, 2009

Types of Allocation Problems
• When addressing a shared process, a company shall
first consider if allocation can be avoided, by using one
of the following methods:
• Process subdivision: Avoid allocation by disaggregating
shared processes
• Direct system expansion: Avoid allocation by expanding the
functional unit to include outputs (co-products) from a shared
process
• To perform allocation, a company shall adhere to the
general accounting principles of completeness,
transparency, accuracy, and consistency
• The appropriate allocation methods shall be chosen with
a preference for decisions based on natural science
60
Allocation
© WRI & WBCSD, 2009
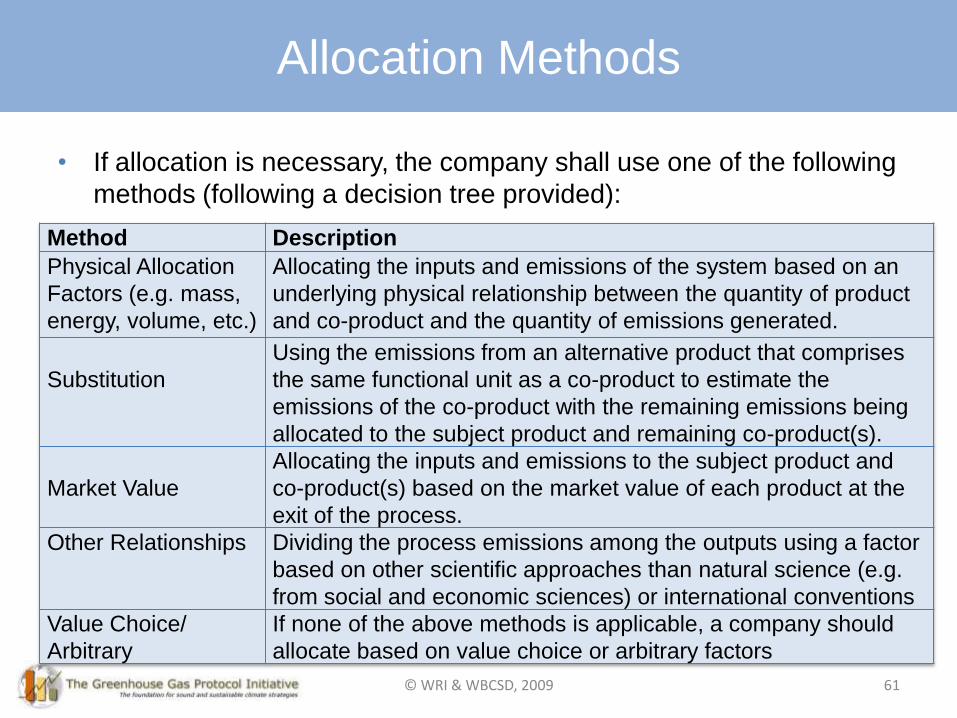
Allocation Methods
• If allocation is necessary, the company shall use one of the following
methods (following a decision tree provided):
61
Method Description
Physical Allocation
Factors (e.g. mass,
energy, volume, etc.)
Allocating the inputs and emissions of the system based on an
underlying physical relationship between the quantity of product
and co-product and the quantity of emissions generated.
Substitution
Using the emissions from an alternative product that comprises
the same functional unit as a co-product to estimate the
emissions of the co-product with the remaining emissions being
allocated to the subject product and remaining co-product(s).
Market Value
Allocating the inputs and emissions to the subject product and
co-product(s) based on the market value of each product at the
exit of the process.
Other Relationships Dividing the process emissions among the outputs using a factor
based on other scientific approaches than natural science (e.g.
from social and economic sciences) or international conventions
Value Choice/
Arbitrary
If none of the above methods is applicable, a company should
allocate based on value choice or arbitrary factors
Allocation Methods
© WRI & WBCSD, 2009
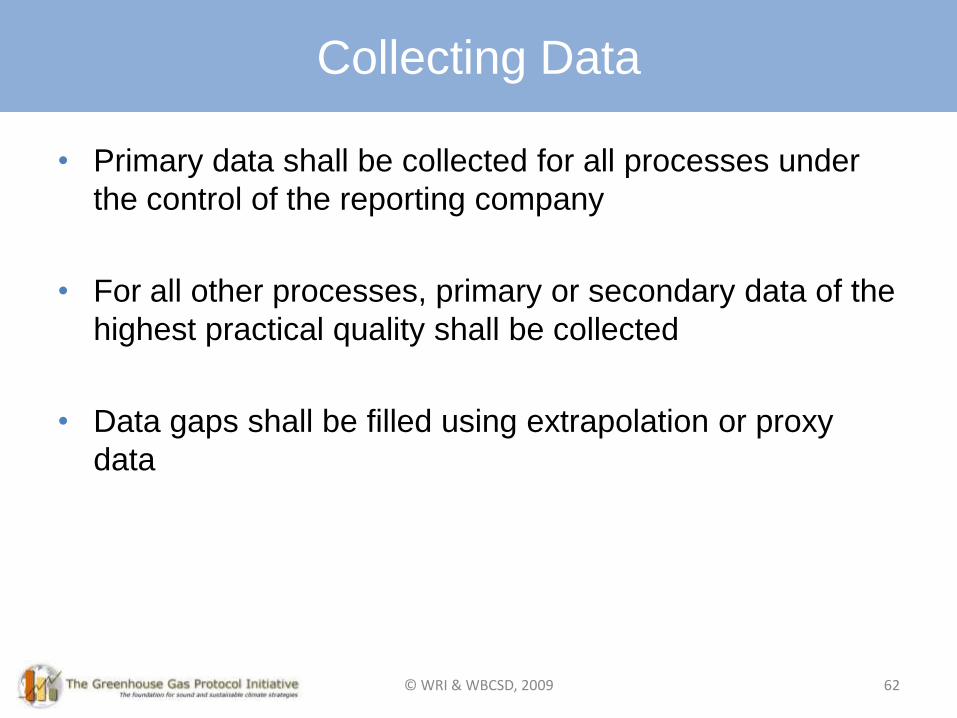
Key Requirements: Collecting Data
• Primary data shall be collected for all processes under
the control of the reporting company
• For all other processes, primary or secondary data of the
highest practical quality shall be collected
• Data gaps shall be filled using extrapolation or proxy
data
62
Collecting Data
© WRI & WBCSD, 2009

Collecting Data: Data Types
Primary Data Relates to activity data, emissions factors, or direct emission measurements for a specific
process related to a specific product manufactured by a company or another company in its
supply chain.
Secondary
Data
Relates to activity data, emissions factors or direct emissions measurements for processes
related to a specific product that are not directly measured by the reporting company or a
company in its supply chain. Secondary data may be process data or non-process data
Process Data Physical flow data relating to the individual process within the defined system boundary,
and may consist of site specific primary data, generic/average secondary data, and
secondary data from literature studies, expert estimates, and impact assessments
Input Output
Data
Non-process data derived from an environmentally extended input-output analysis (IOA),
which is the method of allocating GHG emissions (or other environmental impacts)
associated with upstream production processes to groups of finished products by means of
inter-industry transactions.
Extrapolated
Data
Primary or secondary data related to a similar (but not representative) input, processor
activity to the one in the inventory that are adapted or customized to a new situation to
make more representative.
Proxy Data Primary or secondary data related to a similar (but not representative) input, process, or
activity to the one in the inventory, which may be used in lieu of representative data if
unavailable. These existing data are directly transferred or generalized to the input/process
of interest without adaptation.
63
Collecting Data: Data Types
© WRI & WBCSD, 2009

Key Requirements: Data Quality Assessment
• A data quality assessment shall be undertaken for all GHG
emissions sources that cumulatively sum to 75% of total product
emissions, beginning with the largest emissions source
• For all processes quantified using any primary data, a qualitative
data quality assessment shall be undertaken based on
technological, temporal and geographical representativeness,
completeness, and precision
• For processes that only used secondary data, the data quality
assessment shall be undertaken based on technological, temporal
and geographical representativeness
64
Data Quality Assessment
© WRI & WBCSD, 2009
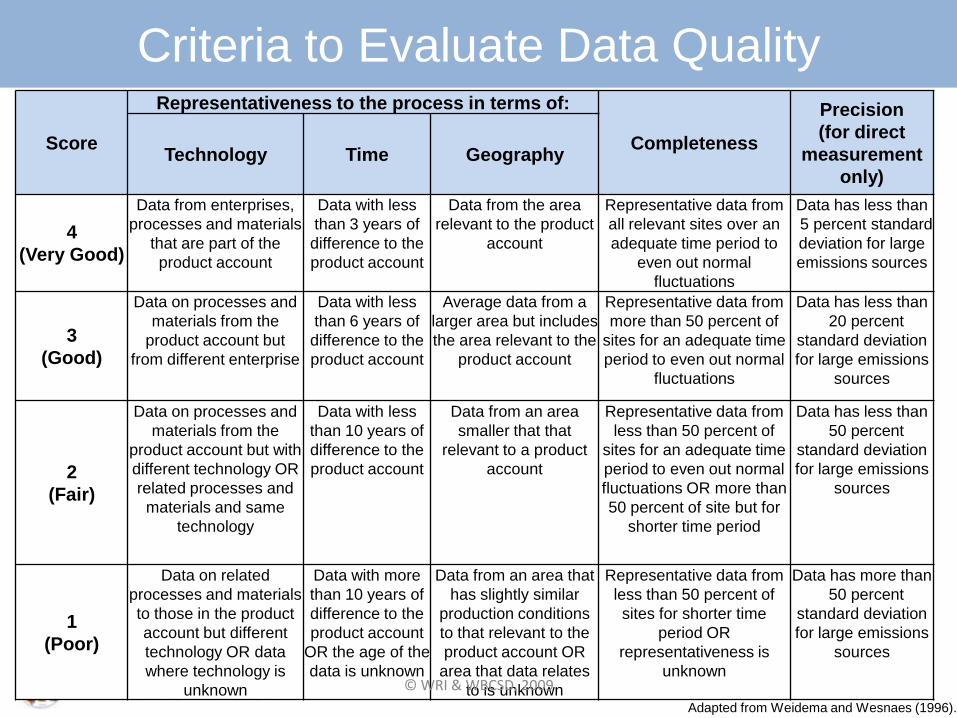
65
Score
Representativeness to the process in terms of:
Completeness
Precision
(for direct
measurement
only)
Technology Time Geography
4
(Very Good)
Data from enterprises,
processes and materials
that are part of the
product account
Data with less
than 3 years of
difference to the
product account
Data from the area
relevant to the product
account
Representative data from
all relevant sites over an
adequate time period to
even out normal
fluctuations
Data has less than
5 percent standard
deviation for large
emissions sources
3
(Good)
Data on processes and
materials from the
product account but
from different enterprise
Data with less
than 6 years of
difference to the
product account
Average data from a
larger area but includes
the area relevant to the
product account
Representative data from
more than 50 percent of
sites for an adequate time
period to even out normal
fluctuations
Data has less than
20 percent
standard deviation
for large emissions
sources
2
(Fair)
Data on processes and
materials from the
product account but with
different technology OR
related processes and
materials and same
technology
Data with less
than 10 years of
difference to the
product account
Data from an area
smaller that that
relevant to a product
account
Representative data from
less than 50 percent of
sites for an adequate time
period to even out normal
fluctuations OR more than
50 percent of site but for
shorter time period
Data has less than
50 percent
standard deviation
for large emissions
sources
1
(Poor)
Data on related
processes and materials
to those in the product
account but different
technology OR data
where technology is
unknown
Data with more
than 10 years of
difference to the
product account
OR the age of the
data is unknown
Data from an area that
has slightly similar
production conditions
to that relevant to the
product account OR
area that data relates
to is unknown
Representative data from
less than 50 percent of
sites for shorter time
period OR
representativeness is
unknown
Data has more than
50 percent
standard deviation
for large emissions
sources
Adapted from Weidema and Wesnaes (1996).
Criteria to Evaluate Data Quality
© WRI & WBCSD, 2009

Key Requirements: Calculating GHG Emissions
• The total GHG emissions for a product inventory
shall be calculated as the sum of GHG
emissions, in CO2e, of all processes within the
system boundary
66
Calculating Emissions
© WRI & WBCSD, 2009

Key Requirements: Assurance
• The product GHG Inventory shall be assured
• Assurance may be:
– First Party (“Self” or “Internal”) assurance –
Persons from within the organization but
independent of the product GHG inventory
determination process
– Third Party (”External”) assurance – Persons
from a certification or assurance body
independent of the product GHG inventory
determination process
• Assurance providers shall be sufficiently
independent of any involvement in the
determination of the product GHG inventory
• The assurance opinion shall be expressed in
the form of either reasonable (high) assurance
or limited (moderate) assurance
67
Assurance (referred to as “verification” in the GHG
Protocol Corporate Standard) is an objective assessment of the
accuracy, completeness and presentation of a reported
product GHG inventory and the conformity of the product GHG
inventory to the standard. In order to state compliance with the standard, the product GHG
inventory shall be assured
Assurance
© WRI & WBCSD, 2009

Key Requirements: Reporting
• A company shall publicly disclose a GHG inventory
report
• The report shall include both a summary report and
detailed report
• Summary report for a general audience
• Detailed report for an audience familiar with GHG
accounting
• The summary and detailed reports shall be disclosed
together
68
Reporting
© WRI & WBCSD, 2009

Key Requirements: Summary Report
• The summary report shall include:
– An introduction to the inventory
– Process map
– Emissions data, in total and by life cycle stage
– Assurance and data quality information
69
Summary Report
© WRI & WBCSD, 2009

Key Requirements: Summary Report
70
Type of Inventory
Final Product - Complete GHG Inventory (Cradle to Grave), OR
Intermediate Product - Partial GHG Inventory (Cradle to Gate)
General Information
Parameter Description [Template Notes]
Company Name and
Contact Information
Product Name [Material Product or Service, Brand Name if applicable]
Product Description[Brief product description including whether it is a final or
intermediate product]
Functional Unit [For Cradle to Gate assessments, the boundary of the functional
unit should be clearly stated]
Country/
Region of Product
Consumption
[for Cradle to Grave assessments]
Inventory Date and
Version
[Year inventory was finalized]
[1 if first inventory, 2,3 etc. for future versions]
Summary Report
© WRI & WBCSD, 2009 70
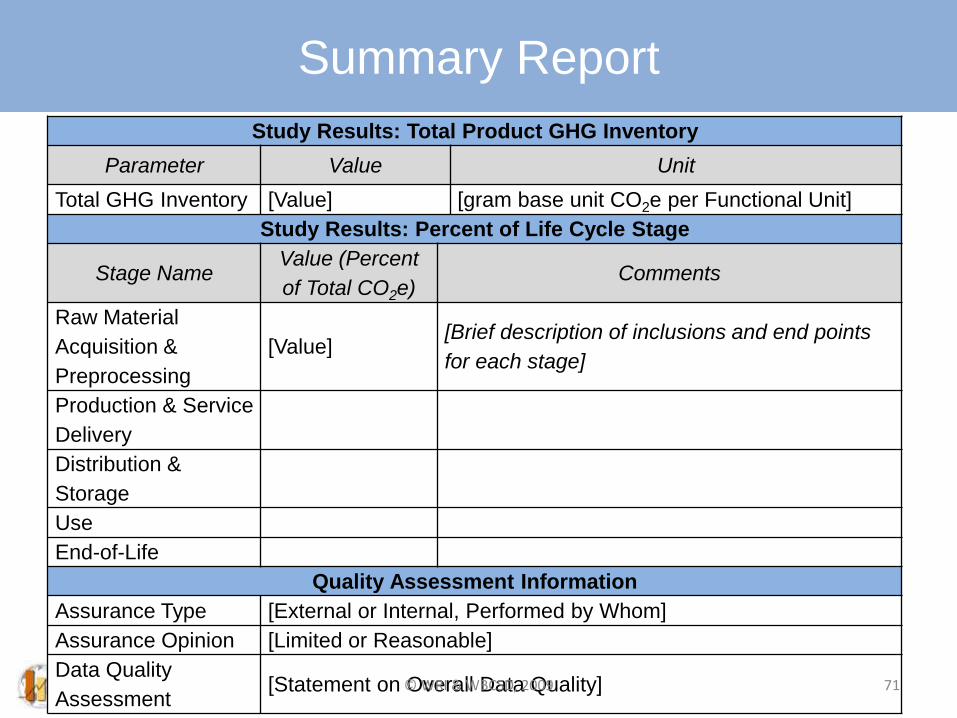
Key Requirements: Summary ReportStudy Results: Total Product GHG Inventory
Parameter Value Unit
Total GHG Inventory [Value] [gram base unit CO2e per Functional Unit]
Study Results: Percent of Life Cycle Stage
Stage NameValue (Percent
of Total CO2e)Comments
Raw Material
Acquisition &
Preprocessing
[Value][Brief description of inclusions and end points
for each stage]
Production & Service
Delivery
Distribution &
Storage
Use
End-of-Life
Quality Assessment Information
Assurance Type [External or Internal, Performed by Whom]
Assurance Opinion [Limited or Reasonable]
Data Quality
Assessment [Statement on Overall Data Quality] 71
Summary Report
© WRI & WBCSD, 2009
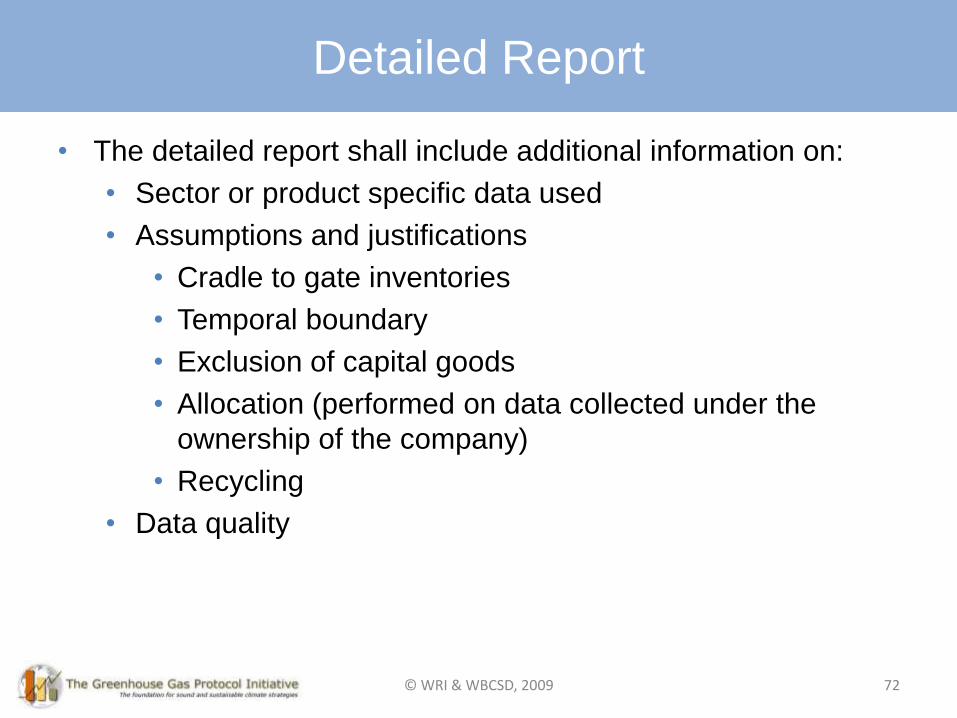
• The detailed report shall include additional information on:
• Sector or product specific data used
• Assumptions and justifications
• Cradle to gate inventories
• Temporal boundary
• Exclusion of capital goods
• Allocation (performed on data collected under the
ownership of the company)
• Recycling
• Data quality
72
Key Requirements: Detailed ReportDetailed Report
© WRI & WBCSD, 2009

73
Next Steps
73© WRI & WBCSD, 2009
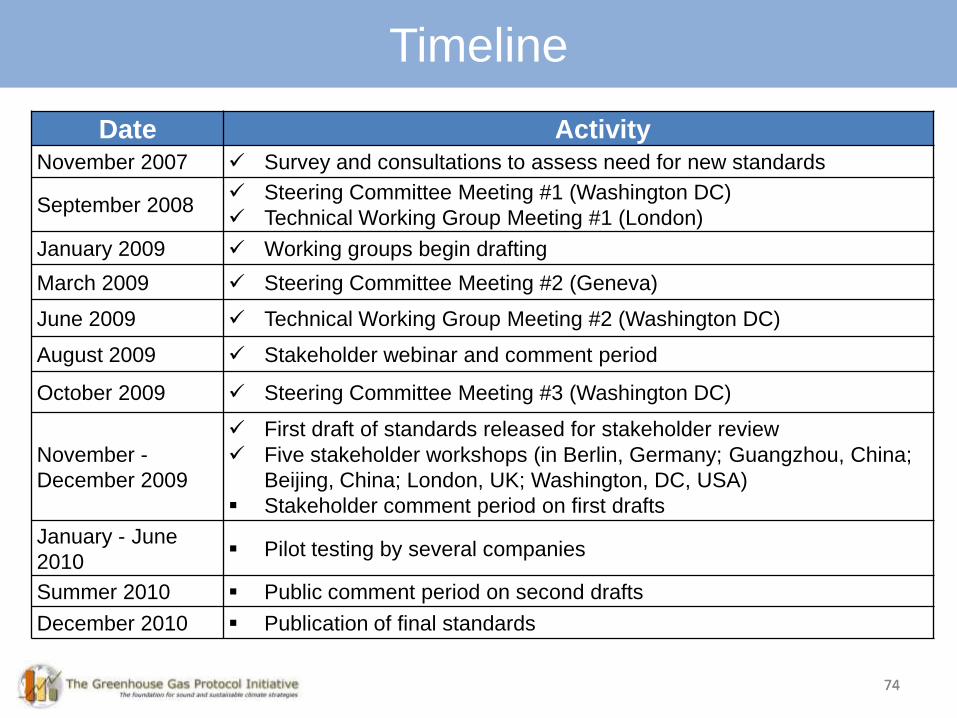
74
Timeline
74
Date ActivityNovember 2007 Survey and consultations to assess need for new standards
September 2008 Steering Committee Meeting #1 (Washington DC)
Technical Working Group Meeting #1 (London)
January 2009 Working groups begin drafting
March 2009 Steering Committee Meeting #2 (Geneva)
June 2009 Technical Working Group Meeting #2 (Washington DC)
August 2009 Stakeholder webinar and comment period
October 2009 Steering Committee Meeting #3 (Washington DC)
November -
December 2009
First draft of standards released for stakeholder review
Five stakeholder workshops (in Berlin, Germany; Guangzhou, China;
Beijing, China; London, UK; Washington, DC, USA)
Stakeholder comment period on first drafts
January - June
2010 Pilot testing by several companies
Summer 2010 Public comment period on second drafts
December 2010 Publication of final standards

Considerations for Selection
WRI/WBCSD will select a diversity of road testing companies, based on:
• Sector and product type
• Company sizes
• Geographic locations of operation
• Experience with GHG inventories and product life cycle assessment
Commitment Level
Road testing companies are expected to:
• Designate a lead staff contact to manage the road testing process of the Scope 3 and/or Product Standard
• Participate in monthly progress calls
• Attend a road testing workshop in May 2010 to share feedback
• Complete an inventory report in accordance with the respective standard within the 4-6 month time period
• Provide detailed feedback on the strengths and challenges of the draft standard(s) and suggestions for improvement
• Assist in the development of a case study highlighting key lessons learned
For more information, visit www.ghghprotocol.org
Road Testing
75© WRI & WBCSD, 2009
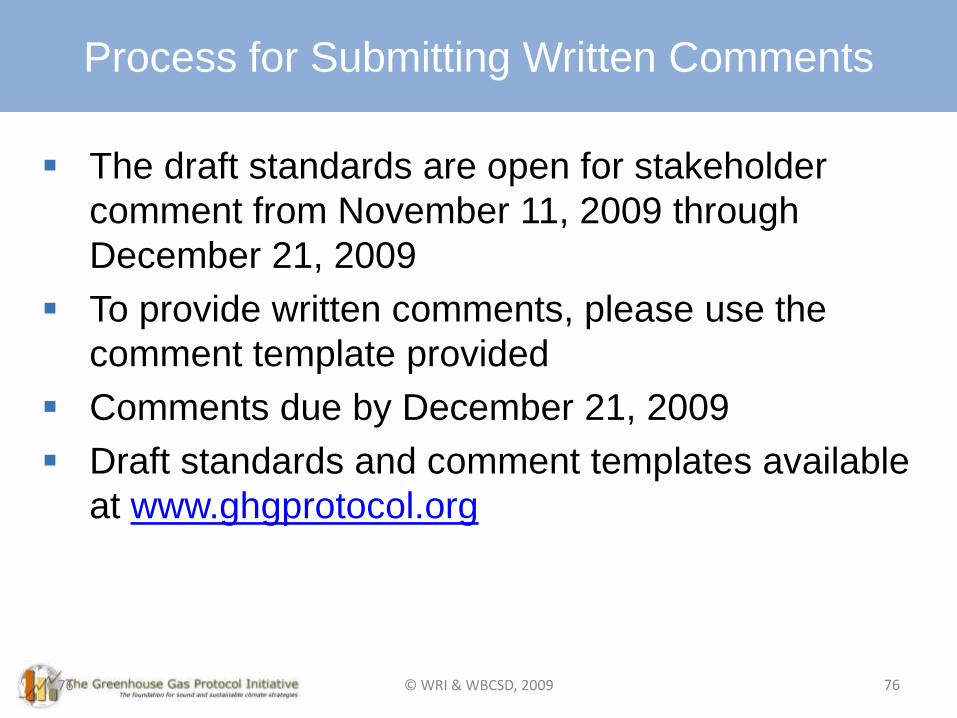
76
The draft standards are open for stakeholder
comment from November 11, 2009 through
December 21, 2009
To provide written comments, please use the
comment template provided
Comments due by December 21, 2009
Draft standards and comment templates available
at www.ghgprotocol.org
Process for Submitting Written Comments
© WRI & WBCSD, 2009 76
77
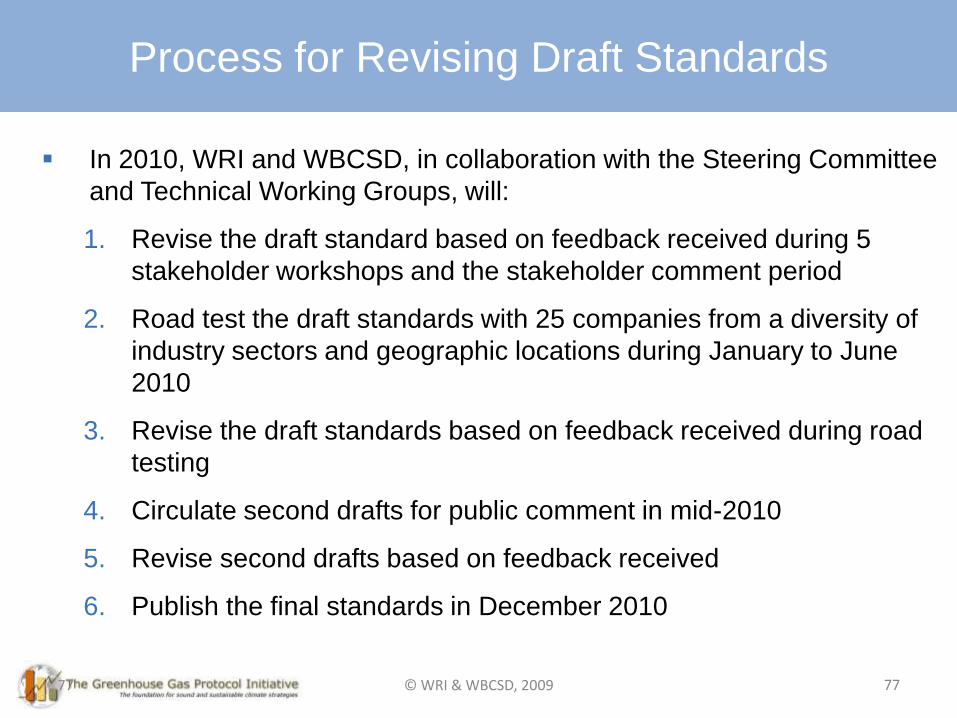
In 2010, WRI and WBCSD, in collaboration with the Steering Committee
and Technical Working Groups, will:
1. Revise the draft standard based on feedback received during 5
stakeholder workshops and the stakeholder comment period
2. Road test the draft standards with 25 companies from a diversity of
industry sectors and geographic locations during January to June
2010
3. Revise the draft standards based on feedback received during road
testing
4. Circulate second drafts for public comment in mid-2010
5. Revise second drafts based on feedback received
6. Publish the final standards in December 2010
Process for Revising Draft Standards
© WRI & WBCSD, 2009 77
78
For more information, visit
www.GHGProtocol.org
78© WRI & WBCSD, 2009