Embed Size (px)
Citation preview

The business of sustainability
Greenhouse Gas Assessment for the 1 200 MW Thabametsi Coal-Fired Power Station in Lephalale, Limpopo Province, South Africa Final Report, v2 June 2017 www.erm.com

FINAL REPORT, V2
Greenhouse Gas Assessment for the 1 200 MW Thabametsi Coal-Fired Power Station in Lephalale,
Limpopo Province, South Africa
June 2017
This report is provided solely for the purposes set out in it and may not, in whole or in part, be used for any other purpose without ERM's prior written consent. This report may not, in whole or in part, be reproduced without ERM's prior written consent.
For and on behalf of Environmental Resources Management Southern Africa Pty
(Ltd)
Approved by:
Charles Allison
Position: Partner

ERM MARUBENI
I
TABLE OF CONTENTS
EXECUTIVE SUMMMARY 1
1 INTRODUCTION 8
1.1 ABOUT ERM 9
2 METHODOLOGY 11
2.1 IMPACT ASSESSMENT METHODOLOGY 11 2.1.1 Approach to Assessing Impact Significance 12 2.2 CARBON FOOTPRINT METHODOLOGY 13 2.3 SCOPE OF THE CARBON FOOTPRINT 15 2.4 ASSUMPTIONS 18 2.5 LIMITATIONS 19
3 BASELINE DESCRIPTION 20
3.1 SOUTH AFRICA’S ENERGY LANDSCAPE 20 3.1.1 Energy Planning 20 3.1.2 Delivery of additional energy capacity: The Independent Power Producers
Procurement Programme 25 3.2 SOUTH AFRICA’S CLIMATE CHANGE LANDSCAPE 27 3.2.1 National Climate Change Response Policy 2011 27 3.2.2 South Africa’s Intended Nationally Determined Contribution (INDC) 28 3.2.3 South Africa’s National GHG Inventory 29 3.3 EMISSIONS INTENSITY OF THE SOUTH AFRICAN GRID AND OF COAL-FIRED
POWER PLANTS 32 3.3.1 South African Electrical Grid Emissions Factor 32 3.3.2 Emissions Intensity of Coal-Fired Power Plants 37 3.4 MAGNITUDE SCALE FROM INTERNATIONAL LENDER STANDARDS 39
4 IMPACT ASSESSMENT 42
4.1 GHG EMISSIONS FROM THE THABAMETSI PROJECT 42 4.1.1 GHG emissions during Construction 43 4.1.2 GHG emissions during Operations 45 4.1.3 GHG emissions during Decommissioning 49 4.1.4 Total Construction, Operations and Decommissioning Emissions 50 4.2 GHG IMPACT ASSESSMENT 51 4.2.1 Magnitude of the Project’s GHG emissions 52 4.2.2 Benchmarking performance against other coal-fired power stations 54 4.2.3 Implications of the Project on the South African grid emissions factor 57 4.2.4 Alignment with South Africa’s climate change policy and international GHG
mitigation commitments 60

ERM MARUBENI
II
4.2.5 Project GHG impact significance rating 61
5 EMISSIONS MANAGEMENT MEASURES 63
5.1 IMPACT OF THE IPPPP REQUIREMENTS AND PLANT TECHNOLOGY ON EMISSIONS REDUCTION POTENTIAL 63
5.2 EMISSIONS MANAGEMENT THROUGH OPTIMISATION OF PLANT THERMAL EFFICIENCY 65
5.3 MANAGING CHANGES TO OPERATING PHILOSOPHY 66 5.4 ENERGY AND EMISSIONS MANAGEMENT PLAN 66 5.5 ALTERNATIVE FUELS 68 5.6 EMISSIONS MANAGEMENT DURING CONSTRUCTION AND DECOMMISSIONING 68
6 CONCLUSIONS AND RECOMMENDATIONS 71
7 REFERENCES 76

ERM MARUBENI
III
TABLES
Table 2.1 Thabametsi Project Phases included in Scope 16 Table 3.1 Proposed electricity generation mix for 2030 based on the IRP 2010-2030 produced in 2011 and 2013 against 2010 baseline capacity 22 Table 3.2 Overview of IPPPP to Date 26 Table 3.3 South Africa 2010 GHG Emissions by Sector 30 Table 3.4 Projected GHG Emissions for South Africa based on its INDC to the UNFCCC30 Table 3.5 Steam conditions, thermal efficiency, and emissions intensity of pulverised coal-fired power plant technologies 38 Table 3.6 Magnitude scale for project-wide GHG emissions based on wider standards 40 Table 3.7 EBRD GHG Emissions Reporting Categories 40 Table 4.1 Estimated GHG emissions arising from the construction of the Thabametsi Coal Fired Power Plant 43 Table 4.2 Estimated GHG emissions arising from the operation of the Thabametsi Coal Fired Power Plant 46 Table 4.3 Thabametsi Coal Fired Power Plant GHG emissions intensity and thermal efficiency 48 Table 4.4 Estimated GHG emissions arising from the decommissioning of the Thabametsi Coal Fired Power Plant 49 Table 4.5 Estimated GHG Emissions from the 1 200 MW Thabametsi Project Relative to Projected GHG Emissions for South Africa 52 Table 4.6 Magnitude scale for project-wide GHG emissions based on wider standards 54 Table 4.7 Benchmarking emissions intensity and thermal efficiency of the Thabametsi 1200 MW plant against alternative coal-fired power plant technologies 55 Table 6.1 GHG management measures to be included in the EMP (Operations) 72 Table 6.2 GHG management measures to be included in the EMP (Construction) 74

ERM MARUBENI
IV
FIGURES
Figure 1.1 Location of the Thabametsi Power Station 9 Figure 3.1 South Africa's 'Peak Plateau and Decline' Trajectory 28 Figure 3.2 National GHG Emissions Trajectories 31 Figure 3.3 Profile of South Africa’s Operating Coal-Fired Power Plants 33 Figure 3.4 Emissions intensity of Eskom’s coal-fired power plants in 2010-11 35 Figure 3.5 Example of the relationship between CO2 emissions and net plant efficiency (with and without CCS) 38 Figure 4.1 Thabametsi 1200 MW power plant construction phase emissions (tCO2e) split by activity 45 Figure 4.2 Thabametsi 1200 MW power plant operational phase emissions split by activity 48 Figure 4.2 Thabametsi 1200 MW power plant decommissioning phase emissions split by activity 50 Figure 4.3 Thabametsi 1 200 MW power plant emissions split by phase 51

ERM MARUBENI
V
ACRONYMS
CCGT Combined cycle gas turbine CCS Carbon capture and storage CFB Circulating fluidised bed (boilers) CIAB (IEA) Coal Industry Advisory Board CO2 Carbon Dioxide CO2e Carbon Dioxide Equivalent COP Conference of Parties (under UNFCCC) CSP Concentrated Solar Power (WRI) CAIT (WRI’s) Climate Analysis Indicators Tool CV Calorific value DEA (South African) Department of Environmental Affairs DoE (South African) Department of Energy EBRD European Bank for Reconstruction and Development EIA Environmental Impact Assessment EMP Environmental Management Plan EP Equator Principles ERA (South African) Electricity Regulation Act ESIA Environmental and Social Impact Assessment FGD Flue gas desulphurisation FOLU Forestry and other land uses GDP Gross Domestic Product GHG Greenhouse Gas GUMP (South Africa’s) Gas Utilisation Master Plan GW Gigawatt GWC Growth without constraints (emissions trajectory under
DEA’s Mitigation Potential Analysis study) GWP Global Warming Potential HHV Higher heating value IEA International Energy Agency IEP (South Africa’s) Integrated Energy Plan IFC (PS3) International Finance Corporation (Performance Standard
3 on Resource Efficiency and Pollution Prevention) IGCC Integrated gasification combined cycle INDC Intended Nationally Declared Contribution (under
UNFCCC) IPCC Intergovernmental Panel on Climate Change IPP Independent Power Producer IPPPP Independent Power Producer Procurement Program IRP Integrated Resource Plan for Electricity (South Africa) kW(h) Kilowatt (hour) LHV Lower heating value LTMS (South Africa’s) Long Term Mitigation Scenarios Mt Megatonne (1 000 000 tonnes) MW(h) Megawatt (hour)

ERM MARUBENI
VI
NCCRP National Climate Change Response Policy (South Africa) NDP National Development Plan (South Africa) NOx Nitrous oxides OGCT Open cycle gas turbine PCC Pulverised coal combustion PPA Power Purchase Agreement PPD Peak, Plateau and Decline (GHG emissions trajectory) PV Photovoltaic SC Supercritical (steam conditions) SO2 Sulphur dioxide t CO2e Tonnes of Carbon Dioxide equivalent t Tonne (1000 kg) UNFCCC United Nations Framework Convention on Climate
Change USC Ultra-supercritical (steam conditions) WBCSD World Business Council for Sustainable Development WAM ‘With Additional Measures’ (emissions trajectory under
DEA’s Mitigation Potential Analysis study) WEM ‘With Existing Measures’ (emissions trajectory under
DEA’s Mitigation Potential Analysis study) WOM ‘Without Measures’ (emissions trajectory under DEA’s
Mitigation Potential Analysis study) WRI World Resources Institute

ERM MARUBENI
VII
GLOSSARY OF TERMS
Circulating fluidised bed (CFB) combustion technology
Combustion systems whereby the fuel is crushed (rather than pulverized), and is suspended in a fluidized bed on upward-blowing jets of air during the combustion process. A cyclone filter is used to separate solid material from the hot flue gases, and these solids are re-circulated into the bed. Limestone can be added to capture sulphur, significantly reducing SO2 emissions to the atmosphere.
GHG (Greenhouse Gas)
A gas that contributes to the greenhouse effect by absorbing infrared radiation. Unless indicated otherwise, GHG emissions are made up of CO2, CH4, N2O, HFCs, PFCs and SF6.
Emissions factor The average emission rate of a given GHG for a given source, relative to units of activity (e.g. tonnes CO2e per litre diesel; tonnes CO2e per kWh; etc.)
Equator Principles A risk management framework adopted by financial institutions for determining, assessing and managing environmental and social risk in projects.
INDC (Intended Nationally Determined Contribution)
Term used under the United Nations Framework Convention on Climate Change (UNFCCC) for reductions in greenhouse gas emissions that all countries that signed the UNFCCC were asked to publish in the lead up to the 2015 United Nations Climate Change Conference held in Paris, France in December 2015.
Pulverised coal combustion (PCC) technology
Coal is ground (pulverised) into a fine powder and is injected into the boiler and combusted to raise steam, using water flowing through tubing in the body of the combustor, for the steam-turbine generator. Particle residence time in the boiler is typically 2-5 seconds.
tCO2e Tonnes of carbon dioxide equivalent, a measure that expresses the impact of non-CO2 greenhouse gases (CH4, N2O etc.) in terms of the equivalent amount of CO2 that would create the same warming.
National Communications (to UNFCCC)
Reports that must be submitted by all Parties to the UNFCCC in order to provide information on their GHG inventory and actions taken to address climate change.

ERM MARUBENI
1
EXECUTIVE SUMMMARY
Introduction and methodology
This Report sets out an assessment of the greenhouse gas (GHG) emissions (carbon footprint) associated with the 1 200 MW Thabametsi Power Station in Lephalale, Limpopo Province, South Africa (the ‘Project’), proposed under the South African Department of Energy (DoE)’s Coal Baseload Independent Power Producer (IPP) Procurement Programme (‘Coal Baseload IPP Programme’). The plant will be built in two phases of 630 MW(1) (Phase 1) and 570 MW (Phase 2). The impact of these GHG emissions (and therefore the impact of the project in terms of contribution to global climate change) is assessed by way of comparing estimated annual operational GHG emissions from the project with South Africa’s baseline and projected annual GHG emissions, through reference to GHG magnitude scales for projects from various lender standards, and through the benchmarking of the project’s emissions and energy performance against other coal-fired power stations in South Africa and worldwide. In addition, the degree to which the planned project is consistent with South Africa’s stated climate change and energy policy is also considered. Revisions between v1 and v2 of the Report This revised v2 of the Report responds to comments made by stakeholders in relation to v1 of the Report, issued in January 2017. Specifically:
• it applies more accurate calculation methods based on ‘Tier 3’ technology-specific GHG emission factors as opposed to generic ‘Tier 1’ emission factors (2) to assess the projected GHG emissions from the proposed Thabametsi plant and to compare these against the emissions of other coal-fired power plants on the South African grid. The use of ‘Tier 3’ emission factors will become more widely used in South Africa following the implementation of the National Greenhouse Gas Emission Reporting Regulations, which were gazetted on 3 April 2017;
• it clarifies the contribution made by different GHGs (specifically CO2, CH4 and N2O) to the overall GHG emissions of the proposed Thabametsi plant (in tonnes of CO2e)(3)
• it updates and expands the comparison of GHG emissions from the proposed Thabametsi plant against the GHG emissions of other coal-fired power plants on the South African grid, specifically those plants that are scheduled for retirement in the period before 2030, in an effort
(1)The restriction of cap capacity of 600MW in the RFP refers to net capacity and not installed capacity. Net capacity for Thabametsi phase 1 will be about 567 MW. (2) An explanation of the differences between 'Tier 3' and 'Tier 1' emission factors is provided in Section 2.2. (3) The difference between CO2 and CO2e is provided in Section 2.2

ERM MARUBENI
2
to assess the impact of the proposed plant on South African GHG emissions.
GHG emissions from the Project
Data for the calculation of emissions from the plant’s construction and decommissioning was sourced from the decommissioning study prepared by WSP | Parsons Brinckerhoff, and by way of a GHG data request issued to the Project developer. Data for the calculation of operational emissions was sourced from the 630 MW (Phase 1) Project feasibility study prepared by WSP | Parsons Brinckerhoff with the assumption that emissions associated with the second 570 MW phase would be the same as estimated for Phase 1 per MW. Phase 1 will comprise two 315 MW steam turbine generators, and will use circulating fluidised bed (CFB) technology at sub-critical steam conditions. Total Scope 1 and 2 GHG emissions during the construction of the 1 200 MW plant are estimated to be 261 707 tCO2e, and total GHG emissions from decommissioning the plant are estimated to be 3 736 tCO2e. Annual GHG emissions for the final 1 200 MW plant are estimated to be 9 879 522 t CO2e (9.9 Mt CO2e), assuming a baseload supply scenario. Assuming the same load factor and operating patterns and not accounting for any decrease in thermal efficiency over time, total (cumulative) estimated operational emissions over the 30 year lifetime of the 1 200 MW plant are estimated at 296 Mt CO2e. As such, operational emissions account for >99.9% of total GHG emissions over the lifetime of the plant (see Table 0.1 below). The plant’s thermal efficiency is 36.25%, and its GHG emissions intensity factor is estimated to be 1.23 t CO2e per MWh generated.
Table 0.1 Thabametsi’s GHG emissions over its life-cycle, split by activity (1)
Source of emissions Estimated GHG emissions (tCO2e) % Construction 261 707 0.088% Operations 296 385 671 99.911% Decommissioning 3 736 0.001% TOTAL 296 651 114 100%
Magnitude of the Project’s GHG emissions
Based on South Africa’s current and future projected national GHG emissions, the project’s GHG emissions during operations are expected to comprise 1.7 – 2.5% of South Africa’s national emissions in 2021, rising to 2.3 – 4.7% in 2050. The magnitude of the project’s emissions (9.879 million t CO2e per year) is Very Large based on a GHG magnitude scale drawing from various international lender organisation standards including standards set by the
(1) It is assumed that the plant will operate at the same load factor annually, despite decrease in thermal efficiency. This will slight decrease in electrical output yearly.

ERM MARUBENI
3
International Finance Corporation (IFC), European Bank for Reconstruction and Development (EBRD) and Equator Principles (EP). Benchmarking performance and rationale for selected technologies
The plant’s thermal efficiency (36.25%) is relatively high for subcritical plants; however, the calculated emissions intensity of 1.23 kg CO2e/kWh is higher compared to some other subcritical plants on account of the low coal quality being used and the choice of technology. Improved thermal efficiencies and lower emissions intensities for coal fired power plants can be achieved through the use of supercritical steam technologies. However, such technologies are not feasible for the plant, which is designed to meet the DoE’s Baseload Coal IPP Procurement Programme key requirements in relation to capacity (individual projects are restricted to 600 MW), redundancy (which should be maximised, reflected in the selected configuration of four 150 MW boilers and two 300 MW steam units per 600 MW phase for Thabametsi), and low cost of generation (CFB plants are able to use lower quality, cheaper coal and to deliver electricity at a relatively low tariff). The use of supercritical steam is limited in CFB plants or indeed other (non-CFB) coal-fired power plants that are not of sufficiently large capacity to justify the higher capital costs associated with supercritical steam technologies. Also important to note is the selection of dry cooling technologies for Thabametsi which serve to reduce water requirements for the plant, but increase the auxiliary load and negatively impact on the plant's thermal efficiency. The plant has an estimated emissions intensity of 1.23 t CO2e / MWh generated based on total estimated annual GHG emissions and total electricity generated and sent to the grid (i.e. excluding plant auxiliary consumption and any losses from transmission and distribution). The total emissions intensity factor for Eskom’s coal-fired power plants was calculated based on data published by Eskom for 2010-11 at 1.05 t CO2e / MWh,. By 2021-22, when the Thabametsi plant is estimated to come into operation, the emissions intensity specific to Eskom’s coal fired power plants is projected by ERM, using IPCC Tier 3 emission factors, at approximately 1.05 t CO2e / MWh, including Kusile and Medupi, and accounting for loss in thermal efficiency over time. It is important to note that all of Eskom's five coal-fired power plants (Camden, Hendrina, Grootvlei, Kriel and Komati) which are scheduled by Eskom for decommissioning prior to 2020 have relatively high GHG emission intensities compared to this average intensity factor. The GHG intensity of electricity generated by these five plants is summarised in Table 0.1 below. By 2021/22 it is projected that the proposed Thabametsi plant will have similar emissions intensity to the five power plants (Camden, Hendrina, Grootvlei, Komati, Kriel), if those power plants remain in operation until 2021-22. This is a result of the relatively high N2O emissions from the proposed Thabametsi plant, which otherwise has a lower CO2 emissions intensity than all the five plants scheduled for decommissioning (See Table 0.2 and Figure 0.1).

ERM MARUBENI
4
Table 0.2 Estimated emissions intensity of proposed Thabametsi plant vs. Eskom coal-fired power plants scheduled for decommissioning before 2030
Name of Power plant
tCO2 / MWh (CO2
Only) *
tCO2e /MWh
(CO2, CH4 and N2O)**
tCO2 / MWh (CO2 Only)
tCO2e /MWh (CO2, CH4 and
N2O)**
2010/11 data Projected 2021/22 data***
Thabametsi 1.02 1.23
Eskom Power Plants
Camden ***** 1.24 1.25 1.24 1.25
Hendrina 1.18 1.19 1.32 1.33
Komati ***** 1.26 1.27 1.26 1.27
Grootvlei 1.24 1.25 1.36 1.36
Kriel 1.04 1.04 1.24 1.24
Average for Camden, Hendrina, Grootvlei, Kriel and Komati****
1.14 1.14 1.22 1.28
Average for all Eskom coal-fired plants
1.04 1.05 1.05 1.05
* as stated in Eskom (2011). These figures reported by Eskom include CO2 only and not CH4 or N2O. ** Calculated by ERM using IPCC (2006a) *** Projected by ERM based on the average observed energy efficiency loss of the power plants over the period 2009/10 – 2013/14 reported by Eskom (2017). The average for Eskom coal-fired power plants in 2020/21 includes Kusile and Medupi, which have lowered the average significantly. The average is calculated as total CO2e for the 5 plants per total MWh of the 5 power plants. **** Average emissions/MWh for these 5 plants, calculated based on total emissions / total electricity generated. ***** Camden and Komati were Returned To Service during the 2009/10 – 2013/14 period, which included refurbishments to the plants, and resulted in peaking of their thermal efficiencies, hence their projected emission intensity values in 2021/2022 are similar to 2010/2011 values.

ERM MARUBENI
5
Figure 0.1 Comparison of Thabametsi’s GHG emission intensity (TonsCO2e/MWh) with the projected 2021-22 GHG emission intensity of Eskom’s coal fleet.
Figure 0.1 shows that while Thabametsi’s subcritical circulating fluidized bed (CFB) technology releases similar amounts of CO2 and CH4 per MWh with Eskom’s pulverized coal technology, CFB tends to release much larger quantities of N2O(1). N2O emissions account for about 17% of Thabametsi’s total annual emissions while N2O emissions only account for 0.8% of Eskom’s projected total GHG emissions from coal-fired power plants. Overall, whilst CFB technologies offer major advantages including reduced emissions of nitrous oxides (NOx) and sulphur dioxide (SO2), and water use reduction through the use of in-situ SO2 mitigation (rather than ‘wet’ FGD units), their N2O emissions remain high. Alignment with South Africa’s energy and climate change policies
A number of key national energy and climate change policies and plans are reviewed in this Report, including the Integrated Resource Plan for Electricity (‘IRP’) 2010-2030 and the National Climate Change Response Policy (‘NCCRP’), both published in 2011, in order to assess the extent to which the Project is in line with South African energy and climate policy. The promulgated IRP 2010-2030 (2011) factors in an increase in generating capacity to meet future demand, incorporating provision for new coal but with an
(1) According to the 2006 IPCC guidelines sub-critical CFB plants emit 61 kg of N2O per Terajoule of energy input, compared to pulverized coal plants which range between 0.5 and 1.4 kg N2O.

ERM MARUBENI
6
emphasis on low-carbon energy sources including nuclear power and renewables such that South Africa’s dependence on coal-based electricity generation is reduced. In line with this, the Independent Power Producers Procurement Program (IPPPP) has the mandate to procure energy from Independent Power Producers (IPP) aligned to the capacity allocated to different electricity generation sources in the IRP, and the Department of Energy (DoE) has allocated 2 500 MW to be sourced through the Coal Baseload IPP Programme, under which the application for the development of the Thabametsi Power Project (Phase 1 – 630 MW) sits. In parallel, South Africa’s NCCRP outlines a ‘Peak, Plateau and Decline’ (‘PPD’) GHG emissions trajectory whereby South Africa’s emissions should peak between 2020 and 2025, plateau for approximately a decade, and then decline in absolute terms thereafter, and based on this the country has pledged to reduce emissions by 34% and 42% below Business As Usual (BAU) emissions in 2020 and 2025, respectively. Studies using different national GHG emissions trajectory scenarios and applying the IRP 2010-2030 (2011) projections for the energy sector suggest that the 34% and 42% commitments can be met, but that beyond 2040, it will not be possible to track the PPD trajectory based on the assumptions outlined in the IRP 2010-2030. As such, more aggressive decarbonisation of South Africa’s energy supply will be needed in future iterations of the IRP extending beyond 2030 if the PPD targets are to be met. Impact assessment significance rating
Based on the analysis of the magnitude of the Project’s GHG emissions (Very Large), and informed by the findings from the benchmarking assessment and the impact on the national grid emissions factor, the overall significance rating for the Project is High (Negative). In the absence of abatement technologies such as CCS, which has not been demonstrated to be commercially feasible in South Africa, all coal-fired power plants will fall into this category of High (Negative) due to their GHG emissions, including, for example, Eskom’s Kusile and Medupi coal-fired power plants currently under construction. It is therefore important to consider the impact assessment findings within the context of South Africa’s national energy plans including the planned increases in baseload power to meet needs and supply security, the role of coal to meet increased baseload power requirements as set out by the DoE, and the key objectives of the Coal Baseload IPP Programme in terms of providing a rationale for the development of this Project. Emission management measures Numerous GHG emissions management measures are proposed for inclusion in the Environmental Management Plan (EMP) with the objective to minimise GHG impacts as far as possible by maintaining and maximising plant thermal efficiency over time. These include: the development of a GHG management policy and plan and allocation of associated responsibilities; tracking and reporting GHG emissions and emissions intensity over time; assessing and if

ERM MARUBENI
7
appropriate implementing specific measures to reduce emissions such as flue gas and cooling system heat recovery recycling systems and co-firing with low-carbon, sustainable biomass in the future; and undertaking scheduled maintenance as well as major maintenance re-hauls to recover efficiency losses. GHG management measures are also included for the construction and decommissioning phases, centred on minimising emissions from land-use change, and minimising fuel and electricity use and emissions in stationary and mobile vehicles and equipment, and in buildings. Conclusions The operation of the 1 200 MW Thabametsi Power Station under the South African DoE’s Coal Baseload IPP Programme will result in significant GHG emissions, projected to be 9.879 million t CO2e per year (1) . The emissions are of a similar but slightly lower magnitude per kWh generated than those from the Eskom coal-fired power plants which are scheduled to be decommissioned around the time of the Thabametsi plant’s entry into service. The choice of technology and specifications for this Project were informed by the technical requirements of the DoE as set out in the bid criteria under the Coal Baseload IPP Procurement Programme established under the IRP 2010, including the requirements for proven technology and tariff cap of ZAR0.82/KWh.
(1) In line with international good practice, such as that advocated by the IFC Performance Standards, this report does not attempt, nor is it appropriate, to try to calculate the climate change impacts in the broader study area that will be due specifically to emissions from a single source, such as the Thabametsi Power Station. In line with international good practice, this report calculates the projected GHG emissions from the project, across its lifetime. It compares those emissions against appropriate comparators and reference benchmarks in South Africa and globally, and considers their relevance in the context of South Africa’s national GHG emissions and policy.

ERM MARUBENI
8
1 INTRODUCTION
This Report sets out an assessment of the greenhouse gas (GHG) emissions (carbon footprint) associated with the construction, operations and decommissioning of the 1200 MW Thabametsi Power Station in Lephalale, Limpopo Province, South Africa (the ‘Project’), proposed under the South African Department of Energy (DoE)’s Coal Baseload Independent Power Producer (IPP) Procurement Programme (‘Coal Baseload IPP Programme’). The impact of these GHG emissions (and therefore the impact of the Project in terms of contribution to global climate change) is assessed by way of comparing estimated annual GHG emissions from the Project with South Africa’s baseline and projected annual GHG emissions, through reference to GHG magnitude scales for projects from various lender standards, and through the benchmarking of the project’s emissions and energy performance against other coal-fired power stations in South Africa and worldwide. In addition, the degree to which the planned project is consistent with South Africa’s stated climate change and energy policy is also considered, including comparison with the country’s Peak, Plateau and Decline (PPD) target. The Report also includes an assessment of measures for improving operational efficiency at the power plant, and highlights options to manage and reduce project-related GHG emissions during its operation. This revised v2 of the Report responds to comments made by stakeholders in relation to v1 of the Report, issued in January 2017. Specifically:
• it applies more accurate calculation methods based on ‘Tier 3’ technology-specific GHG emission factors as opposed to generic ‘Tier 1’ emission factors (1) to assess the projected GHG emissions from the proposed Thabametsi plant and to compare these against the emissions of other coal-fired power plants on the South African grid. The use of ‘Tier 3’ emission factors will become more widely used in South Africa following the implementation of the National Greenhouse Gas Emission Reporting Regulations, which were gazetted on 3 April 2017;
• it clarifies the contribution made by different GHGs (specifically CO2, CH4 and N2O) to the overall GHG emissions of the proposed Thabametsi plant (in tonnes of CO2e)(2)
• it updates and expands the comparison of GHG emissions from the proposed Thabametsi plant against the GHG emissions of other coal-fired power plants on the South African grid, specifically those plants that are scheduled for retirement in the period before 2030, in an effort to assess the impact of the proposed plant on South African GHG emissions.
(1) An explanation of the differences between 'Tier 3' and 'Tier 1' emission factors is provided in Section 2.2. (2) The difference between CO2 and CO2e is provided in Section 2.2

ERM MARUBENI
9
Figure 1.1 illustrates the location of the proposed facility near Lephalale, Limpopo Province, South Africa.
Figure 1.1 Location of the Thabametsi Power Station
1.1 ABOUT ERM
ERM is a leading provider of sustainability services, covering the full spectrum of environmental, health and safety, risk and social consulting issues. ERM established a permanent presence in Sub-Saharan Africa in 2003 and has offices in South Africa (Cape Town, Durban, and Johannesburg), Kenya (Nairobi) and Mozambique (Maputo). ERM has over 180 staff involved in environmental and social projects throughout the continent. ERM Southern Africa’s Air Quality and Climate Change Practice comprises a team of dedicated professionals with experience in a wide range of climate change mitigation and adaptation services and links to other ERM climate change professionals across the region and globally. Since ERM established a presence in South Africa, we have developed over 60 carbon footprints in South Africa alone. In addition, we have reviewed South Africa’s National Greenhouse Gas Inventory for two different reporting periods, financially quantified the physical risks of climate change for clients and assisted others with identifying realistic and achievable energy savings opportunities. ERM has supported numerous clients with GHG assessments in capital project development as part of the Environmental Impact Assessment (EIA) process in South Africa and globally, applying a methodology that draws on guidance from international lender standards including the International Finance

ERM MARUBENI
10
Corporation (IFC), European Bank for Reconstruction and Development (EBRD) and Equator Principles (EP). The authors of this study have undertaken quantitative GHG emissions assessments across the power, oil and gas, mining and infrastructure sectors, and have significant experience in the development and application of GHG and energy management strategies more broadly.

ERM MARUBENI
11
2 METHODOLOGY
2.1 IMPACT ASSESSMENT METHODOLOGY
A traditional impact assessment is conducted by determining how the proposed activities will affect the state of the environment prior to development of a project. In the case of GHG emissions, this process is complicated by the fact that the impact of GHG emissions on the environment cannot be quantified within a defined space and time. The greenhouse effect occurs on a global basis and the geographical source of GHG emissions is irrelevant when considering the future impact on the climate. It is not possible to link emissions from a single source – such as the Thabametsi Power Station - to particular environmental and social impacts in the broader study area. The environmental and social impacts need to be considered on a macro level. Recently, the concept of social costs of carbon (SCC) has been considered as part of assessing the social impacts of GHGs, however, there are no established, universally-acceptable guidelines for estimating the SCC related to a single project, firstly due to the complex nature of climate change and its drivers; and secondly because any assessment of the extent of climate change requires value judgements about the relative importance of temporal impacts. In 2010 the US Environmental Protection Agency, through a presidential executive order, adopted a US-specific framework for estimating social costs of carbon as part of Environmental Impact Assessments. The 2017 Technical Support Document to this executive order clearly points out that there are too many uncertainties with such an assessment and that the models used are imperfect and incomplete, and as such SCC estimates should be treated as provisional until improved scientific and economic information is available (EPA, 2017). The United Kingdom recently considered policy-level assessments of the social costs of carbon but has not applied them at project-level. South Africa does not have a framework for estimating SCC. As such, this specialist study does not consider the physical impacts of climate change resulting from increasing GHG emissions, but instead will assess the impact of the Project’s GHG emissions by way of:
• Understanding the scale of the Project’s GHG emissions by comparing total emissions to GHG magnitude ratings and scales for projects (developments) that have been developed by various international lender organisations or groupings, including the IFC, the EBRD, and the EP;
• Assessing the GHG performance of the Project relative to reference benchmarks on the GHG intensity of electricity production, including the GHG intensity of South Africa’s grid electricity and of other coal-fired power plants; and

ERM MARUBENI
12
• Understanding of the impact of the Project on South Africa’s national GHG emissions inventory, and consideration of the alignment of the Project with the country’s climate policy and international GHG reduction commitments.
The ‘Project’ in the context of this study refers to the proposed (final) 1 200 MW Thabametsi coal-fired power station (1), and the Project’s impact, in terms of GHG emissions (and contribution to global climate change), reflects GHG emissions from the operation of this power station.
2.1.1 Approach to Assessing Impact Significance
The following criteria are used in order to assess impacts for the purposes of the specialist studies within the Thabametsi EIA: • The nature, a description of what causes the effect, what will be affected,
and how it will be affected • The extent, indicating whether the impact will be local, regional, national
or international, assigning a score of between 1 (low) and 5 (high) as appropriate
• The duration, indicating whether the lifetime of the impact will be of very short (0-1 years, score: 1); short (2-5 years, score: 2); medium (6-15 years, score: 3), long (>15 years, score: 4) or permanent (score: 5);
• The magnitude, quantified on a scale of 0 – 10, where 0 is small with no effect on the environment, 2 is minor with no impact on processes, 4 is low with a slight impact on processes, 6 is moderate resulting in processes continuing but in a modified way, 8 is high with processes altered to the extent that they temporarily cease, and 10 is very high and results in complete destruction of patterns and permanent cessation of processes;
• The probability of occurrence, which describes the likelihood of the impact actually occurring. Probability is estimated on a scale and a score between 1 and 5 assigned, where 1 is very improbable (probably will not happen, 2 is improbable (some possibility, but low likelihood), 3 is probable (distinct possibility), 4 is highly probable (most likely), and 5 is definite (impact will occur regardless of any prevention measures); and
• The significance, which is determined through a synthesis of the above characteristics using the following formula: S = (E + D + M) P; where S = Significance weighting E = Extent D = Duration M = Magnitude P = Probability
1 Note that the Project will comprise two separate phases of approximately 600 MW (each). This GHG study uses data from the Phase 1 600 MW Feasibility Study to assess emissions from both Phase 1 and Phase 2 (the latter estimated based on Phase 1 emissions, i.e. for the final 1 200 MW Project.

ERM MARUBENI
13
The above points allocations are used to determine the significance ratings for each potential impact, where low, medium and high significance reflect <30, 30-60, and >60 points respectively.
The status of the impact is described as either positive, negative or neutral, together with the degree to which the impact can be reversed, the degree to which the impact may cause irreplaceable loss of resources, and the degree to which the impact can be mitigated. In the context of climate change impacts associated with GHG emissions from the Project (this study), magnitude is the main criteria used to assess impact significance, since extent, duration, and probability are the same irrespective of the Project context and the scale of its GHG emissions, and therefore do not form a good basis on which to assess the significance of the impacts associated with GHG emissions. Specifically, the extent of GHG (climate change) impacts is global, the duration of the impact is permanent (CO2 has a residence time in the atmosphere of approximately 100 years), and there is a wide body of scientific evidence linking GHG emissions to global climate change impacts making the probability of the occurrence of the impact ‘definite’. As such, GHG impact significance is determined on the basis of the assessment of the magnitude of the emissions using benchmarks from international lender standards, further informed by reference benchmarks on the GHG intensity of electricity production for similar facilities and according to the grid emissions factor in South Africa, as well as an analysis of the Project’s alignment with South Africa’s energy and climate change policies, as described above and also in Section 4.2.
2.2 CARBON FOOTPRINT METHODOLOGY
A carbon footprint is a measure of the estimated GHG emissions produced directly and indirectly by an individual, organisation, facility or product. The calculation of a carbon footprint generally involves the following equation. • Activity data relates to the emission-causing activity, e.g. the combustion of
fuel (coal, diesel etc.) or the use of refrigerant gases; • Emission factors (‘EFs’) convert the activity data into tonnes of the relevant
GHG emitted; and • Global warming potentials (‘GWPs’) (1) are applied to non-CO2 GHGs (N2O,
CH4) to convert the result to carbon dioxide equivalent (‘t CO2e’).
(1) A number of different gases contribute to the greenhouse effect. The effect that they have varies according to their relative ability to trap and retain radiant energy arriving at the Earth. These differences are reflected in the gases’ global warming potentials (GWP), which are a measure of their greenhouse effect ‘strength’ relative to CO2.
Carbon footprint emissions = Activity data x Emissions factor x Global warming potential

ERM MARUBENI
14
For the purposes of this assessment, mass balance approaches have also been used, such as those described by the IEA for the measuring and reporting of CO2 emissions and efficiency performance (IEA CIAB, 2010), and by the IPCC in their 2006 Guidelines for Greenhouse Gas Inventories (Volume 2: Stationary Combustion and Volume 3: Industrial Processes and Product Use) (IPCC, 2006). Mass balance approaches follow the mass flow of chemical elements such as carbon through combustion or other reactions, and use molecular mass ratios of outputs vs. inputs to estimate GHG emissions. For example, the mass of CO2 emitted during the combustion of coal is estimated based on the mass of carbon combusted (a function of the mass of coal and its carbon content), the oxidation factor for the fuel, and the molecular mass ratio of carbon dioxide (CO2) to carbon (C): 44/12. This methodology, as applied in this study, is described in more detail in Section 4.1. Emissions for other relevant GHGs, including CH4 and N2O, have been calculated through application of relevant ‘Tier 3’ technology-specific emissions factors (see box below), and/or through application of the relevant GWPs to projected emissions of GHGs. Coal-fired power plants do not emit any fluorinated greenhouse gases (SF6, PFCs and HFCs) (EC, 2017; C2ES,2017; Pedersen, 2001).
There are six common greenhouse gases controlled under the United Nations Framework Convention on Climate Change (UNFCCC). These are:
• Carbon dioxide (CO2) • Methane (CH4) • Nitrous Oxide (N2O) • Sulphur hexafluoride (SF6) • Perfluorocarbons (PFC) • Hydrofluorocarbons (HFCs)
Each of these have different abilities to contribute to climate change and this relative abilities are expressed by Global Warming Potentials (GWPs) which compare the gases’ relative abilities to contribute to climate change relative to the ability of CO2. In climate change calculations, when all gases are compared or added up after applying their GWPs a common unit of CO2-equivalent (CO2e) is used.

ERM MARUBENI
15
The carbon footprint for the Project has been estimated in accordance with the GHG Protocol: Corporate Accounting & Reporting Standard (WBCSD & WRI, 2004) (henceforth ‘GHG Protocol’), developed by the World Business Council for Sustainable Development (WBCSD) and the World Resources Institute (WRI). The GHG Protocol provides comprehensive guidance on accounting and reporting corporate GHG emissions for a range of sectors/emission sources. It provides the most widely used set of standards and tools for mandatory and voluntary GHG programmes and makes use of the Intergovernmental Panel on Climate Change (IPCC) GHG Inventory guidelines. Activity data has been sourced from the Project feasibility study (WSP | Parsons Brinckerhoff, 2015a) and decommissioning study (WSP | Parsons Brinckerhoff, 2015b), in addition to a focused GHG information request. Emissions factors have been sourced from the 2006 IPCC Guidelines for National Greenhouse Gas Inventories and GWPs are taken from the IPCC’s Fourth Assessment Report (AR4, published in 2007), in alignment with South Africa’s national GHG inventory for 2000-2010 (DEA, 2014b)1. Where specific emissions sources and factors were not available from the IPCC 2006 Guidelines and/or South Africa’s 2000-2010 national GHG inventory, other sources were referred to including the UK Department for Business, Energy and Industrial Strategy (BEIS)’s GHG Conversion Factors (UK BEIS, 2016). Further information on the data sources and calculation methodology is provided in Section 4.1 (GHG Emissions from The Thabametsi Project).
2.3 SCOPE OF THE CARBON FOOTPRINT
The carbon footprint includes all direct GHG emissions from sources owned or under the operational control of the Project (‘Scope 1’ emissions) and all indirect emissions from the consumption of purchased electricity (‘Scope 2’ emissions),
(1) Note that the 2000-2010 GHG Inventory for South Africa uses GWPs as published in the IPCC’s third assessment report, but notes that future GHG inventories for South Africa will use GWPs from AR4 in line with UNFCCC guidelines.
There are three tiers presented in the 2006 IPCC Guidelines for estimating emissions from fossil fuel combustion. The tier structure used in the IPCC Guidelines (Tier 1, Tier 2 and Tier 3) is hierarchical, with higher tiers implying increased accuracy of the method and/or emissions factor and other parameters used in the estimation of the GHG emissions and removals. In general terms:
• Tier 1 are simple methods with default values • Tier 2 are similar but with country-specific emission factors and
other data • Tier 3 are more complex approaches, possibly models or
technology-specific emission factors.

ERM MARUBENI
16
in line with guidance from international standards including the IFC’s Performance Standard 3 on Resource Efficiency and Pollution Prevention (IFC, 2012) ( 1 ). Scope 2 emissions are only relevant for the construction and decommissioning phases, because electricity needs for the power plant during operations, i.e. for power plant auxiliary power, will be derived from the plant itself. In line with the Environmental and Social Impact Assessment (ESIA) scope, emissions have been calculated for (total) 1 200 MW Project (2) under the DoE Coal Baseload IPP Programme. Emissions from the construction, operations and decommissioning phases are all included in the assessment for the purposes of completeness although it is noted that emissions associated with the construction and eventual decommissioning of the Project are often very small in the context of the Project’s operational emissions arising from the combustion of coal for power generation (3). The timeframe for the phases of the Project are illustrated in Table 2.1 below. All phases are included in the scope of the GHG assessment.
Table 2.1 Thabametsi Project Phases included in Scope
Phase Timeframe Duration Construction – Phase 1 (630 MW) 2017-2021 52 months (includes 6-
month lag between the two 315 MW blocks)
Construction – Phase 2* (additional 570 MW)
Q4 2023 Approx. 52 months
Operations – Phase 1 (630 MW generating capacity)
October 2020 (first 315 MW); April 2021 (second 315 MW)
Approx. 30 years
Operations – Phase 2 (additional 570 MW generating capacity)*
Around Q1 2028 Approx. 30 years
Decommissioning (Estimated based on 30 years’ operating life of plant): Up to 2051-2053
Not yet known
* Exact timings for Phase 2 are not yet known. As such, estimated timeframes are provided here. The following sources of emissions arising from activities under the operational control of the Project are included in the assessment: Construction phase: • Scope 1 stationary combustion emissions from diesel generators; • Scope 1 mobile combustion emissions from mobile vehicles / equipment
(civil & building works and mechanical & electrical works);
(1) IFC’s PS3 states that clients ‘will quantify direct emissions from the facilities owned or controlled within the physical project boundary, as well as indirect emissions associated with the off-site production of energy [i.e. electricity, heating and cooling energy] used by the project’. (2) Note that the Project will be developed in two Phases as detailed in Table 2.1 (3) See e.g. Dones et al., 2007, which shows that for lignite power plants, the contribution of non-operational (direct) emissions, including emissions from infrastructure construction, emissions control systems and other sources at the plant, and emissions from mining activities, are negligible in the context of cumulative CO2 emissions associated with electricity production.

ERM MARUBENI
17
• Scope 1 mobile combustion emissions associated with the transport of construction materials and workers to the site;
• Scope 1 mobile combustion emissions from the transport of waste from the site to waste treatment plants;
• Scope 1 land-use change emissions (land clearance); • Scope 1 emissions from the consumption of refrigerant gases; and • Scope 2 emissions from the consumption of electricity for construction
activities and staff accommodation. Scope 3 emissions associated with embodied carbon in construction materials, a potentially significant source of project-related GHG emissions, are also calculated (1). However, these are not included in the final numbers presented for total Construction, Operation and Decommissioning emissions which are specific to Scope 1 and 2 emissions, in line with IFC Performance Standard 3 guidelines (2). Operations phase: • Scope 1 stationary combustion emissions from the combustion of coal to
produce power (electricity), including auxiliary power for the plant’s own needs and power for the staff accommodation block;
• Scope 1 stationary combustion emissions from the combustion of light diesel oil used for cold start-ups at the power station;
• Scope 1 process emissions from the reaction of limestone (CaCO3) with sulphur dioxide (SO2) (this reaction produces CO2) (3) (IEA CIAB, 2010);
• Scope 1 fugitive emissions from the use of refrigerants in cooling systems;
• Scope 1 stationary diesel emissions associated with the use of back-up generators to run emergency auxiliaries in the case of complete grid shutdown; and
• Scope 1 emissions from non-energy products associated with the use of lubricants for machinery (a small proportion of the carbon-based lubricants and greases is oxidised during use, resulting in (albeit usually very small levels of) CO2 emissions).
Decommissioning phase: • Scope 1 stationary combustion emissions from diesel generators; • Scope 1 mobile combustion emissions from vehicles used for demolition
and other decommissioning activities; and • Scope 2 indirect emissions from the consumption of grid electricity.
(1) ‘Embodied’ carbon reflects the GHG emissions associated with the manufacture of the construction materials. (2) This emissions source is also relatively small and does not materially affect the overall results in terms of GHG emissions over the lifetime of the plant (see Section 4.1.1 and Section 4.1.4). (3) The following chemical reaction takes place between the limestone and sulphur dioxide as part of the desulphurisation process: CaCO3 (g) + SO2 (g) + ½ O2 (g) + 2 H2O (l) -> CaSO4.2H2O (s) + CO2 (g). The emissions resulting from this chemical reaction are referred to as ‘process emissions’.

ERM MARUBENI
18
Exclusions
The following sources of emissions arising from activities under the operational control of the Project during decommissioning are excluded from the assessment due to challenges in making necessary reasonable assumptions and estimations: • Scope 1 land-use change emissions reductions / benefits associated with
returning the site to ‘greenfield status’; and • Scope 1 mobile fuel combustion emissions associated with transporting
materials for reuse or recycling elsewhere.
2.4 ASSUMPTIONS
The following should be noted with respect to any assumptions made for the purposes of this assessment: • For the calculation of operational emissions, this study uses information
and data on the Project given in the Feasibility Study for the Thabametsi 630 MW coal-fired power plant, prepared by WSP | Parsons Brinckerhoff (Ref no.: ZA2155860), dated 11 September 2015 (1). This study addresses the GHG impacts from the 1 200 MW power plant, assuming that the technology and coal specifications described in the Feasibility Study for the initial 630 MW plant remain the same for the 570 MW plant in Phase 2 of the project. It should be noted the DoE’s requirements for future rounds of the Coal Baseload IPP Programme may change over time and it is possible that more efficient technologies and/or abatement solutions may be available for Phase 2 and as such the total emissions (and emissions intensity) may differ from the values projected in this study using data from the Phase 1 Feasibility Study. All key assumptions and information from the Feasibility Study that have been used as a basis for the GHG emissions calculations in Section 4.1 (GHG Emissions from The Thabametsi Project) are presented alongside the calculations and results.
• In order to estimate construction and decommissioning emissions from the final 1 200 MW plant (i.e. incorporating Phase 2, 570 MW), emissions are scaled up by a factor of 1200/630 and in doing so an assumption is made that the same activities will take place during the construction and decommissioning of Phase 2 as for Phase 1. As for operational emissions, key assumptions or notes in relation to the calculation of construction and decommissioning emissions are presented alongside the calculations and results in Section 4.1.
• This study refers to a variety of policy documents published by the South African government in order to undertake an analysis of South Africa’s energy and climate policy, to describe South Africa’s current national GHG emissions and inventory, and to project the country’s

ERM MARUBENI
19
GHG emissions forward to 2050 (done as part of the Baseline Description). In the absence of any information to suggest otherwise, the study assumes that existing policies and plans for both the energy sector and with respect to climate change mitigation will be implemented as described in existing policy documents. Any key assumptions made either in the policy documents or in any related analysis have been stated in the report.
• In considering the impact of the plant with respect to the GHG emissions intensity of the electricity generated, a number of comparisons are made, including comparisons against the current average grid emissions factor, and specifically against Eskom’s existing coal power plant fleet. In order to inform this analysis, this study assumes that older Eskom coal power plants (specifically Camden, Hendrina, Grootvlei, Kriel and Komati will start to be decommissioned from 2022, as described in Eskom’s Transmission Development Plan 2016-2025 (Eskom, 2015b) and the 2010-2030 Integrated Resource Plan (IRP) for Electricity (‘IRP’) (DoE, 2011).
2.5 LIMITATIONS
The limitations associated with the study are outlined below: • As part of the Impact Assessment, the study gives a long-term view of
GHG emissions from the Project, and in order to understand the implications of the Project on South Africa’s current and future national GHG emissions, and the impact on the country’s climate change mitigation commitments and reduction targets, GHG emissions from both the Project and South Africa as a whole are projected forward to 2050. The study uses information in published policy documents and plans to inform South Africa’s future GHG trajectory, and assumes that the plant will operate as planned in the Feasibility Study up to 2050 (i.e. follows a constant GHG trajectory where annual GHG emissions are constant over time). Any changes with respect to national energy policy and planning, and with respect to the specific operating context and mandate for the Project, will affect the analysis in this study.

ERM MARUBENI
20
3 BASELINE DESCRIPTION
This section presents the context in which the analysis of the Thabametsi Power Project’s GHG emissions should be understood, and against which the Project’s GHG and climate change impacts will be assessed. Specifically, it presents: • South Africa’s energy policy context, including the rationale for the IPP
Procurement Programme (and specifically the Coal Baseload IPP Programme, applicable to this Project);
• The country’s climate policy context, including the national GHG emissions inventory, international GHG emission reduction commitments, and a future GHG trajectory under a range of scenarios;
• Reference benchmarks on the GHG intensity of coal-fired power plants using different technologies, and on the GHG intensity of South Africa’s grid electricity; and
• Reference benchmarks from various international lender standards on the magnitude of GHG emissions from a project or development.
The above analysis is used to contextualise the Project’s emissions and to assess the climate change impact of the Project in terms of GHG emissions into the atmosphere and contribution to global climate change, in addition to its contribution to South Africa’s climate change commitments.
3.1 SOUTH AFRICA’S ENERGY LANDSCAPE
The 2013 National Development Plan (NDP) defines a long term vision for South Africa to ‘Eliminate poverty and reduce inequality by 2030’ and presents a range of national development priorities (e.g. education, provision of energy, and infrastructure) to achieve this. Various government departments contribute to the process and their agendas must be considered jointly to understand the dynamic between economic, social and environmental goals. From an energy perspective, the DoE is tasked with developing energy regulation, which comprises policy, action plans, and legislative directives, to ensure security of energy supply at the right price.
3.1.1 Energy Planning
White Paper on Energy Policy (1998)
The White Paper on the Energy Policy of the Republic of South Africa (1998) (hereafter ‘White Paper’) was prepared and finalised in 1998 in order to clarify the South African Government policy for the entire energy system, covering both supply and demand of energy for a decade. The major objectives stipulated in the White Paper included stimulating economic development, managing energy-related environmental impacts, and securing supply through diversity.

ERM MARUBENI
21
The White Paper specifically noted the Government’s intention to allow for the entry of multiple players into the electricity generation market, to further the development of renewable energy technologies, and to allow for privately owned distribution (see Section 3.1.2 for a discussion of the entry of IPPs into the energy market). In terms of electricity generation, the White Paper acknowledged the role of coal-fired baseload power generation in South Africa’s energy mix whilst noting the need for clean coal technologies and the use of best available technology for plant retrofits / new plants. The White Paper confirmed the potential for significant growth in South Africa’s gas industry and nuclear energy. From 1998 to 2008 however, no significant investments in additional electricity generation were made which resulted in an energy crisis and South Africa experiencing rolling electricity black outs in 2008. At this time, there was a shift to focus on demand-side management opportunities in the short-term whilst ensuring supply-side initiatives through the implementation of cross sector energy planning (Henneman et al., 2015). An overview of some of the key plans and policies that comprise Government’s response to the energy crisis, and which are intended as a framework to create stability within the energy sector going forward, is presented below. Integrated Resource Plan for Electricity 2010-2030 (2011)
In 2011 the DoE promulgated the first iteration of the 2010-2030 Integrated Resource Plan (IRP) for Electricity (‘IRP’) (DoE, 2011). The IRP 2010-2030 (2011) constitutes a 20 year electricity capacity plan, formulated to guide decision making around electricity policy and the future make up of South Africa’s total generation capacity between 2010 and 2030 in terms of the proportion of total electricity to be sourced from coal, nuclear, hydro/pumped storage, imported gas, wind, and solar, including Concentrated Solar Power (CSP) and Photovoltaic (PV). The IRP 2010-2030 (2011), having been promulgated by parliament in 2011 and published as a notice under the Electricity Regulation Act No. 4 of 2006, provides the adopted legal basis for Government’s electricity planning. It also aims to provide clarity around the Government’s plans for acquisition of least-cost energy resources. The IRP 2010-2030 (2011) factored in GHG emissions more fully than previous plans for the electricity sector, through factoring in the GHG emissions limits specified in South Africa’s Long term Mitigation Scenarios (LTMS) 2007 study (see Section 3.2.1), whilst also taking into account the impacts of the 2008 economic recession on electricity demand. In 2010, 90% of South Africa’s energy consumption was generated using coal, 5% using nuclear and 5% using hydro (DoE, 2011). The IRP 2010-2030 (2011) proposed that South Africa would reduce its dependence on coal based electricity generation from 90% to 65% by 2030 and transition to alternative generation options, so that electricity generated using nuclear power would comprise 20% of the total electricity share in 2030, and 14% would be

ERM MARUBENI
22
generated from renewables including wind and hydropower (5% each), PV (3%), and CSP (1%) (1). This transition was intended to be supported by a shift in new build options expected to come on stream over the period 2010-2030, with coal expected to make up 29% (including Medupi and Kusile (2)), renewables (including imported hydropower and pumped storage) 40%, nuclear 17%, and gas 4% of the additional 56 539 capacity (3) (net 45 637 MW, including decommissioning of 10 902 MW) planned between 2010 and 2030 (4). IRP 2010-2030 Update (2013)
The IRP 2010-2030 (2011) was designed to be a ‘living document’ with a two year review cycle. As such, in November 2013 the DoE issued a draft update of the document, hereafter IRP 2010-2030 (2013), for public comment. The original date set for Cabinet's final approval of the IRP 2010-2030 (2013) was established as March 2014 (DoE, n.d.). Given the delay in finalising the update, both Eskom and the DEA’s 2014 GHG Mitigation Potential Analysis study (see Section 3.2.3) defer to the data contained in the promulgated IRP 2010-2030 (2011) in the analysis applied to current and future electricity planning. The draft update of the IRP 2010-2030 (2011) in 2013 followed a prolonged period of depressed economic growth which has a direct correlation to electricity demand in the country. The 2013 update estimated an overall peak generation demand of 6 600 MW less than the first iteration of the IRP and a different contribution from electricity generation technology options. Table 3.1 below illustrates the proposed electricity generation mix for South Africa in 2030 based on the IRP 2010-2030 (2013) (column 3) and contrasts this to the original IRP 2010-2030 (2011), and existing electricity capacity as of 2010 (columns 1 and 2). The data presented in the table for 2030 (columns 2 and 3) reflect the ‘base case’ for 2030 as defined in the IRP process.
Table 3.1 Proposed electricity generation mix for 2030 based on the IRP 2010-2030 produced in 2011 and 2013 against 2010 baseline capacity
Energy Technology Option in 2030
2010 Baseline capacity (DoE, 2011) (5)
IRP 2010-2030 (2011) Generation mix for 2030 in MW (DoE, 2011) (6)
IRP 2010-2030 (2013) Generation mix for 2030 in MW (DoE, 2013b) (7)
Existing Coal* 34 435 34 821 36 230 New Coal** N/A 6 250 2 450 CCGT (Combined Cycle Gas Turbine)
0 2 370 3 550
(1) Renewables as defined per the IRP 2010-2030 (2011) (2) Medupi and Kusile are two new large coal-fired power stations currently under construction by Eskom. Each will have a capacity of 4 800 MW. (3) The remaining 15% of planned new capacity comprises diesel Open Cycle Gas Turbines (OCGT) and co-generation. (4) Note that the IRP factors in decommissioning of 10 902 MW, bringing net new build to 41 346 MW. (5) Table 27 – Existing South African Generation Capacity Assumed for IRP (6) Table 4 – Policy-adjusted IRP Capacity (7) Table 2 – Technology options arising from IRP 2010 and the Update Base Case in 2030.

ERM MARUBENI
23
Energy Technology Option in 2030
2010 Baseline capacity (DoE, 2011) (5)
IRP 2010-2030 (2011) Generation mix for 2030 in MW (DoE, 2011) (6)
IRP 2010-2030 (2013) Generation mix for 2030 in MW (DoE, 2013b) (7)
OCGT (Open Cycle Gas Turbine)
2 400 7 330 7 680
Hydro Imports*** 0 4 109 3 000 Hydro Domestic 600 700 690 PS (Pumped Storage) (incl. Imports)***
1 400 2 912 2 900
Nuclear 1 860 11 400 6 660 PV (Photo-voltaic) 0 8 400 9 770 CSP (Concentrating Solar Power)
0 1 200 3 300
Wind 0 9 200 4 360 Other 730 890 640 Non-Eskom*** 3 260 N/A N/A Total Installed Capacity (Eskom) 40 635 N/A N/A Total Installed Capacity (Eskom and non-Eskom) 43 895 89 532 81 230 *Existing Coal in 2030 (columns 2 and 3) includes Medupi and Kusile (Eskom power stations currently under construction), which is do not play a role in 2010 Baseline Capacity. Existing coal indicated for 2030 in columns two and three therefore takes into account the decommissioning of older power stations **Including Coal Baseload IPP Programme ***For the 2010 Baseline capacity as per IRP 2010-2030 (2011), imports for Hydro and Pumped Storage are incorporated into non-Eskom installed capacity. Based on detail in the draft updated IRP 2010-2030 (2013), non-Eskom installed capacity as of 2010 includes imported hydro (45%), coal-fired power plants (28%), co-generation (11%), medium-term power purchase program (8%), pumped storage (5%) and diesel temporary plants (3%) Additional cases are considered within the IRP 2010-2030 (2013) driven by varying assumptions for example around technology costs, economic growth, and potential extension of the lifespan of the existing Eskom fleet, though the ‘base case’ serves as the reference for planning. Draft 2012 Integrated Energy Plan (IEP)
The purpose and objectives of the Integrated Energy Plan (IEP) are informed by the National Energy Act, 2008 (Act No. 34 of 2008). The core purpose of the IEP is to guide the development of energy policies, the selection of appropriate technology to meet energy demand, and to guide investment in these technologies. It also aims to assist energy policy makers in understanding how energy policies contribute to other national policy imperatives (such as those espoused in the NDP). The focus of the IEP is not to ensure if or how energy needs are met, but rather a long term vision of for how energy can be optimally used. The IEP identifies eight key objectives that form the basis of the criteria against which the IEP evaluates different policy alternatives and proposals, six of which are relevant to the energy sector, specifically; 1. Security of energy supply. 2. Minimise cost of energy. 3. Increase access to energy. 4. Diversify supply sources and primary energy carriers.

ERM MARUBENI
24
6. 5. Minimise emissions from the energy sector. Improve energy efficiency (reduce energy intensity of the economy).
The IRP can be considered a sub-set of the IEP as it only focuses on electricity, with the IRP as an input into the IEP. The IEP analyses the results of a Base Case, and five Test Cases with respect to future energy demand to 2050 in South Africa (DoE, 2013a). These cases integrate the data available on South Africa’s energy and electricity landscape (including current policy implications) in order to model various scenarios for future energy use. The Base Case represents ‘business as usual’ where prevailing energy policy conditions are projected into the future, whilst the Test Cases model policy alternatives, including:
• The Peak, Plateau, Decline (PPD) Emissions trajectory (PPD Emissions Limit Test Case);
• Influence of no nuclear energy builds in future electricity mix (Emissions Limit – No Nuclear Build Programme Case);
• Influence of varying renewable energy targets (Renewable Energy Target Case);
• Influence of replacing nuclear with natural gas (Emissions Limit Natural Gas Case); and
• Influence of the constraints imposed by carbon taxes (Carbon Taxes Case).
These Test Cases are intended to integrate the objectives of a range of policies impacting the energy sector (1) including the broad goals of the NDP, the IRP and South Africa’s National Climate Change Response Policy (‘NCCRP’, discussed in Section 3.2) and highlight their implications, for example through the introduction of a carbon tax, on future energy options and costs. The analysis produced in the IEP reveals that coal technologies continue to play an important role in energy generation across all test cases up to 2030, when the existing fleet of coal power plants are assumed to begin entering retirement. New coal generation, e.g. constructed after the IEP publication date, continues to contribute to electricity supply up to 2050 in only two of the cases (50 GW by 2050 in the Base Case and 30 GW in the Renewable Energy Target Case). Carbon Capture and Storage (CCS) technologies were not considered as options due to their relatively high cost (DoE, 2013a) and have not been considered as part of the abatement options for the proposed Thabametsi plant in Section 5 of this report for that reason. The Electric Power Research Institute (EPRI) estimates that the addition of CCS can increase the capital cost of CFB plants by as much as 78% per MWh (EPRI, 2015). The other restriction to considering CCS as an abatement technology for Thabametsi is the fact that the relevant infrastructure for CCS is not yet available in South Africa.

ERM MARUBENI
25
The importance of renewables in Government’s energy planning are notable, given that wind and solar energy feature prominently across all test cases underpinning the IEP in terms of the final contribution these sources make to the total energy mix. New natural gas options do not feature prominently in any of the test cases. The DoE is however in the process of finalising a Gas Utilisation Master Plan (GUMP) for South Africa (IPP Gas, 2016) (1). The IEP was made available for public consultation in 2013 and is still in the process of being finalised. The development of South Africa’s electricity generation in recent years has been done against the promulgated IRP 2010-2030 (2011) (DoE, 2013a).
3.1.2 Delivery of additional energy capacity: The Independent Power Producers Procurement Programme
In May 2011, the DoE gazetted the Electricity Regulations on New Generation Capacity under the Electricity Regulation Act (ERA) of 2006 (No. 4 of 2006). The new regulations establish both the guidelines and rules pertaining to the procurement of energy from IPPs, as well as the structure and process of an IPP Bid Programme (Eskom, 2015). Specifically, Section 34 (1) of the ERA notes that ‘The Minister of Energy may, in consultation with the Regulator:
• determine that new generation capacity is needed to ensure the continued uninterrupted supply of electricity; and
• require that new generation capacity must- o be established through a tendering procedure which is fair,
equitable, transparent, competitive and cost-effective, and o provide for private sector participation.’
The objectives of these regulations include the regulation of entry by a buyer and an IPP into a power purchase agreement (PPA), the facilitation of fair treatment and the non-discrimination between IPP generators and the buyer. The IPP Procurement Programme (IPPPP) Office was established in 2010 by the DoE, National Treasury and the Development Bank of Southern Africa (DBSA) with the primary mandate to procure energy from IPPs. The introduction of IPPs into South Africa’s generation mix is deemed critical to ensure security of supply for South Africa. During the period of rolling blackouts in 2008 Eskom was operating at a reserve margin estimated at around 8% or lower, whilst global energy experts note that ideally a 10-15% reserve margin is required in a stable electricity system and South Africa is not currently operating within this range (Eberhard, 2008).
(1) The GUMP has been conceived as a roadmap for the development of a gas economy in South Africa and aims to stimulate local demand for gas through a ‘Gas to Power Programme’. Government anticipates that in alignment with the GUMP, the Gas to Power Programme will enable the development of South Africa’s gas sector.

ERM MARUBENI
26
The procurement mandate of the IPPPP is aligned to the capacity allocated to the various electricity generation sources in the IRP 2010-2030 (2011) (1). As of 31 December 2015, six bidding rounds had been completed (comprising various bidding ‘windows’), with 6 376 MW procured from renewable resources and 2 021 MW operationalised across 40 separate IPPs. The IPPPP Office has in addition initiated the Coal Baseload IPP Programme (discussed below) and has alluded it intends to commence with the procurement of gas to power energy resources through the Gas to Power Programme and implementation of GUMP (IPP Projects, 2016). Another imperative of the IPPPP is to introduce competitive pricing with respect to energy procurement. To this end, bidders are obliged to convey the price at which capacity/energy will be sold and are evaluated on a comparative basis (IPP Coal, 2016). Bidders must also comply with South Africa’s Broad Based Black Economic Empowerment (BBBEE), including ownership requirements ( 2 ), as well as to South Africa’s environmental regulations. The IPPPP mandate regarding capacity to be procured and progress of bidding processes and commercial operation dates are summarised in Table 3.2 below. As indicated, the stage of bidding process and commercial date achieved or planned for operations vary across the energy carriers. The Renewable Energy IPPPP has achieved greatest maturity, as of December 2015 100% of the projects submitted in the first bid window had achieved financial close and grid connection, with a further 89% (window 2) and 5.8% (window 3) connected to the grid. This represents approximately 2 021 MW of connected capacity. In addition, 6 377 MW of renewable projects were procured between November 2011 and December 2015: specifically, Wind (36 Projects - 3 366 MW); Solar PV (51 Projects, 2 322 MW); Solar CSP (7 Projects, 600 MW); Landfill Gas (1 Project – 18 MW); Biomass (4 Projects – 52 MW); and Small Hydro (3 Projects – 19 MW).
Table 3.2 Overview of IPPPP to Date
Type of Energy Source
Total Planned Capacity (MW)
Stage of Bids Commercial Operation Date
Renewable Energy* 13 225 Various Stages: Bids 1-3 have achieved financial close
Grid Connection across bid windows 1-3– new capacity to be added in phased approach
Imported gas to Power 3 000 Preparation Phase 2021 Coal local and cross border
2 500 Bid Completed 2021 Onwards
Cogeneration 1 800 Bid Completed 2016 –2018
(1) Some energy projects were developed prior to the gazetting of the New Generation Regulations, these include Eskom’s current new build programme, the medium term power purchase programme (~400MW) and the DoE's open cycle gas turbine (OCGT) IPP project (~1020MW) (Eskom 2016). (2) Specifically, 51% equity participation by South Africans and at least 30%of the shares in the project company owned by black South Africans.

ERM MARUBENI
27
Type of Energy Source
Total Planned Capacity (MW)
Stage of Bids Commercial Operation Date
Floating Power Plants Conceptualisation Phase – Project on Hold
N/A
Domestic and Piped gas
126 Preparation Phase 2018-2019
Peaking Power 1 020 Bid Completed 2015-2016 Source: IEEJ, 2016 Coal Baseload IPP Programme
In 2015 the DoE issued briefing notes on the Coal Baseload IPP Programme (1). The DoE has allocated a maximum of 2 500 MW to be sourced through the Coal Baseload IPP Programme, with the main objective to secure South Africa’s baseload energy supply. The Coal Baseload IPP Programme comprises separate bid ‘windows’ and the first bid window opened on 2 November 2015. Bidders have been limited to a maximum 600 MW (net capacity) per project submitted (no minimum generation capacity was prescribed). Project bids can be submitted in relation to Single, Multiple, or Cross Border purchasers of capacity or energy generated by a project (2). New generation capacity under the Coal Baseload IPP Programme is required to be connected to the national grid by no later than December 2021 (IPP Coal, 2016b). The proposed Thabametsi power Project (Phase 1 – 630 MW) is an application for development under the Coal Baseload IPP Programme.
3.2 SOUTH AFRICA’S CLIMATE CHANGE LANDSCAPE
The Department of Environmental Affairs (DEA) is responsible for ensuring delivery of South Africa’s climate change commitments as laid out in the National Climate Change Response Policy (NCCRP), published in October 2011, and confirmed through South Africa’s recent commitments to the United Nations Framework Convention on Climate Change (UNFCCC).
3.2.1 National Climate Change Response Policy 2011
The NCCRP establishes South Africa’s approach to addressing climate change, including adaptation and mitigation responses. The NCCRP formalises Government’s vision for a transition to a low carbon economy, through the adoption of the ‘Peak, Plateau and Decline’ (PPD) emissions trajectory. The NCCRP establishes the PPD as the benchmark against which South Africa’s future mitigation actions will be measured (DEA, 2011). The research underpinning the PPD trajectory and its implications for future electricity generation are described in further detail in the sections below.
(1) Briefing Notes 6, 11, 12 and 13. (2) Multi-buyer projects cannot be submitted in the first bid submission phase because the addendum referred to in the RFP has not been issued by the DoE yet. The DoE is still considering what to do about multi-buyer projects.

ERM MARUBENI
28
South Africa PPD Emissions Trajectory
In 2007, the Government commissioned the Long term Mitigation Scenarios (LTMS) report to investigate potential pathways for South Africa to mitigate its GHG emissions (DEAT, 2007). The Government published the results of the LTMS in 2008, and in 2009 used the PPD trajectory that emerged from the process (illustrated in Figure 3.1) to define its first climate mitigation pledge under the UNFCCC’s Copenhagen Accord. The pledge stated the intention to ‘take nationally appropriate mitigation action to enable a 34% deviation below the Business As Usual (BAU) emissions growth trajectory by 2020 and a 42% deviation below the BAU emissions growth trajectory by 2025’ (DEA, 2010).
Figure 3.1 South Africa's 'Peak Plateau and Decline' Trajectory
Based on the PPD, South Africa’s emissions should peak between 2020 and 2025, plateau for approximately a decade, and then decline in absolute terms thereafter. The South African Copenhagen pledge was conditional on a fair, ambitious and effective agreement being agreed in the international climate change negotiations as well as the provision of financial resources, the transfer of technology, and capacity building support from developed countries to developing countries.
3.2.2 South Africa’s Intended Nationally Determined Contribution (INDC)
Further to South Africa’s Copenhagen pledge, the Government agreed to submit its Intended Nationally Determined Contribution (INDC) to the UNFCCC (1) in advance of the 21st Conference of Parties (COP) which took
(1) INDCs refer to the overall reduction in the annual quantum of GHG emissions a country seeks to achieve over an agreed period of time. Preparation of INDCs is mandated by UNFCCC decisions 1/CP.19 and decision 1/CP.20, the latter specifying information for mitigation (paragraph 14); and in paragraph 12 providing options to communicate an adaptation
Source: South African Department of Environmental Affairs

ERM MARUBENI
29
place at the end of 2015 in Paris, when 148 countries worldwide submitted their GHG reduction pledges to the UNFCCC, setting out the extent to which they intend to reduce their national GHG emissions. South Africa’s INDC submission takes account of the country’s development imperatives. The 2025 target in the INDC corresponds to the same 2025 emissions target from the previous pledge. However, the 2009 pledge did not specify a BAU emissions scenario, whilst the INDC specifies an intended emissions range up to 2030 and includes an emissions ‘peak’, after which emissions will decline in absolute terms thereafter (DEA, 2015) (WRI, 2015). South Africa’s INDC notes that ‘South Africa will use five-year periods of implementation at the national level, specifically, 2016-2020 focused on developing and demonstrating the mix of policies and measures that will be deployed in order to meet South Africa’s Copenhagen pledge, and the periods 2021-2025 and 2026-2030 to achieve the INDC’ (DEA, 2015) ( 1 ). The Government believes that this will enable South Africa’s GHG emissions to peak between 2020 and 2025, plateau for approximately a decade and decline in absolute terms thereafter. Within the INDC, there is no specific discussion of the process that should be put in place to ensure that proposed developments will enable the delivery of South Africa’s commitments.
3.2.3 South Africa’s National GHG Inventory
Information on South Africa’s annual GHG emissions has been derived from South Africa’s GHG Inventory 2000-2010, and South Africa’s INDC. The Government, as a signatory to the UNFCCC, is obliged to submit a regular inventory of its GHG emissions. The first GHG inventory was prepared in 1998. The latest GHG inventory was produced for the period 2000-2010 (and submitted in 2014) and is aligned to the 2006 IPCC guidelines for National GHG Inventories. South Africa’s 2010 GHG emissions by sector are described in Table 3.3. In total, South Africa’s GHG emissions in 2010 were estimated to be 544 million tonnes (Mt) CO2e, excluding forestry and other land uses (FOLU) which are estimated as net carbon sinks. Including FOLU, total GHG emissions in 2010 are 518 Mt CO2e. The energy sector is a large contributor to GHG emissions in South Africa, predominantly as a result of fossil fuel combustion. The GHG emissions from the energy sector alone in 2010 were 428 Mt CO2e, which accounted for 78.7% of the total national GHG emissions (excluding emissions from FOLU (DEA, 2014a) (UNFCCC, 2015). Eskom accounted for 55% of South Africa’s total accumulated emissions over the period 2000-2010.
component of an INDC (A-INDC), or “undertakings in adaptation planning”. South Africa has submitted a single INDC, including adaptation, mitigation and an indicative required means of implementation for both. (1) Achieving the PPD/INDC commitments suggests that a combination of investment in abatement technologies, taxes and incentives will be required to meet South Africa’s future emissions targets. A discussion of these aspects is however out of the scope of the GHG impact assessment.

ERM MARUBENI
30
Table 3.3 South Africa 2010 GHG Emissions by Sector
Sector Emissions (t CO2e) % total emissions (excl. FOLU) by sector
Energy 428 368 000 79% Industrial processes* 44 351 000 8% Agriculture Forestry and Other Land Uses (excl. FOLU)
51 789 000 10%
Agriculture Forestry and Other Land Uses (incl. FOLU)
25 714 000 5%
Waste 19 806 000 4% Total (excluding FOLU) 544 314 000 Total (including FOLU) 518 239 000 Source: DEA, 2014b *Note coal used for metallurgic processes is accounted for under industrial processes to avoid double counting **Emissions per sector calculated against total (excluding FOLU) As described, under the INDC, national emissions in 2025 and 2030 will be limited to between 398 and 614 Mt CO2e (compared to 544 Mt CO2e excluding FOLU / 518 Mt CO2e including FOLU in 2010). The Government has stated in the INDC that the long term objective is to reduce GHG emissions by 212 to 428 Mt CO2e by 2050, after having declined in absolute terms from 2036 onwards. It should be noted that the Government has also stated that these goals could change as and when new information becomes available. The baseline from which these reductions are to be achieved is established as 2016 (DEA, 2015). South Africa’s projected GHG emissions up to 2050 to meet the INDC (or PPD) were unbundled by the DEA in a GHG Mitigation Potential Analysis for South Africa (DEA, 2014a). The study presented the projection of national GHG emissions into the future, based on economic growth projections aligned to the medium term growth scenario defined in the IEP of 4.2% per annum and long term projection of 4.3% as per the 2012 Medium Term Budget Policy Statement (DEA, 2014a), as well as power sector commitments as defined the IRP 2010-2030 (2011). Both the upper and lower range of the INDC commitments are reflected in Table 3.4 below.
Table 3.4 Projected GHG Emissions for South Africa based on its INDC to the UNFCCC
Year Estimated annual emissions – South Africa (t CO2e) - PPD Lower Range
Estimated annual emissions – South Africa (t CO2e) - PPD Upper Range
2020 398 000 000 583 000 000 2025 398 000 000 614 000 000 2030 398 000 000 614 000 000 2035 398 000 000 614 000 000 2040 336 000 000 552 000 000 2045 274 000 000 490 000 000 2050 212 000 000 428 000 000 Source: DEA (2011); DEA (2014a). Based on PPD emissions trajectory and assuming linear decline to INDC targets by 2050 from 2035 levels.

ERM MARUBENI
31
In the DEA’s 2014 GHG Mitigation Potential Analysis study, the potential GHG abatement available to South Africa was considered against the PPD/ INDC commitments to 2050. Specifically, the analysis presented numerous GHG emissions trajectories that assumed the implementation of identified mitigation options to varying degrees, specifically: ‘Growth without Constraints’ (GWC) ( 1 ), ‘Without Measures’ (WOM) ( 2 ), ‘With Existing Measures’ (WEM) ( 3 ), and ‘With Additional Measures’ (WAM) ( 4 ), and compared these against the PPD trajectory (DEA, 2014a). Figure 3.2 illustrates the results of the assessment.
Figure 3.2 National GHG Emissions Trajectories
Source: DEA, 2014a. The results illustrate a gap between the PPD trajectory, and the country’s emissions trajectory under the various mitigation scenarios. Only the WAM-75% (which implements 75% of national mitigation potential) and the WAM-100% (which implements 100% of national mitigation potential) track within the defined limits of the PPD trajectory for a period of time:
• WAM-75% tracks within the upper range up until 2030; and • WAM-100% tracks within the PPD trajectory up until 2040.
Beyond 2040, the emissions trajectories from all the mitigation scenarios (including WAM-100%) cease to track the PPD trajectory, suggesting that the current national mitigation potential identified is not sufficient to bring about
(1) GWC refers to growth without constraints imposed by GHG emissions reduction targets (i.e. without applying mitigation measures). The GWC trajectory was developed as part of the LTMS study referenced in Section 。. (2) The WOM is a projection of emissions from 2000 to 2050 which assumes that no climate change mitigation actions have taken place, i.e. does not take into account the mitigation actions actually implemented to date. (3) WEM incorporates the impacts of climate change mitigation actions including climate change policies and measures implemented to date. The projections follow the actual path of observed emissions for the period 2000 to 2010. (4) National abatement pathways based on WAM projection assume different levels of implementation of the national mitigation potential (100%, 75%, 50%, and 25%).

ERM MARUBENI
32
the PPD trajectory. However, it should be noted that the Mitigation Potential Analysis considered the IRP 2010-2030 (2011) projections for the energy sector, and since the planning horizon for the IRP 2010-2030 (2011) is established at 20 years, coal and non-coal based energy sources were assumed to hold constant after this time. However, as stated in Section 3.1, specific targets have been established for the decommissioning of old Eskom coal fired power stations by 2025 and the decommissioning of power stations once they have reached the end of a 50-year lifespan (DoE, 2011). It is assumed that with subsequent revisions of the IRP, a longer time horizon will be considered, and (as indicated in the IEP) when factoring in the retirement of some of the existing coal-fired power station fleet beyond 2030, these trajectories may start to track the PPD more closely. The Mitigation Potential Analysis study concluded that more ‘aggressive decarbonisation’ of South Africa’s energy supply will be needed in future iterations of the IRP if the targets set out in the PPD are to be achieved (DEA, 2014a). Whilst noting the clear mandate from an energy policy perspective to source additional baseload power from coal, this creates some uncertainty with respect to the exact contribution of coal-fired power plants to meet South Africa’s future energy needs in the longer term.
3.3 EMISSIONS INTENSITY OF THE SOUTH AFRICAN GRID AND OF COAL-FIRED POWER PLANTS
The emissions intensity of electricity production varies depending on how the electricity is produced. The burning of carbon-rich fossil fuels in coal or natural gas fired thermal power plants produces significant GHG emissions, whereas renewable technologies (such as wind or solar) produce very little emissions during operation. The carbon or emissions intensity of electricity can be assessed by measuring and comparing the GHG emissions per unit of electricity produced, i.e. t CO2e per MWh, across different plants. This metric (emissions intensity) is correlated to the heat rate and thermal efficiency of the plant, i.e. the amount of energy used by the plant to produce one kWh of electricity (a higher thermal efficiency means that a higher proportion of the energy consumed by the plant is converted into electricity for distribution to the grid). Since the mix of energy sources used to generate electricity for the grid varies across geographies, so does the emissions intensity of each country’s electrical grid. The grid emissions factor reflects the amount of GHGs (expressed as tonnes of CO2e) emitted per MWh electricity generated.
3.3.1 South African Electrical Grid Emissions Factor
In South Africa, the national electricity grid is owned and operated by Eskom, a state-owned company. Eskom generates approximately 95% of the country’s electricity, and is responsible for electricity transmission and distribution to consumers across the country (Eskom, 2015a). Approximately 90% of Eskom’s electricity comes from coal fired power plants (Eskom, 2016b). Eskom has an

ERM MARUBENI
33
aging fleet, with 81% of the operating coal-fired power plants being older than 20 years as of 2012 (Figure 3.3). Prior to 2015, all of Eskom’s fleet made use of subcritical steam conditions. The use of supercritical (SC) and ultra-supercritical (USC) coal-fired technologies allows higher efficiencies and lower GHG emissions (per MWh generated), as discussed in Section 3.3.2 below. Not captured in Figure 3.3 are the two major coal fired power plants currently under construction by Eskom: Kusile and Medupi. Kusile (4 800 MW, comprising six 800 MW units) is expected to enter commercial operations in the late 2017, and will use supercritical steam conditions. Medupi (similar capacity and number of units as Kusile) will also use supercritical steam, and the first unit (Unit 6) began feeding power into the South African national grid in 2015 (ESI Africa, 2015).
Figure 3.3 Profile of South Africa’s Operating Coal-Fired Power Plants
Source: IEA (2012): CCS Retrofit - Analysis of the Globally Installed Coal-Fired Power Plant Fleet For the period 1 April 2014 to 31 March 2015, Eskom published its emission factor of 1.01 t CO2e per MWh (Eskom, 2015a). This factor is based on total emissions of CO2e associated with all its production facilities, and total electricity generated (from coal, gas, nuclear, hydropower, pumped storage, and wind energy), excluding that which is consumed by Eskom, and excluding losses from transmission and distribution. There is no publicly available information or published emissions factor to account for the overall South African grid emissions intensity (i.e. including the additional 5% generated by IPPs or imported), but, with Eskom responsible for the generation of the bulk of the country’s electricity (95%), this is unlikely to make a material difference to the published factor from Eskom. Emissions Intensity of Eskom’s Plants
Eskom published data on the CO2 emissions intensity of its coal-fired power plants in 2010/11, illustrating the emissions (t CO2 only rather than t CO2e) per MWh sent out (Figure 3.4). Whilst CO2 is the most significant GHG emitted
SUBSC = Subcritical steam conditions. No plants use supercritical or ultra-supercritical steam conditions

ERM MARUBENI
34
by coal-fired power plants, combustion of coal in power plants also leads to relatively smaller emissions of CH4 and N2O. (1) These, in combination with CO2, lead to the total ‘CO2e’ emissions from the plants. The data for 2010/11 were released prior to recent developments in GHG accounting (such as the recently enacted South African GHG Emission Reporting Regulations) which will require major installations such as power plants to report GHG emissions in tCO2e and use appropriate technology-specific ‘Tier 3’ emission factors. The average emissions intensity of its existing coal-fired power stations in 2010/11 was 1.04 t CO2 per MWh, with a range of 0.89 – 1.26 t CO2 per MWh for individual plants (Eskom, 2011), as shown in Figure 3.4 below (2). Medupi and Kusile, using more efficient technologies (i.e. supercritical steam), are expected to have a lower emissions intensity of 0.75 and 0.78 t CO2 / MWh respectively. As the units from these two power plants are progressively brought online, these will act to decrease the average emissions intensity factor for Eskom’s coal-fired power stations. However, it should also be noted that the existing fleet will require the installation of flue gas desulphurisation (FGD) units, NOx abatement technologies and electrostatic precipitators / fabric filter plants which are required to reduce SOx, NOx and particulate matter emissions (respectively) to within limits set out in the National Environmental Management Air Quality Act (2010). This will result in higher water consumption and higher auxiliary power consumption which will increase the emissions intensity of the existing coal fleet over the coming years (Eskom, 2010). Thabametsi will comply with these emissions limits, this is dealt with in the main EIA. It must also be noted that the majority of Eskom coal plants are water cooled which increases efficiency in comparison to Thabametsi’s air cooled plant but results in much higher water consumption.
(1) The other 3 greenhouse gases controlled under the UNFCCC ( SF6, HFCs and PFCs) are synthetic industrial gases that are not emitted by coal power plants (EC, 2017; C2ES,2017; Pedersen, 2001)
(2) It is not stated whether MWh sent out used to calculate these metrics includes losses associated with transmission and distribution.

ERM MARUBENI
35
Figure 3.4 CO2 Emissions intensity of Eskom’s coal-fired power plants in 2010-11
Source: Eskom (2011) ERM has confirmed with Eskom that the data in Figure 3.4 do not include CH4 and N2O emissions. ERM has asked Eskom for CO2e data for the plants, but this has not yet been received. In absence of receiving this data from Eskom, ERM has estimated the GHG emissions intensity specific to Eskom’s coal fired power plants, using publicly available information on the combustion technology of each of the plants shown in Figure 3.4, and by applying IPCC Tier 3 emission factors (Figure 3.5). The average emissions intensity of the plants, when the emissions of CH4 and N2O are included in the calculations, is calculated at approximately 1.05 t CO2e / MWh, with a range of 0.90 – 1.27 t CO2e/MWh. In order to allow a proper comparison of CO2e performance for the proposed Thabametsi plant vs the Eskom plants which it may replace on the grid, ERM used this same approach to make its own estimation of the CH4 and N2O emissions from the Eskom plants which are due to be decommissioned in the 2020s (see Figure 3.6 and Table 4.8). The approach taken can be considered to be in line with accepted international good practice.

ERM MARUBENI
36
Figure 3.5 GHG Emissions intensity (CO2, CH4 and N2O) of Eskom’s coal-fired power plants in 2010-11
Source: Eskom (2011) plus ERM calculations based on application of Tier 3 factors from IPCC (2006a) It is known that power plants tend to lose efficiency over their lifetime. The average observed energy efficiency loss of the power plants over the period 2009/10 – 2013/14 reported by Eskom (2017) was used to estimate the potential increase in the Eskom coal power plants’ GHG (CO2, CH4 and N2O) emissions by 2021/22 (the projected date when operation of Thabametsi will begin). These projections are shown in Figure 3.6 below. The results show that by 2021-22 it is projected that if all of Eskom’s coal-fired power plants remain in operation until then and Kusile and Medupi are added to the fleet, the entire coal-fired fleet of Eskom will have an estimated emissions intensity of 1.05 tCO2e/MWh, ranging from Medupi’s 0.75 MtCO2e/MWh to Tutuka’s 1.41 tCO2e/MWh.

ERM MARUBENI
37
Figure 3.6 Projected GHG Emissions intensity (CO2, CH4 and N2O) of Eskom’s coal-fired power plants in 2021-22
Source: Eskom (2011) plus ERM calculations based on application of Tier 3 factors from IPCC (2006a) and projections to 2021-22 based on historical thermal efficiency loss.
3.3.2 Emissions Intensity of Coal-Fired Power Plants
The emissions intensity of coal-fired power plants can be assessed through the emissions per kWh or MWh generated (t CO2 / kWh or\ t CO2e / MWh), and through the thermal efficiency rating for the plant (expressed as a percentage and representing the proportion of fuel input energy converted into kWh). An increase in 1% of the thermal efficiency of a plant results in a 2-3% reduction in CO2 emissions (IEA, 2014). The relationship between efficiency and specific CO2 emissions is illustrated in Figure 3..

ERM MARUBENI
38
Figure 3.7 Example of the relationship between CO2 emissions and net plant efficiency
Source: IEA CIAB (2010) The average efficiency of coal-fired power plants varies significantly, from under 30% to over 45% (net, using Lower Heating Values (LHVs)) (IEA, 2012a). Numerous factors affect a plant’s efficiency, including the choice of technology, steam conditions, coal quality, local climatic conditions, operating and maintenance practices, and plant age. There are alternative technology solutions which can be considered in order to reduce GHG emissions and improve efficiencies for coal-fired power plants. The most significant improvements are influenced by the design of the plant, and in terms of the steam conditions. Depending on the size of the unit, coal quality, and local conditions, a conventional or subcritical plant (operating at temperatures up to 540°C) and has a thermal efficiency of 30 – 39%. SC and USC technologies allow much higher temperatures and steam pressures to be achieved and significantly higher plant thermal efficiencies to be achieved of up to 42% (SC) and 45% (USC), illustrated in Table 3.5.
Table 3.5 Steam conditions, thermal efficiency, and emissions intensity of pulverised coal-fired power plant technologies
Technology Steam temperature
Steam pressure
Thermal efficiency (LHV, net)
CO2 intensity factor (LHV, net)
Subcritical <540°C <22.1 MPa 30 - 38% >0.88kg CO2/kWh Supercritical >540°C 22.1 – 25 MPa Up to 42% 0.8-0.88kg
CO2/kWh Ultra-supercritical >600°C 25 – 29 MPa Up to 45% 0.74-0.8kg
CO2/kWh Sources: IEA,2012a; IEA, 2012b; Minchener, 2012
Integrated gasification combined cycle (IGCC) technologies use gasification to convert coal into a gaseous fuel (syngas) which is cleaned prior to being combusted in a combined cycle gas turbine. The combined cycle turbine

ERM MARUBENI
39
comprises a gas turbine process and a steam turbine process, which includes a heat recovery steam generator. Using combined cycle technologies, IGCC plants can achieve efficiencies of over 45% (LHV, net), which is comparable with ultra-supercritical steam systems for pulverised coal. Whilst there are currently few coal-fired IGCC plants in commercial operation, it is thought that when IGCC reaches maturity, the emissions intensity of IGCC units could be below 670g (0.67kg) CO2/kWh (IEA, 2012a). The main restriction to IGCC is the high capital cost, with estimates ranging from about USD 1 500/kW to well over USD 3 000/kW. Further to that, as the starting point the Coal Baseload IPP Programme RFP excluded IGCC in the technical criteria altogether and limited the technologies to Pulverized coal and CFB. As demonstrated by Figure 3.7 and explained previously, in order to drastically reduce GHG from coal-fired power stations (and the GHG intensity of the electricity they generate), carbon capture and storage (CCS) is required. CCS comprises three integrated stages: the capture and compression of CO2 emitted from the plant; transport of the (supercritical or dense phase) CO2, and CO2 storage through injection into selected geological formations (or storage and utilisation for enhanced oil recovery). CCS has the potential to reduce CO2 emissions to below 100g (0.1kg) CO2 / kWh (IEA, 2012a). However, the use of CCS technologies creates cost challenges (increase the capital cost of CFB plants by as much as 78% per MWh (EPRI, 2015)), and the increase in plant auxiliary energy consumption for the capture process can result in a reduction in thermal efficiency of 7-10%. Whilst CCS is technically viable, its application is currently limited to demonstration plants, and the technology has not yet been applied in South Africa. However, a CCS Roadmap has been developed for South Africa, and CCS demonstration plant is planned, together with the required CCS policies and legal and regulatory frameworks (SACCCS, 2016). Other measures exist to reduce the emissions intensity of electricity produced by coal-fired power plants, though to a lesser degree than the technologies described above. These include, amongst others: the inclusion of a second reheat stage on the steam turbine (up to 1% increase in thermal efficiency); decreasing the condenser pressure (up to 1.5% increase); reducing the excess air ratio in boilers (up to 0.3% increase); reducing the stack gas exit temperature and recovering the heat (up to 0.3% increase); together with a range of measures oriented around steam leaks reduction, optimisation of equipment, and systems upgrades, for existing plants (IEA, 2014). Some of these measures (applicable to Thabametsi) are discussed further in Section 5- Emissions Management Measures.
3.4 MAGNITUDE SCALE FROM INTERNATIONAL LENDER STANDARDS
An additional perspective on the magnitude of the Thabametsi Power Project’s GHG emissions is provided by standards that are applied to developments at an international level. Table 3.6 shows a magnitude scale for project-wide GHG emissions that is derived from, and in line with, a number of current international lender organisations or groupings, such as

ERM MARUBENI
40
International Finance Corporation (IFC) standards, the European Bank for Reconstruction and Development’s (EBRD) GHG assessment methodology and the Equator Principles (EP).
Table 3.6 Magnitude scale for project-wide GHG emissions based on wider standards
Project-Wide GHG Emissions / annum Magnitude Rating >1 000 000 tonnes CO2e Very Large 100 000 – 1 000 000 tonnes CO2e Large 25 000 – 100 000 tonnes CO2e Medium 5 000 – 25 000 tonnes CO2e Small <5 000 tonnes CO2e Negligible
The magnitude scale shown in Table 3.6 draws together a number of reporting thresholds adopted by the IFC, EBRD and EP, described below. IFC reporting thresholds
The IFC’s Performance Standard 3: Resource Efficiency and Pollution Prevention defines a reporting threshold for annual GHG emissions of 25 000 t CO2e, and requires clients to ‘…consider alternatives and implement technically and financially feasible and cost-effective options to reduce project-related GHG emissions during the design and operation of the project’ (IFC, 2012). EBRD reporting thresholds
An annual GHG emissions threshold of 25 000 t CO2e has also been adopted by the EBRD within its new Environmental and Social Policy, which entered into force in November 2014. This updated policy reduces the GHG reporting threshold within projects that the EBRD supports from 100 000 to 25 000 t CO2e per year, and requires annual client quantification and reporting of these emissions. EBRD guidance on assessment of GHG emissions also defines a series of categories and thresholds for different project types (shown in Table 3.7) (EBRD, 2010).
Table 3.7 EBRD GHG Emissions Reporting Categories
GHG Emissions / annum Magnitude Description > 1 000 000 t CO2e High 100 000 – 1 000 000 t CO2e Medium-High 20 000 – 100 000 t CO2e Medium-Low < 20 000 t CO2e Low Not defined Negligible
Equator Principles reporting thresholds
The EPs require all projects, in all locations, to conduct an alternatives analysis to evaluate less GHG intensive alternatives when combined Scope 1 and Scope 2 operational emissions are expected to be more than 100 000 t of CO2 equivalent annually. In addition, the EP require that the client (should) report combined Scope 1 and Scope 2 Emissions, publicly on an annual basis, during the operational phase for projects emitting over 100 000 t of CO2

ERM MARUBENI
41
equivalent annually. It notes further that clients would be ‘encouraged’ to report publicly on projects emitting over 25 000 t of CO2e (EP, 2014). Owing to the limitations associated with assessing the magnitude of GHG emissions from a project using national GHG emissions as a benchmark, discussed in detail above, the magnitude scale presented in Table 3.7 will be used in order to assess the magnitude of emissions from the Project.

ERM MARUBENI
42
4 IMPACT ASSESSMENT
4.1 GHG EMISSIONS FROM THE THABAMETSI PROJECT
As noted in Section 2.2, GHG emissions from the Project are assessed by applying emissions factors to activity data relating to any GHG-causing Project activities. In order to obtain the activity data required for the assessment the following was undertaken: • The Thabametsi 600 MW Coal Fired Power Plant Feasibility Study,
dated 11 September 2015, was reviewed in order to obtain data for Phase 1 operations (WSP | Parsons Brinckerhoff (2015a);
• The Thabametsi Power Station Site Decommissioning Study, for Phase 1 was reviewed in order to obtain information relating to the decommissioning of Phase 1 (WSP | Parsons Brinckerhoff (2015b); and
• Additional GHG information requests were issued in order to obtain information on the construction (and additional information on the operations and decommissioning) of Phase 1
It is important to note that detailed activity data was available for Phase 1 (by way of the originally planned 600 MW plant, for operations, and for the updated 630 MW plant for construction and decommissioning). As noted in Section 2.4 (Assumptions), emissions calculations for Phase 1 were subsequently scaled up by a factor of 2 (for operations) or a factor of (1200/630) (for construction and decommissioning) in order to estimate emissions from the final 1 200 MW plant. Using the activity data, the relevant GHG emissions factors were applied in order to estimate total emissions of GHGs, expressed as ‘carbon dioxide equivalents’ (CO2e), per year. Table 4.1 presents a summary of the GHG emissions for the full lifecycle of the Thabametsi power plant including the construction and decommissioning phases, assuming that operating conditions remain the same over the 30 year life-time of the plant, and not accounting for any decrease in thermal efficiency over time.

ERM MARUBENI
43
Table 4.1 Thabametsi’s GHG emissions over its life-cycle split by activity (1)
Source of emissions Estimated GHG emissions (tCO2e) % Construction 261 707 0.088% Operations 296 385 671 (9 879 522 per year) 99.911% Decommissioning 3 736 0.001% TOTAL 296 651 114 100%
GHG emissions from each activity and phase are discussed in the sections below.
4.1.1 GHG emissions during Construction
Table 4.2 summarises total estimated GHG emissions during the construction of the 1 200 MW plant. Detailed data was provided for construction activities taking place for Phase 1 (630 MW). In order to estimate construction emissions for the overall 1 200 MW project, emissions were scaled up accordingly and an assumption made that the same construction activities and volumes of materials would be used for Phase 2 (570 MW). Construction of Phase 1 (630 MW) will take place over an estimated 54 months (4.5 years), including a 6-month lag between individual 315 MW blocks. The exact timings for the construction of Phase 2 (570 MW) are not yet known and as such construction emissions are presented as total (cumulative) emissions over the course of the construction for Phase 1 and Phase 2 (total 1 200 MW).
Table 4.2 Estimated GHG emissions arising from the construction of the Thabametsi Coal Fired Power Plant
Construction activity Total Estimated Construction Phase Emissions (1 200 MW) (t CO2e)
Data Source, Notes and Assumptions
SCOPE 1 Fuel combustion in diesel generators (power production)
751 Activity data source: response to GHG information request
Fuel combustion in mobile vehicles and equipment on site + transportation for workers
14 996 Activity data source: response to GHG information request
Fuel combustion in vehicles used to transport construction materials to the site
14 755 Activity data source: response to GHG information request. Estimated transport distances of 500 – 1000km depending on material
(1) It is assumed that the plant will operate at the same load factor annually, despite decrease in thermal efficiency. This will result in slight decrease in electrical output yearly.

ERM MARUBENI
44
Construction activity Total Estimated Construction Phase Emissions (1 200 MW) (t CO2e)
Data Source, Notes and Assumptions
Fuel combustion for the transport of solid & liquid wastes from the site
7 888 Activity data source: response to GHG information request. Solid waste is transported from the construction site for both Phase 1 & 2 Wastewater is transported from the site during Phase 1 only (on-site wastewater treatment plant will be operational during the construction of Phase 2) Assumes solid and liquid waste is transported 100km from the site
Land-use change (land clearance)
155 393 Activity data source (area cleared): Final Environmental Impact Report (Savannah Environmental, 2015). Assumes total 652 Ha land cleared Assumes land use category ‘woodland/savanna’ with biomass carbon stock 65 dm ha-1 (DEA, 2014b). Methane and N2O emissions associated with land use change are excluded in line with the methodology presented in the South African National GHG Inventory for 2000-2010 (DEA, 2014a) Assumes eventual release of biomass carbon into the atmosphere (e.g. decomposition / combustion)
Consumption of refrigerant gases
25 536 Activity data source: response to GHG information request Assumes an equal split of R407c, R410a and R134a refrigerant gases are used
SCOPE 2
Electricity consumption (construction power + worker accommodation)
42 388 Activity data source: response to GHG information request Grid electricity is required for Phase 1 (630 MW) only as power requirements for Phase 2 construction will be met by Phase 1 Plant
TOTAL CONSTRUCTION PHASE EMISSIONS (t CO2e)
261 707 Assumes the same activities take place in Phase 1 (630 MW) and Phase 2 (570 MW) in order to project emissions for the construction of the final 1 200 MW project
Figure 4.1 below illustrates the split of total (cumulative) Scope 1 & 2 emissions for the construction phase by activity. As shown, land-use change emissions represent the most significant source of emissions during construction (59%), followed by Scope 2 grid electricity emissions (16%), fugitive emissions from the use of refrigerants for cooling (10%), and mobile fuel combustion emissions associated with the use of construction vehicles and equipment and worker transportation (6%), and the transport of construction materials to the site (6%). Mobile fuel combustion emissions associated with the transport of solid and liquid wastes from the site, and stationary diesel consumption emissions, account for the smallest proportion of construction emissions (3% and 0.3%, respectively).

ERM MARUBENI
45
Figure 4.1 Thabametsi 1200 MW power plant construction phase emissions (tCO2e) split by activity
Scope 3 (indirect / value chain) GHG emissions associated with embedded carbon in construction materials were also calculated, though not presented as part of overall Construction emissions since these focus on Scope 1 and 2 emissions sources. Scope 3 emissions from embedded carbon in construction materials, including the total estimated mass of concrete, steel, and PVC pipes required for construction of the 1 200 MW plant, are estimated to be 37 745 tCO2e.
4.1.2 GHG emissions during Operations
Table 4.2 summarises the Project’s estimated annual GHG emissions during Operations (Phase 1 and 2), whilst Figure 4.3 illustrates total operational emissions split by activity. Total estimated annual emissions for the first 630 MW Phase of the Project, based on information given in the Feasibility Study (WSP | Parsons Brinckerhoff, 2015a) and applying a load factor of 85%, are 5 1860749 t CO2e (5.3 Mt CO2e). Assuming the same technologies, load factor and operating patterns are used for the second 570 MW Phase, annual emissions from the final 1 200 MW plant are estimated to be 9 879 659 t CO2e (9.9 Mt CO2e) (1 Assuming the same load factor and operating patterns, and not including any decrease in thermal efficiency over time, total (cumulative)
(1) As noted previously, there may be an opportunity to use more efficient technologies for Phase 2 which would result in an improved thermal efficiency and reduced emissions intensity. Absolute GHG emissions may decrease if future operations shift to cycling and the Plant is not running continuously, although increased start-ups could have a detrimental impact on plant thermal efficiency and emissions intensity (GHG emissions per MWh generated).

ERM MARUBENI
46
estimated operational emissions over the 30-year lifetime of the 1 200 MW plant are in the range of 304 Mt CO2e.
Table 4.3 Estimated GHG emissions arising from the operation of the Thabametsi Coal Fired Power Plant
Operational activity Estimated Annual Emissions in Phase 1 (630 MW) (t CO2e)
Estimated Annual Emissions in Phase 2 (1 200 MW) (t CO2e)
Data Source, Notes and Assumptions
SCOPE 1 Coal combustion for power production, (CO2 emissions)
4 184 071
7 969 659
Annual coal consumption of 3 901 332 tonnes per 630 MW unit, based on 85% load factor (7 446 hours per annum). Coal carbon content = 29.5% (WSP | Parsons Brinckerhoff, 2015) Coal oxidation factor = 0.9915 (Source: email communications from WSP | Parsons Brinckerhoff) (1) Converted to GJ on the basis of NCV for coal of 11.81 MJ/kg (LHV) (2)
Coal combustion (CH4 emissions)
1 095 2 085 Applying plant design data on CH4 emissions (3)
Coal combustion (N2O emissions)
885 344
1 686 370 Applying plant design data on N2O emissions (4) which results in a calculation approximately 6% higher than the calculation using IPCC Tier 3 emissions factor (5) .
In situ desulphurisation (limestone)
109 450 208 477 Annual limestone consumption of 255 547 tonnes per 600 MW unit, based on 85% load factor. CaCO3 content of limestone: 93.5% by weight (WSP | Parsons Brinckerhoff, 2015) Assumes 99.15% of limestone is used in the desulphurisation process (producing CO2) (Source: email communications from WSP | Parsons Brinckerhoff) (6)
Light diesel oil consumption for cold start-ups
5 154 9 817 12 tonnes light diesel oil per 150 MW boiler, 8 hours for a cold start-up, and 4 cold start-ups per year (WSP | Parsons Brinckerhoff, 2015).
Diesel consumption in back-up generators
6 12 Based on an expected consumption of 550 litres / hour during full load test for 1 hour in Phase 1. Assumes 4 tests per year (7)
(3) Email correspondence to ERM from Marubeni, 7th April 2017 (3) Email correspondence to ERM from Marubeni, 7th April 2017 (3) Email correspondence to ERM from Marubeni, 7th April 2017 (4) Email correspondence to ERM from Marubeni, 7th April 2017 (5) IPCC, 2006a (6) Email correspondence to ERM from WSP | Parsons Brinckerhoff, 25th May 2016 (7) Email correspondence to ERM from Marubeni, 28th Oct 2016

ERM MARUBENI
47
Operational activity Estimated Annual Emissions in Phase 1 (630 MW) (t CO2e)
Estimated Annual Emissions in Phase 2 (1 200 MW) (t CO2e)
Data Source, Notes and Assumptions
Refrigerant consumption (cooling)
1 624 3 094 Assumes one refrigerant system refill per year, requiring 921 kg refrigerants in Phase 1 Assumes an equal split of R407c, R410a and R134a refrigerant gases are used (1)
Lubricant and grease consumption
4 8 Based on estimated lubricant and grease consumption of 7 030 litres / year and 405 kg per year (respectively) in Phase 1 (2)
TOTAL ANNUAL EMISSIONS (t CO2e)
5 186 749
9 879 522
Assumes the technical specifications outlined in the 600 MW Feasibility Study apply to the second 570 MW unit (Phase 2)
TOTAL OPERATIONS PHASE EMISSIONS (t CO2e)
296 385 671
Total emissions over Phase 1 & 2 of operations, assuming 30 year lifespan. Not taking into account any thermal efficiency losses over that period.
(1) Ibid. (2) Ibid.

ERM MARUBENI
48
Figure 4.2 Thabametsi 1200 MW power plant operational phase emissions (tCO2e) split by activity
Table 4.3 illustrates the thermal efficiency of the plant, and the emissions intensity of grid electricity generated (using annual estimated emissions above and annual estimated generated electricity in MWh). These metrics are used to inform the benchmarking in Section 4.2.2 (Impact Assessment chapter). The metrics are given for the final 1 200 MW plant on the basis of the Feasibility Study data for the first 600 MW phase; as such the metrics (thermal efficiency and emissions intensity) are assumed to be the same for the 600 MW (Phase 1) and 1 200 MW (Phase 2) plant (noting the potential differences in Phase 2 operations detailed in Footnote 1 of Page Error! Bookmark not defined.).
Table 4.4 Thabametsi Coal Fired Power Plant GHG emissions intensity and thermal efficiency
Thabametsi 1200 MW project
Data Source, Notes and Assumptions
Total estimated annual emissions (t CO2e)
9 879 522
Estimated total annual GHG emissions from the plant (calculations in Table 4.2). Not including any thermal efficiency losses over time.
Total annual electricity generation (MWh)
8 037 689 Plant net power (539.732 MW per 600 MW unit) * 2 units * 7 446 (annual operating hours, applying 85% load factor)
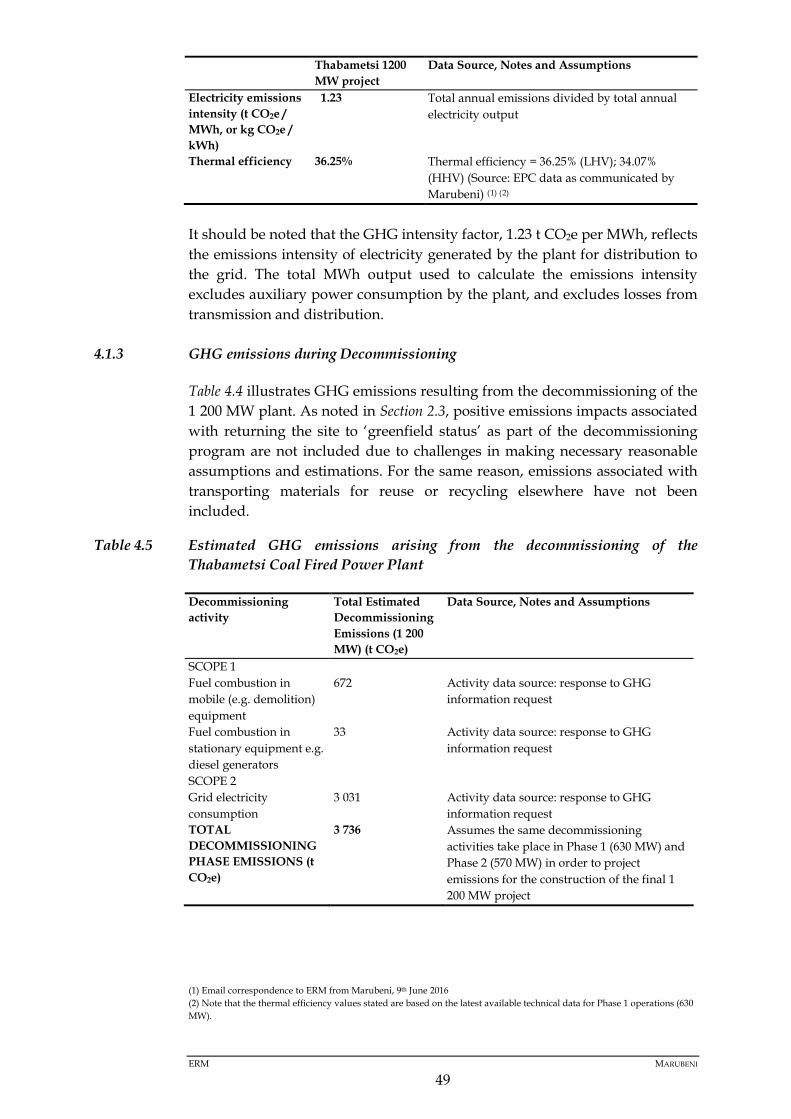
ERM MARUBENI
49
Thabametsi 1200 MW project
Data Source, Notes and Assumptions
Electricity emissions intensity (t CO2e / MWh, or kg CO2e / kWh)
1.23 Total annual emissions divided by total annual electricity output
Thermal efficiency 36.25% Thermal efficiency = 36.25% (LHV); 34.07% (HHV) (Source: EPC data as communicated by Marubeni) (1) (2)
It should be noted that the GHG intensity factor, 1.23 t CO2e per MWh, reflects the emissions intensity of electricity generated by the plant for distribution to the grid. The total MWh output used to calculate the emissions intensity excludes auxiliary power consumption by the plant, and excludes losses from transmission and distribution.
4.1.3 GHG emissions during Decommissioning
Table 4.4 illustrates GHG emissions resulting from the decommissioning of the 1 200 MW plant. As noted in Section 2.3, positive emissions impacts associated with returning the site to ‘greenfield status’ as part of the decommissioning program are not included due to challenges in making necessary reasonable assumptions and estimations. For the same reason, emissions associated with transporting materials for reuse or recycling elsewhere have not been included.
Table 4.5 Estimated GHG emissions arising from the decommissioning of the Thabametsi Coal Fired Power Plant
Decommissioning activity
Total Estimated Decommissioning Emissions (1 200 MW) (t CO2e)
Data Source, Notes and Assumptions
SCOPE 1 Fuel combustion in mobile (e.g. demolition) equipment
672 Activity data source: response to GHG information request
Fuel combustion in stationary equipment e.g. diesel generators
33 Activity data source: response to GHG information request
SCOPE 2 Grid electricity consumption
3 031 Activity data source: response to GHG information request
TOTAL DECOMMISSIONING PHASE EMISSIONS (t CO2e)
3 736 Assumes the same decommissioning activities take place in Phase 1 (630 MW) and Phase 2 (570 MW) in order to project emissions for the construction of the final 1 200 MW project
(1) Email correspondence to ERM from Marubeni, 9th June 2016 (2) Note that the thermal efficiency values stated are based on the latest available technical data for Phase 1 operations (630 MW).

ERM MARUBENI
50
Figure 4.3 illustrates the split of total Scope 1 and 2 emissions for the decommissioning phase by activity. As shown, the majority of emissions (81%) are associated with the use of electricity. 18% of emissions are associated with the consumption of fuel in vehicles and equipment (e.g. demolition activities). The remaining 1% of emissions is associated with the use of diesel generators for back-up power production.
Figure 4.3 Thabametsi 1200 MW power plant decommissioning phase emissions (tCO2e) split by activity
4.1.4 Total Construction, Operations and Decommissioning Emissions
As noted in the above sections, the total emissions for each phase are as follows: • Construction: 261 707 tCO2e • Operations: 296 385 671 tCO2e • Decommissioning: 3 736 tCO2e No year-on-year thermal efficiency loss is assumed for operations. Figure 4.4 illustrates the split of total Scope 1 and 2 emissions by phase, using the data presented above and assuming a 30-year operational period for the 1 200 MW plant and the construction and decommissioning phase. As can be seen, the vast majority (99. 9%) of emissions are attributed to the operational phase of the plant and the combustion of coal to generate electricity. Construction and decommissioning activities contribute <0.1% to overall lifecycle emissions.

ERM MARUBENI
51
Figure 4.4 Thabametsi 1 200 MW power plant emissions (tCO2e) split by phase
4.2 GHG IMPACT ASSESSMENT
A traditional impact assessment is conducted by determining how the proposed activities will affect the state of the environment described in the baseline. As noted in Section 2.1, in the case of GHG emissions, this process is complicated by the fact that the impact of GHGs on the environment cannot be quantified within a defined space and time. The greenhouse effect occurs on a global basis and the point source of emissions is irrelevant when considering the future impact on the climate. CO2 has a residence time in the atmosphere of approximately 100 years by which time emissions from a single point source have merged with other anthropogenic and natural (e.g. volcanic) greenhouse gas emissions. Therefore it is not possible to link emissions from a single source – such as the Thabametsi Project – to particular impacts in the broader study area. Considering the above, the impact assessment for the Project’s GHG emissions is based on an assessment of the magnitude of estimated annual GHG emissions during operations (accounting for >99.9% of Scope 1 and 2 emissions across the construction, operations and decommissioning stages), and the Project’s contribution to global climate change. Because South Africa has not specifically defined thresholds to understand GHG emissions impact or magnitude within its Environmental Impact Assessment or National Environmental Management Act legislation, this assessment of magnitude (i.e. the scale of GHG emissions from the Project) is based on a GHG magnitude rating scale developed from international lender standards including IFC, EBRD, and EP. The magnitude of the Project’s emissions relative to South Africa’s current and future projected GHG emissions is also presented, but owing to the significant limitations associated with using national GHG emissions as a way to understand the magnitude of a project’s emissions, this comparison is not used to inform significance.
Construction, 261 707, 0.088%
Operation, 296 385 671 , 99.911%
Decommission, 3 736, 0.001%

ERM MARUBENI
52
In addition to the above assessment of the magnitude and therefore significance of the Project’s GHG emissions, the GHG impact assessment is informed by the following key aspects: • Assessing the GHG performance of the Project relative to reference
benchmarks on the GHG intensity of electricity production, including the GHG intensity of South Africa’s grid electricity and of other coal-fired power plants; and
• Understanding of the impact of the Project on South Africa’s national GHG emissions inventory, and consideration of the alignment of the Project with the country’s climate policy and international GHG reduction commitments.
4.2.1 Magnitude of the Project’s GHG emissions
During operations, estimated annual emissions from Phase 1 (630 MW) are 5 186 749 t CO2e, and assuming the same technologies are applied for the development of Phase 2 and a continued baseload supply scenario, total estimated annual emissions from the final 1 200 MW Thabametsi Project are 9 879 522 t CO2e. Further discussion on the magnitude of these emissions compared to South Africa’s total annual GHG emissions, and from the perspective of emissions from a single point-source or project, is given below. Contribution of the Project to South Africa’s national GHG inventory
Table 4.5 illustrates the magnitude of the Project’s emissions relative to South Africa’s national GHG emissions. Historical emissions data from 2010 is used, and for subsequent (and future) dates, the PPD trajectory (defined in South Africa’s NCCRP and forming the basis of South Africa’s mitigation commitments within the INDC presented to the UNFCCC in the 21st Conference of Parties (COP21) in Paris, December 2015) is used in order to project national emissions forward to 2050.
Table 4.6 Estimated GHG Emissions from the 1 200 MW Thabametsi Project Relative to Projected GHG Emissions for South Africa
Year Estimated annual emissions – South Africa (t CO2e)– PPD Lower Range
Estimated annual emissions – South Africa (t CO2e)– PPD Upper Range
Estimated annual operational emissions – Thabametsi 1 200 MW Project (t CO2e)
Thabametsi Project % contribution to South Africa’s projected national GHG emissions during operations (as a % of lower - upper Range PPD trajectory)
2020 398 000 000
583 000 000 9 879 522
1.7 – 2.5%
2025 398 000 000 614 000 000 9 879 522 1.6 - 2.5% 2030 398 000 000 614 000 000 9 879 522 16 - 2.5% 2035 398 000 000 614 000 000 9 879 522 1.6 - 2.5% 2040 336 000 000 552 000 000 9 879 522 1.8 – 2.9% 2045 274 000 000 490 000 000 9 879 522 2.0 – 3.6% 2050 212 000 000 428 000 000 9 879 522 2.3 – 4.7%

ERM MARUBENI
53
Source: DEA (2011) and DEA (2014a) (estimated annual emissions for South Africa using lower and upper ranges of PPD). A linear decline to INDC targets by 2050 from 2035 levels is assumed. As illustrated above, the Project’s GHG emissions are estimated to comprise 1.7 – 2.5% of South Africa’s national emissions in 2020, rising to 2.3 – 4.7% in 2050. It should be noted that a number of assumptions are made with respect to estimating the Project’s contribution to national GHG emissions: • It is assumed that South Africa’s GHG trajectory follows that set out in
the Government’s PPD trajectory (i.e. assuming that South Africa meets its commitments under the UNFCCC);
• The GHG trajectory for South Africa also assumes no change to the country’s climate policy and INDC; however it should be noted that countries will be required to update their national GHG reduction commitments (INDCs) every five years, and each new submission should be more ambitious than the previous submission (the ‘ratchet’ mechanism): as such, future emissions trajectories may incorporate increasingly ambitious cuts;
• The GHG trajectory also assumes certain GDP growth rates (which influence national GHG emissions): should actual growth rates deviate significantly from these, the emissions trajectory may also need revising; and
• The plant is assumed to operate at a constant 85% load factor, through to 2050, which would result in GHG emissions from the plant staying constant over time. It is however possible that future changes to dispatch rules may necessitate load following, weekend shut downs, or two-shifting. Such changes in operating regime will alter GHG emissions: a shift to cycling can result in increased wear on the plant and therefore reduced efficiencies and increased GHG emissions per MWh generated; with reduced efficiencies over time, a constant 85% load factor as assumed in this report, would lead to reduced electricity output over time; however total GHG emissions on an annual basis are likely to decrease if there is a reduction in overall operating time.
Whilst the above analysis helps to give a sense of the scale of the Project’s emissions relative to South Africa’s emissions, there are significant limitations associated with using national GHG inventories to understand the magnitude of a Project’s emissions. This is because the greenhouse effect occurs on a global basis, and the geographical source of emissions is irrelevant when considering the future impact on the climate; the climate change impact associated with the emissions of one tonne of CO2e is the same, regardless of the source or location. Whilst this is true, the contribution of different countries to global GHG emissions varies significantly, and using the scale of a country’s GHG emissions to assess the magnitude of GHG emissions from a particular project would suggest that the GHG impacts from a certain project are less significant if it is sited in a country with comparatively large GHG emissions, than if the same project with the same emissions was sited in a country with much smaller GHG emissions. This isn’t the case however, for a

ERM MARUBENI
54
global impact like climate change. In addition, owing to the nature of the national and global GHG emissions, which result from a vast number of individual projects across many sectors (power, transport, land use, infrastructure, built environment, etc.), individual projects are unlikely to look significant (i.e. represent a material proportion or percentage) of emissions relative to emissions on a national scale. Bearing this in mind, the above analysis of the Project’s GHG emissions relative to South Africa’s national GHG emissions helps to add context to the impact assessment, but is not used as the basis for the assessment of the Project’s GHG and climate change impacts. Instead, other reference benchmarks are used to inform the impact assessment, discussed in the sections that follow. Scale of the Project’s Emissions relative to GHG Magnitude Scale from Wider Standards
As described in Section 3.4, various international lender organisations including the IFC, EBRD and EP, give guidance on the scale of a Project’s GHG emissions based on thresholds of annual emissions that trigger requirements for quantifying, reporting and mitigating Project GHG emissions. The magnitude scale derived from these organisations is illustrated in Table 4.6.
Table 4.7 Magnitude scale for project-wide GHG emissions based on wider standards
Project-Wide GHG Emissions / annum Magnitude Rating >1 000 000 tonnes CO2e Very Large 100 000 – 1 000 000 tonnes CO2e Large 25 000 – 100 000 tonnes CO2e Medium 5 000 – 25 000 tonnes CO2e Small <5 000 tonnes CO2e Negligible
Based on the magnitude scale above, and considering the estimated annual GHG emissions from the final 1200 MW Project during operations (9 879 522 t CO2e assuming a baseload supply scenario), the magnitude of the project’s GHG impact is considered to be Very Large. It should be noted that, in the absence of abatement technologies such as CCS, most fossil-fuel based power plants will fall into this category by nature of their activities (which involve the combustion of coal or gas to generate electricity). For example, the total annual emissions from Eskom’s Medupi and Kusile coal-fired power plants (once operational), both using supercritical steam, are estimated to be in the range of 25 000 000 – 30 000 000 t CO2e for each plant.
4.2.2 Benchmarking performance against other coal-fired power stations
The Project’s estimated emissions intensity and stated thermal efficiency are compared to benchmarks for alternative coal-fired power plant technologies in Table 4.7 below.
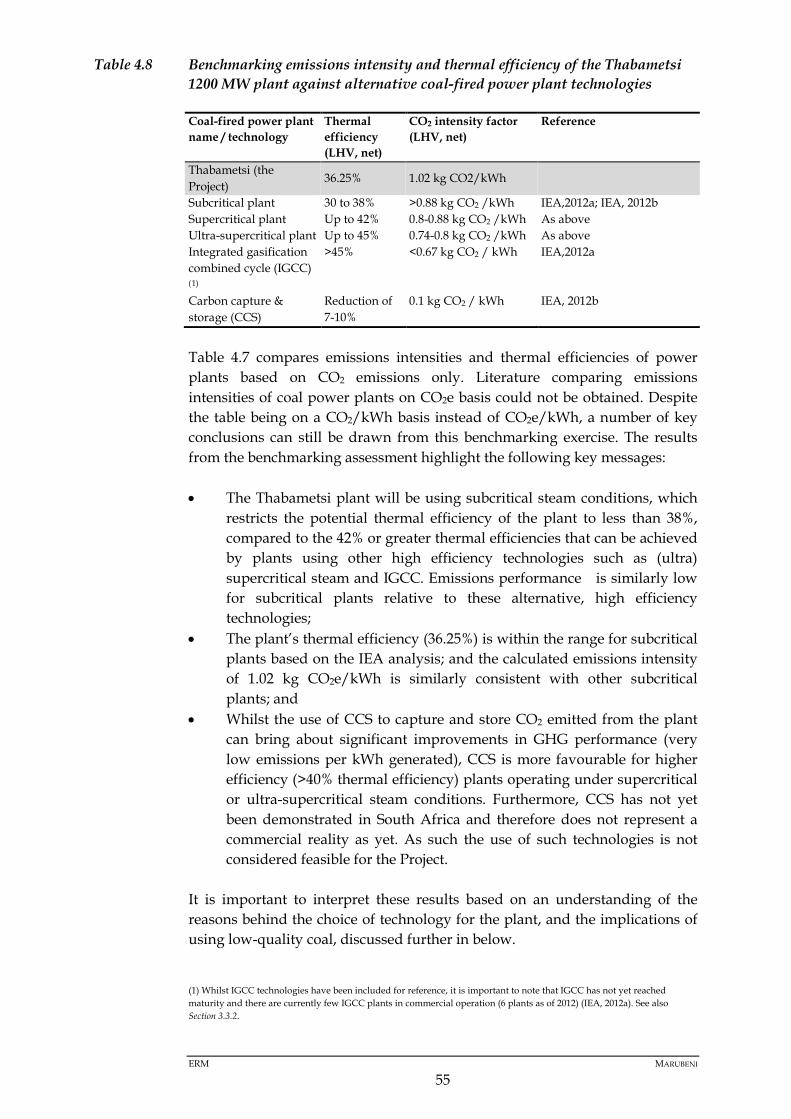
ERM MARUBENI
55
Table 4.8 Benchmarking emissions intensity and thermal efficiency of the Thabametsi 1200 MW plant against alternative coal-fired power plant technologies
Coal-fired power plant name / technology
Thermal efficiency (LHV, net)
CO2 intensity factor (LHV, net)
Reference
Thabametsi (the Project)
36.25% 1.02 kg CO2/kWh
Subcritical plant 30 to 38% >0.88 kg CO2 /kWh IEA,2012a; IEA, 2012b Supercritical plant Up to 42% 0.8-0.88 kg CO2 /kWh As above Ultra-supercritical plant Up to 45% 0.74-0.8 kg CO2 /kWh As above Integrated gasification combined cycle (IGCC) (1)
>45% <0.67 kg CO2 / kWh IEA,2012a
Carbon capture & storage (CCS)
Reduction of 7-10%
0.1 kg CO2 / kWh IEA, 2012b
Table 4.7 compares emissions intensities and thermal efficiencies of power plants based on CO2 emissions only. Literature comparing emissions intensities of coal power plants on CO2e basis could not be obtained. Despite the table being on a CO2/kWh basis instead of CO2e/kWh, a number of key conclusions can still be drawn from this benchmarking exercise. The results from the benchmarking assessment highlight the following key messages: • The Thabametsi plant will be using subcritical steam conditions, which
restricts the potential thermal efficiency of the plant to less than 38%, compared to the 42% or greater thermal efficiencies that can be achieved by plants using other high efficiency technologies such as (ultra) supercritical steam and IGCC. Emissions performance is similarly low for subcritical plants relative to these alternative, high efficiency technologies;
• The plant’s thermal efficiency (36.25%) is within the range for subcritical plants based on the IEA analysis; and the calculated emissions intensity of 1.02 kg CO2e/kWh is similarly consistent with other subcritical plants; and
• Whilst the use of CCS to capture and store CO2 emitted from the plant can bring about significant improvements in GHG performance (very low emissions per kWh generated), CCS is more favourable for higher efficiency (>40% thermal efficiency) plants operating under supercritical or ultra-supercritical steam conditions. Furthermore, CCS has not yet been demonstrated in South Africa and therefore does not represent a commercial reality as yet. As such the use of such technologies is not considered feasible for the Project.
It is important to interpret these results based on an understanding of the reasons behind the choice of technology for the plant, and the implications of using low-quality coal, discussed further in below.
(1) Whilst IGCC technologies have been included for reference, it is important to note that IGCC has not yet reached maturity and there are currently few IGCC plants in commercial operation (6 plants as of 2012) (IEA, 2012a). See also Section 3.3.2.

ERM MARUBENI
56
Technology choice of plant
The proposed Thabametsi plant will be built in two phases with a total capacity of 1 200 MW. Referring to the Phase 630 Feasibility Study Addendum (WSP | Parsons Brinckerhoff (2015b)), Phase 1 will comprise two 315 MW steam turbine generators. There are numerous reasons for selecting this technology (WSP | Parsons Brinckerhoff, 2015): • Importantly for this plant, CFB boilers are capable of using low grade
coal; • On account of the relatively low temperatures of boiler operation, there
is no need for dedicated control equipment for nitrous oxides (NOx), and effective control of sulphur dioxide (SO2) emissions can be achieved through the direct injection of limestone into the boiler furnace;
• CFB technology provides a good balance of reliability, redundancy for baseload generation to the grid and lower capital costs, which reduces the cost of generation. Redundancy and low cost of generation are two priorities of the Coal Baseload IPP Programme (WSP | Parsons Brinckerhoff, 2015); and
• Considering the water constraints in the area, the ability to achieve emission compliant SOx control by addition of dry limestone directly into the combustion chamber thereby negating the need for expensive backend SOx scrubbers which consume large quantities of water would be essential and the CFB technology enables it.
The DoE’s requirements under the Coal Baseload IPP Procurement Programme specifies a qualification tariff cap of ZAR0.82/KWh for electricity, and ERM understands this has been the primary driver for the choice of this CFB technology that is suitable for the combustion of low grade coal.
The type of technology chosen are also constrained by a limited availability of water, which is why dry air cooled condensers (using up to 15 times less water than ‘wet cooled’ plants) have been selected. It is noted that air cooled condensers generally require more power than wet cooling systems due to the use of fans for cooling. This increases the auxiliary power load and reduces plant efficiency. The size and type of the boilers have been selected based on the low quality of the coal, higher reliability of supply and redundancy from smaller boilers and turbines as well as lower capital expenditure and quicker construction times. It should be noted that CFB generation units are usually limited in output capacity to 200-300 MWe. Importantly with respect to plant efficiency, the use of supercritical and ultra-supercritical steam conditions in CFB plants is currently limited, compared to PCC (pulverised coal combustion) plants. CFB plants in the range of 30-250 MWe all use subcritical steam cycles (Dong, 2011).

ERM MARUBENI
57
Use of low-grade coal
The plant will be using coal with a relatively low heat value (11.81 MJ/kg, HHV) and carbon content (29.5% by weight), and a high ash content (56%) (WSP | Parsons Brinckerhoff, 2015). CFB technologies are well suited to using low-grade coals, with coal recirculated through the combustion chamber to allow more complete combustion, and because the lower temperatures (compared to PCC units) reduce problems associated with ash slagging or fouling. Whist the use of CFB technologies will maximise the power output from this coal feedstock, the low heat value of the coal will require greater throughput (and auxiliary power requirements) in order to generate the same amount of power for the grid than if higher grade coal was utilised.
4.2.3 Implications of the Project on the South African grid emissions factor
As noted in Section 4.1, the GHG intensity factor for the plant is estimated to be 1.23 t CO2e / MWh, based on total estimated annual GHG emissions and total electricity generated and sent to the grid (i.e. excluding plant auxiliary consumption and any losses from transmission and distribution). The above analysis suggests that the emissions intensity of the electricity generated by the Thabametsi plant is approximately 25% higher than the current Eskom emissions factor. of 1.01 tCO2e/MWh as outlined in section 3.3.1. However, since the Eskom emission factor incorporates generation not only from coal-fired power plants (representing 90% of Eskom’s generation capacity for this period), but also generation from low-carbon energy sources including renewables (predominantly solar), nuclear and pumped storage (representing the remaining 10% of generation capacity), it is indeed expected that it will be lower than Thabametsi’s emission intensity value. Data derived from information published by Eskom in 2011 illustrates an average emissions intensity factor of 1.05 t CO2e/ MWh for its coal-fired power plants for the period 2010-2011 (1). Table 4.8 and Figure 4.5 compare Thabametsi’s emissions intensity with that of the Eskom coal-fired power plants. By 2021-22 it is estimated that the average emissions intensity of Eskom’s coal-fired power plants will be about 1.05 tCO2e/kWh, including Kusile and Medupi and assuming that none of the existing power plants are decommissioned before then. It is important to note that four out of the five Eskom coal-fired power plants (Camden, Hendrina, Grootvlei, Kriel and Komati) which are scheduled for decommissioning prior to 2030 (Eskom, 2015b) have relatively high GHG emission intensities compared to this average intensity factor. The projected
(1) This emissions intensity factor (1.05 t CO2e / MWh) is assumed to be on a net basis, though this is not specified in the published data. .

ERM MARUBENI
58
GHG intensity of electricity generated by these plants is summarised in the Table below.
Table 4.8 Estimated emissions intensity of Eskom coal-fired power plants scheduled for decommissioning before 2030
Name of Power plant
tCO2 / MWh (CO2
Only) *
tCO2e /MWh
(CO2, CH4 and N2O)**
tCO2 / MWh (CO2 Only)
tCO2e /MWh (CO2, CH4 and
N2O)**
2010/11 data Projected 2021/22 data***
Thabametsi 1.02 1.23
Eskom Power Plants
Camden***** 1.24 1.25 1.24 1.25
Hendrina 1.18 1.19 1.32 1.33
Komati***** 1.26 1.27 1.26 1.27
Grootvlei 1.24 1.25 1.36 1.36
Kriel 1.04 1.04 1.24 1.24
Average for Camden, Hendrina, Grootvlei, Kriel and Komati****
1.14 1.14 1.22 1.28
Average for all Eskom coal-fired plants
1.04 1.05 1.05 1.05
* as stated in Eskom (2011) These figures reported by Eskom include CO2 only and not CH4 or N2O ** Calculated by ERM using IPCC(2006a) *** Projected by ERM based on the average observed energy efficiency loss of the power plants over the period 2009/10 – 2013/14 reported by Eskom (2017). The average for Eskom coal-fired power plants in 2021/22 includes Kusile and Medupi, which have lowered the average significantly. **** Average emissions/MWh for these 5 plants, calculated based on total emissions / total electricity generated. ***** Camden and Komati were Returned To Service during the 2009/10 – 2013/14 period, which included refurbishments to the plants, and resulted in peaking of their thermal efficiencies, hence their projected emission intensity values in 2021/2022 are similar to 2010/2011 values. The proposed Thabametsi plant has similar or lower emissions intensity compared to projected emissions intensities of the five plants scheduled to be decommissioned (Camden, Hendrina, Grootvlei, Komati and Kriel). Specifically from the decommissioning schedule published by Eskom, Camden will be the first power station to be decommissioned and Thabametsi is likely to take over the generation capacity of Camden, which will have a positive impact from a comparative CO2e emission perspective (1.23 CO2e/MWh (Thabametsi) vs. 1.25 CO2e/MWh (Camden)).

ERM MARUBENI
59
Figure 4.5 Comparison of Thabametsi’s GHG emission intensity (TonsCO2e/MWh) with the projected 2020-21 GHG emission intensity of Eskom’s coal fleet.
Figure 4.5 highlights the fact that while Thabametsi’s subcritical circulating fluidized bed (CFB) technology releases similar amounts of CO2 and CH4 per MWh with Eskom’s pulverized coal technology, sub-critical CFB tends to release much larger quantities of N2O. N2O emissions account for about 17% of Thabametsi’s total annual emissions while N2O emissions only account for 0.8% of Eskom’s projected total GHG emissions from coal-fired power plants in 2021-22. N2O abatement technologies are discussed in Chapter 5 of this report. It should be noted that South Africa’s grid emissions factor is likely to decrease year-on-year going forwards, as the country pursues the development of renewable and other low-carbon generation capacity (in line with South Africa’s energy policy and the IRP 2010-2030), and as new, more efficient coal-based generation capacity comes online from 2016 onwards via Eskom’s Kusile and Medupi coal-fired power plants (each with a capacity of approximately 4 800 MW and using supercritical steam conditions). An additional factor at play is the likely decrease in efficiency of Eskom’s existing coal-fired power plants over time as the fleet ages and as air quality abatement technologies (e.g. FGD units and electrostatic precipitators) are retrofitted to older plants to meet air quality standards. Based on publicly available information from Eskom, ERM has made projected estimates of emission intensities for Eskom’s coal-fired power plants by 2021/22, when Kusile and Medupi are added to the fleet but none of the old power plants are decommissioned and the results are shown in Table 4.8 above. By 2020/21 it is projected that all the five Eskom power plants scheduled for decommissioning

ERM MARUBENI
60
(Camden, Hendrina, Grootvlei, Kriel and Komati) will have similar or higher emissions intensities compared to the proposed Thabametsi plant. This is based on the average historical thermal efficiency degradation of those plants and also assumes no upgrades will be carried out on those power stations. In the projected 2021/22 results, Camden and Komati are unique in that they were part of the power stations that were mothballed in the late 1980’s and early 1990s, and were only returned to service from 2008. During the return to service these power plants were refurbished in various ways, and the improved efficiency benefits of the refurbishments were only realized when the power plants came into full operation, hence an improvement in efficiency for Camden and Komati was observed during the period 2010 – 2014. In the projections, Camden and Komati’s efficiencies return to 2010/11 levels by 2020/21.
4.2.4 Alignment with South Africa’s climate change policy and international GHG mitigation commitments
As noted in Sections 3.1 and 3.2, the Government has developed a number of energy and climate change focused policies and plans that are relevant to this Project. With the energy sector contributing 79% of South Africa’s national GHG emissions in 2010, it is important to consider both energy and climate change policies and plans in conjunction in order to understand how the Project is aligned with South Africa’s international GHG mitigation commitments. Drawing on the analysis presented in in Sections 3.1 and 3.2, the following key points are noted: • As described South Africa possesses a legacy of electricity management
that saw limited investment in new power infrastructure, resulting in the strain on Eskom’s existing fleet of power plants and an unstable electricity grid. The impacts of this were most notable during the rolling periods of black-outs and ‘load shedding’ that occurred between 2007 and 2015 when demand exceeded capacity;
• The promulgated IRP 2010-2030 (2011) represents the legal basis for Government’s electricity planning, and factors in an increase in generating capacity to meet future demand, incorporating provision for new coal but with an emphasis on low-carbon energy sources including nuclear power and renewables such that South Africa’s dependence on coal-based electricity generation is reduced from 90% of electricity supplied in 2010 to 65% in 2030. Despite the fact that the economic and electricity landscape in South Africa has changed substantially since 2011, the data contained in the IRP 2010-2030 (2011) has been adopted by Eskom and in Government’s electricity planning documents (albeit with the acknowledgement of these limitations), as well as by the IPP Office;
• The IPPPP has the primary mandate to procure energy from IPPs, aligned to the capacity allocated to the various electricity generation sources in the IRP 2010-2030 (2011). The DoE has allocated 2 500 MW to be sourced through the Coal Baseload IPP Programme, with the main

ERM MARUBENI
61
objective to secure South Africa’s baseload energy supply. The proposed Thabametsi power Project (Phase 1 – 600 MW) is an application for development under the Coal Baseload IPP Programme and therefore responds to the country’s energy needs;
• In order to understand the extent to which the Thabametsi project is aligned with South Africa’s climate change policy and mitigation commitments, it is important to understand the extent to which the IRP 2010-2030 (2011) and the PPD trajectory set out in the NCCRP are aligned. The DEA’s 2014 Mitigation Potential Analysis study considered potential GHG abatement available to South Africa and mapped future emissions trajectories according to numerous scenarios. The results of the study illustrated that more ‘aggressive decarbonisation’ of South Africa’s energy supply will be needed in future iterations of the IRP if the targets set out in the PPD are to be achieved. However, it should be noted that the DEA study used the IRP 2010-2030 (2011) generation mix to estimate GHG emissions from the energy sector and in the absence of an electricity generation plan beyond 2030 assumed that the balance of coal vs. non-coal based energy sources would hold constant from 2030 to 2050. Future updates of the IRP 2010-2030 will extend to later time periods (e.g. up to 2040 and 2050) and are likely to incorporate measures such as the retirement of some of the existing coal-fired power station fleet, which will allow for a reduction in emissions, especially considering that ‘reducing carbon emissions’ is one of the key constraints factored into the development of the IRP. The mechanics for retiring fossil fuel based generation have not however been defined.
In conclusion, there is a clear mandate from the DoE for the procurement of a limited amount of additional base load capacity from new coal-fired power plants, but there is some uncertainty as to the level of electricity generation that will come from coal post-2030 and how this aligns to the longer-term PPD trajectory for national GHG emissions.
4.2.5 Project GHG impact significance rating
The GHG impact significance rating for the plant is based on the magnitude of GHG emissions. This differs to a traditional ESIA study where significance is based on a combination of the magnitude and likelihood of an impact. This is because likelihood is irrelevant in the context of GHG emissions given that increased levels of GHG emissions will result from the project, and given the body of scientific evidence linking GHG emissions to global climate change impacts. The above analysis highlights the following with respect to the magnitude of the Project’s GHG emissions, estimated to be 5 186 749 t CO2e annually during operations on completion of Phase 1, and 9 879 522 t CO2e annually on the completion of Phase 2: • Using benchmarks from international lender standards with respect to
the magnitude of annual emissions from a development, and

ERM MARUBENI
62
considering the highest rating (‘Very Large’) applies to projects emitting >1 000 000 t CO2e per annum, the magnitude of this Project’s GHG emissions is considered to be ‘Very Large’.
Based on the above analysis, the magnitude of the Project’s GHG emissions is considered to be Very Large. Relating this to the impact significance scale being used for the project, this translates to an overall significance rating of High (Negative). As noted previously, in the absence of abatement technologies such as CCS, most coal-based power plants will fall into this category by nature of their high GHG emissions, including Eskom’s Kusile and Medupi plants currently under construction. Whilst the Project will likely have a High (Negative) impact with respect to GHG emissions, it is important to consider the contextual information relating to South Africa’s energy context, national energy plans including the planned increases in baseload power to meet needs, the role of coal to meet increased baseload power requirements and the high emissions intensity of the older Eskom coal power plants, and the key objectives of the Coal Baseload IPP Programme in terms of providing a rationale for the development of this Project as described above.

ERM MARUBENI
63
5 EMISSIONS MANAGEMENT MEASURES
The vast majority (>99.9%) of total emissions during the construction, operation and decommissioning of the plant are attributed to emissions from the operation of the plant. This section therefore primarily focuses on emission management measures during operations (Sections 5.1, 5.2, 5.3, 5.4 and 5.5). Emissions management measures for some of the larger sources of emissions during construction and decommissioning is covered in Section 5.6. The 1 200 MW Project’s annual GHG emissions are estimated to be 9 879 522 t CO2e during operations assuming a baseload supply scenario. As noted above, the emissions are ‘Very High’ when benchmarking against a project-wide emissions magnitude scale based on various international lender standards, as is expected for a coal-fired power plant. The emissions intensity (t CO2e per MWh) is also relatively high when benchmarked against other power plants. As such, measures should be implemented to monitor and manage energy consumption (thermal efficiency) and GHG emissions during operations. Specific emissions management measures are presented in this section.
5.1 IMPACT OF THE IPPPP REQUIREMENTS AND PLANT TECHNOLOGY ON EMISSIONS REDUCTION POTENTIAL
It is important to note that the choice of technology and the size of the plant constrain the extent to which technology-based GHG mitigation measures can be used. As discussed in Section 4.2.2 above, the key constraints are: • Coal quality: CFB plants are better suited to low quality (low calorific
value (CV)) coal, relevant to the Thabametsi plant which will be using coal with a relatively low CV of 11.81 MJ / kg (LHV). Whilst CFB technologies offer some advantages including reduced emissions of nitrous oxides (NOx) and sulphur dioxide (SO2), and water use reduction through the use of in-situ SO2 mitigation (rather than ‘wet’ FGD units), the use of SC and USC steam conditions in CFB plants is currently limited compared to PCC plants, and it is therefore not possible to benefit from the enhanced efficiencies offered by these technologies. The specified tariff under the IPPPP will have contributed the choice of the CFB technology which is more cost-effective, given the availability of low quality coal.
• Boiler and steam unit size: The Coal Baseload IPP Programme calls for projects with a maximum 600 MW capacity, and the strong emphasis on and requirement for redundancy for IPP baseload projects means that the selected configuration for the Thabametsi plant is four 150 MW boilers and two 315 MW steam units. This has some important implications with respect to plant efficiency:
• (Noting the above constraints associated with the use of supercritical steam in CFB plants): It is not possible to use more

ERM MARUBENI
64
efficient (and less GHG-intensive) supercritical or ultra-supercritical steam technologies, which are rarely applied to ‘small scale’ 300 MW units due to the comparatively high cost of materials to support supercritical steam on a small scale (WSP | Parsons Brinckerhoff, 2015); and
• Typical steam turbine configurations used in commercial power plants include non-reheat, single reheat and double reheat configurations. Double reheat offers the most efficiency but is used in larger, 600 MW units. Single reheat configurations can be used for units of 150 MW or greater. This plant will use single reheat steam turbine configurations in order to achieve the greatest increase efficiency possible considering size constraints.
• Availability of water: Water is a scarce resource in South Africa, including in the Lephalale municipality of Limpopo Province where the plant is sited. This has the following technology selection implications:
• CFB technologies are preferable from a water perspective since ‘in situ’ SOx control, achieved through the injection of limestone into the boiler, avoids the need for dedicated ‘wet’ (water intensive) flue gas desulphurisation units that would be required for a pulverised coal boiler; and
• Dry air cooled condensers are selected for the plant since these use up to 15 times less water than ‘wet cooled’ plants. However, air cooled condensers generally require more power than other systems in order to drive the fans which gives the plant a greater auxiliary load and has a negative impact on plant thermal efficiency.
• Proven Technology: The configuration and technology to be used by bidders under the Coal Baseload IPP Procurement Programme in respect of the power generation equipment must be based on thermal steam units and the boiler shall be of the pulverised Coal or fluidised bed type, both of which should conform to the proven design and technology requirements in the technical qualification criteria of the RFP.1.
Considering the above context and drivers, this section focuses on emissions control measures that can be achieved based on the selected plant technologies, design and configuration, rather than investigating opportunities for material changes to the plant’s design that could bring about an improvement in thermal efficiency and reduction in GHG emissions.
1 Technical Qualification Criterion 4 : Proven Design and Technology Requirements) of Volume 3 (Technical Requirements) Part 1 (Technical Qualification Criteria) of Part B (Functional and Qualification Criteria Requirements of the Coal Baseload IPP Procurement Programme RFP.

ERM MARUBENI
65
5.2 EMISSIONS MANAGEMENT THROUGH OPTIMISATION OF PLANT THERMAL EFFICIENCY
In order to manage emissions within the parameters of the selected plant design and operations, the plant’s thermal efficiency should be maximised in order to reduce the coal consumption and therefore GHG emissions per unit of electricity (i.e. kWh or MWh) generated. The measures below should be considered by the plant in order to maximise plant efficiency and minimise emissions during operations (NACAA, 2015), (IEA, 2012a): • Minimise feed variability: Take appropriate measures to minimise
variability in the coal feed for the boiler to avoid unstable operations. Such measures should be developed based on the specific context and options relating to the coal being sourced by the plant and the level of control over coal variability and use;
• Coal drying: The coal to be used at the Thabametsi plant has a moisture content of 8% by weight, and heat is used during the combustion process to evaporate this moisture. Pre-combustion coal drying, using waste heat from the flue gas or cooling water systems (if flue gas and cooling system heat recovery is not already optimized in plant design), can help to minimise the energy required to evaporate this moisture;
• Flue gas and cooling system heat recovery: The plant should seek to recover as much heat as possible from the cooling plant and the flue gas through heat exchangers. ‘Waste’ heat can be used to dry the coal as discussed above;
• Combustion control optimisation: Combustion controls that adjust the coal and air flow should be used in a way that optimises steam production for the steam turbine. ‘Smart’ instrumentation and controls that track key parameters including (amongst others) carbon levels in ash, coal flow rates, air flow rates, oxygen levels, combustion efficiency, steam temperature and furnace sagging and fouling, should be used in order to automate and optimise combustion, and heat rate / thermal efficiency should be tracked over time such that decreases can be investigated and rectified (e.g. through maintenance and equipment replacement) as far as possible;
• Steam turbine design: The steam turbine should be optimised for efficiency, for example through the use of high performing blades and steam seals. In addition, the steam pipes should be well insulated to maximise piping efficiency; and
• Scheduled maintenance to recover efficiency losses: Whilst the thermal efficiency of a power plant decreases over time and with use and wear, a regular and well-planned maintenance schedule can help recover these efficiency losses. Maintenance should include: checking and replacing seals on air, water, steam, flue gas, air heaters, condensers, boilers, and tube components; checking and removing deposits of ash on heat transfer surfaces and weld junctions in the boiler; removing deposits from and repairing damage to turbine blades; and checking for wear

ERM MARUBENI
66
and tear on all equipment and ensuring problems are logged and fixed. A maintenance plan, specifying the frequency of maintenance activities and the specific activities undertaken, should be developed by the site based on the design specifications and maintenance requirements for different equipment and based on the specific operating philosophies of the plant, and activities undertaken according to the maintenance plan should be logged and progress recorded over time. This plan should include details around major maintenance overhauls, typically scheduled every 5 - 6 years.
In addition to the above, measures should be implemented to minimise energy and cooling requirements in buildings through the use of natural ventilation systems, high-performance building envelopes for insulation, passive cooling techniques such as sun control and shading devices, and use of energy efficient lighting and HVAC (heating, ventilation and air-conditioning) systems. Such measures will help to minimise GHG emissions associated with fugitive releases of refrigerants in cooling systems, and will help to reduce auxiliary loads associated with HVAC systems. Further opportunities to reduce auxiliary loads and therefore GHG emissions exist through the use of alternative energy (e.g. solar photovoltaic arrays, wind etc.), which could be integrated into the design of buildings including offices / the plant itself, and the accommodation blocks.
5.3 MANAGING CHANGES TO OPERATING PHILOSOPHY
The Feasibility Study notes that the plant will be operated according to a base-load operating regime for the first 10 years, after which the load profile could change, either becoming load following, weekend shut downs or two-shifting, depending on the dispatch rules at the time. Whilst noting that any reduction in the operating time or load factor (i.e. annual power generation in MWh) is likely to result in decreased total annual emissions from the plant, such changes to cycling philosophies could have an adverse impact on thermal efficiency and GHG intensity per MWh generated as a result of increased start-ups and wear and tear on the plant. The design of the plant takes into account the potential for future cyclic operating philosophies such that these can be accommodated at a later stage. If a change in operating philosophy is required in future it will be important to assess any potential implications with respect to plant performance, thermal efficiency and the GHG intensity of electricity production, and to mitigate these as required with upgrades to plant hardware and/or modifications to operating practices as applicable.
5.4 ENERGY AND EMISSIONS MANAGEMENT PLAN
The development and implementation of a GHG management plan is critical if GHG emissions from the plant are to be managed over time. Since GHG emissions are primarily driven by the fuel consumption at the plant and are closely linked to the plant’s heat rate and thermal efficiency, this can take the

ERM MARUBENI
67
form of a combined thermal efficiency and GHG management plan. Key elements of a thermal efficiency / GHG management plan include: • Development of an overarching policy statement indicating the plant’s
commitments with respect to minimising GHG emissions and implementing actions to ensure optimum emissions management;
• Measuring GHG emissions on an annual basis (1), which will require data on: the total amount of coal consumed, its carbon content, and the oxidation rate; the total amount of limestone consumed and the proportions used in the desulphurisation reaction; and the consumption of any other fuels such as fuel oil for the start-ups. Plant heat rate / thermal efficiency should be closely monitored over time as this is closely correlated to the GHG intensity of the plant;
• Setting short, medium and long-term targets relating to maximising and maintaining heat rate / thermal efficiency and GHG intensity (t CO2e per MWh generated) over time, against which performance can be assessed;
• Tracking South Africa’s evolving GHG and energy related regulations, including the implications / requirements for the plant of the proposed carbon tax, GHG reporting regulations, and energy reporting regulations, all of which are currently in draft form but likely to be finalised in 2016 or 2017;
• Identifying and implementing heat rate improvement / GHG reduction projects, based on any deviations from expected heat rate and knowledge of required maintenance or upgrades. Internal and external energy audits should be used to help identify opportunities for performance improvement, and a business case can be developed for each area of opportunity to help prioritise projects. More significant projects can be implemented during the major maintenance overhauls as scheduled by the plant;
• Allocating responsibility to key individuals such that someone (or a team of individuals) is responsible and accountable for managing and reporting on the GHG performance of the plant;
• Communicating the Plan, including its key objective and any actions being taken, to staff working at the plant to ensure buy-in;
• Encouraging employee participation in the GHG management plan, including contribution of ideas relating to opportunities for improvement; and
• Reporting progress over time with respect to annual coal consumption and GHG emissions, GHG reductions / heat rate improvements achieved, and progress against targets set.
(1) For example, IFC Performance Standard 3 requires that ‘For projects that are expected to or currently produce more than 25 000 tonnes of CO2e-equivalent annually’… ‘Quantification of GHG emissions will be conducted by the client annually in accordance with internationally recognized methodologies and good practice’

ERM MARUBENI
68
5.4.1 Abatement of N2O emissions
Whereas, for the vast majority of coal-fired combustion technologies, N2O emissions are relatively insignificant in magnitude compared to CO2 emissions, this is not the case for CFB plants, where the lower combustion temperatures lead to formation of significant amounts of N2O. Typical management measures for N2O emissions abatement from industrial sources are to reduce nitrogen levels in fuel; avoid excess oxygen in the combustion chamber; and destruction via thermal decomposition of N2O by afterburning. The first two options are not feasible in the case of the proposed Thabametsi plant because coal as the fuel is a given requirement from the Coal Baseload IPP Procurement Programme and the nitrogen content of the coal to be used is fixed, while avoiding excess oxygen will significantly reduce the efficiency of the power plant. The third option, thermal decomposition by afterburning, is also not feasible due to the very large quantities of flue gas that are involved, and the consequently large amounts of fuel that would need to be transported and combusted to achieve thermal decomposition of the flue gas. Whilst this has been demonstrated at experimental scale (e.g. Gustavson, 1995; Hu, 2012) it is not applied in commercial CFB coal-fired power plants. Effectively none of these options are available for abatement of N2O emissions from a commercial CFB coal-fired power plant of the type and specification proposed at Thabametsi.
5.5 ALTERNATIVE FUELS
The co-firing of coal with biomass presents an opportunity for reducing GHG emissions: for example, using sustainably grown biomass to replace up to 10% of the coal in an existing boiler will reduce GHG emissions by a similar percentage (US DOE, 2004). There may be opportunities to source sustainable biomass relatively locally in South Africa, for example from plantations, though the costs of procuring materials, transportation requirements, and the volumes available (year-round) would need to be considered. It is also recognised that the impact of the different physical and chemical properties of the biomass fuel would need to be explored in terms of adapting operations (e.g. the bed material) to accommodate the alternative fuel. However, the option of co-firing coal with biomass, is not consistent with the requirements of the Coal Base Load IPP Procurement Programme within which this Thabametsi project is to be implemented.
5.6 EMISSIONS MANAGEMENT DURING CONSTRUCTION AND DECOMMISSIONING
Whilst emissions from construction and decommissioning are of a significantly smaller scale relative to operational emissions, several sources of

ERM MARUBENI
69
emissions are of a significant magnitude in their own right and it is important to manage and minimise these emissions as far as possible. During construction, the most significant emissions source is land-use change emissions associated with the clearance of vegetation (155 393 tCO2e over the construction of Phase 1 and 2, representing 59% of total construction emissions). The next most significant sources of emissions include Scope 2 grid electricity emissions (42 388 tCO2e, 16% of total construction phase emissions), fugitive emissions from the use of refrigerants for cooling (25 536 tCO2e, 10%), and mobile fuel combustion emissions associated with the use of construction vehicles and equipment and worker transportation (14 996 tCO2e, 6%), and the transport of construction materials to the site (14 755 tCO2e, 6%). The following measures will help to reduce GHG emissions during the construction phase: • Minimise unnecessary land disturbance / clearing during construction,
including avoiding unnecessary damage or destruction of existing vegetated, cultivated, and other biomass-rich areas as far as possible. A construction code of practice can be used to highlight how vegetation disturbance and removal will be minimised and could (for example) require that areas are cleared only as and when needed (for example, requiring the ash dump area to be cleared / expanded over time on the basis of the volumes generated and land areas required);
• Assess opportunities for the productive use of biomass material (especially forest wood) subsequent to land clearance. This could include the creation of wood-related products or use of waste material as a biomass fuel. Burning cleared vegetation, or leaving it to decompose, can result in significant GHG emissions and should be avoided;
• Commit to re-plant or rehabilitate any land areas that are not irrevocably altered during the construction of the plant;
• Ensure that energy and fuel efficiency considerations are factored into the procurement of stationary (e.g. tower cranes and winches) and mobile (e.g. crawler / hydraulic cranes and forklifts) construction equipment in order to minimise grid electricity and diesel/petrol fuel consumption. Fuel efficiency should also be considered with respect to the choice of vehicles for transporting construction materials to the site and waste materials from the site, and the buses used for worker transport; and
• Minimise energy and cooling requirements in buildings through the use of natural ventilation systems, high-performance building envelopes for insulation, passive cooling techniques such as sun control and shading devices, and use of energy efficient lighting and HVAC (heating, ventilation and air-conditioning) systems.
During decommissioning, the most significant emissions source is from electricity consumption (3 031 tCO2e, 81% of decommissioning emissions), followed by mobile combustion emissions from fuel used in vehicles / mobile

ERM MARUBENI
70
equipment (672 tCO2e, 18% of decommissioning emissions). The following measures will help to minimise emissions during decommissioning: • (As for construction): Ensure that energy and fuel efficiency
considerations are factored into the procurement of stationary and mobile demolition / land remediation equipment in order to minimise grid electricity and diesel/petrol fuel consumption; and
• Whilst land-use change emissions associated with planting activities and returning the site to greenfield status are not included in the footprint for decommissioning due to challenges in making reasonable assumptions in estimations, there is an opportunity to have beneficial GHG impacts through the planting of plants or shrubs at the site as part of remediation activities. New plant growth has positive GHG implications through carbon dioxide sequestration, and may help to offset some of the land-use change emissions occurring during Construction.
For both the Construction and Decommissioning phases, specific objectives and actions relating to minimising GHG impacts should be incorporated into a high level Energy and Emissions Management Plan as described in Section 5.4 above.

ERM MARUBENI
71
6 CONCLUSIONS AND RECOMMENDATIONS
The operation of the 1 200 MW Thabametsi Power Station under the South African DoE’s Coal Baseload IPP Programme will result in significant GHG emissions and therefore will have climate change impacts. The main findings of the climate change specialist study are: • The 1 200 MW Project’s annual and cumulative GHG emissions are
significant, estimated to be 9 879 522 t CO2e per annum assuming a baseload supply scenario, and in the range of 296 Mt CO2e over the project’s 30-year lifetime;
• The Project has a relatively high thermal efficiency compared to other coal-fired power plants using sub-critical steam conditions, but a relatively low thermal efficiency in comparison to coal-fired power plants using SC and USC steam conditions, and relative to IGCC power plants (noting that there are few IGCC coal plants in commercial operation);
• The Project has relatively high emissions intensity (1.23 t CO2e per MWh generated) compared to coal-fired power plants, and a high emissions intensity relative to that of Eskom’s coal-fired fleet, estimated at 1.05 tCO2e in 2021-22 including Kusile and Medupi. However, the emissions intensity of the plant is similar or lower compared to the projected 2021/22 estimates of the five Eskom coal-fired power plants that are due to be decommissioned before 2025: Camden (1.25 t CO2e / MWh), Grootvlei (1.36 t CO2e / MWh), Hendrina (1.33 t CO2e / MWh), Kriel (1. 24 t CO2e / MWh) and Komati (1.27 tCO2e / MWh). Specifically when comparing Camden, which will be the first power station to be decommissioned, and Thabametsi, CO2e will be reduced. (1.23 CO2e/MWh (Thabametsi) vs. 1.25 CO2e/MWh (Camden));
• The requirements of the Coal Baseload IPP Programme, primarily tariff cap and including the maximum net generating capacity of 600 MW, and the requirement for redundancy, placed within South Africa’s energy context including the need for additional baseload power at a low cost, influence the choice of technology for the plant (notably the use of subcritical steam conditions and low-grade coal), which in turn affect the emissions performance of the Project; and
• Thabametsi’s GHG emissions are estimated to comprise about 1.7 – 2.5% of South Africa’s Peak, Plateau and Decline trajectory emissions in 2020/21, rising to 2.3 – 4.7% in 2050.
• The greenhouse effect occurs on a global basis and the geographical source of GHG emissions is irrelevant when considering the future impact on the climate. Due to the global nature of the greenhouse effect, it is not possible to link emissions from a single source – such as the Thabametsi Power Station - to particular environmental and social impacts in the broader study area. Therefore, in line with international good practice such as that established by the IFC Performance Standards, this report: calculates the projected GHG emissions from the

ERM MARUBENI
72
project across its lifetime; compares those emissions against appropriate comparators and reference benchmarks in South Africa and globally; and considers their relevance in the context of South Africa’s national GHG emissions and policy.
Noting the above, and based on the analysis of emissions control measures outlined in Section 5, Table 6.1 and Table 6.2 outline the measures recommended for inclusion in the Environmental Management Plan (EMP).
Table 6.1 GHG management measures to be included in the EMP (Operations)
OBJECTIVE: Management and minimization of GHG emissions and GHG intensity (emissions per MWh generated) during operations Project component/s
• Power generation (boilers)
Potential Impact • Emission of GHGs and associated contribution to global climate change impacts
Activity/risk source
• Combustion of coal in the boilers for power generation • Combustion of limestone in the boilers for
desulphurisation • Combustion of light diesel oil for boiler start-ups • Use of refrigerants for cooling
Mitigation: Target/Objective
• To minimise GHG impacts as far as possible by maintaining and maximising plant thermal efficiency over time
Mitigation: Action/control Responsibility Timeframe
• Develop and implement a GHG management policy and plan (combined with a thermal efficiency management plan as appropriate).
Project Developer Pre-Operation
• Measure and track GHG emissions and emissions intensity.
Project Developer / / A suitably qualified person appointed by the Project Developer
Operation, annually
• Develop a plan to minimise coal feed variability and investigate the possibility of coal drying wherever possible to enhance plant thermal efficiency and reduce GHG emissions, and implement if the investigation
Project Developer Operation

ERM MARUBENI
73
shows that it is cost effective. • Investigate the possibility of flue
gas and cooling system heat recovery and recycling to enhance plant thermal efficiency and reduce GHG emissions, and implement if the investigation shows that it is cost effective.
Project Developer / A suitably qualified person appointed by the Project Developer
Operation
• Employ the use of ‘smart’ instrumentation and combustion controls to track key parameters such that combustion is optimised, and to allow thermal efficiency to be monitored over time.
Project Developer Operation
• Undertake scheduled maintenance to recover efficiency losses, including major maintenance re-hauls approximately every 5 - 6 years.
Project Developer Operation, frequency to be determined by Project Developer
• In the event of any future changes in plant operating philosophy, undertake a study to assess potential implications on thermal efficiency, GHG emissions intensity, and total GHG emissions per annum and identify and implement measures to mitigate any negative impacts.
A suitably qualified person appointed by the Project Developer
As and when required
• Consider the use of co-firing of coal with low carbon, sustainable biomass to reduce GHG emissions and reduce the GHG intensity of the plant in future, if feedstock is available and costs are feasible.
A suitably qualified person appointed by the Project Developer
As and when required
• Integrate green building design principles into the construction of buildings, offices and accommodation blocks to minimise energy and cooling requirements (and reduce auxiliary loads).
Project Developer / A suitably qualified person appointed by the Project Developer
Pre-construction
• Investigate options for renewable energy sources (e.g. wind, solar) to supplement auxiliary power systems.
Project Developer / A suitably qualified person appointed by the Project Developer
Construction

ERM MARUBENI
74
Performance Indicator
• Total annual GHG emissions • GHG emissions intensity (t CO2e per MWh generated)
Monitoring • GHG policy and plan • Annual GHG emissions reports • Database of projects (planned and implemented) for
managing plant GHG emissions and thermal efficiency • Compliance with relevant national GHG and energy
regulations
Table 6.2 GHG management measures to be included in the EMP (Construction & Decommissioning)
OBJECTIVE: Management and minimization of GHG emissions during construction and decommissioning Project component/s
• Construction & decommissioning of power plant infrastructure
Potential Impact • Emissions of GHGs and associated contribution to global climate change impacts
Activity/risk source
• Clearing of vegetation (carbon stocks) • Fuel combustion in mobile vehicles and equipment • Fuel combustion in stationary equipment • Use of refrigerants in cooling systems • Use of grid electricity
Mitigation: Target/Objective
• To minimise GHG impacts as far as possible through minimising land disturbance / rehabilitating vegetation, and enhancing fuel and energy efficiency
Mitigation: Action/control Responsibility Timeframe
• Develop and implement a GHG management policy and plan that incorporates construction and decommissioning.
• Measure and track GHG emissions and emissions intensity.
Project Developer Project Developer / A suitably qualified person appointed by the Project Developer
Pre-construction Construction
• Develop a plan or code of practice to outline measures to minimise GHG emissions from land-use change during construction, including minimising areas cleared, using
Project Developer / A suitably qualified person appointed by the Project Developer
Pre-construction

ERM MARUBENI
75
biomass productively, and re-planting or rehabilitating post-decommissioning.
• Include energy / fuel efficiency considerations in procurement criteria stationary and mobile construction and decommissioning vehicles.
Project Developer Pre-construction
• Integrate green building design principles into the construction of buildings, offices and accommodation blocks to minimise energy and cooling requirements.
Project Developer / A suitably qualified person appointed by the Project Developer
Pre-construction
Performance Indicator
• Total GHG emissions • Total hectares of land cleared / rehabilitated
Monitoring • GHG policy and plan • Annual GHG emissions reports • Database of projects (planned and implemented) for
managing GHG emissions and energy / fuel consumption
• Compliance with relevant national GHG and energy regulations

ERM MARUBENI
76
7 REFERENCES
Centre for Climate and Energy Solutions (C2ES) (2017). High Global Warming Potential Gas Abatement. [ONLINE] Available at: https://www.c2es.org/technology/factsheet/high-global-warming-potential-gas-abatement%20 [Accessed: 08/06/2017]. Department of Energy (DoE) (2011). Integrated Resource Plan for Electricity 2010-2030 – Revision 2 - Final Report. [pdf] Available at: http://www.energy.gov.za/IRP/irp%20files/IRP2010_2030_Final_Report_20110325.pdf [Accessed 29 Apr 2016] Department of Energy (DoE) (2013a). Draft 2012 Integrated Energy Planning Report. [pdf] Available at: http://www.energy.gov.za/files/IEP/IEP_Publications/Draft-2012-Integrated-Energy-Plan.pdf [Accessed 29 Apr 2016] Department of Energy (DoE) (2013b). Integrated Resource Plan for Electricity 2010-2030 – Update Report 2013. [pdf] Available at: http://www.doe-irp.co.za/content/IRP2010_updatea.pdf [Accessed 29 Apr 2016] Department of Energy (DoE) (n.d.). Integrated Resource Plan: Introduction. Available at: http://www.energy.gov.za/files/irp_frame.html [Accessed 26 May 2016] Department of Environmental Affairs (DEA) (2010). Letter from DEA (Deputy Director General International Cooperation) to Executive Secretary at United Nations Framework Convention on Climate Change Available at: https://unfccc.int/files/meetings/cop_15/copenhagen_accord/application/pdf/southafricacphaccord_app2.pdf [Accessed 29 Apr 2016] Department of Environmental Affairs (DEA) (2011). National Climate Change Response White Paper. [pdf] Available at: https://www.environment.gov.za/sites/default/files/legislations/national_climatechange_response_whitepaper.pdf [Accessed 29 Apr 2016] Department of Environmental Affairs (DEA) (2014a). South Africa’s Greenhouse Gas (GHG) Mitigation Potential Analysis. [pdf] Available at: https://www.environment.gov.za/sites/default/files/docs/mitigationreport.pdf [Accessed 29 Apr 2016] Department of Environmental Affairs (DEA) (2014b). GHG National Inventory Report, South Africa, 2000-2010. [pdf] Available at: https://www.environment.gov.za/sites/default/files/docs/greenhousegas_invetorysouthafrica.pdf [Accessed 29 Apr 2016]

ERM MARUBENI
77
Department of Environmental Affairs (DEA) (2015). South Africa’s Intended Nationally Determined Contribution (INDC). [pdf] Available at: https://www.environment.gov.za/sites/default/files/docs/SA_indc_september2015.pdf [Accessed 29 Apr 2016] Department of Environmental Affairs and Tourism (DEAT) (2007). Long Term Mitigation Scenarios: Strategic Options for South Africa. [pdf] Available at: http://www.erc.uct.ac.za/sites/default/files/image_tool/images/119/Papers-2007/07Scenario_team-LTMS_Scenarios.pdf [Accessed 29 Apr 2016] Dones, R., Bauer, C., Bolliger, R., Burger, B., Faist Emmenegger, M., Frischknecht, R., Heck, T., Jungbluth, N., Röder, A., and Tuchschmid, M. (2007). Life Cycle Inventories of Energy Systems: Results for Current Systems in Switzerland and other UCTE Countries. Ecoinvent Report No. 5. Paul Scherrer Institut Villigen, Swiss Centre for Life Cycle Inventories, Dübendorf, CH. Dong, N.S. (2011). Utilisation of Low Rank Coals. [pdf] Available at: https://www.usea.org/sites/default/files/042011_Utilisation%20of%20low%20rank%20coals_ccc182.pdf [Accessed 29 Apr 2016] Eberhard, A. (2008) Africa’s Power Crisis: and Power Shortages in South Africa. Africa Energy Forum, Nice, 2-4 July 2008. [pdf] Available at: http://www.gsb.uct.ac.za/files/aefpowershortages-nice08.pdf [Accessed 23 May 2016] Environmental Protection Agency of the USA (EPA) (2017). Technical Support Document: Social Cost of Carbon for Regulatory Impact Analysis – Under Executive Order 12866. [pdf] Available at: https://19january2017snapshot.epa.gov/sites/production/files/2016-12/documents/scc_tsd_2010.pdf. [Accessed 05 June 2017] Equator Principles (EP) (2013). The Equator Principles June 2013. [pdf] Available at: http://www.equator-principles.com/resources/equator_principles_III.pdf [Accessed 29 Apr 2016] European Bank for Reconstruction and Development (EBRD) (2010). EBRD Methodology for Assessment of Greenhouse Gas Emissions – Guidance for Consultants working on EBRD-financed Projects. [pdf] Available at: http://www.ebrd.com/downloads/about/sustainability/ghgguide.pdf [Accessed 29 Apr 2016] ESI Africa (2015). Medupi Power Station: Unit 6 Reaches 735 MW Generation Output. [ONLINE]. Available at: http://www.esi-africa.com/news/medupi-power-station-unit-6-reaches-735mw-generation-output/ [Accessed 23 May 2016] Eskom (2011). COP 17 Fact Sheet – Air Quality and Climate Change. Available at: http://www.eskom.co.za/OurCompany/SustainableDevelopment/ClimateC

ERM MARUBENI
78
hangeCOP17/Documents/Air_quality_and_climate_change.pdf [Accessed 07 Jun 2016] Eskom (2015a). Integrated Report 31 March 2015. [pdf] Available at: http://www.eskom.co.za/IR2015/Pages/Default.aspx [29 Apr 2016] Eskom (2015b). Transmission Development Plan 2016 – 2025. [pdf] Available at: http://www.eskom.co.za/Whatweredoing/TransmissionDevelopmentPlan/Pages/Transmission_Development_Plans.aspx [01 June 2016] Eskom (2016a). Guide to Independent Power Producer (IPP_ Processes. Available at: http://www.eskom.co.za/Whatweredoing/InfoSiteForIPPs/Pages/Guide_To_Independent_Power_Producer_IPP_Processes.aspx [Accessed 29 Apr 2016]. Eskom (2016b). Understanding Electricity. [ONLINE}. Available at: http://www.eskom.co.za/AboutElectricity/ElectricityTechnologies/Pages/Understanding_Electricity.aspx [Accessed 23 May 2016] Eskom (2017). Eskom Coal Consumption data 2010 - 2014 [ONLINE]. Available at: http://www.eskom.co.za/OurCompany/SustainableDevelopment/Documents/ConsumptioData2010-14.xlsx [Accessed 12 April 2017] Eskom (n.d.a). Medupi Power Station Project. [ONLINE]. Available at: http://www.eskom.co.za/Whatweredoing/NewBuild/MedupiPowerStation/Pages/Medupi_Power_Station_Project.aspx [Accessed 04 July 2016] Eskom (n.d.b). Kusile Power Station Project. [ONLINE]. Available at: http://www.eskom.co.za/Whatweredoing/NewBuild/Pages/Kusile_Power_Station.aspx [Accessed 04 July 2016] European Commission (EC) (2017). Fluorinated gases. [ONLINE]. Available at: https://ec.europa.eu/clima/policies/f-gas_en [Accessed 08/06/2017] Gustavson, L. and Leckner, B. (1995). Abatement of N2O emissions from Circulating Fluidized Bed Combustion through Afterburning. Ind Eng Chem Res, 34, 1419 – 1427. [ONLINE] Henneman, L. et al. (2015). Assessing emissions levels and costs associated with climate and air pollution policies in South Africa. Energy Policy, vol. 89, pp.160-170. http://dx.doi.org/10.1016/j.enpol.2015.11.026 Hu, X et al (2012). Research on the Gas Reburning in a Circulating Fluidized Bed (CFB) System Integrated with Biomass Gasification. Energies 2012, 5, 3167-3177. [ONLINE]

ERM MARUBENI
79
Independent Power Producer (IPP) Coal (2016a). Coal Baseload Independent Power Producer Procurement Programme. [ONLINE] Available at: https://www.ipp-coal.co.za [Accessed 12 May 2016] Independent Power Producer (IPP) Coal (2016b). About the Coal Baseload IPP Procurement Programme. [ONLINE] Available at: https://www.ipp-coal.co.za/About [Accessed 12 May 2016] Independent Power Producer (IPP) Gas (2016). The Gas to Power Programme. [ONLINE] Available at: https://www.ipp-gas.co.za/ [Accessed 28 April 2016] Independent Power Producer (IPP) Projects (2016). Introduction to the IPP Procurement Program. [ONLINE] Available at: https://www.ipp-projects.co.za/About [Accessed 12 May 2016] The Institute of Energy Economics, Japan (IEEJ) (2016). The South African Energy Independent Power Producers Procurement Programme (IPPPP). [pdf] Available at: http://eneken.ieej.or.jp/data/6655.pdf [Accessed 23 May 2016] International Energy Agency (IEA) Coal Industry Advisory Board (CIAB) (2010). Power Generation from Coal: Measuring and Reporting Efficiency Performance and CO2 Emissions. [pdf] Available at: https://www.iea.org/ciab/papers/power_generation_from_coal.pdf [Accessed 03 May 2016] International Energy Agency (IEA) (2012a). Technology Roadmap: High-Efficiency, Low-Emissions Coal-Fired Power Generation. [pdf] Available at: http://www.iea.org/publications/freepublications/publication/TechnologyRoadmapHighEfficiencyLowEmissionsCoalFiredPowerGeneration_WEB_Updated_March2013.pdf [Accessed 03 May 2016]. International Energy Agency (IEA) (2012b). CCS Retrofit: Analysis of the Globally Installed Coal-Fired Power Plant Fleet. [pdf] Available at: https://www.iea.org/publications/freepublications/publication/CCS_Retrofit.pdf [Accessed 03 May 2016] International Energy Agency (IEA) (2013). CO2 Emissions from Fuel Combustion – Highlights [2013 Edition]. IEA Publications, France International Energy Agency (IEA) (2014). Emissions Reduction through Upgrade of Coal-Fired Power Plants – Learning from Chinese Experience. [pdf] Available at: https://www.iea.org/publications/freepublications/publication/PartnerCountrySeriesEmissionsReductionthroughUpgradeofCoalFiredPowerPlants.pdf [Accessed 29 April 2016] International Finance Corporation (IFC) (2012). Performance Standard 3 - Resource Efficiency and Pollution Prevention. [pdf] Available at: http://www.ifc.org/wps/wcm/connect/25356f8049a78eeeb804faa8c6a8312a/PS3_English_2012.pdf?MOD=AJPERES [Accessed 29 April 2016]

ERM MARUBENI
80
Intergovernmental Panel on Climate Change (IPCC) (2006). 2006 IPCC Guidelines for National Greenhouse Gas Inventories: Volume 3 Industrial Processes and Product Use. [pdf] Available at http://www.ipcc-nggip.iges.or.jp/public/2006gl/ [Accessed 29 April 2016] Intergovernmental Panel on Climate Change (IPCC) (2006a). 2006 IPCC Guidelines for National Greenhouse Gas Inventories: Volume 2 Energy. Chapter 2 Stationary Combustion. [pdf] Available at www.ipcc-nggip.iges.or.jp/public/2006gl/vol2.html [Accessed 3 April 2017] Merven, B., et al. (2014). The Socio-economic Implications of Mitigation in the Power Sector Including Carbon Taxes in South Africa. [pdf] Working Paper for CDKN project on Linking Sectoral and Economy-wide Models. Energy Research Centre, University of Cape Town, Cape Town. Available at: https://open.uct.ac.za/bitstream/handle/11427/16897/Merven_Socio_economic_implications_2014.pdf?sequence=1 [Accessed 29 April 2016] Minchener, A. (2012). Carbon Mitigation Technologies for Emerging Economies. IEA Clean Coal Centre. [pdf]. Available at: https://www.usea.org/sites/default/files/ccc19052012_Carbon%20mitigation%20technologies%20for%20emerging%20economies_ccc198.pdf [Accessed 29 April 2016] National Association of Clean Air Agencies (NACAA) (2015). Implementing EPA’s Clean Power Plan: A Menu of Options. Chapter 1: Optimise Power Plant Operations. [pdf] Available at: http://www.4cleanair.org/NACAA_Menu_of_Options [Accessed 23 May 2016] Pedersen, H. (2001). Ways of reducing consumption and emission of potent greenhouse gases (HFCs, PFCs and SF6). Danish Technologiae Institute. DTI Energy. Gregersensvej. TemaNord 2001:594. Savannah Environmental (2015). Final Environmental Impact Assessment Report – Proposed Establishment of a Coal-Fired Power Station and Associated Infrastructure – IPP Thabametsi Power Station Near Lephalale Limpopo Province. DEA Ref No: 14/12/16/3/3/3/40. Final Report – May 2014. South African Centre for Carbon Capture & Storage (SACCCS) (2016). Roadmap / Strategy. [ONLINE]. Available at: http://www.sacccs.org.za/roadmap/ [Accessed 23 May 2016] UK Department for Business, Energy & Industrial Strategy (BEIS) (2016). Government emission conversion factors for greenhouse gas company reporting. Available at: https://www.gov.uk/government/collections/government-conversion-factors-for-company-reporting [Accessed 01 August 2016] United Nations Framework Convention on Climate Change (UNFCCC) (2015). Summary Report on the Technical Analysis of the First Biennial Update

ERM MARUBENI
81
Report of South Africa Submitted on 17 December 2014. [pdf] Available at: http://unfccc.int/resource/docs/2015/tasr/zaf.pdf [Accessed 29 Apr 2016] U.S. Department of Energy (DOE) (2004). Biomass Cofiring in Coal-Fired Boilers. Federal Energy Management Program – Federal Technology Alert. [pdf] Available at http://www.nrel.gov/docs/fy04osti/33811.pdf [Accessed 23 May 2016] World Energy Council (2004). Comparison of Energy Systems Using Life Cycle Assessment. [pdf[ Available at: https://www.worldenergy.org/publications/2004/comparison-of-energy-systems-using-life-cycle-assessment/ [Accessed 29 April 2016] World Business Council for Sustainable Development (WBCSD) and World Resources Institute (WRI) (2004). The Greenhouse Gas Protocol – A Corporate Accounting and Reporting Standard, Revised Edition. [pdf] Available at http://www.ghgprotocol.org/standards/corporate-standard [Accessed 29 April 2016] World Resources Institute (WRI) (2015). South Africa Pledges to Peak Its Greenhouse Gas Emissions by 2025. [ONLINE] Available at: http://www.wri.org/blog/2015/10/south-africa-pledges-peak-its-greenhouse-gas-emissions-2025 [Accessed 29 April 2016] Winkler et al. (2011). South Africa’s greenhouse gas emissions under business-as-usual: The technical basis of ‘Growth without Constraints’ in the Long-Term Mitigation Scenarios. Energy Policy, Vol. 39 (10), pp. 5818-5828 WSP | Parsons Brinckerhoff (2015a). Thabametsi 600MW Coal Fired Power Plant – Lephalale, South Africa. Coal Fired Power Plant Feasibility Study (11 September 2015). WSP | Parsons Brinckerhoff Reference No: ZA2155860 WSP | Parsons Brinckerhoff (2015b). Thabametsi Power Station Site Decommissioning Study (October 2015). WSP | Parsons Brinckerhoff Reference No: 3514268A_1

ERM has over 150 offices across the following countries and territories worldwide Argentina Australia Belgium Brazil Canada China Colombia France Germany Hong Kong India Indonesia Ireland Italy Japan Kazakhstan Kenya Malaysia Mexico Mozambique New Zealand ERM Cape Town Office 2nd Floor, Great Westerford 240 Main Road, Rondebosch 7700, Cape Town, South Africa T: +27 21 681 5400 F: +27 21 686 0736 E: [email protected] ERM Durban Office Suite S005, 17 The Boulevard Westway Office Park, Westville 3635, Durban, South Africa T: +27 31 265 0033 F: +27 31 265 0150 E: [email protected] ERM Johannesburg Office Building 32, The Woodlands Office Park, Woodlands Drive, Woodmead, 2148 Johannesburg, South Africa T: +27 11 798 4300 F: +27 11 804 2289 E: [email protected] www.erm.com
ERM Maputo Office Rua dos Desportistas, 649 Edificio da Vodacom, 12º Andar Maputo, Mozambique T: +258 84 310 9502 T: +258 84 311 9516 (Direct) M +258 84 490 5586 M +258 82 293 5229 E: [email protected] ERM Nairobi Office 4th Floor, Landmark Office Suites Laiboni Centre, Lenana Road, Kilimani, Nairobi, Kenya T: +254 20 493 8113/4 M: +254 71 265 0516 (KE) M: +27 72 610 6281 (SA) E: [email protected] Marinda van der Merwe Managing Partner T: +27 21 681 5400 E: [email protected]
Norway Panama Peru Poland Portugal Puerto Rico Romania Russia Singapore South Africa South Korea Spain Sweden Switzerland Taiwan Thailand The Netherlands United Arab Emirates United Kingdom United States of America Vietnam