Embed Size (px)
Citation preview

Green vehicle scoring in Europe: scope and methodologies
Dr Ben Lane, Senior Consultant, Ecolane
Green Global NCAP Workshop – IEA, Paris, 30th April 2013 [email protected] +44 (117) 929 8855

Ecoscore (Belgium, LCA, 2003?-13) Belgian system developed by Vrije Uni. Brussels, VITO & CESSE – well supported live database
Cleaner Drive (EU, LCA, 2001-2004) Car life cycle ratings – EU project 2001-2004 led by Energy Saving Trust, UK – discontinued
Green Car Rating (UK, LCA, 2006-13) Developed by Next Green Car, UK based on EU Cleaner Drive – well supported live database
CAIR Environmental Rating system (UK, TA data+, 1998-2006?) Centre for Automotive Industry Research (CAIR) at University of Cardiff, UK – discontinued
ETA Car Buyer’s Guide (UK, TA data, ??-2012) Environmental Transport Association – based on Type Approval data – Occasional updates
VCD Environmental Car List (Germany, TA data, 2002-13) Basic points system based on Type Approval data generated annual Top Ten list – Annual
EcoTest (EU, Real world tailpipe, 2003-13) Jointly developed by the FIA foundation and ADAC – 150+ cars tested annually real world cycle
EU vehicle scoring/ratings systems “The most important contribution of [LCA] methods is getting decision-makers to focus on the important attributes and to avoid looking and only one aspect of the fuel cycle or propulsion system” 1
1 – MacLean and Lave 2002 TA – Type Approval

Ecoscore overview (Belgium) ecoscore.be1 is a free to use consumer website
developed by Vrije University Brussels, Flemish Institute of Technological Research (VITO) & Centre of Economical and Social Studies of the Environment (CESSE) Universite Libre de Bruxelles.
Includes LCA methodology related to fuel cycle and expresses car’s life cycle environment impact as a score out of 100: 100 greenest to 0 most polluting
Ecoscore methodology includes 3x GHG emissions, 6x AQ regulated pollutants and noise – assesses impacts on climate change, air quality (human health and ecosystem).
Website is free to use and allows users to search for specific models, provides ‘Top 10’ lists by vehicle class and a calculator to score any emissions dataset.
1 – http://www.ecoscore.be

Ecoscore website (Belgium)
1 – http://www.ecoscore.be
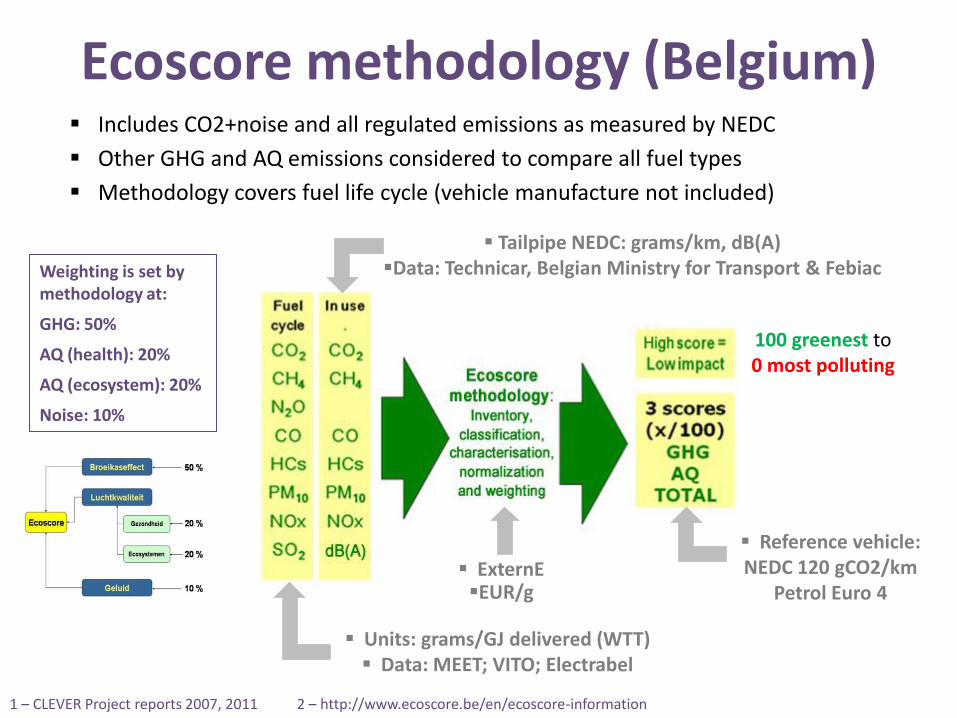
1 – CLEVER Project reports 2007, 2011 2 – http://www.ecoscore.be/en/ecoscore-information
Includes CO2+noise and all regulated emissions as measured by NEDC
Other GHG and AQ emissions considered to compare all fuel types
Methodology covers fuel life cycle (vehicle manufacture not included)
Tailpipe NEDC: grams/km, dB(A) Data: Technicar, Belgian Ministry for Transport & Febiac
Units: grams/GJ delivered (WTT) Data: MEET; VITO; Electrabel
Reference vehicle: NEDC 120 gCO2/km
Petrol Euro 4 ExternE EUR/g
Weighting is set by methodology at:
GHG: 50%
AQ (health): 20%
AQ (ecosystem): 20%
Noise: 10%
Ecoscore methodology (Belgium)
100 greenest to 0 most polluting

Ecoscore = 100*exp[-0.00357*(A*CO2 + B*HC + C*NOx + D*CO + E*PM + F*BV + G*dB(A) + H)]
Ecoscore GHG = 100*exp[-0.00357*2*(A*CO2 + f1*BV + h1)]
Ecoscore AQ = 100*exp[-0.00357*2.5*(B*HC + C*NOx + D*CO + E*PM + f2*BV)]
AQ calculation CO HC NOx PM BV TOTAL
Emm (g/km) & FC (l/100km) 0.258 0.058 0.006 - 3.9 -
Coefficients 0.011 23.17 101.88 1407.75 5.89
Exponent 0.0028 1.3439 0.6113 0.0000 22.971 24.929 AQ ecoscore 80.0
GHG calculation CO2 BV constant TOTAL
CO2 (g/km) & FC (l/100km) 89 3.9 - -
Coefficients 0.36 1.12 0.71 -
Exponent 32.04 4.368 0.71 37.118 GHG ecoscore 76.7
BV = fuel economy in lit/100km, m3/100km or kWh/100km Coefficients A, B, C, D, E, F, f1, f2, G and the constants H, h1, h2 correspond to fuel type and Euro standard
Example: Toyota Prius 1.8 VVT-i T3 HEV MY2013 89gCO2/km2
AQ calculation CO2 CO HC NOx PM BV dB(A) constant TOTAL
Emm (g/km) & FC (l/100km) 89 0.258 0.058 0.006 - 3.9 69.0 -
Coefficients 0.36 0.011 23.17 101.88 1407.75 7.01 0.333 -12.63
Exponent 32.04 0.0028 1.3439 0.6113 0.0000 27.339 22.977 -12.63 71.684 AQ ecoscore 77.4
GHG ecoscore = 76.7 (1 dec pl.)
AQ ecoscore = 80.0 (1 dec pl.)
TOTAL ecoscore = 77.4 (1 dec pl.)
Ecoscore calculations1 (Belgium)
1 – http://www.ecoscore.be/en/ecoscore-information 2 – VCA (UK) NEDC data

Ecoscore results (Belgium)
GHG/AQ /dB weighting 50:40:10
Weighting is set by methodology
2012-13 models shown using reverse 2-D plot of AQ-GHG ecoscores – Belgium context

Next Green Car Overview (UK) Nextgreencar.com1 is a free to use UK consumer
website designed to help car buyers find, compare and buy greener cars – Est. 2006
NGC is UK’s No.1 green car website with 230k+ visitors and 900k+ page impressions per month2
Includes Green Car Rating which expresses car’s life cycle environment impact as a score out of 100: 0 greenest to 100 most polluting
NGC is a commercial website with over 30k vehicle records in a database updated weekly - petrol, diesel, hybrid, LPG, CNG, BEV, PHEV, REEV, FCV
Plus news, reviews and data for low emission cars; Approved Cars; Annual awards which recognise the best new green cars by class
1 - http://www.nextgreencar.com 2 – Google Analytics March 2013

Home Page Next Green Car website
1 - http://www.nextgreencar.com

Model list shows key consumer info:
Green Car Rating
Fuel economy (MPG)
Tailpipe CO2 (g/km)
Pricing (capital)
Fuel type (EVs treated in
similar way to ICEs)
Next Green Car website
C-segment search
1 - www.nextgreencar.com/new-car-search/

Next Green Car website
Nissan LEAF 2012
Model info shows key consumer info:
Green Car Rating (for different energy sources where available)
Fuel economy (MPGe used for EVs)
Tailpipe CO2 (g/km) linked to tax
Options to compare within model range and vehicle class
1 - www.nextgreencar.com/view-car/45426/NISSAN-Leaf-Electric-Car-90kW-Auto-Electric-(av-UK-mix)

Green Car Rating methodology (UK) GCR methodology based on Cleaner Drive Environmental Rating Tool 2004
Extended to include vehicle production emissions (estimated)
For ICEs, this adds 10-15% on life cycle CO2 – more for cars with electric drive-trains
Vehicle life cycle emissions (est)
(Upstream) fuel life cycle emissions
Tailpipe emissions
Stages not included in LCA: End-of-life, waster management, recycling (beyond use of recycled materials as normal part of feedstock)
1 - www.nextgreencar.com/ratings.php

Includes CO2 and all regulated emissions as measured by NEDC
Other GHG and AQ emissions considered to compare all fuel types (excl. dB(A))
External costing method – GHG/AQ weighting determined by costs and ref. vehicle
Tailpipe NEDC: grams/km
Data: Vehicle Certification Agency + 3rd party CO2
UK estimates: grams/GJ delivered (WTT) Data: MEET; JRC Concawe; GREET
Modelled on proportion of 12 material
types for PET, DSL, LPG, CNG, HEV, BEV, PHEV
Expressed in grams/1000kg
Data: MEET; JRC Concawe;
GREET; Ricardo-AEA
0 greenest to 100 most polluting
Normalised 100 baseline:
NEDC 300 gCO2/km Petrol Euro 3 (2000) ExternE
Green Car Rating methodology (UK)
1 - www.nextgreencar.com/ratings.php

External cost QGHG/AQ (EUR/km) = i pi.ci
GHG Rating = 100 QGHG (vehicle) / QGHG(maximum)
AQ Rating = 100 QAQ (vehicle) / QAQ (maximum)
Green Car Rating = 100 QTOTAL (vehicle) / QTOTAL (maximum)
GHG Rating = 100 0.00642 / 0.01718 = 37.0 (1 dec pl.)
AQ Rating = 100 0.00208 / 0.01165 = 19.0 (1 dec pl.)
Green Car Rating = 100 0.00959 / 0.02883 = 30.0 (1 dec pl.)
AQ external costs CO HC NOx PM SO2 TOTAL
Tailpipe emissions (g/km) 0.258 0.058 0.006 - - -
Tailpipe ext costs (EUR/km) 0.00000 0.00000 0.00000 0.00000 0.00000 -
Indirect ext costs (EUR/km) 0.00000 0.00069 0.00031 0.00012 0.00095 -
AQ external costs 0.00000 0.00069 0.00031 0.00012 0.00095 0.00208 Max AQ ext cost 0.01165
GHG external costs CO2 CH4 N2O TOTAL
Tailpipe emissions (g/km) 89 0.012 (est) 0.005 (est) -
Tailpipe ext costs (EUR/km) 0.00409 0.00001 0.00007 -
Indirect ext costs (EUR/km) 0.00221 0.00004 0.00000 -
GHG external costs 0.00630 0.00005 0.00007 0.00642 Max GHG ext cost 0.01718
pi = emission of pollutant i in grams/km
ci = external cost of emission of pollutant i in EUR/grams
Example: Toyota Prius 1.8 VVT-i T3 HEV MY2013 89gCO2/km2
Green Car Rating calculation (UK)
1 – http://www.ecoscore.be/en/ecoscore-information 2 – VCA (UK) NEDC data

Green Car Rating results (UK)
GHG/AQ weighting 60:40 approx.
Weighting arises purely out of relative value of external costs and emissions characteristics of baseline model
2012-13 models shown using 2-D plot of AQ-GHG ratings coordinates – UK context

Ecoscore results (Belgium)
GHG/AQ /dB weighting 50:40:10
Weighting is set by methodology
2012-13 models shown using reverse 2-D plot of AQ-GHG ecoscores – Belgium context

High-quality and robust vehicle rating/score systems need to :
Include all measured air-based emissions (not just CO2) – allows a realistic comparison between different vehicle and fuel types (PET vs DSL)
Include life cycle emissions (beyond tailpipe) – enables a fair comparison of all conventional and alternative vehicle types – and means that ultra-low and zero-emission vehicles can be fairly compared – this will become a major issue in future
Include vehicle manufacturing cycle (as well as fuel cycle) – while manufacturer of ICEs only contributes 10-15% of life cycle CO2, this is set to dramatically increase with introduction electric drive-trains (may be >50% embodied energy)
Incorporate an impact assessment (as well as an emissions inventory) – not only does this account for the impacts and location of different emissions, considering impact enables: (a) comparison between emission types and (b) emission vectors to be aggregated
Be easy-to-search and easy-to-understand for non-experts – common approach is to use a score out of 100 ranging from the greenest vehicles to the most polluting
Be a trusted source of information (already known to be an issue re labelling) – common standards available include ISO 14040-14044 standards and PAS2050 accreditation (Next Green Car working towards PAS2050)
EU vehicle scoring/ratings summary

Green vehicle scoring in Europe: scope and methodologies
Dr Ben Lane, Senior Consultant, Ecolane
Green Global NCAP Workshop – IEA, Paris, 30th April 2013 [email protected] +44 (117) 929 8855