Embed Size (px)
Citation preview

Green Labs Assessment Report
Results of Pilot Program October 2012
This report is compiled by the Sustainability Office, Property and Facilities Division, from feedback and individual assessment reports conducted by the Pilot Program Green Labs
representatives, as well as the Green Programs Coordinator, and compiled by the Green Office Coordinator.

Green Labs Pilot Program Report Page ii
Table of Contents List of Figures ............................................................................................................................................................3
List of Tables .............................................................................................................................................................3
Executive Summary ..................................................................................................................................................1
Description of Program ............................................................................................................................................2
Intention of Program ................................................................................................................................................2
Design Components ..................................................................................................................................................2
Activities ...................................................................................................................................................................4
Stakeholders .............................................................................................................................................................5
Timeline ....................................................................................................................................................................6
Baseline Assessment Results ....................................................................................................................................6
Feedback on Activities and Materials .................................................................................................................... 10
General Feedback .............................................................................................................................................. 10
Feedback on Training ........................................................................................................................................ 10
Feedback on Materials ...................................................................................................................................... 10
Feedback on Audit Tools ................................................................................................................................... 11
Recommendations ................................................................................................................................................. 16
Conclusion ............................................................................................................................................................. 17
Appendices ............................................................................................................................................................ 18
Appendix 1: Green Labs Audit Form ................................................................................................................. 18
Appendix 2: Green Labs Worksheet .................................................................................................................. 28
Appendix 3: Green Labs Audit Results Summaries ........................................................................................... 34

Green Labs Pilot Program Report Page iii
List of Figures
Figure 1: Overall average ratings by section. ...........................................................................................................7 Figure 2: Overall results of Green Labs baseline audits. The overall average across all labs is shown in green......8 Figure 3: Partially or N/A box. ............................................................................................................................... 12 Figure 4: Illustrative example of a question that is divided between 2 pages. ..................................................... 12 Figure 5: Illustrative example of a question identified as confusing by Green Labs representatives. .................. 13 Figure 6: Illustrative example of a graph generated by the Green Labs Worksheet Tool..................................... 15
List of Tables Table 1: Laboratories and representatives involved in the Green Labs Pilot Program. ...........................................2 Table 2: Number of labs relevant to each component in the specific section. ........................................................9 Table 3: Laboratory information box recommended for the audit form. ............................................................. 11 Table 4: Comparison between the current and the proposed audit structure. .................................................... 12

Green Labs Pilot Program Report Page 1
Pilot Program Report October 2012
Executive Summary This report summarises the Green Labs Pilot Program and the feedback obtained from participants. The Green Labs Program was developed in 2011 as an extension of the University’s existing Environmental Management System (EMS). The Program is designed to improve lab practices to minimise environmental impact and reduce environmental risk, in accordance with the EMS. UQ’s Sustainability Steering Committee approved the formation of a Green Labs Working Group to develop a Green Labs Program which was implemented as a Pilot Program in 2011 – 2012. Ten volunteer laboratories were recruited from across the University to participate in the Pilot Program, including eight labs at the St Lucia campus and two at Herston. The purpose of the Green Labs Pilot Program was to identify any changes and refinements that could improve on the design of the program’s training, resources, newsletter, auditing process and auditing tools. Green Labs Baseline Audits were undertaken in pairs, with each Representative participating in an audit of their own laboratory and an audit of another laboratory. Upon completion of the audits, the results were submitted to the Sustainability Office to be processed and one-page summaries were sent to each Green Lab Representative. Representatives indicated that the reports and summary provide very useful information which is able to be discussed at lab meetings. Annual audits will track improvements in lab practices over time. The average overall score across all labs audited was 81%. Results indicate that UQ labs are efficient water users and that all labs have effective and efficient and waste management practices. “Energy” and “Lighting” scored low in comparison, as did “Procurement” and “Training” suggesting that labs would benefit from strategies focused on these areas, while continuing to maintain high standards of waste management. Green Labs Awards will be awarded annually as of 2013 to recognise best practice in UQ laboratories. Certificates of Recognition were presented by the Senior Deputy Vice-Chancellor to Representatives participating in the Green Labs Pilot Program at a World Environment Day Breakfast held on 1st June 2012. Green Labs Representatives who participated in the Pilot Program have provided feedback on all aspects of the program and this feedback will be incorporated into the program resources, materials and training. The refined program will be opened and all UQ laboratories will be invited to participate in the UQ Green Labs program.

Green Labs Pilot Program Report Page 2
Description of Program The Green Labs Program was developed in 2011 as an extension of the University’s existing Environmental Management System (EMS). The Program is designed to improve lab practices to minimise environmental impact and reduce environmental risk, in accordance with the EMS. A Green Labs Pilot Program was implemented in 2011-2012. Ten laboratories across the University were involved in the Pilot Program, including eight labs at the St Lucia campus and two at Herston.
Table 1: Laboratories and representatives involved in the Green Labs Pilot Program.
Representative Laboratory Faculty/Institute School/Centre Audited by
Daniel Tang Chemistry Lab Qld Alliance for Agriculture & Food Innovation
Centre for Nutrition & Food Sciences Tim Butler
Lilia Costa Carvalhais
Plant-Microbe Interactions and Algae Biotechnology Labs Faculty of Science School of Agriculture and
Food Sciences Suzanne Manning
John Baisden Cortical Development and Axon Guidance Lab Queensland Brain Institute (QBI) Sheena Chen
Tim Butler Wallace Lab Queensland Brain Institute (QBI) Daniel Tang
Sophie Tajouri Bartlett Lab Queensland Brain Institute (QBI) Daniel Tang
Jane Ellis Histology Lab Queensland Brain Institute (QBI) Audit not applicable
Sheena Chen Hydrometallurgy Lab Faculty of Engineering, Architecture and Information Technology
School of Chemical Engineering John Baisden
Suzanne Manning
Queensland Centre for Medical Genomics
Institute for Molecular Bioscience (IMB)
Lilia Costa Carvalhais
Casey Pfluger Neuroimmunology Lab Faculty of Health Sciences UQ Centre for Clinical Research (UQCCR)
Rebecca Johnstone
Rebecca Johnston Lakhani Lab (Breast Pathology) Faculty of Health Sciences UQ Centre for Clinical
Research (UQCCR) Casey Pfluger
The program is modelled on the existing Green Office Program, established in 2005, but provides a more specific focus on the environmental practices of laboratories.
Intention of Program The Green Labs Program aims to raise environmental awareness and provides a process for identifying, assessing and addressing environmental impacts within laboratories. The purpose of the Green Labs Pilot Program is to identify changes and refinements that need to be made to the training, resources, newsletter, auditing process and auditing tools.
Design Components The Green Labs Program is an extension of UQ’s existing EMS. Previously, audits of labs were conducted as part of the EMS; however, audits are now being captured under the Green Labs Program. A range of materials were developed to assist Representatives in implementing strategies to improve the environmental performance of their labs. Stickers and posters are provided to help manage appropriate waste disposal and identify unattended experiments. Checklists are provided to assist with managing laboratory practices to reduce risk. Checklists are available for identifying freezers and fridges, managing experiments, and recording participation in training. Fact sheets were developed for the following topics:
− Chemical management − Design

Green Labs Pilot Program Report Page 3
− Energy efficiency − Fume cupboards − Housekeeping − Lighting − Procurement − Training − Waste reduction − Water efficiency
Two newsletters written by the Green Programs Coordinator and Green Office Coordinator were distributed to Representatives by email and made available on the Sustainability website. The newsletter aims to raise awareness, provide inspiration and ideas for initiatives, and inform Representatives on relevant upcoming events. Newsletters were distributed at the commencement of the pilot program and in mid 2012. The audit tools were developed by the Working Group for Cleaner Production. The audit form and spreadsheet are made available online. Representatives are provided with a report on the results of the audit. Labs participating in the Pilot Program were cross-audited in pairs so that Representatives did not audit their own lab. Instead, a Representative from a similar lab conducted the audit (see Table 1). It was decided by the Green Labs Working Group (GLWG) that cross auditing provides a fresh and more objective approach plus the opportunity for laboratory members to network.

Green Labs Pilot Program Report Page 4
Activities A range of activities have been involved in the implementation of the Green Labs Pilot Program. The Green Labs Working Group was established in early 2011 with the purpose of developing a Green Labs Program specifically for UQ. Information sessions were conducted to provide information about the Green Labs Program to interested individuals with a view to recruiting participants for the Pilot Program. These sessions were held at St Lucia and Herston campuses in late 2011. The sessions were also made available to Gatton campus and PACE in late 2011. Training sessions were conducted by members of the Working Group for Cleaner Production. These sessions aimed to provide a background of sustainability at UQ, objectives of the Green Labs Program, and detailed information about the auditing process. Training sessions were also used for networking with other new representatives and brainstorming strategies to improve lab practices. A range of materials were provided to Green Labs Representatives to assist with implementation of the program within their workplace. Materials included: fact sheets, stickers and tags, newsletters, and audit tools. Other resources related to specific sustainability themes, such as energy monitors, are also available for specific promotions. Baseline assessments were conducted in 2012 by Representatives. Labs will continue to be audited on an annual basis to track improvements in lab practices. Green Labs Awards will be awarded annually as of 2013 to recognise best practice in UQ laboratories. Certificates of Recognition were presented by the Senior Deputy Vice-Chancellor to Representatives participating in the Green Labs Pilot Program at a World Environment Day Breakfast held on 1st June 2012.

Green Labs Pilot Program Report Page 5
Stakeholders A number of stakeholders within the University have been involved in establishing the Green Labs Pilot Program. The Sustainability Steering Committee (SSC) was established in 2009 to oversee the evolution of UQ’s successful EMS into corporate sustainable culture. Responsibilities of the SSC include: biodiversity, built environment, energy and carbon, environmental risk, purchasing, recycling and waste, transport, and water. The SSC reports to the Vice-Chancellor. Under the SSC, the GLWG has guided the development of the Green Labs Program. Members of the Working Group were approached in February 2011. The GLWG consists of:
− Jane Gaffel – Working Group for Cleaner Production − Anne Tobin – Institute of Molecular Biosciences − Neville Barry – School of Biomedical Sciences − Harry Penkeyman – Faculty of Engineering, Architecture and IT − Ron West – School of Pharmacy, PACE − Eunice Grinan – Centre for Microscopy and Microanalysis − Maya Carmi – Global Change Institute − Luke Devitt – UQ Centre for Clinical Research − Kaye Vockenson – School of Agriculture and Food Sciences − Marshall Butterworth – University Chemicals Manager − Suzanne Davis & Kay Ollett – UQ Sustainability
The Working Group for Cleaner Production has had a pivotal role in developing the assessment tools and resources for the Green Labs Program. The Working Group is part of the School of Geography, Planning and Environmental Management. The Green Labs Program is coordinated by the Sustainability Office within the Property and Facilities Division of the University. The Sustainability Office is responsible for coordinating the Program and communicating with Representatives, and appointed a Green Programs Coordinator to assist with this. The Green Programs Coordinator coordinated the baseline assessments and developed the preliminary baseline assessment reports. The Green Office Coordinator compiled the assessment and pilot program reports.
− Valentina Urrutia Guada – Green Programs Coordinator − Sally Croker – Green Office Coordinator
The Program operates through a network of Green Labs Representatives located in labs within the University. Representatives, with the help of the Sustainability Office, implement changes within their workplace to improve the environmental performance of their lab.

Green Labs Pilot Program Report Page 6
Timeline Following the enactment of the Environmental Protection Act 1994, UQ established an Environmental Management System (EMS) in 1996. In 2009, the SSC was established to guide the future of sustainability at UQ. In late 2010, the GLWG was established to assist with the development of a Green Labs Program designed specifically for UQ. GLWG meetings and forums took place from December 2010 to September 2011. In January 2011, existing Green Labs Programs at other Australian Universities were reviewed, as was UQ’s EMS Internal Auditing material. The Green Labs Program design was finalised in August 2011. The Sustainability Office appointed a Green Programs Coordinator to assist with coordinating the program and communicating with Representatives. Information sessions about the Program were held at St Lucia, Gatton and Herston campuses in October 2011 to recruit participants for the Pilot Program. Training sessions for Representatives participating in the Pilot Program were held at St Lucia campus in late November 2011 and Herston campus in early December 2011. In March and April 2012, baseline audits for nine of the ten participating labs were conducted and feedback was obtained from February through to April 2012. The Green Labs Program will be modified accordingly and will be implemented across the wider UQ community.
Baseline Assessment Results Green Labs Audits were undertaken in nine laboratories, seven located in the University of Queensland St Lucia Campus and two located in the UQ Centre for Clinical Research (UQCCR), Herston Campus. Green Labs Representatives were paired, and conducted cross audits of their laboratories (see Table 1). During these audits, the Green Programs Coordinator gathered feedback on the use of the Green Labs Audit Form (Appendix 1) and the audit process. The following nine labs participating in the Green Labs Pilot Program conducted baseline audits:
1. Chemistry Lab, Centre for Nutrition and Food Sciences, Qld Alliance for Agriculture and Food Innovation
2. Plant-Microbe Interactions and Algae Biotechnology Labs, School of Agriculture and Food Sciences, Faculty of Science
3. Wallace Lab, QBI 4. Bartlett Lab, QBI
1996 EMS
established
2009 SSC
established
Late 2010 GLWG
established
Jan 2011 Review other universities' GL programs
Review of EMS Internal
Auditing material
Aug 2011 GL
Program finalised
Sep 2011 Green Programs
Coordinator recruited by
Sustainability Office
Oct 2011 Info sessions
held and pilot
participants recruited
Nov/Dec 2011
Training sessions
for particip-
ants
Feb - April 2012
Feedback gathered
from Reps
March/April 2012
Baseline audits
conducted
Implementa-tion of GL Program
across wider UQ
community

Green Labs Pilot Program Report Page 7
5. Cortical Development and Axon Guidance Lab, QBI 6. Hydrometallurgy Lab, School of Chemical Engineering, Faculty of Engineering, Architecture and IT 7. Qld Centre for Medical Genomics, IMB 8. Neuroimmunology Lab, UQCCR, Faculty of Health Sciences 9. Lakhani Lab (Breast Pathology), UQCCR, Faculty of Health Sciences
Upon completion of the audits, the results were submitted to the Sustainability Office to be processed using the Green Labs Worksheet (Appendix 2). During this process, the tool was evaluated by the Green Programs Coordinator. After this stage was completed, reports and one-page summaries were sent to each Green Lab Representative (Appendix 3).
Figure 1: Overall average ratings by section. Green colour: overall average; red: ratings obtained for each section (general, survey and specific); blue: rating obtained for each section component.
0% 10% 20% 30% 40% 50% 60% 70% 80% 90% 100%
Water Cooled EquipmentRadioactive Waste
Maintenance WasteGreen Waste
Cytotoxic WasteClinical WasteAnimal Waste
Chemical ManagementFume Cupboards
Specific SectionEnergyWater
General WasteSurvey SectionHousekeeping
Duty of CareLighting
RecyclingProcurement
TrainingGeneral
General SectionOverall Score
Score out of 100%
Sect
ion
Average Section Ratings for Pilot Program Baseline Assessments
Green Labs Pilot Program Report Page 8
Figure 2: Overall results of Green Labs baseline audits. The overall average across all labs is shown in green.
The average overall score across all labs audited was 81%. The Hydrometallurgy Lab of the School of Chemical Engineering achieved the highest score of 92% (Figure 2). The components achieving the highest ratings, averaged across all labs, were “Water” and “Maintenance Waste”, scoring 100%. “Cytotoxic Waste” also scored a high rating of 96%, as did “Clinical Waste” (94%) and “Housekeeping” (94%) (see Figure 1). The areas requiring the most improvement overall were “Water Cooled Equipment”, which scored 0%. Also achieving a low rating was “Energy”, which scored 48%.
0% 20% 40% 60% 80% 100%
Chemistry Lab
Plant-Microbe/Algae Biotech Labs
Wallace Lab
Bartlett Lab
Hydrometallurgy Lab
Qld Centre Medical Genomics
Neuroimmunology Lab
Lakhani Lab
Cortical Development & Axon Guidance Lab
Overall Average
Score out of 100%
Gre
en L
ab
Green Labs Pilot Program Baseline Audit Results

Green Labs Pilot Program Report Page 9
It should be noted that not all components in the “Specific Section” are relevant to all labs, as indicated in Table 2. The “Water Cooled Equipment” section, which scored 0%, was only relevant to one lab (Neuroimmunology Lab). Similarly, the high scoring component “Cytotoxic Waste” only included two labs. All nine labs managed fume cupboards and chemicals and generated clinical waste. None of the labs audited generated green waste or radioactive waste, so these components cannot be evaluated.
Table 2: Number of labs relevant to each component in the specific section.
Specific Section Number of Labs
Fume Cupboards 9 Chemical Management 9 Animal Waste 4 Clinical Waste 9 Cytotoxic Waste 2 Green Waste 0 Maintenance Waste 5 Radioactive Waste 0 Water Cooled Equipment 1
For the sections of the audit that were common to all labs (General Section, Survey Section, and the “Fume Cupboards”, “Chemical Management” and “Clinical Waste” components of the Specific Section), the highest score was achieved by “Water” (100%), followed closely by “Clinical Waste” and “Housekeeping” (both 94%) and “General Waste” (93%). The “Energy” section generally scored lower across all labs audited. All labs audited for the “Maintenance Waste” component achieved score of 100%. Taking these results as a representative sample of UQ labs, it appears that UQ labs are efficient water users. In addition, all labs have effective and efficient and waste management across all specific streams, as well as the “General Waste” and “Recycling” sections of the audit. “Energy” and “Lighting” scored low in comparison, as did “Procurement” and “Training”. This suggests that labs would benefit from strategies focused on these areas, while continuing to maintain high standards of waste management.

Green Labs Pilot Program Report Page 10
Feedback on Activities and Materials Green Labs Representatives provided feedback on the training, materials, and assessment process of the Program in February-April 2012. The results are summarised below.
General Feedback − Representatives highlighted the need for awareness-raising amongst current staff. − Representatives would like more information about the recycling process at UQ. For example, what
happens to bottles that are returned to the Chemical Store? − Representatives are having difficulty determining whether recyclable items have a level of chemical
contamination that is low enough to allow recycling via the normal system. − Representatives would like to explore the possibility of accessing data from devices that measure
energy use for each floor. − A strategy for managing and utilising waste from kitchens, through worm farms for example, was
suggested.
Feedback on Training − Feedback for the Green Labs training session was generally positive. − Most Representatives found the training informative and helpful in increasing their awareness of
the environmental issues in laboratories. − Representatives would like to have another session with more discussion about specific topics,
such as information on a particular building’s resource and energy consumption, and specific actions that can be taken.
− The timing of Green Labs training and activities should be considered. Representatives suggested April, May and June as “good and convenient” times. February and March tend to be the times when grant submissions are made, so other activities take lower priority.
Feedback on Materials A) Newsletter A.1. Representatives made suggestions for articles for future Green Labs newsletters. These included:
− Specific strategies that are being implemented by other research groups that may be applicable to Green Labs.
− Articles targeting each waste stream. − Information about events and training sessions.
A.2. Some Representatives found the newsletters to have too much text, and suggested the use of bullet points and links to online resources. A.3. One of the issues raised was the fact that as an attachment, people are less likely to read the newsletter. B) Resources B.1. Some Representatives appeared unaware of the existence of the tools available and many had not yet made use of the resources.
Green Labs Pilot Program Report Page 11
B.2. It was recommended by some Representatives that fact sheets be developed for water baths and ovens. Information should include how long ovens take to reach operating temperature and how much energy they consume. B.3. Other Representatives suggested that fact sheets be developed for biological safety cabinets and cell culture hoods to clarify proper use of this equipment. B.4. Representatives highlighted the need for a tag or poster that indicates the proper level to which sashes on fume cupboards should be pulled down. B.5. Representatives indicated that checklists and tags tend to fall from equipment, walls and switches. Magnetic tape and velcro (for thermal baths) were suggested as solutions. B.6. The suggestion of experiment ID tags was raised. B.7. The energy monitors provided to Representatives were not suitable to use with equipment in some labs.
Feedback on Audit Tools A) Green Labs Audit Form A.1. Structure A.1.1. More than half of the representatives recommended the inclusion of a section for information collection (see Table 2) at the beginning of the audit form.
Table 3: Laboratory information box recommended for the audit form.
A.1.2. The Representatives participating in the Green Labs Pilot Program indicated that the structure of the audit form could be improved. They recommended the sections to be defined by the activity to be performed or the person to be interviewed instead of organising sections by waste stream. The use of colours to differentiate the people to be interviewed in each section was proposed as an alternative.

Green Labs Pilot Program Report Page 12
Table 4: Comparison between the current and the proposed audit structure.
A.1.3. Audits were completed by ticking the “Yes”, “No” or “Partial” box. Where the response is “Partial” this is intended to be indicated a percentage rather than a tick. Clarity of instruction for completing this section of the form are required.
Figure 3: Partially or N/A box.
A.1.4. The audit tool was printed from a word document and some questions were split across 2 pages causing confusion for the auditors. A print version of the audit tool should be generated from the excel spreadsheet.
Figure 4: Illustrative example of a question that is divided between 2 pages.

Green Labs Pilot Program Report Page 13
A.1.5. It was noted there is some duplication of questions, however the specific examples are not recorded. A.1.6. Representatives indicated that it is important to clarify the person to be interviewed for sections 4.6 and 4.7. Additionally, 30% of the representatives consider that it might be convenient to interview a more representative sample of lab users, in order to obtain results that reflect the general behaviour and practices within the lab. A.1.7. One representative recommended differentiating between the compliance-related questions (e.g. duty of care) and the proactive sustainability-related questions (e.g. recycling). A.2. Content A.2.1. Some questions (1.5.2, 3.1.1, 3.1.2, 3.1.3, 4.2.7, 4.2.10, 4.2.14) were qualified by representatives to have “poor and confusing wording”, “weird wording”, unclear meaning, or were difficult to understand. Re-writing was recommended.
Figure 5: Illustrative example of a question identified as confusing by Green Labs representatives.
A.2.2. Representatives recommended some questions (2.1.4, 4.2.1, 4.2.2, 4.4.6, 4.4.7, 4.4.8, 4.5.4) to be re-written as “yes or no questions”. A.2.3. Question 4.4.6 was identified by representatives to be “two questions in one”, and splitting was recommended. A.2.4. Some questions (1.4.1, 1.4.5, 4.2.15) were identified by Green Labs Representatives as not applicable in general for the lab environment. For instance Question 1.4.1 makes reference to paper recycling inside the lab, which is not allowed in any of the labs that participated in the Pilot Program. Nonetheless, representatives indicated that paper was recycled in office areas. A.2.5. Prior to conducting interviews with individuals, the majority of the representatives made a brief disclaimer: “this is not a test”, “there are no right or wrong answers”. It might be convenient to include this at the beginning of the “interview with individuals” section. A.2.6. Some questions (1.3.1, 1.3.2, 1.3.3) were considered lengthy. A.2.7. Representatives indicated that the audit “should only cover lab waste”, referring to the sections 4.6 and 4.7.

Green Labs Pilot Program Report Page 14
A.2.8. Other comments made by the representatives about specific questions include: − Use “lab personnel” instead of “lab manager” (Question 1.1.1). − Include reference to environmental training (Question 1.2.2). − There was confusion as to whether the “record of who is trained” referred to environmental
training (Question 1.2.2). − Question 1.2.2 indicates the “sight of record for yes”. It is recommended to ask for these
documents before the audit. − Clarification is required as to the meaning of “being aware” (Questions 2.1.1, 2.1.2, 2.1.3). − It was suggested that the “Recycling” component of the General Section be included as part of
the walk-through survey, as it requires the various bins to be sighted. − Some representatives queried the need for Question 4.2.9. − The procedure indicated in Question 4.3.1 for disposal of animal waste differs from the procedure
applied by PC-II labs. It might be beneficial to include another line indicating the specific procedure for these laboratories.
− One representative suggested that Question 4.4.7 could be rewritten to omit the reference to the “kerb”.
− One representative suggested the water section could include pieces of equipment associated with high levels of water consumption.
− Some representatives suggested that Section 3.0 “Survey” could be renamed.
Additional comments about the overall audit were that the audit is “it’s too long”, “too vague and general”, “doesn’t allow seeing the big picture or the systems in place”.
B) Green Labs Worksheet B.1. Graphic Outcome In Figure 6 a graph generated by the Green Labs Worksheet is presented. The following points can be noted. B.1.1. It is not possible to differentiate if the section obtained 0% or the specific section was not applicable for the lab (see bars for water cooled equipment, radioactive waste, maintenance waste, etc.) B.1.2. The general order of the results (blue and red bars) goes from specific to general instead of from general to specific.

Green Labs Pilot Program Report Page 15
Figure 6: Illustrative example of a graph generated by the Green Labs Worksheet Tool.
B.2. Processed Results B.2.1. The overall score obtained for energy management was very low for all the labs, even when the practices reported were consistent with energy efficiency (turn off lights, turn off equipment, etc.). For example, labs with automatic light systems (such as the QBI and UQCCR) were assigned scores in the Green Labs Worksheet that indicated that energy management was a high priority area of improvement. B.2.2. For questions answered with N/A, the Green Labs Worksheet assigned a score of 100%. Therefore the overall results of the audit are biased towards those laboratories with simple practices and waste streams, with many N/A answers throughout the audit. These results do not necessarily indicate that one lab has higher levels of awareness or better general practices than the others. C) Green Labs Reports & One-Page Results Summary Green Labs Representatives Representatives indicated that the reports and summary provide very useful information which is able to be discussed at lab meetings.

Green Labs Pilot Program Report Page 16
Recommendations A) General: Create a checklist before the audits:
a. Share information on dress code with the other representative. b. Schedule Interviews with relevant people (purchasing officer, radiation officer, etc.). c. Ask for required documents upfront (training records).
B) Green Labs Audit Tools
a. Green Labs Audit Form i. Structure • Include a section with overall interview data (Lab name, representative name, etc.). • Categorise questions according to who is going to be interviewed, and place “Afterhours
Walk Through Survey” as a different section. • Separate the “Walk Through Survey” and “Afterhours Survey” into two distinct sections. • Provide instructions on completing “partially” responses as a percentage • Produce a print version of the audit from the excel spreadsheet
i. Content • Reword some questions to maximise clarity. • Consider omitting sections not applicable to UQ labs (mobile phones, paper recycling,
batteries recycling).
b. Green Labs Worksheet i. Graphics • Revise to make possible to differentiate a 0% score (opportunity) from a non-applicable
specific section. • Revise score bars display order (blue bars), and re-arrange from general to specific.
ii. Results • Revise weighting for each lab. For example, a lab which has mainly oven equipment would
achieve a very high score, even if their equipment remained on throughout the day. • Revise the possibility of providing a “neutral” score for “N/A” answers, to avoid bias
towards labs with simpler practices.
c. Green Labs Results Report & One-Page Results Summary i. Consider separating the recommendations associated with meeting regulatory compliance
from the rest, to highlight their importance. C) Green Labs Materials
a. Newsletter i. Provide specific information on how to improve practices.
ii. Showcase strategies implemented by other groups within the University. iii. Reduce the amount of text and provide links to online resources.

Green Labs Pilot Program Report Page 17
b. Resources i. Promote the use of resources such as fact sheets, audit tools, checklists among
Representatives ii. Develop more fact sheets for topics such as water baths, ovens, biological safety cabinets,
and culture hoods. iii. Provide more detailed information in the fact sheets. For example, in the fact sheet on fume
cupboards, indicate the proper level to which sashes should be pulled down.
D) Green Labs Training a. More discussion of specific topics and specific strategies that can be adopted to improve practices.
Conclusion The Green Labs Program aims to improve environmental practices within University of Queensland laboratories. The Pilot Program was launched in 2011 with the intention of trialling the program and resources amongst ten laboratories at UQ. Green Labs Representatives who participated in the Pilot Program have provided feedback on the resources, newsletter, audit tools and assessment process. Recommendations have been made based on this feedback. The Green Labs Audit Form could be modified to improve clarity and remove any repetition. The graphic presentation of the results could be improved so that a 0% score can be differentiated from non-applicable sections. Recommendations provided in the Audit Summaries and Reports are to comply with legislative requirements. The results of the baseline audits highlight the areas which scored high and the areas requiring improvement. Waste-related components of the audits typically scored higher than other components, with “Cytotoxic Waste”, “Clinical Waste” and “Animal Waste” all scoring between 90% and 100%. In contrast, energy-related components generally rated low amongst the labs. “Procurement” and “Training” are also areas requiring improvement.

Green Labs Pilot Program Report Page 18
Appendices
Appendix 1: Green Labs Audit Form
Green Labs Audit The following audit has been designed based on the work procedures in the EMS and the Green Labs fact sheets. Auditors should look for evidence of the following: 1 Interview with GL Rep Yes No Partially
or N/A Comments
1.1 General – GL Rep 1.1.1 Are there sufficient labels on work spaces to allow Lab
Manager to identify the group or individual responsible for experiments/equipment/samples/chemicals when unattended?
1.1.2 Are awareness posters/stickers for recycling, energy and water awareness visible throughout the lab?
1.2 Training – GL Rep 1.2.1 Is environmental training provided during new staff
induction?
1.2.2 Is there a record of who is trained? (sight record for yes) 1.2.3 Are annual update sessions on Environmental
Management run? • For Yes response, these sessions are for all lab users as a reminded of their
responsibilities and the procedures particularly in relation to waste disposal. It could be a 15 mins session perhaps held during a staff meeting rather than formal training.
1.2.4 Is there a record of who attends update sessions? (sight record for yes)
1.3 Procurement – GL Rep or purchasing officer 1.3.1 Is equipment shared between research groups, within
this lab and/or other labs where possible rather than purchasing individual equipment? • For Yes response, perhaps procurement guidelines recommend checking other
labs first.
1.3.2 Is equipment purchased based on size requirements for most frequent use? E.g. don’t purchase equipment for

Green Labs Pilot Program Report Page 19
1 Interview with GL Rep Yes No Partially or N/A
Comments
occasional or just-in-case larger loads. • For yes response, perhaps procurement guidelines or form has tick box
indicating environmental concerns have been taken into consideration including appropriate size for the project.
1.3.3 Are environmental benefits considered when making large purchases? E.g. energy star ratings/ off switches / recirculated cooling water. • For yes response, perhaps procurement guidelines or form has tick box
indicating environmental concerns have been taken into consideration.
1.3.4 Is reusable equipment purchased where possible? E.g. glassware.
1.4 Recycling – GL Rep • For yes response, sight recycle bin or location
1.4.1 Is paper recycled? 1.4.2 Is cardboard and packaging material recycled? 1.4.3 Is polystyrene recycled? 1.4.4 Are empty printer cartridges recycled? 1.4.5 Are mobile phones recycled? 1.4.6 Is obsolete computer equipment recycled? 1.4.7 Is obsolete lab equipment recycled? (including by
exchange, sale or auction). • For Yes response should indicate what method is used to recycle equipment.
1.5 Lighting – GL Rep 1.5.1 Have all incandescent lights been replaced with more
efficient lighting? (e.g. compact fluorescent lights)
1.5.2 Can light switches be isolated? For example, are light switches labelled so lights in unused areas can be switch off.
1.5.3 Has a lighting audit been undertaken of this lab? • For yes response sight documentation. (Yes if done in a previous year)
Green Labs Pilot Program Report Page 20
2 Interview with individuals Yes No Partially or N/A
Comments
2.1 Duty of Care - Individuals 2.1.1 Are you aware of the University’s Environmental Policy? 2.1.2 Are you aware of the Environmental Protection Act
1994?
2.1.3 Are you aware of your General Environmental Duty? • For Yes, response must be aware of personal liabilities to minimise harm to the
environment.
2.1.4 What would you do if you became aware of an incident that might cause environmental harm? (eg. chemical spill down sink / stormwater drain) • For Yes, response must be to try to contain incident (if safe to do so) and then
contact supervisor or 53333.
2.1.5 Do you know where to find the EMS Manual and procedures?
2.2 Housekeeping - individuals 2.2.1 Has the lab been spring cleaned this year? 2.2.2 Have chemicals and samples been removed that are no
longer needed?
2.2.3 Have fridges and freezers been cleaned out and consolidated?
2.2.4 Have freezers been defrosted? 2.2.5 Are appliances only switched on just before they are
needed rather than leaving them running constantly? (e.g. ovens, chillers, autoclaves) For Yes, response must know the warm up times – could be on a label on the appliance. Appliance should be off during the audit unless in use/warm up.
2.2.6 Are appliances run only when they have a full load? (e.g. autoclaves, dishwashers, glasswashers)

Green Labs Pilot Program Report Page 21
3 After Hours/ Walk Through Survey Yes No Partially or N/A
Comments
3.1 General Waste 3.1.1 Is all waste paper in the paper bins? 3.1.2 Is all waste polystyrene in the facilities provided? 3.1.3 Is all waste cardboard in the facilities provided? 3.2 Water 3.2.1 Is all water cooled equipment switched off? 3.3 Energy Total
number No. left on
Power save or N/A
Comments
3.3.1 Are lights switched off in unmanned areas? 3.3.2 Are hard drives (computers) switched off or on power save? 3.3.3 Are monitors switched off or on power save? 3.3.4 Are printers and photocopies switched off or on power save?
3.3.4 Are appliances switched off and not immediately in use? (including ovens, sterilisers, autoclavers) If they have been left on ready for the morning what is the warm up period?
3.3.6 Are bar fridges in use? 3.3.7 Does all relevant equipment have stickers with the
warm-up time on them?
3.3.8 Is the air conditioning switched off? (or on a sensor/or appropriate timer compared with lab use)
Green Labs Pilot Program Report Page 22
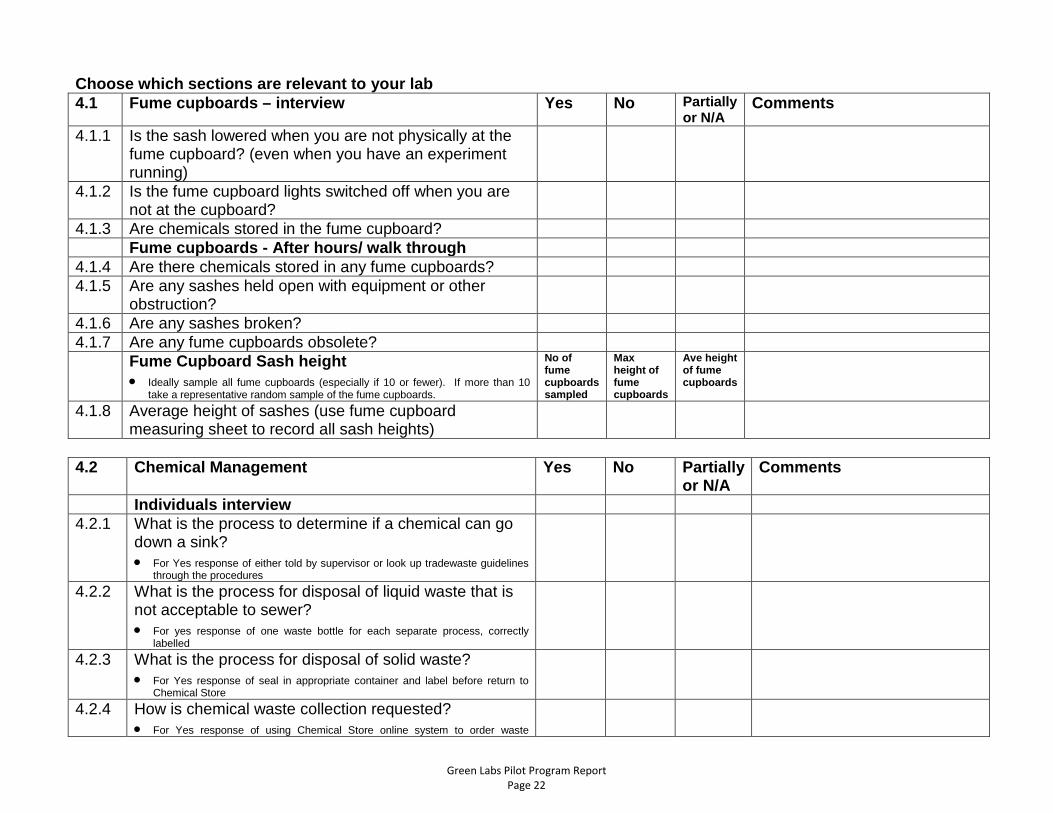
Choose which sections are relevant to your lab 4.1 Fume cupboards – interview Yes No Partially
or N/A Comments
4.1.1 Is the sash lowered when you are not physically at the fume cupboard? (even when you have an experiment running)
4.1.2 Is the fume cupboard lights switched off when you are not at the cupboard?
4.1.3 Are chemicals stored in the fume cupboard? Fume cupboards - After hours/ walk through 4.1.4 Are there chemicals stored in any fume cupboards? 4.1.5 Are any sashes held open with equipment or other
obstruction?
4.1.6 Are any sashes broken? 4.1.7 Are any fume cupboards obsolete? Fume Cupboard Sash height
• Ideally sample all fume cupboards (especially if 10 or fewer). If more than 10 take a representative random sample of the fume cupboards.
No of fume cupboards sampled
Max height of fume cupboards
Ave height of fume cupboards
4.1.8 Average height of sashes (use fume cupboard measuring sheet to record all sash heights)
4.2 Chemical Management Yes No Partially
or N/A Comments
Individuals interview 4.2.1 What is the process to determine if a chemical can go
down a sink? • For Yes response of either told by supervisor or look up tradewaste guidelines
through the procedures
4.2.2 What is the process for disposal of liquid waste that is not acceptable to sewer? • For yes response of one waste bottle for each separate process, correctly
labelled
4.2.3 What is the process for disposal of solid waste? • For Yes response of seal in appropriate container and label before return to
Chemical Store
4.2.4 How is chemical waste collection requested? • For Yes response of using Chemical Store online system to order waste

Green Labs Pilot Program Report Page 23
4.2 Chemical Management Yes No Partially or N/A
Comments
disposal bottle 4.2.5 Are chemicals only ordered on an as needs basis?
• (e.g. order frequently of small amounts rather than occasionally and large amounts)
4.2.6 Are chemicals shared with other researchers/groups within the lab? • (chemicals shared between researchers rather than many bottles of the same
chemicals stored in the lab.)
4.2.7 Are chemicals shared with other labs when only a little is needed or for a one off use? • (Researchers ask neighbouring labs to share chemicals before ordering large
amounts of chemicals from the Chemical Stores)
4.2.8 Are Green Chemistry alternatives investigated when setting up experiments?
4.2.9 Is the minimal number of experiments or micro-scale experiments used where possible?
4.2.10 Is the minimum amount of water to dilute chemical in bottles used then the rest of the water put down the sink?
4.2.11 Are empty chemical bottles returned to the Chemical Store for use as waste bottles?
4.2.12 Do you know where the spill equipment is located? GL Rep interview 4.2.13 Is a chemical tracking system used for the labs or will
be installed? • N/A if system has been considered but too difficult to implement at this stage.
4.2.14 Are excess and waste chemicals disposed of after research is completed or students/staff leave the area? • For Yes response is there a system in place – sight documentation if possible.
4.2.15 Are batteries recycled? Is there a designated collection spot and do all researchers know about it?
Walk through survey 4.2.16 Are waste bottles labelled correctly? 4.2.17 Is appropriate spill equipment available?
Green Labs Pilot Program Report Page 24
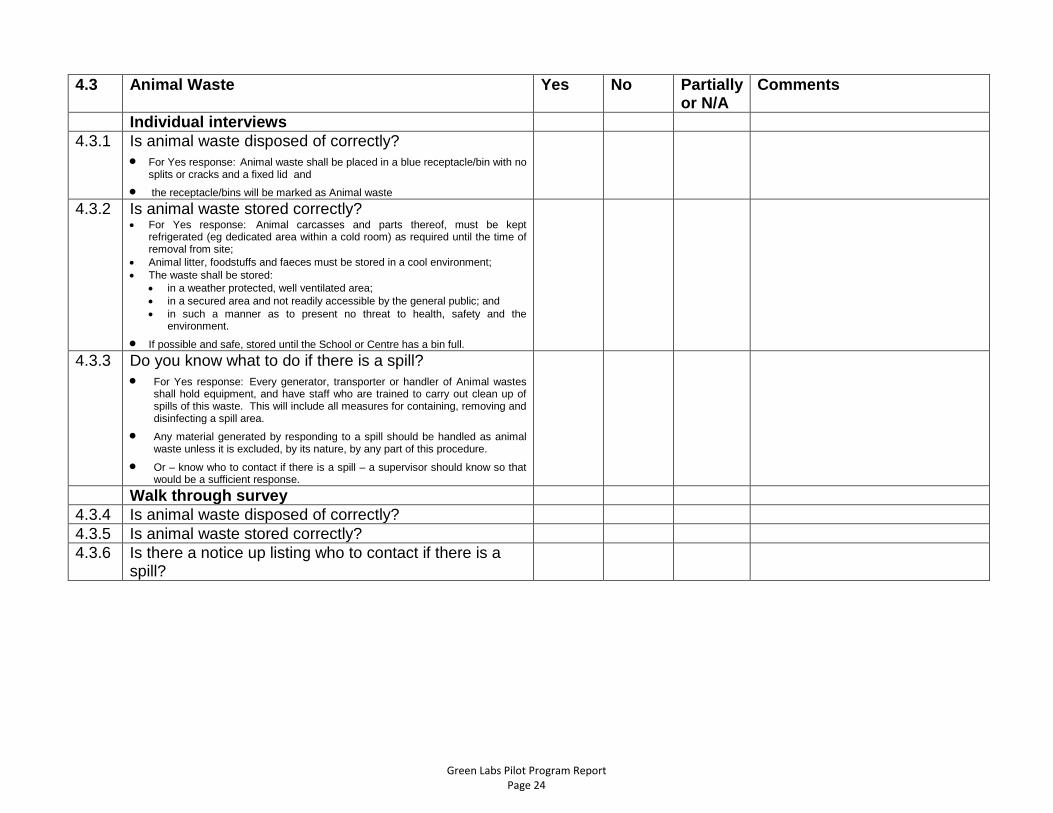
4.3 Animal Waste Yes No Partially or N/A
Comments
Individual interviews 4.3.1 Is animal waste disposed of correctly?
• For Yes response: Animal waste shall be placed in a blue receptacle/bin with no splits or cracks and a fixed lid and
• the receptacle/bins will be marked as Animal waste
4.3.2 Is animal waste stored correctly? • For Yes response: Animal carcasses and parts thereof, must be kept
refrigerated (eg dedicated area within a cold room) as required until the time of removal from site;
• Animal litter, foodstuffs and faeces must be stored in a cool environment; • The waste shall be stored:
• in a weather protected, well ventilated area; • in a secured area and not readily accessible by the general public; and • in such a manner as to present no threat to health, safety and the
environment.
• If possible and safe, stored until the School or Centre has a bin full.
4.3.3 Do you know what to do if there is a spill? • For Yes response: Every generator, transporter or handler of Animal wastes
shall hold equipment, and have staff who are trained to carry out clean up of spills of this waste. This will include all measures for containing, removing and disinfecting a spill area.
• Any material generated by responding to a spill should be handled as animal waste unless it is excluded, by its nature, by any part of this procedure.
• Or – know who to contact if there is a spill – a supervisor should know so that would be a sufficient response.
Walk through survey 4.3.4 Is animal waste disposed of correctly? 4.3.5 Is animal waste stored correctly? 4.3.6 Is there a notice up listing who to contact if there is a
spill?

Green Labs Pilot Program Report Page 25
4.4 Clinical Waste Yes No Partially or N/A
Comments
Individual interviews 4.4.1 What is clinical waste? What is included in clinical
waste? • For Yes response must include reference to perceived clinical waste
4.4.2 How is clinical waste disposed of? • For Yes response must include placing in approved yellow liners and bins
marked with ADG Infectious waste symbol
4.4.3 How are sharps correctly dispose of? • For Yes response must include reference to sharps containers.
4.4.4 How are gloves, masks and pipettes correctly disposed of? • For Yes, reference to perceived clinical waste
4.4.5 Do you know what to do if there is a spill? Interview GL Rep 4.4.6 What happens when the bin gets full and how full does
it get before action is taken? • For Yes response must refer to bin approaching 2/3 full or 6kg of waste before
placing it in 240L bin. If someone else empties bins for the lab then that is ok
4.4.7 When are the 240L bins put out on the kerb and what is the process? • Yes if someone else does it. Try to interview the person who puts the bins out
if available) (Response of when it is full or if perishable items need to be disposed of. Reference to locking the bins
4.4.8 Where are the bins stored? • for Yes, must be stored out of the public access
Walk through survey 4.4.9 Are the spill kits available? 4.4.10 Bins are not over full? 4.4.11 Is all perceived clinical waste in Clinical Waste bins?
Green Labs Pilot Program Report Page 26
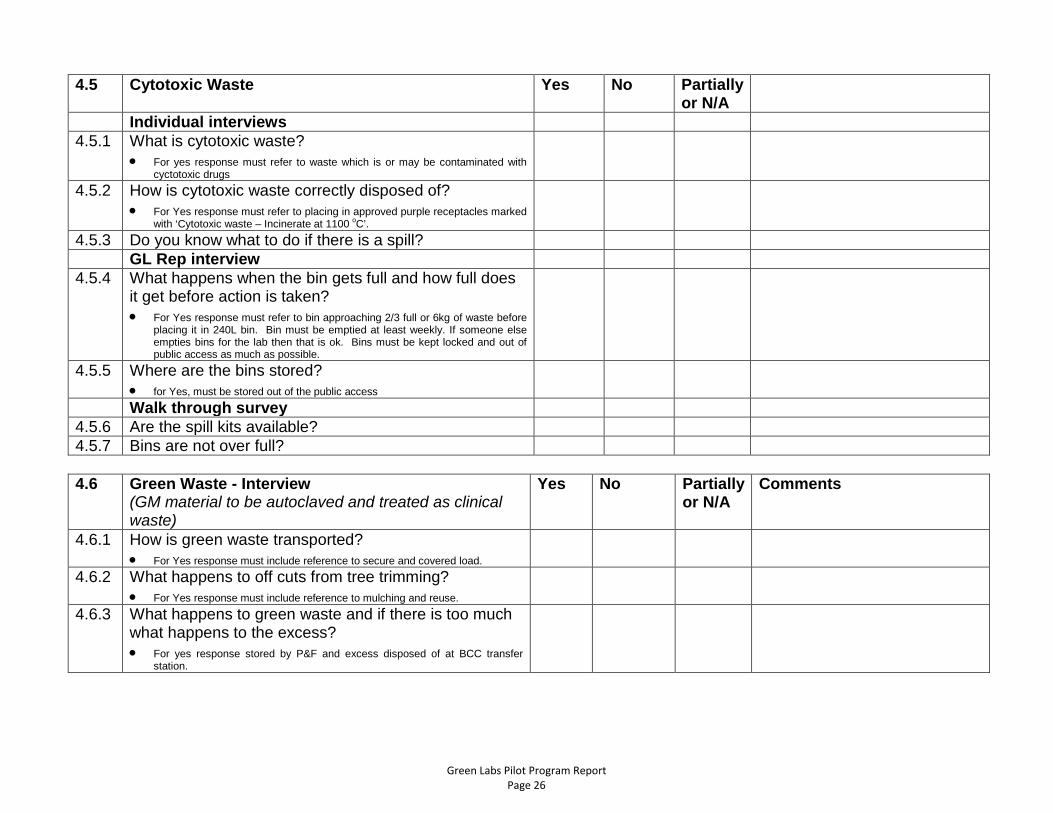
4.5 Cytotoxic Waste Yes No Partially or N/A
Individual interviews 4.5.1 What is cytotoxic waste?
• For yes response must refer to waste which is or may be contaminated with cyctotoxic drugs
4.5.2 How is cytotoxic waste correctly disposed of? • For Yes response must refer to placing in approved purple receptacles marked
with ‘Cytotoxic waste – Incinerate at 1100 oC’.
4.5.3 Do you know what to do if there is a spill? GL Rep interview 4.5.4 What happens when the bin gets full and how full does
it get before action is taken? • For Yes response must refer to bin approaching 2/3 full or 6kg of waste before
placing it in 240L bin. Bin must be emptied at least weekly. If someone else empties bins for the lab then that is ok. Bins must be kept locked and out of public access as much as possible.
4.5.5 Where are the bins stored? • for Yes, must be stored out of the public access
Walk through survey 4.5.6 Are the spill kits available? 4.5.7 Bins are not over full? 4.6 Green Waste - Interview
(GM material to be autoclaved and treated as clinical waste)
Yes No Partially or N/A
Comments
4.6.1 How is green waste transported? • For Yes response must include reference to secure and covered load.
4.6.2 What happens to off cuts from tree trimming? • For Yes response must include reference to mulching and reuse.
4.6.3 What happens to green waste and if there is too much what happens to the excess? • For yes response stored by P&F and excess disposed of at BCC transfer
station.
Green Labs Pilot Program Report Page 27
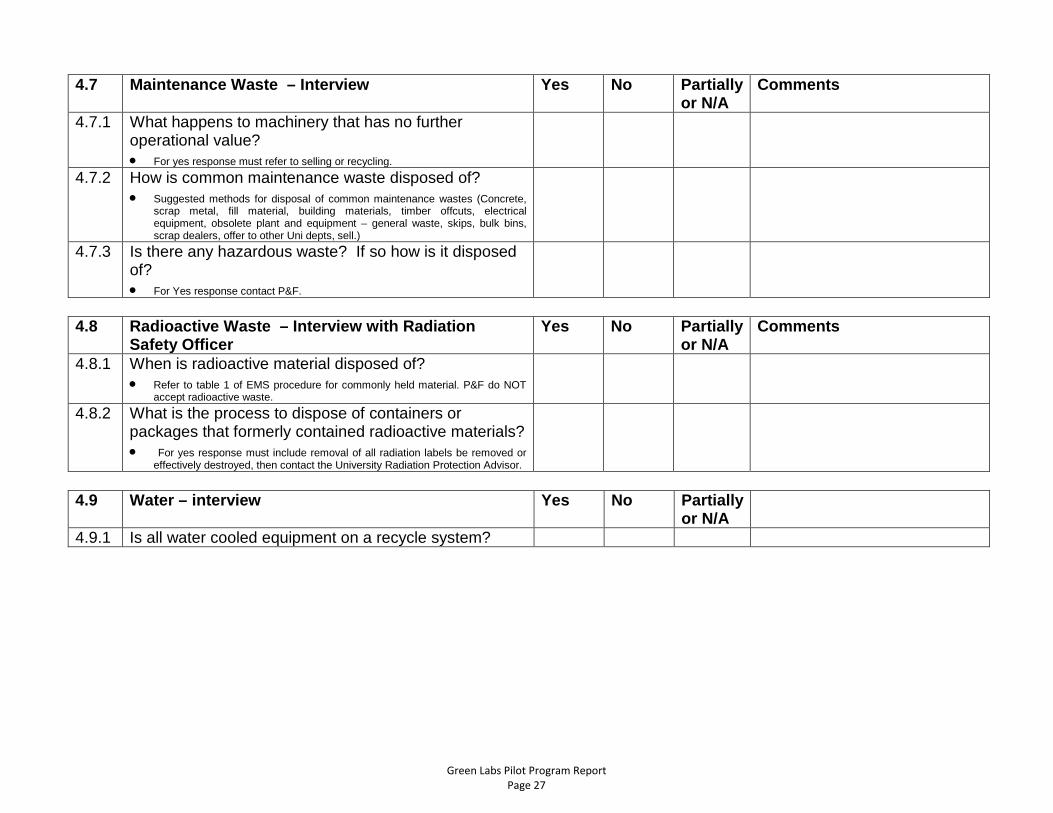
4.7 Maintenance Waste – Interview Yes No Partially or N/A
Comments
4.7.1 What happens to machinery that has no further operational value? • For yes response must refer to selling or recycling.
4.7.2 How is common maintenance waste disposed of? • Suggested methods for disposal of common maintenance wastes (Concrete,
scrap metal, fill material, building materials, timber offcuts, electrical equipment, obsolete plant and equipment – general waste, skips, bulk bins, scrap dealers, offer to other Uni depts, sell.)
4.7.3 Is there any hazardous waste? If so how is it disposed of? • For Yes response contact P&F.
4.8 Radioactive Waste – Interview with Radiation
Safety Officer Yes No Partially
or N/A Comments
4.8.1 When is radioactive material disposed of? • Refer to table 1 of EMS procedure for commonly held material. P&F do NOT
accept radioactive waste.
4.8.2 What is the process to dispose of containers or packages that formerly contained radioactive materials? • For yes response must include removal of all radiation labels be removed or
effectively destroyed, then contact the University Radiation Protection Advisor.
4.9 Water – interview Yes No Partially
or N/A
4.9.1 Is all water cooled equipment on a recycle system?

Green Labs Pilot Program Report Page 28
Appendix 2: Green Labs Worksheet

Green Labs Pilot Program Report Page 29

Green Labs Pilot Program Report Page 30

Green Labs Pilot Program Report Page 31

Green Labs Pilot Program Report Page 32

Green Labs Pilot Program Report Page 33

Green Labs Pilot Program Report Page 34
Appendix 3: Green Labs Audit Results Summaries
Green Labs Audit Results Summary Chemistry Lab – Centre for Nutrition and Food Sciences
May 2012
Executive Summary of Results An overall rating of 86% was achieved, which is above average in relation to baseline assessments undertaken in other UQ laboratory areas for the pilot program (82%). A summary graph of the audit results is displayed below. Please refer to the Full Audit Report for an explanation of the results.
Figure 1: Green Lab Rating Results for the Chemistry Lab-Centre for Nutrition and Food Science. Green colour: overall Green Labs Rating; red colour: ratings obtained for each section (specific, survey and general); blue: rating obtained for each section components.
Top 5 Recommendations Display appropriate environmental posters and stickers to encourage recycling and energy and water
conservation. Fix the chemical waste cupboard door. Include environmental training in laboratory introductions Increase awareness among lab members about environmental regulatory frameworks; including the
Environmental Protection Act 1994, UQ’s Environmental Policy and Environmental Management System Manual and Procedures.
Consider UQ’s sustainable purchasing guidelines when purchasing equipment and materials. More information is available at http://www.uq.edu.au/sustainability/purchasing.

Green Labs Pilot Program Report Page 35
Green Labs Audit Results Summary Hydrometallurgy Lab
April 2012
Executive Summary of Results An overall rating of 92% was achieved, which is above average in relation to baseline assessments undertaken in other UQ laboratory areas for the pilot program (82%). A summary graph of the audit results is displayed below. Please refer to the Full Audit Report for an explanation of the results.
Figure 1: Green Lab Rating Results for the Hydrometallurgy Lab. Green colour: overall Green Labs Rating; red colour: ratings obtained for each section (specific, survey and general); blue: rating obtained for each section components.
Top 3 Recommendations Display appropriate environmental posters and stickers to encourage recycling and energy and water
conservation. Introduce more regular environmental training including annual Environmental Management System
training. Increase awareness among lab members about environmental regulatory frameworks; including the
Environmental Protection Act 1994, UQ’s Environmental Policy and Environmental Management System Manual and Procedures.

Green Labs Pilot Program Report Page 36
Green Labs Audit Results Summary Bartlett Lab – Queensland Brain Institute
2012
Executive Summary of Results An overall rating of 87% was achieved, which is above average in relation to baseline assessments undertaken in other UQ laboratory areas for the pilot program (82%). A summary graph of the audit results is displayed below. Please refer to the Full Audit Report for an explanation of the results.
Figure 1: Green Lab Rating Results for the Bartlett Lab-QBI. Green colour: overall Green Labs Rating; red colour: ratings obtained for each section (specific, survey and general); blue: rating obtained for each section components.
Top 5 Recommendations Use “unattended experiment” labels to enable identification of the individual responsible for the
experiment or sample. Introduce more regular environmental training including annual Environmental Management System
training. Consider UQ’s sustainable purchasing guidelines when purchasing equipment and materials. More
information is available at http://www.uq.edu.au/sustainability/purchasing. Change settings of lab computers to energy saving modes by setting the screensaver to “none” or “blank
screen” and screensaver power settings to “turn off monitor” after five minutes without use. Turn off equipment when not in use, whenever possible. This would include placing tags and increasing
awareness among lab members about which equipment can be turned off, which ones require warming up, and which ones require a special procedure.

Green Labs Pilot Program Report Page 37
Green Labs Audit Results Summary Cortical Development and Axon Guidance Lab – Queensland Brain Institute
2012
Executive Summary of Results An overall rating of 81% was achieved, which is below average in relation to baseline assessments undertaken in other UQ laboratory areas for the pilot program (82%). A summary graph of the audit results is displayed below. Please refer to the Full Audit Report for an explanation of the results.
Figure 1: Green Lab Rating Results for the Cortical Development and Axon Guidance Lab – QBI. Green colour: overall Green Labs Rating; red colour: ratings obtained for each section (specific, survey and general); blue: rating obtained for each section components.
Top 5 Recommendations
Display appropriate environmental posters and stickers to encourage recycling and energy and water conservation.
Introduce more regular environmental training including annual Environmental Management System training.
Change settings of lab computers to energy saving modes by setting the screensaver to “none” or “blank screen” and screensaver power settings to “turn off monitor” after five minutes without use.
Turn off equipment when not in use, whenever possible. This would include placing tags and increasing awareness among lab members about which equipment can be turned off, which ones require warming up, and which ones require a special procedure.
Improve fume cupboard management by keeping the sash as lower as possible during operation and turning off lights and fume cupboards (where possible) when not in use.

Green Labs Pilot Program Report Page 38
Green Labs Audit Results Summary Lakhani Lab – UQCCR
2012
Executive Summary of Results An overall rating of 81% was achieved, which is slightly below average in relation to baseline assessments undertaken in other UQ laboratory areas for the pilot program (82%). A summary graph of the audit results is displayed below. Please refer to the Full Audit Report for an explanation of the results.
Figure 1: Green Lab Rating Results for the Lakhani Lab – UQCCR. Green colour: overall Green Labs Rating; red colour: ratings obtained for each section (specific, survey and general); blue: rating obtained for each section components.
Top 5 Recommendations Use “unattended experiment” labels to enable identification of the individual responsible for the
experiment or sample. Turn off equipment when not in use, whenever possible. This would include placing tags and increasing
awareness among lab members about which equipment can be turned off, which ones require warming up, and which ones require a special procedure.
Evaluate systems for recycling of packaging materials (cupboards, plastics, glass, polystyrene, etc.). Include environmental training in laboratory inductions. Consider UQ’s sustainable purchasing guidelines when purchasing equipment and materials. More
information is available at http://www.uq.edu.au/sustainability/purchasing.

Green Labs Pilot Program Report Page 39
Green Labs Audit Results Summary Neuroimmunology Lab – UQCCR
2012
Executive Summary of Results An overall rating of 72% was achieved, which is below average compared to baseline assessments undertaken in other UQ laboratory areas for the pilot program (82%). A summary graph of the audit results is displayed below. Please refer to the Full Audit Report for an explanation of the results.
Figure 1: Green Lab Rating Results for the Neuroimmunology Lab. Green colour: overall Green Labs Rating; red colour: ratings obtained for each section (specific, survey and general); blue: rating obtained for each section components.
Top 5 Recommendations Use “unattended experiment” labels to enable identification of the individual responsible for the
experiment or sample. Evaluate systems for recycling of packaging materials (cardboard, plastics, glass, polystyrene, etc.). Improve fume cupboard management by keeping the sash as lower as possible during operation and turning
off lights and fume cupboards (where possible) when not in use. Increase awareness among lab members about environmental regulatory frameworks; including the
Environmental Protection Act 1994, UQ’s Environmental Policy and Environmental Management System Manual and Procedures.
Consider UQ’s sustainable purchasing guidelines when purchasing equipment and materials. More information is available at http://www.uq.edu.au/sustainability/purchasing.

Green Labs Pilot Program Report Page 40
Green Labs Audit Results Summary Plant-Microbe Interactions and Algae Biotechnology Labs
April 2012
Executive Summary of Results An overall rating of 68% was achieved, which is below average in relation to baseline assessments undertaken in other UQ laboratory areas for the pilot program (82%). A summary graph of the audit results is displayed below. Please refer to the Full Audit Report for an explanation of the results.
Figure 1: Green Lab Rating Results for the Plant-Microbe Interactions and Algae Biotechnology Labs. Green colour: overall Green Labs Rating; red colour: ratings obtained for each section (specific, survey and general); blue: rating obtained for each section components.
Top 5 Recommendations Change settings of lab computers to energy saving modes by setting the screensaver to “none” or “blank
screen” and screensaver power settings to “turn off monitor” after five minutes without use. Place appropriate labels on small tips containers on the benches to indicate that the contents are clinical
waste. Increase awareness among lab members about environmental regulatory frameworks; including the
Environmental Protection Act 1994, UQ’s Environmental Policy and Environmental Management System Manual and Procedures.
Include environmental training in laboratory inductions. Consider UQ’s sustainable purchasing guidelines when purchasing equipment and materials. More
information is available at http://www.uq.edu.au/sustainability/purchasing.

Green Labs Pilot Program Report Page 41
Green Labs Audit Results Summary Queensland Centre for Medical Genomics
2012
Executive Summary of Results An overall rating of 72% was achieved, which is a below average score in relation to baseline assessments undertaken in other UQ laboratory areas for the pilot program (82%). A summary graph of the audit results is displayed below. Please refer to the Full Audit Report for an explanation of the results.
Figure 1: Green Lab Rating Results for the Queensland Centre for Medical Genomics. Green colour: overall Green Labs Rating; red colour: ratings obtained for each section (specific, survey and general); blue: rating obtained for each section components.
Top 5 Recommendations Use “unattended experiment labels to enable identification of the individual response for the experiment or
sample. Change settings of lab computers to energy saving modes by setting the screensaver to “none” or “blank
screen” and screensaver power settings to “turn off monitor” after five minutes without use. Promote correct clinical waste handling procedures, including the appropriate procedures for handling
“perceived clinical waste”. Introduce more regular environmental training including annual Environmental Management System
training. Consider UQ’s sustainable purchasing guidelines when purchasing equipment or materials. More
information is available at http://www.uq.edu.au/sustainability/purchasing.

Green Labs Pilot Program Report Page 42
Green Labs Audit Results Summary Wallace Lab – Queensland Brain Institute
2012
Executive Summary of Results An overall rating of 89% was achieved, which is above average compared to baseline assessments undertaken in other UQ laboratory areas for the pilot program (82%). A summary graph of the audit results is displayed below. Please refer to the Full Audit Report for an explanation of the results.
Figure 1: Green Lab Rating Results for the Wallace Lab. Green colour: overall Green Labs Rating; red colour: ratings obtained for each section (specific, survey and general); blue: rating obtained for each section components.
Top 5 Recommendations Use “unattended experiment” labels to enable identification of the individual responsible for the
experiment or sample. Change settings of lab computers to energy saving modes by setting the screensaver to “none” or “blank
screen” and screensaver power settings to “turn off monitor” after five minutes without use. Promote correct clinical waste handling procedures, including the appropriate procedures for handing
“perceived clinical waste”. Introduce more regular environmental training including annual Environmental Management System
training. Consider UQ’s sustainable purchasing guidelines when purchasing equipment and materials. More
information is available at http://www.uq.edu.au/sustainability/purchasing.