Embed Size (px)
Citation preview
sustainability
Article
Green City Concept and a Method to Measure GreenCity Performance over Time Applied to Fifty CitiesGlobally: Influence of GDP, Population Size andEnergy Efficiency
Ogenis Brilhante 1,* and Jannes Klaas 2
1 Institute for Housing and Urban Development Studies, (IHS), Erasmus University Rotterdam, (EUR),3062 PA Rotterdam, The Netherlands
2 Institute for Housing and Urban Development Studies, (IHS) and Rotterdam School of Management,Erasmus University Rotterdam, 3062 PA Rotterdam, The Netherlands; [email protected]
* Correspondence: [email protected]
Received: 30 April 2018; Accepted: 12 June 2018; Published: 15 June 2018�����������������
Abstract: There are many concepts and methods trying to accommodate the growth of cities withoutimpairing sustainability. However, most are too complex, cannot measure green performance overtime and fail to deliver actionable advice to decision-makers. The Green City Concept (GCC) isone of the latest of these concepts. This paper introduces a Green City Conceptual Framework(IHS-GCCF) and a harmonized method to measure Global Green City Performance over time (GGCPI).The IHS-GCCF highlights the importance of energy as a steward of resource efficiency and greenperformance. IHS-GCCF and GGCPI can be used to measure green performance, to explain possiblefactors influencing the calculated green performances over time, set targets and track achievements.They are adaptable to individual city needs. By applying the method to fifty cities worldwide throughdesk research, the paper shows that a green city is also sustainable and liveable. It also shows thatGDP influences Green City Performances positively, population size influences it negatively andsanitation and air quality sectors influence green city performance the most. The paper addressesa range of gaps in the green city field. It consolidates prior research into one actionable conceptualframework and method.
Keywords: green city concept; framework; method; green performance over time; sustainability;liveability; GDP; population size; energy
1. Introduction
The 20th century was characterised by rapid and often uncontrolled urban growth leading tothe emergence of huge dispersed or decompacted cities unlike the more compact cities of the 19thcentury. Fast industrialisation, new technological inventions such as automobiles, and the availabilityof cheap land and inexpensive fossil fuels were some of the driving forces of this model of urbandevelopment [1] (pp. 243–266).
This dispersed urban model was heavily dependent on the automobile and the use of fossil fuels.An extensive build-up of transport and other infrastructures contributed to the deterioration of urbanenvironmental performance in many cities globally through increased city footprints and impermeablesurfaces; destruction of urban natural resources and green fields; reduced water quality and quantity;increased journey time, traffic congestion, and fuel consumption; and more [2,3].
The consequences of this car-dependent dispersed city prompted academics and urban managersto search for innovative ways to promote economic and urban growth with less environmental impact
Sustainability 2018, 10, 2031; doi:10.3390/su10062031 www.mdpi.com/journal/sustainability
Sustainability 2018, 10, 2031 2 of 23
and use of natural resources. Several reports, concepts, theories and methods addressing this issuewere and are being produced.
In the 1980s, the reports: “The Limits to Growth” introduced the idea of sustainable economicgrowth [4]; “Our Common Future” demonstrated it was possible to reconcile economic growth,environmental preservation and social development [5]; and the New Urbanism Movement advocatedways to limit dispersed urban expansion of cities by using more environmentally friendly urban designpractices such as walkable neighbourhoods, mixed land use and Transit Oriented Developments(TODs) [1] (pp. 243–266).
The theory of sustainability in the 1990s reconciled social equity, economic growth and environmentalpreservation with city development [6] (pp. 296–312), and opened the way for the development of otherconcepts such as sustainable city [7], green urbanism [1], liveable city [8–11], and compact city [12,13]among others, that are still current and are at the centre of the debate on the influence of urban forms,city designs, use of natural resources, energy and other issues linked to urban sustainability.
The incorporation of climate change issues into the international political agenda in the 2000s broughtenergy [14] and resource efficiency [15] to the centre of the discussion on sustainable development andcity sustainability. Discussions on urban forms including energy, resources efficiency and environmentalperformance became central elements in the search for new concepts and methods to define and measurecity sustainability. These latest developments led to the development of the term “green”.
“Green” means different things to different people. The term is nowadays widely used by privateand public organisations as a brand for sustainability and eco-friendliness. “Greening” is anotherterm associated to the term green. In this article “green” and “greening” are used synonymously forsustainability and related issues where energy and resource efficiency are central elements.
As a result of the increased attention given to energy, resource efficiency and urban form in relationto climate change, questions already formulated before such as “Are certain urban forms and citydesigns more sustainable than others in terms of pollution, environmental impact and energy use?”;“What strategies and actions can effectively contribute to make cities more sustainable (greener)?”;and, more recently, “How can we manage the current urban expansion process under the effectsof climate change, and at the same time make this process greener?” have regained importance.Although actively being studied up to now there is no critical consensus about the best answers tothese questions. Scholars [12,13,16–19] cited the compact city form as one that could strongly contributeto city sustainability, especially in relation to the impacts of the urban expansion process and the use ofenergy, resources efficiency, infrastructure and environmental performance related issues. The benefitsresulting from the application of this concept cited in the literature can be summarized as: shorterintra-urban travel distances, reduced automobile dependency, increased walking, cycling and use ofpublic transportation, reduced per capita cost of infrastructure provision, influence on the ways citiesgenerate and consume energy, and encouraging the increase of urban density and recycling of alreadyurbanised land.
The Green City Concept is one of the latest responses to the diverse efforts and research conductedto address the problems caused by the dispersed model of city development and to help cities tobecome more sustainable (greener), less dispersed and more liveable.
Many studies have attempted to define sustainable and green cities [8,20–22] and some havetried to develop concepts and translate these into methods and tools such as benchmarks to measureenvironmental and/or sustainability performance [23–31]. Others have proposed reference guides andframeworks to help prioritize problems and propose city level actions to improve sustainability andenvironmental performance by using and analysing indicators and policy instruments [28,32,33].
In general, the various definitions and some of the concepts proposed for green cities addressissues related to the three pillars of sustainability theory and a variety of other issues such as health,greenery, resilience and equity. Environment related issues are by far the most often presented ingreen city definitions, concepts and methods [23–27]. The EBRD [26], for example, defines a greencity as one that is characterized predominantly by its environmental performance, with the intention
Sustainability 2018, 10, 2031 3 of 23
of maximising social and economic benefits. This definition is used to prepare a methodology forbenchmarking and prioritisation using seventy core indicators and several elective indicators chosenaccording to a Green City Pressure–State–Response (PSR) framework. The Economist IntelligenceUnit [20] does not propose a definition of a green city but has developed a benchmark method tomeasure environmental performance of cities per continent using a group of thirty qualitative andquantitative indicators focused mostly on infrastructure and environmental issues. Zoeteman et al. [25],uses 87 indicators to investigate (causes of) differences in sustainability performance between EU citiesusing the three sustainability domains of economy, ecology and socio-cultural aspects. On the otherhand, the ADB Green City Development Toolkit [32] and Solutions for Liveable Cities [33] are referenceguides for ADB staff, consultants, and city leaders introducing key concepts of green city developmentand outlining a three-step city assessment framework together with a summary of existing tools andresources for green, liveable and sustainable development.
The existence of a broad range of environmental and other urban related issues within a cityhas resulted in the development of many green city definitions and approaches as briefly mentionedabove which has created difficulties for its acceptability and adoption. While some focus only on theenvironmental aspects, others include socio-economic, environmental and infrastructure elementsand others include policies, resilience, ICT technologies and plans such as disaster risk plans, etc.The indexes proposed to measure environmental and/or sustainability performance in general usea large number of indicators which makes them difficult for decisions makers to use and some mixqualitative with quantitative indicators. Many indicators proposed in some of these methods are notregularly tracked by many cities, especially those of developing countries. This lack of uniformity ofconcepts and approaches to green cities has resulted in a great heterogeneity of methods and indicatorsfor the measurement of environmental and sustainability performance.
The above brief overview of the literature has shown that very different approaches and methodshave being developed in relation to green city issues resulting in difficulty in forging a consensus onhow and which methods and measures cities should be applied to become greener. In addition, there arestill many gaps found in this research that need to be studied, such as the lack of a definition of greencity rooted in a simple green city conceptual framework, the development of index methods containinga short number of indicators to measure environmental performance rooted in a conceptual framework,and simple methods to track the evolution and progress of cities’ environmental performance overtime. The review of the literature also showed that there is a need for more in-depth research on howpopulation size and GDP influence environmental performance, especially of cities of developingcountries with large populations [26,34,35]. No study proposing a method to measure green cityperformance was found in this review.
Scope of the Paper, Methodological Issues and Objectives
In 2013, due to the growing interest in the subject of green cities, the Infrastructure Group (Todaycalled the Green City and Infrastructure Group.) at the Institute for Housing and Urban Studies (IHS(EUR)) conducted an in-depth literature review on green city issues to gather more knowledge on thisfield and explore future academic and practical applications. The result of this work led us to use ourown knowledge and expertise on urban management, environment, infrastructure, climate change,housing and energy to develop an initial simple green city concept and a tool to be incorporated inour academic activities and to complement our advisory work on supporting cities to become greener.The green city concept was developed by incorporating key findings of the literature, such as elementsof the three pillars of the theory of sustainability, and of other concepts including issues such as energy,infrastructure, land planning, greenery and compactness mentioned in the literature review above.
The green city concept is a simple umbrella framework attempting to facilitate the understandingof what a green city is. The conceptual framework called IHS-GCCF is composed of four entry points,seven thematic areas and several promoters. Energy efficiency is the main entry point and also adistinctive characteristic of this concept related to the existing green city concepts. It is assumed in
Sustainability 2018, 10, 2031 4 of 23
this concept that the overall promotion of energy efficiency in all cities’ activities will help to stewardthe improvement of city resource efficiency which will ultimately contribute to improving the city’senvironmental performance, sustainability and liveability. Within the IHS Green City and InfrastructureGroup, it is claimed that a green city, as defined in this framework, is also sustainable and liveable.
The tool called the IHS Green City Index (IHS-GCI) is rooted in the IHS-GCCF and was developedby adapting to our needs the approach proposed in [23]. It allows us to measure and compare theEP of cities on the same continent over time and contains a small number of quantitative indicatorsrepresenting key elements of the thematic areas of a developed green city concept.
After being implemented and applied as academic exercises to more than 20 cities from fivecontinents in our Master’s and the Green City for Eco-efficiency Executive Courses, we decided, at theend of 2016, to conduct another literature review on the green city to incorporate some valuablecomments received from the evaluations of our programmes, some new developments in the fields ofgreen cities, energy, liveability and sustainability. This would allow us to re-develop the IHS-GreenCity Index (IHS-GCI) and use the experience gained with the application of the IHS-GCI tool to createa new tool called IHS Global Green City Performance Index (IHS-GGCPI) which is able to measuregreen city performance over time globally. In this article, the IHS Global Green City Performance Index(IHS-GGCPI) is sometimes referred to as index method, index or just method and fills an importantgap in the literature which is the absence of a tool to measure green city performance.
In this article, green city performance (GCP) is also called green performance (GP) and is definedas the sum of the environmental and the socio-economic performances. This definition follows theapproach used to build our green city concept framework which incorporated key elements of thepillars of the theory of sustainability and is supported by the fact that some authors [22,26,32] alsoinclude the sustainability domains in their own definitions of green cities.
The (IHS-GGCPI) index is rooted in the IHS-GCCF and was developed by adapting to our needsthe approach proposed in [20] and the proposed definition of GP. The index allows us to measuregreen performance over time but this article only provides a description of how the method can beused to measure GP over time. The GPs shown in this article as a result of the application of the indexrefer to data collected in the period 2013–2016, a single snapshot which can be used as a base line tocalculate the GP for future periods.
The objectives of this article were formulated taking into account some of the literature gapspreviously mentioned in this article and are divided into three parts: introduction of the re-developedIHS Green City Conceptual Framework and the IHS Global Green City Performance Index method(IHS-GGCPI; application of the new index method to measure the Green City Performance (GCP)of fifty cities globally and to study the influence of the population size, GDP, energy and key urbansectors in these GCPs; to verify the claim that a green city as defined in our green city conceptualframework is also a sustainable and liveable city.
2. Materials and Methods
The research adopted a deductive approach, building on the state of the art literature on greencity and the authors’ knowledge and experience with the environment, infrastructure, sustainabilityand green city. One key finding in the literature leading to the development of the IHS-GCCF wasthe presence of some elements of the three pillars of the theory of sustainability in several green citydefinitions [1,6,7,26]. In addition, it was found that concepts such as compact cities, greenery, energyefficiency, renewable energy, greenery and green growth [8–19] have grown in importance in recentyears. The inclusion of elements of the three pillars of sustainability and other issues mentioned aboveformed the basis for the development of the IHS-GCF and of the IHS-GGCPI. The approach used bythe Economist Intelligence Unit [23] to calculate the environmental performance of cities was adaptedto our needs to develop the IHS-GGCPI.
A desk study strategy was used for the revision of the green city concept, the redevelopment ofthe index and to answer the other objectives of the paper.
Sustainability 2018, 10, 2031 5 of 23
2.1. Development of the IHS-GGCPI Method: Steps and Procedures
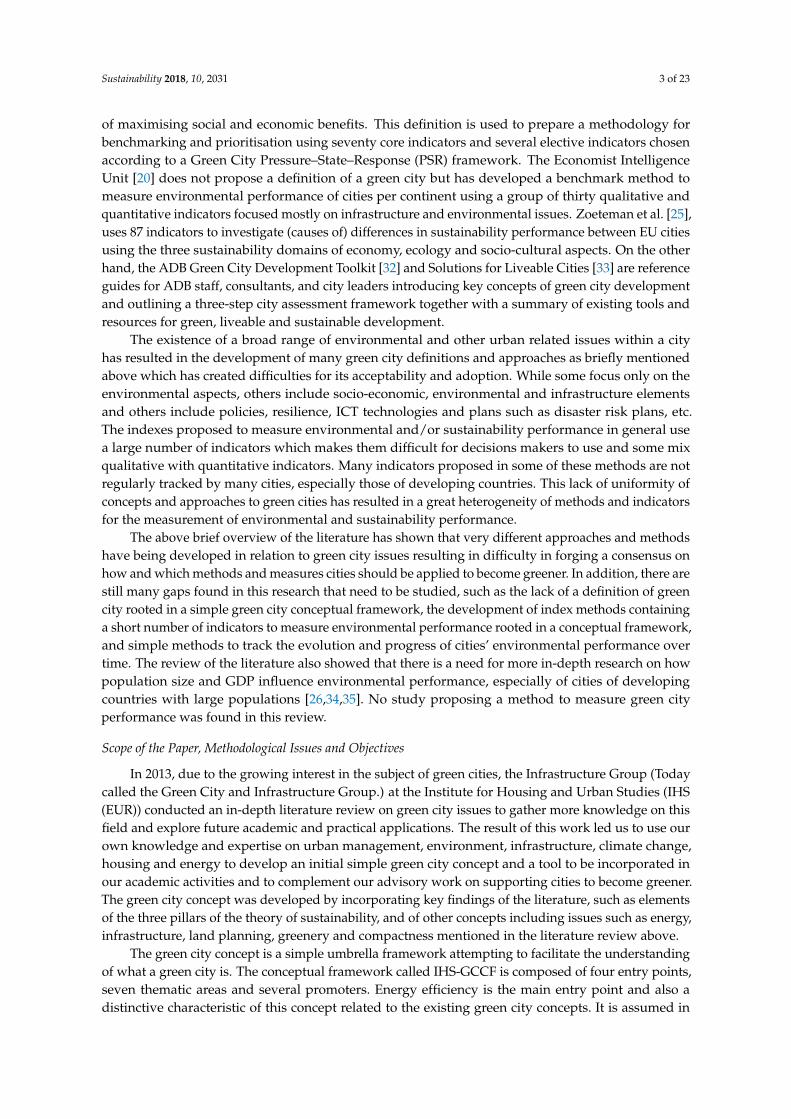
The re-develop the IHS-Green City Conceptual Framework (IHS GCCF) displayed in Figure 1 theIHS-GGCPI method index was enhanced by using the key findings in the literature on green cities aswell as using the authors’ own experience with green issues.
Sustainability 2018, 10, x FOR PEER REVIEW 5 of 23
2.1. Development of the IHS-GGCPI Method: Steps and Procedures
The re-develop the IHS-Green City Conceptual Framework (IHS GCCF) displayed in Figure 1 the IHS-GGCPI method index was enhanced by using the key findings in the literature on green cities as well as using the authors’ own experience with green issues.
Figure 1. IHS-Green City Conceptual Framework (IHS-GCCF).
The steps and the procedures adopted to develop the IHS-GGCPI method are described below. They are slight adaptation of the procedures used to create the previous IHS-GCI:
Step 1: Selection of indicator for the IHS-GCGPI and assigning weights to the indicators
The re-developed IHS green city conceptual framework (Figure 1, Item 3.1 (results)) was used as the base to choose the indicators to compose the new method. These indicators were selected taking into account key aspects of the green conceptual framework and the following criteria: the indicators should represent elements of the green city concept shown in Figure 1. The index should contain a maximum of 30 quantitative indicators representing aspects of the three pillars of sustainability (social, economic and environment) and linked to the elements of the newly re-developed IHS-GCCF. The selected indicators needed to be regularly monitored in cities globally and the data to be collected for these indicators should be published in any official local, national or international institution during the period 2013–2016.
2.1.1. Initial Selection of the Indicators and Pilot Test
Using the above criteria, an initial set of 32 indicators were selected and pilot tested on ten cities (two per continent). These indicators were tested to assess the availability of data, if they were regularly tracked and if the definition used matched the definition we have adopted. The criteria used to select the ten cities for the pilot test were: cities with high economic importance and high income for the country, well recognised high environmental quality, with a large and medium population and finally cities that regularly use indicators to monitor and make available data on its socio-economic and environmental situation.
Figure 1. IHS-Green City Conceptual Framework (IHS-GCCF).
The steps and the procedures adopted to develop the IHS-GGCPI method are described below.They are slight adaptation of the procedures used to create the previous IHS-GCI:
Step 1: Selection of indicator for the IHS-GCGPI and assigning weights to the indicators
The re-developed IHS green city conceptual framework (Figure 1, Item 3.1 (results)) was used asthe base to choose the indicators to compose the new method. These indicators were selected takinginto account key aspects of the green conceptual framework and the following criteria: the indicatorsshould represent elements of the green city concept shown in Figure 1. The index should contain amaximum of 30 quantitative indicators representing aspects of the three pillars of sustainability (social,economic and environment) and linked to the elements of the newly re-developed IHS-GCCF. Theselected indicators needed to be regularly monitored in cities globally and the data to be collected forthese indicators should be published in any official local, national or international institution duringthe period 2013–2016.
2.1.1. Initial Selection of the Indicators and Pilot Test
Using the above criteria, an initial set of 32 indicators were selected and pilot tested on ten cities(two per continent). These indicators were tested to assess the availability of data, if they were regularlytracked and if the definition used matched the definition we have adopted. The criteria used to selectthe ten cities for the pilot test were: cities with high economic importance and high income for thecountry, well recognised high environmental quality, with a large and medium population and finallycities that regularly use indicators to monitor and make available data on its socio-economic andenvironmental situation.
Sustainability 2018, 10, 2031 6 of 23
The pilot test was conducted in two rounds of five cities: Johannesburg, Shanghai, Buenos Aires,Berlin and Mexico City; and Lagos, Delhi, New York, Sao Paulo and London. After each round,an assessment of the initial proposed list of indicators was conducted in relation to the defined criteria.
As a result of the first round, some indicators were dropped and definitions were adapted.The dropped indicators included the ones proposed to measure governance, the level of education,urban agriculture, water quality, energy intensity and CO2 equivalent per capita for electricityconsumption. The first four indicators were dropped because it was hard to find one single indicatorrepresenting these areas and a uniform description for the indicator. The other two were droppedbecause of the lack of regular data measurements and inconsistent definitions. The ICT indicatordefinition was changed from the number of mobile telephones in a city to internet penetrationregardless of the access method, and mass transport was redefined to include only heavy rail metro,subway systems and commuter rail systems for whose lengths records usually exist.
The assessment conducted in the ten cities included in the first and in the second rounds showedthat for three indicators, share of wastewater treated, share of solid wastes collected and populationliving in slums some rich cities have ceased to regularly track them. These cities however usually havelaws requiring them to comply with high standards in issues related to these indicators. Once theseindicators represent important aspects of our green city concept and are also important to measuregreen city performance of cities of developed and developing countries, the following assumptionswere made for the rich cites that have ceased to regularly track them: share of wastewater treatedhigher than 97%, solid waste collected higher than 95% and populations living in slums less than 0.3%.These numbers are within the range of the top score (5) of the IHS-GGCPI and means that cities withdata for these indicators, within these ranges, are among the top twenty percent cities with the highestGPs. Another reason to propose these numbers is the fact that in practice cities do not treat or collect100% of their wastewater or solid waste and some residual precarious residences still exist in thesecities. An explanation of the construction of the scoring system and the ranges is presented in Step 2.
2.1.2. Final Retained List of Indicators and Assigned Weights (Wav)
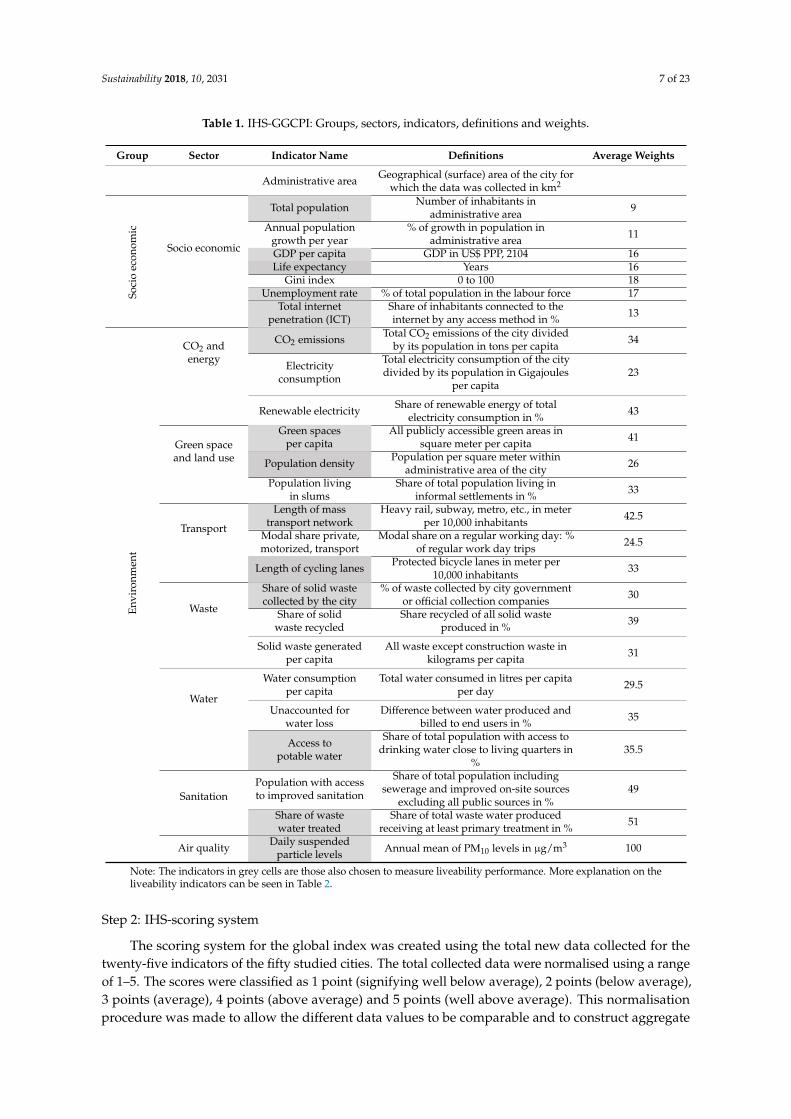
After the assessment of the pilot test, twenty-five indicators distributed across eight sectors anddivided into two groups were selected. Table 1 presents the final list of indicators per group and sectorswith respective units and definitions. The administrative area, although included in the list of theindicators, was not used to calculate the city green performance. Its role was to define the geographical(surface) area of the cities where the data were collected.
2.1.3. Assigning Weights to the Selected Indicators (Wav)
After selecting the final list of the indicators, a weight was assigned to each indicator. The procedureadopted was: distribution of the final list of the indicators divided into eight sectors (Table 1) to tenIHS academic staff (including the two authors) familiar with the objectives and with the IHS-GreenCity Conceptual Framework. Each staff member was asked to weigh the indicators to a maximum of100% for each sector according to their importance to the IHS-GCCF. After the weights were assignedthe average weight (Wav) was calculated and later used to calculate the green performance of eachindicator. The weights represent the importance that different stakeholders and experts give to theindicators of the tool in line with our conceptual framework; therefore, we decided to involve a groupof experts in the process of assigning weights to incorporate a greater diversity of importance, and notto restrict the importance attributed by the two authors. The weights shown in Table 1 are the averageof the weights given by the ten experts including the two authors.
Sustainability 2018, 10, 2031 7 of 23
Table 1. IHS-GGCPI: Groups, sectors, indicators, definitions and weights.
Group Sector Indicator Name Definitions Average Weights
Administrative area Geographical (surface) area of the city forwhich the data was collected in km2
Soci
oec
onom
ic
Socio economic
Total population Number of inhabitants inadministrative area 9
Annual populationgrowth per year
% of growth in population inadministrative area 11
GDP per capita GDP in US$ PPP, 2104 16Life expectancy Years 16
Gini index 0 to 100 18Unemployment rate % of total population in the labour force 17
Total internetpenetration (ICT)
Share of inhabitants connected to theinternet by any access method in % 13
Envi
ronm
ent
CO2 andenergy
CO2 emissions Total CO2 emissions of the city dividedby its population in tons per capita 34
Electricityconsumption
Total electricity consumption of the citydivided by its population in Gigajoules
per capita23
Renewable electricity Share of renewable energy of totalelectricity consumption in % 43
Green spaceand land use
Green spacesper capita
All publicly accessible green areas insquare meter per capita 41
Population density Population per square meter withinadministrative area of the city 26
Population livingin slums
Share of total population living ininformal settlements in % 33
Transport
Length of masstransport network
Heavy rail, subway, metro, etc., in meterper 10,000 inhabitants 42.5
Modal share private,motorized, transport
Modal share on a regular working day: %of regular work day trips 24.5
Length of cycling lanes Protected bicycle lanes in meter per10,000 inhabitants 33
Waste
Share of solid wastecollected by the city
% of waste collected by city governmentor official collection companies 30
Share of solidwaste recycled
Share recycled of all solid wasteproduced in % 39
Solid waste generatedper capita
All waste except construction waste inkilograms per capita 31
Water
Water consumptionper capita
Total water consumed in litres per capitaper day 29.5
Unaccounted forwater loss
Difference between water produced andbilled to end users in % 35
Access topotable water
Share of total population with access todrinking water close to living quarters in
%35.5
SanitationPopulation with accessto improved sanitation
Share of total population includingsewerage and improved on-site sources
excluding all public sources in %49
Share of wastewater treated
Share of total waste water producedreceiving at least primary treatment in % 51
Air quality Daily suspendedparticle levels Annual mean of PM10 levels in µg/m3 100
Note: The indicators in grey cells are those also chosen to measure liveability performance. More explanation on theliveability indicators can be seen in Table 2.
Step 2: IHS-scoring system
The scoring system for the global index was created using the total new data collected for thetwenty-five indicators of the fifty studied cities. The total collected data were normalised using a rangeof 1–5. The scores were classified as 1 point (signifying well below average), 2 points (below average),3 points (average), 4 points (above average) and 5 points (well above average). This normalisationprocedure was made to allow the different data values to be comparable and to construct aggregate
Sustainability 2018, 10, 2031 8 of 23
scores for each city. The score in the index represents the rank of the fifty cities examined on a quintilebased comparison. A city that has a score of 1 is in the bottom 20% of all cities, a score of 2 implies thecity is between the bottom 20% and 40% of all cities and so on. A city with a score of five, means that itis better than 80% of cities.
Step 3: Calculating and explaining Green City Performance over time
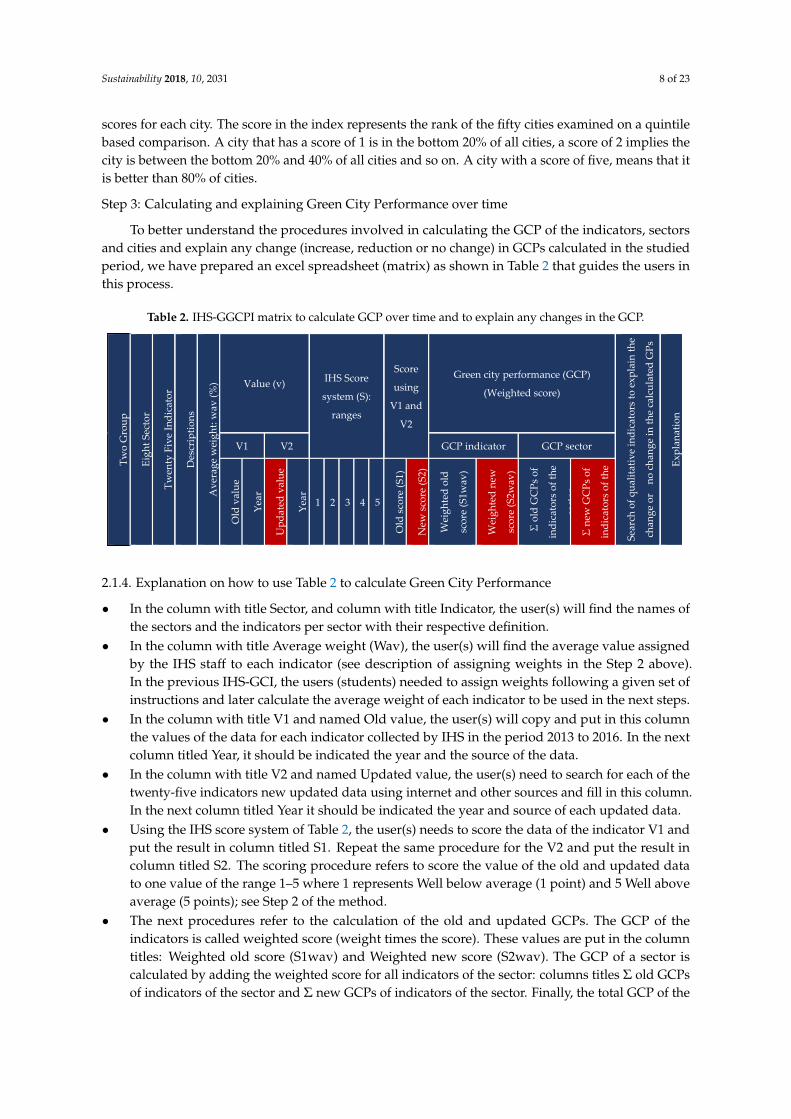
To better understand the procedures involved in calculating the GCP of the indicators, sectorsand cities and explain any change (increase, reduction or no change) in GCPs calculated in the studiedperiod, we have prepared an excel spreadsheet (matrix) as shown in Table 2 that guides the users inthis process.
Table 2. IHS-GGCPI matrix to calculate GCP over time and to explain any changes in the GCP.
Sustainability 2018, 10, x FOR PEER REVIEW 8 of 23
Step 2: IHS-scoring system
The scoring system for the global index was created using the total new data collected for the twenty-five indicators of the fifty studied cities. The total collected data were normalised using a range of 1–5. The scores were classified as 1 point (signifying well below average), 2 points (below average), 3 points (average), 4 points (above average) and 5 points (well above average). This normalisation procedure was made to allow the different data values to be comparable and to construct aggregate scores for each city. The score in the index represents the rank of the fifty cities examined on a quintile based comparison. A city that has a score of 1 is in the bottom 20% of all cities, a score of 2 implies the city is between the bottom 20% and 40% of all cities and so on. A city with a score of five, means that it is better than 80% of cities.
Step 3: Calculating and explaining Green City Performance over time
To better understand the procedures involved in calculating the GCP of the indicators, sectors and cities and explain any change (increase, reduction or no change) in GCPs calculated in the studied period, we have prepared an excel spreadsheet (matrix) as shown in Table 2 that guides the users in this process.
Table 2. IHS-GGCPI matrix to calculate GCP over time and to explain any changes in the GCP.
Two
Gro
up
Eigh
t Sec
tor
Twen
ty F
ive
Indi
cato
r
Des
crip
tions
Ave
rage
wei
ght:
wav
(%) Value (v) IHS Score
system (S):
ranges
Score
using
V1 and
V2
Green city performance (GCP)
(Weighted score)
Sear
ch o
f qua
litat
ive
indi
cato
rs to
exp
lain
the
chan
ge o
r n
o ch
ange
in th
e ca
lcul
ated
GPs
Expl
anat
ion
V1 V2 GCP indicator GCP sector
Old
val
ue
Year
Upd
ated
val
ue
Year
1 2 3 4 5
Old
sco
re (S
1)
New
sco
re (S
2)
Wei
ghte
d ol
d
scor
e (S
1wav
)
Wei
ghte
d ne
w
scor
e (S
2wav
)
Σ o
ld G
CPs
of
indi
cato
rs o
f the
sect
orΣ
new
GC
Ps o
f
indi
cato
rs o
f the
2.1.4. Explanation on how to use Table 2 to calculate Green City Performance
In the column with title Sector, and column with title Indicator, the user(s) will find the names of the sectors and the indicators per sector with their respective definition.
In the column with title Average weight (Wav), the user(s) will find the average value assigned by the IHS staff to each indicator (see description of assigning weights in the Step 2 above). In the previous IHS-GCI, the users (students) needed to assign weights following a given set of instructions and later calculate the average weight of each indicator to be used in the next steps.
In the column with title V1 and named Old value, the user(s) will copy and put in this column the values of the data for each indicator collected by IHS in the period 2013 to 2016. In the next column titled Year, it should be indicated the year and the source of the data.
In the column with title V2 and named Updated value, the user(s) need to search for each of the twenty-five indicators new updated data using internet and other sources and fill in this column. In the next column titled Year it should be indicated the year and source of each updated data.
Using the IHS score system of Table 2, the user(s) needs to score the data of the indicator V1 and put the result in column titled S1. Repeat the same procedure for the V2 and put the result in column titled S2. The scoring procedure refers to score the value of the old and updated data to one value of the range 1–5 where 1 represents Well below average (1 point) and 5 Well above average (5 points); see Step 2 of the method.
2.1.4. Explanation on how to use Table 2 to calculate Green City Performance
• In the column with title Sector, and column with title Indicator, the user(s) will find the names ofthe sectors and the indicators per sector with their respective definition.
• In the column with title Average weight (Wav), the user(s) will find the average value assignedby the IHS staff to each indicator (see description of assigning weights in the Step 2 above).In the previous IHS-GCI, the users (students) needed to assign weights following a given set ofinstructions and later calculate the average weight of each indicator to be used in the next steps.
• In the column with title V1 and named Old value, the user(s) will copy and put in this columnthe values of the data for each indicator collected by IHS in the period 2013 to 2016. In the nextcolumn titled Year, it should be indicated the year and the source of the data.
• In the column with title V2 and named Updated value, the user(s) need to search for each of thetwenty-five indicators new updated data using internet and other sources and fill in this column.In the next column titled Year it should be indicated the year and source of each updated data.
• Using the IHS score system of Table 2, the user(s) needs to score the data of the indicator V1 andput the result in column titled S1. Repeat the same procedure for the V2 and put the result incolumn titled S2. The scoring procedure refers to score the value of the old and updated datato one value of the range 1–5 where 1 represents Well below average (1 point) and 5 Well aboveaverage (5 points); see Step 2 of the method.
• The next procedures refer to the calculation of the old and updated GCPs. The GCP of theindicators is called weighted score (weight times the score). These values are put in the columntitles: Weighted old score (S1wav) and Weighted new score (S2wav). The GCP of a sector iscalculated by adding the weighted score for all indicators of the sector: columns titles Σ old GCPsof indicators of the sector and Σ new GCPs of indicators of the sector. Finally, the total GCP of the
Sustainability 2018, 10, 2031 9 of 23
city for the two studied periods are calculated as the Σ old GCPs of all sectors for the period 1and the Σ new GCPs of all sectors for period 2.
• Explaining any changes in GCP over time in columns titled Qualitative indicators and Explanation.In the first column, the user(s) need for the studied period and per sector search on the Internetand in other sources for qualitative indicators, such as policies, plans, programmes, projects,awareness campaigns, etc., related to any indicator(s) of the sector and implemented by thestudied city during the studied period. In the column titled Explanation, the user(s) shouldprovide a short discussion using the identified qualitative indicators and if necessary otherrelevant information, such as for example factors related to socio, economic, migration, politicalchanges, governance, etc., to try to explain any changes (increase, reduction or no change) in thecalculated GCP over time.
2.2. Assessing the Claim that a Green City Is also a Sustainable and Liveable City: Procedures
Two different procedures were developed to assess the above claim: one to measure the claimthat a green city is also a sustainable city and the other that a green city is also a liveable city.
Two approaches were developed to investigate if a green city as defined in our GCCF is also asustainable city: the first approach consisted in conducting an in-depth literature review of the conceptsof sustainability, compact city, sustainable city, liveable city and green city to build and revise thegreen city concept as presented and discussed in the Introduction; and the second approach consistedin calculating correlations between the total green city performance calculated using the GGCPImethod with the green performance of the socio-economic group and with the green performance ofthe environmental group of this method and, finally, calculating the correlation between the greenperformances of the socio-economic group with the green performance of the environmental group.
The procedures developed to investigate if a green city as defined in our GCCF is also a liveablecity used the calculation of correlations between the total green city performance measured using theGGCPI and the total liveability performance calculated using the new developed liveable performanceindex described below:
The approaches used to develop the IHS-Liveability performance index followed more less thesame approaches and the steps used to build up the IHS-GGCPI. These approaches and steps aredescribed below.
2.2.1. Selection of Liveability Indicators
Several articles have shown that the liveability concept is linked to the concept of sustainability [8,9].Other authors [10,11] emphasized that, although the liveability concept contains diverse elements ofthe concept of sustainability, it is particularly focused on special characteristics of the place wherepeople currently live, such as the quality of life, health, safety, accessibility and well-being of thelocal communities.
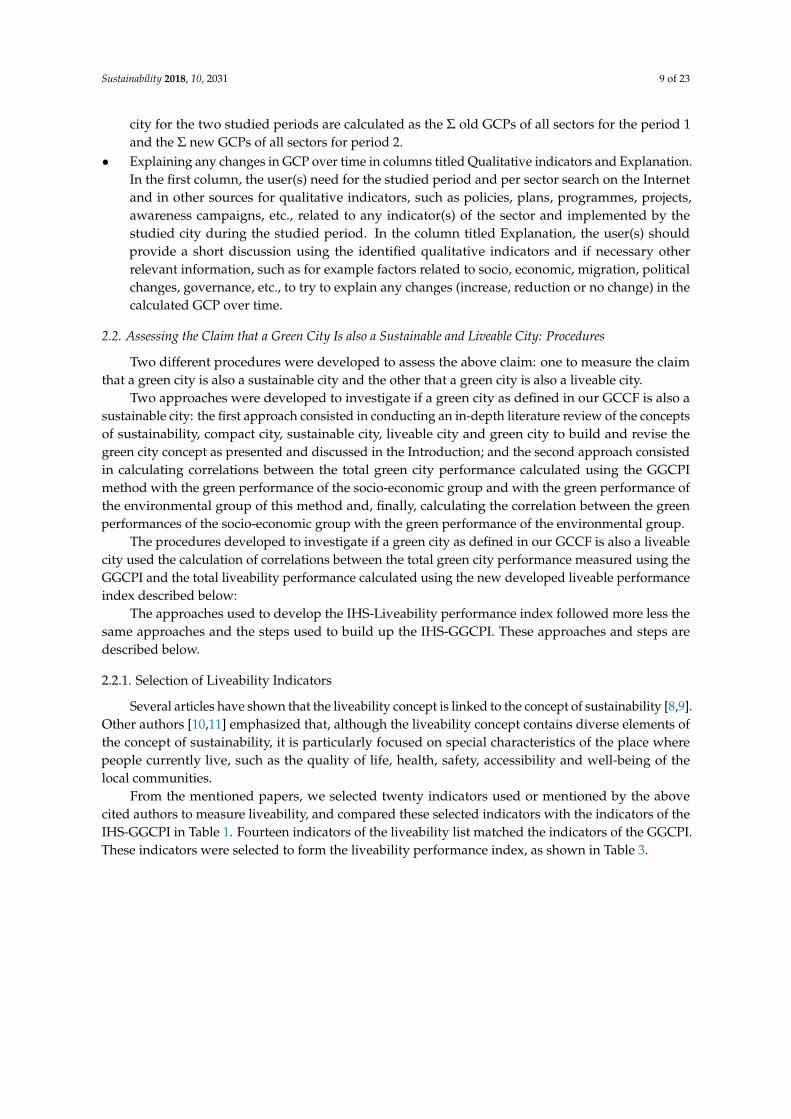
From the mentioned papers, we selected twenty indicators used or mentioned by the abovecited authors to measure liveability, and compared these selected indicators with the indicators of theIHS-GGCPI in Table 1. Fourteen indicators of the liveability list matched the indicators of the GGCPI.These indicators were selected to form the liveability performance index, as shown in Table 3.
Sustainability 2018, 10, 2031 10 of 23
Table 3. Indicators selected to form the liveability index.
Indicator Name Definition AverageWeight in %
Administrative areaTotal population Number of inhabitants in administrative area 1.5GDP per capita GDP in US$ PPP, 2104 9.5Life expectancy Years 10.0
Unemployment rate % of total population in the labour force 10.0
Total internet penetration (ICT) Share of inhabitants connected to the internet by any accessmethod in % 9.0
CO2 emissions Total CO2 emissions of the city divided by its population in tonsper capita 3.0
Green spaces per capita All publicly accessible green areas in square meter per capita 8.0
Population density Population per square meter within administrative area of thecity 5.0
Length of mass transport network Heavy rail, subway, metro, etc., in meter per 10,000 inhabitants 8.0Length of cycling lanes Protected bicycle lanes in meter per 10,000 inhabitants 7.5
Share of solid waste collected bythe city
% of waste collected by city government or officialcollection companies 7.0
Access to potable water Share of total population with access to drinking water close toliving quarters in % 7.0
Share of waste water treated Share of total waste water produced receiving at least primarytreatment in % 6.0
Daily suspended particle levels Annual mean of PM10 levels in µg/m3 8.5
2.2.2. Assigning Weights for the Liveability Indicators
The fourteen indicators selected to form the liveability index were distributed to five IHS stafffamiliar with the liveable city concept and asked to assign weights to these indicators to a maximumof 100%. The average weights were calculated as shown in Table 3 and used to calculate later theliveability performance.
2.2.3. Calculating the Liveability Performance
The same score systems developed for the IHS-GGCPI method were used to score the indicatorsselected to measure liveability. This approach is justified because the liveability indicators are alsoindicators of the IHS-GGCPI.
The liveability performance of each indicator is the weighted score of each indicator. The weightused in this calculation is the average weight assigned to each liveability indicator shown inTable 3. The total liveability performance of a city is the sum of the liveability performances ofthe fourteen indicators.
2.3. Data Analysis
The data collected for the fifty cities were processed using Microsoft Excel statistical analysis tool.A Pearson correlation was used to identify possible influence of key indicators and sectors on the greencity performances. The confidence interval was kept at 95% with a level of confidence of 0.05.
The ranking of Green City Performance was prepared by calculating the GCPs of the fifty citiesusing the new developed index method (IHS-GCCPI). These results were arranged in a descendentorder (top to down) green performance.
To help the analysis of the calculated green performances, three clusters of GCPs were formed:high, middle and low GCP. The approach used to form these clusters consisted of dividing the fiftycities into groups with approximately the same number of cities. The results of these clusters werefurther analysed in relation to the green performances of the sectors and key indicators such assanitation, population size, GDP per capita, energy, air quality and others.
Sustainability 2018, 10, 2031 11 of 23
3. Results and Discussion
3.1. Results
3.1.1. The Re-Developed IHS-GCCF and the IHS-GGCPI Method
The new re-redeveloped IHS-Green city conceptual framework is depicted in Figure 1, Item 2.1.It does not differ much regard to the previous one. The entry points, thematic areas and enablersremain the same but diverse new elements and aspects of the entry points and thematic areas wereupdated and tuned to better emphasize the central role of renewable energy and in special energyefficiency, seen in this concept as the steward forces contributing to improve city resources efficiencyand the overall city green performance. A short summary including the key elements and descriptionsused to characterize each entry point, thematic area and enablers is provided below. A description ofthe key aspects of each thematic area can be seen in Appendix A.
3.1.2. Entry Points
The entry points contain a set of core elements and aspects that we think should be considered andapplied to each thematic area and the city activities to align them with the overall goal of improvingthe GCP.
As can be seen in Figure 1, the promotion of renewable energy and energy efficiency in all cityactivities is the most important entry point of the concept. Energy is seen in this concept as the centralelement to promote and steer the achievement of resource efficiency which will contribute to theoverall improvement of the GCP. It is assumed in the concept that energy is linked with many elementsof the urbanisation process, such as transport, public services, infrastructure, density, water, land use,food, environmental quality, ICT, health, economic development, climate change, etc. Energy relatedactions in one or more of these elements will have spin off effects in many other urban activities andconsequently will influence city resource efficiency and the GCP [13–17].
The promotion of extensive use of greenery, second entry point, is linked to the idea of bringingback nature to cities. This advocates for an equal balance between green and built spaces through theextensive use of greenery practices; such as increasing the presence of urban green spaces and parks incombination with water resources whenever possible, green roofs, green facades, green linear corridors,etc. Greenery contributes to increase the quality of citizen’s lives; to improve health, aesthetics values,and city attractiveness; to reduce environmental pollution, climatic impacts, and heat islands; to createa local micro climate; to help mitigate GHGs (carbon sequestration); to contribute to reduce urbanfloods; and to adapt to climate change [12,13,36].
Planning for land compactness with mixed land use and social mix, the third entry point, promotesthe development of more compact cities using design elements such as compactness, density, greenery,Transit Oriented Development (TOD) practices, and mixed land use and social mix to improve thecity’s green performance. It is acknowledged that planning land compactness with the extensive use ofmixed land-use and social mix concepts will contribute to decrease the need to travel by creating moreworking opportunities near to the places where people live and increase diversity. The applicationof the social mix concept such as, constructing affordable apartments for different income levels inthe same building can contribute to reducing social segregation by allowing families with differentincomes to live together [13].
Green growth with equity principles, the fourth entry point, promotes the application of elementsof these two concepts in all city activities involved with local development. Key elements of theseconcepts are the promotion of low carbon technologies, increased energy efficiency practices andinnovative managerial and financial practices and instruments to steer the development of a localinclusive economy with low adverse environmental impacts and distribute the growth fairly [28].
Sustainability 2018, 10, 2031 12 of 23
3.1.3. Thematic Areas
The thematic areas presented in Figure 1 are those areas we think are important for defininga green city and measuring green performance. They do not represent the huge amount of issuesinvolved in the urbanisation and local development of cities; they are a simplification to facilitatethe understanding of what a green city is; they are flexible. Any city can add or subtract a thematicarea according to their local or regional features such as geography, economy, environment, culture,heritage, etc. In our academic work, the proposed thematic area “Greening the Urban AgriculturalSector” was sometimes replaced by some groups for Heritage. Finally, the choice of these thematicareas were also related to the facility of finding regularly monitored indicators representing elementsof these areas used o calculated GCP. A full description of the main elements and aspects of each areais presented in Appendix A: Thematic Areas Main Elements and Aspects.
3.1.4. Enablers
The enablers are key actors and instruments proposed to manage the city and to facilitate theintegration of the diverse actions proposed by each thematic area to improve the city environmentalperformance. Examples of these actors and instruments are private and public institutions, stakeholders,civic organisations, policies, plans, programmes, projects, regulations, governance, finance schemes,etc. Telecommunication and smart technologies (ICT) play a key role in developed the conceptualframework facilitating the implementation of diverse enablers and simplifying their use andcommunication among city managers, citizens and other stakeholders.
3.1.5. The IHS-GGCPI Method
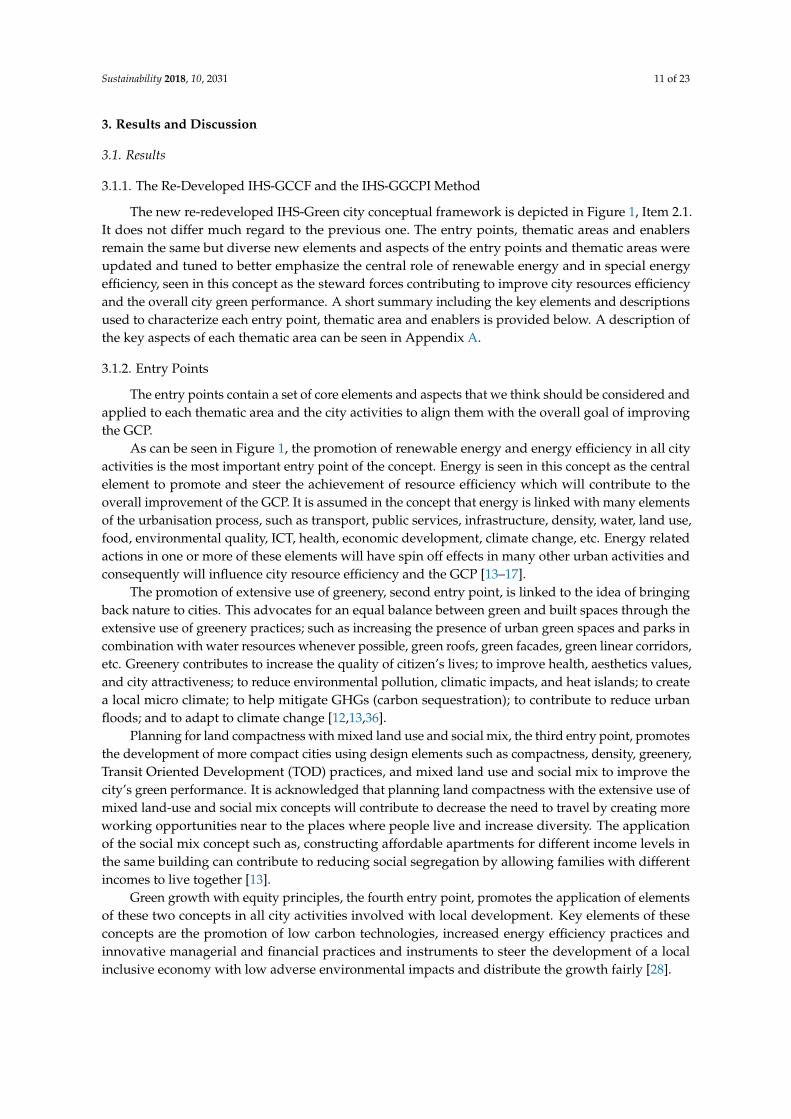
Table 4 shows the steps in using the IHS-GGCPI index method. Item 2.1 explains in detail howto use each of these steps to calculate green city performance over time and to explain the possiblechanges of the calculated GCP in the period under study.
The development of the index method was anchored in the IHS-Green City ConceptualFramework displayed in Figure 1, and is composed of twenty-five quantitative indicators distributedin two groups and eight sectors as shown in Table 1, Item 2.1.
Table 4. Main steps of the IHS-GGCPI method.
Sustainability 2018, 10, x FOR PEER REVIEW 12 of 23
3.1.3. Thematic Areas
The thematic areas presented in Figure 1 are those areas we think are important for defining a green city and measuring green performance. They do not represent the huge amount of issues involved in the urbanisation and local development of cities; they are a simplification to facilitate the understanding of what a green city is; they are flexible. Any city can add or subtract a thematic area according to their local or regional features such as geography, economy, environment, culture, heritage, etc. In our academic work, the proposed thematic area “Greening the Urban Agricultural Sector” was sometimes replaced by some groups for Heritage. Finally, the choice of these thematic areas were also related to the facility of finding regularly monitored indicators representing elements of these areas used o calculated GCP. A full description of the main elements and aspects of each area is presented in Appendix A: Thematic Areas Main Elements and Aspects.
3.1.4. Enablers
The enablers are key actors and instruments proposed to manage the city and to facilitate the integration of the diverse actions proposed by each thematic area to improve the city environmental performance. Examples of these actors and instruments are private and public institutions, stakeholders, civic organisations, policies, plans, programmes, projects, regulations, governance, finance schemes, etc. Telecommunication and smart technologies (ICT) play a key role in developed the conceptual framework facilitating the implementation of diverse enablers and simplifying their use and communication among city managers, citizens and other stakeholders.
3.1.5. The IHS-GGCPI Method
Table 4 shows the steps in using the IHS-GGCPI index method. Item 2.1 explains in detail how to use each of these steps to calculate green city performance over time and to explain the possible changes of the calculated GCP in the period under study.
The development of the index method was anchored in the IHS-Green City Conceptual Framework displayed in Figure 1, and is composed of twenty-five quantitative indicators distributed in two groups and eight sectors as shown in Table 1, Item 2.1.
Table 4. Main steps of the IHS-GGCPI method
3.2. Application of the IHS-GGCPI Method to Fifty Cities Globally
3.2.1. Ranking of Green City Performances
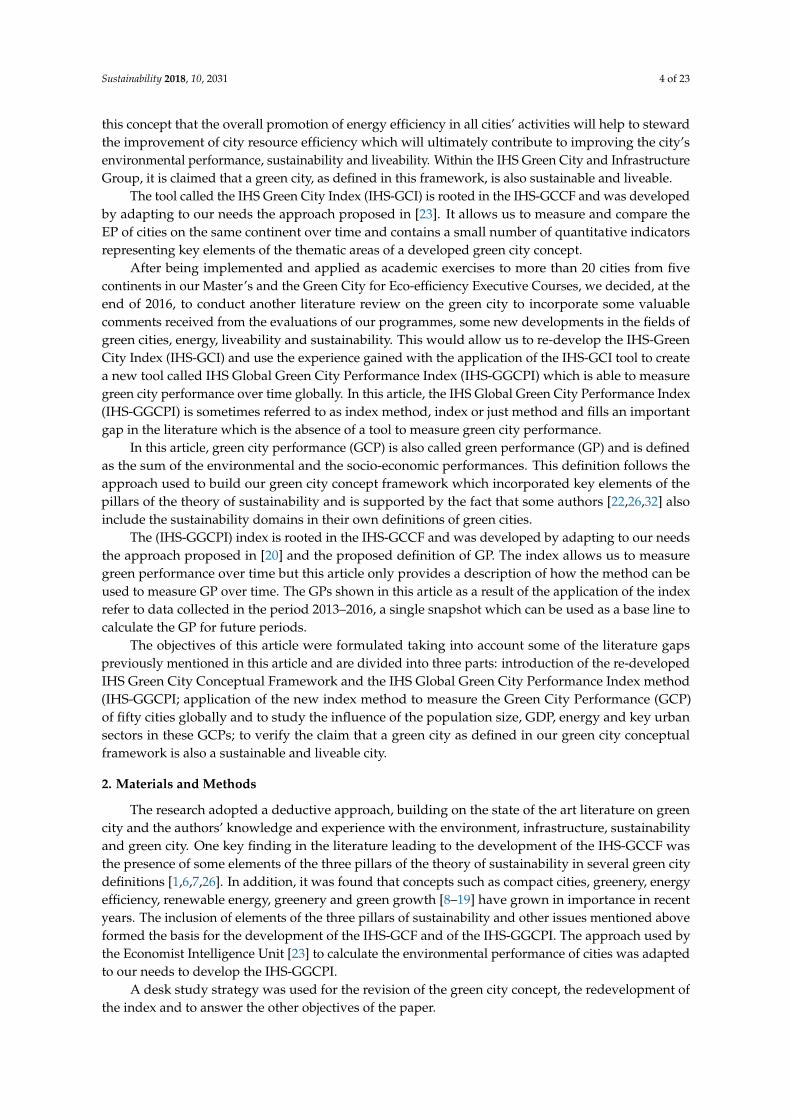
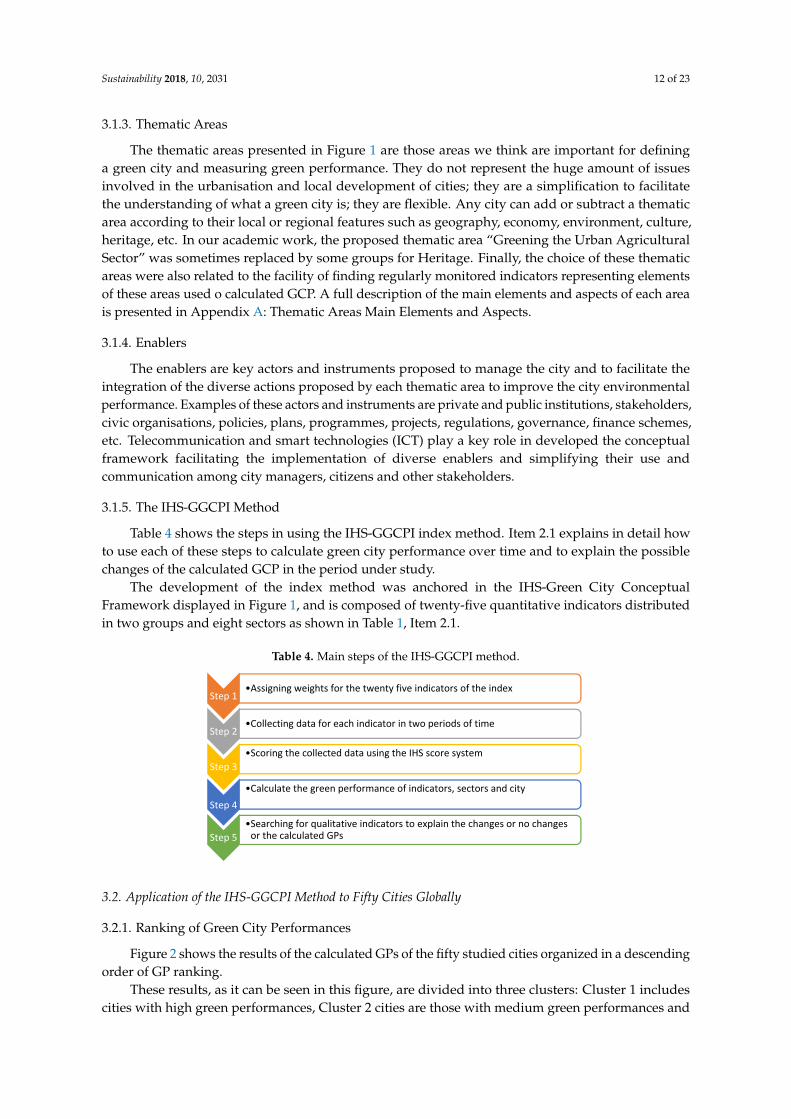
Figure 2 shows the results of the calculated GPs of the fifty studied cities organized in a descending order of GP ranking.
These results, as it can be seen in this figure, are divided into three clusters: Cluster 1 includes cities with high green performances, Cluster 2 cities are those with medium green performances and
Step 1•Assigning weights for the twenty five indicators of the index
Step 2•Collecting data for each indicator in two periods of time
Step 3•Scoring the collected data using the IHS score system
Step 4•Calculate the green performance of indicators, sectors and city
Step 5•Searching for qualitative indicators to explain the changes or no changes
or the calculated GPs
3.2. Application of the IHS-GGCPI Method to Fifty Cities Globally
3.2.1. Ranking of Green City Performances
Figure 2 shows the results of the calculated GPs of the fifty studied cities organized in a descendingorder of GP ranking.
These results, as it can be seen in this figure, are divided into three clusters: Cluster 1 includescities with high green performances, Cluster 2 cities are those with medium green performances and
Sustainability 2018, 10, 2031 13 of 23
Cluster 3 comprises cities with low green performances. The procedures used to create the cluster aredescribed in Item 2.3.
Sustainability 2018, 10, x FOR PEER REVIEW 13 of 23
Cluster 3 comprises cities with low green performances. The procedures used to create the cluster are described in Item 2.3.
Figure 2. IHS Green City Performance Ranking.
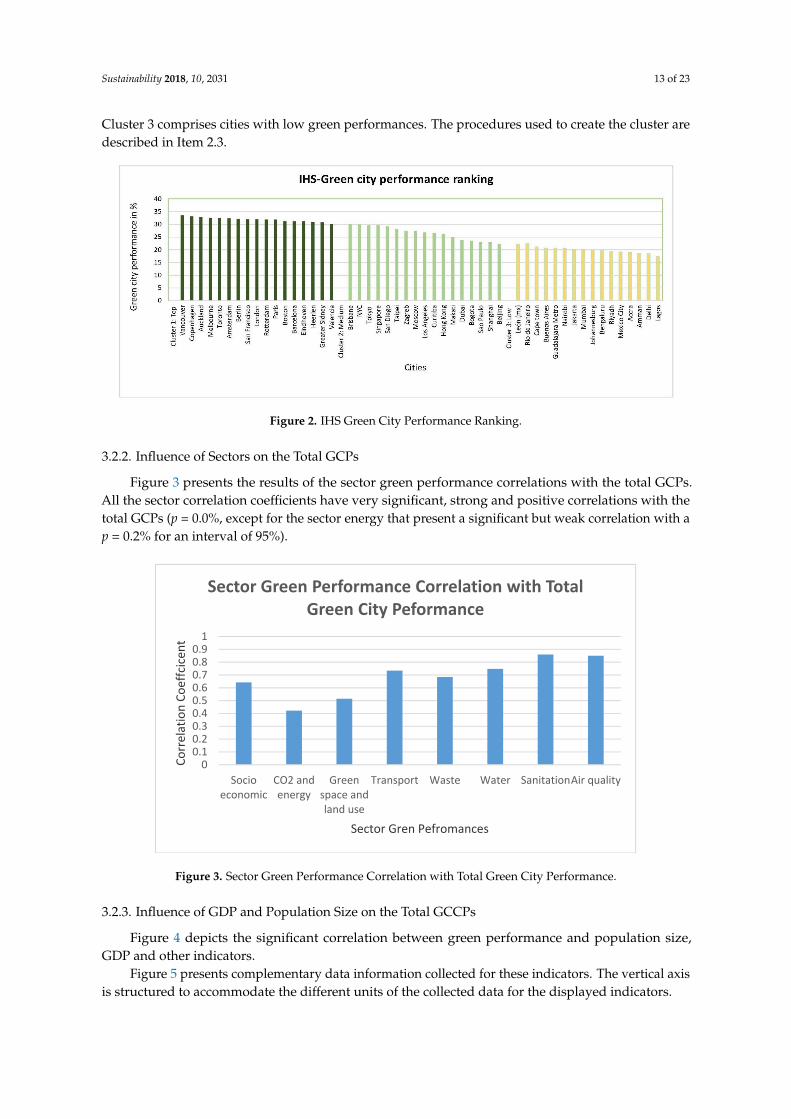
3.2.2. Influence of Sectors on the Total GCPs
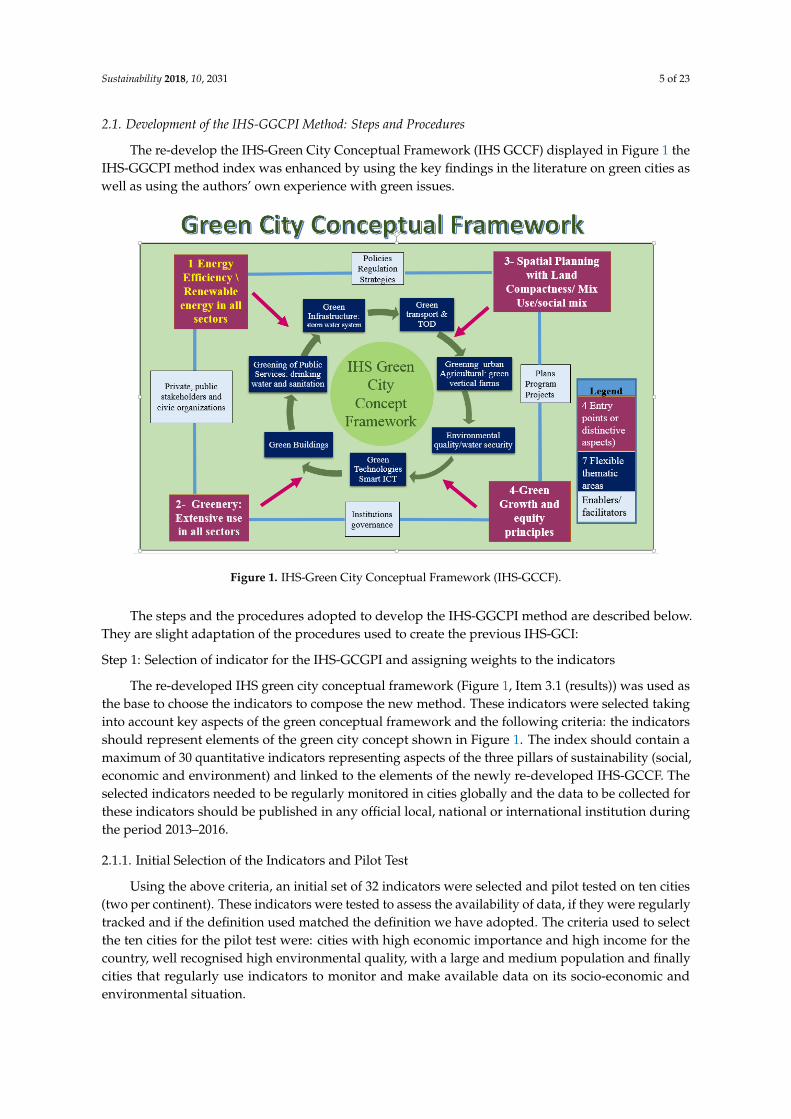
Figure 3 presents the results of the sector green performance correlations with the total GCPs. All the sector correlation coefficients have very significant, strong and positive correlations with the total GCPs (p = 0.0%, except for the sector energy that present a significant but weak correlation with a p = 0.2% for an interval of 95%).
Figure 3. Sector Green Performance Correlation with Total Green City Performance.
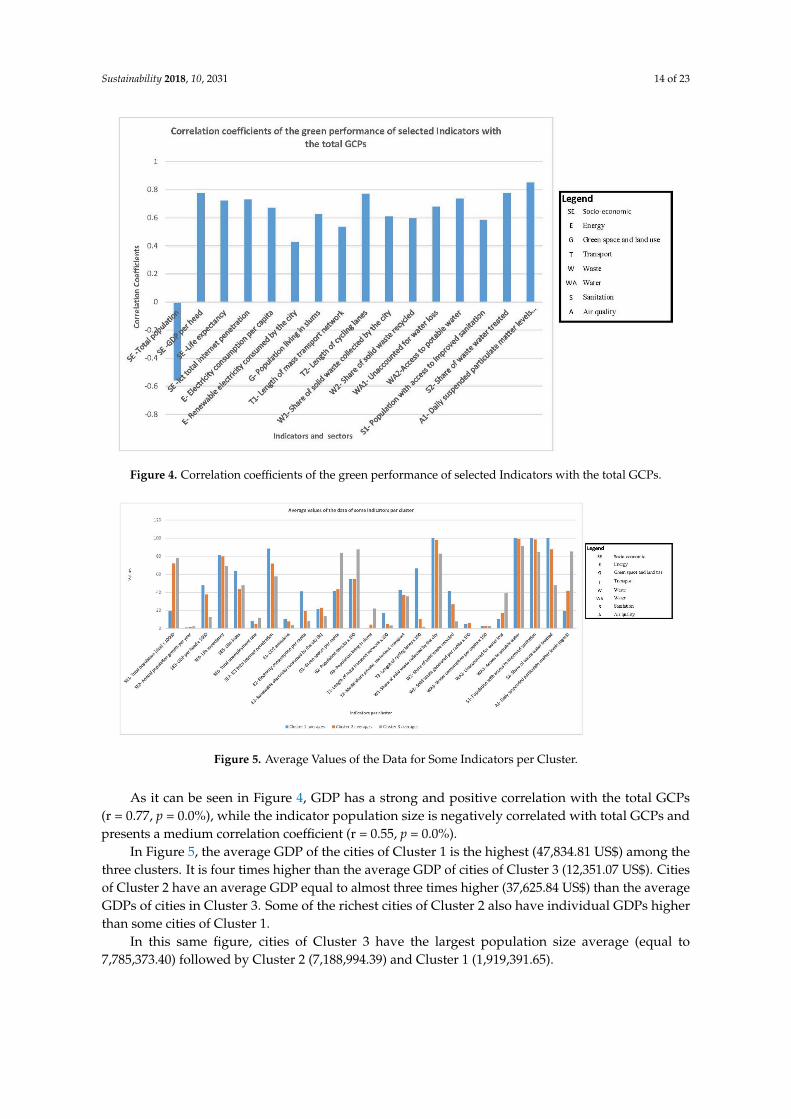
3.2.3. Influence of GDP and Population Size on the Total GCCPs
Figure 4 depicts the significant correlation between green performance and population size, GDP and other indicators.
Figure 5 presents complementary data information collected for these indicators. The vertical axis is structured to accommodate the different units of the collected data for the displayed indicators.
00.10.20.30.40.50.60.70.80.9
1
Socioeconomic
CO2 andenergy
Greenspace andland use
Transport Waste Water SanitationAir quality
Corr
elat
ion
Coef
fcice
nt
Sector Gren Pefromances
Sector Green Performance Correlation with Total Green City Peformance
Figure 2. IHS Green City Performance Ranking.
3.2.2. Influence of Sectors on the Total GCPs
Figure 3 presents the results of the sector green performance correlations with the total GCPs.All the sector correlation coefficients have very significant, strong and positive correlations with thetotal GCPs (p = 0.0%, except for the sector energy that present a significant but weak correlation with ap = 0.2% for an interval of 95%).
Sustainability 2018, 10, x FOR PEER REVIEW 13 of 23
Cluster 3 comprises cities with low green performances. The procedures used to create the cluster are described in Item 2.3.
Figure 2. IHS Green City Performance Ranking.
3.2.2. Influence of Sectors on the Total GCPs
Figure 3 presents the results of the sector green performance correlations with the total GCPs. All the sector correlation coefficients have very significant, strong and positive correlations with the total GCPs (p = 0.0%, except for the sector energy that present a significant but weak correlation with a p = 0.2% for an interval of 95%).
Figure 3. Sector Green Performance Correlation with Total Green City Performance.
3.2.3. Influence of GDP and Population Size on the Total GCCPs
Figure 4 depicts the significant correlation between green performance and population size, GDP and other indicators.
Figure 5 presents complementary data information collected for these indicators. The vertical axis is structured to accommodate the different units of the collected data for the displayed indicators.
00.10.20.30.40.50.60.70.80.9
1
Socioeconomic
CO2 andenergy
Greenspace andland use
Transport Waste Water SanitationAir quality
Corr
elat
ion
Coef
fcice
nt
Sector Gren Pefromances
Sector Green Performance Correlation with Total Green City Peformance
Figure 3. Sector Green Performance Correlation with Total Green City Performance.
3.2.3. Influence of GDP and Population Size on the Total GCCPs
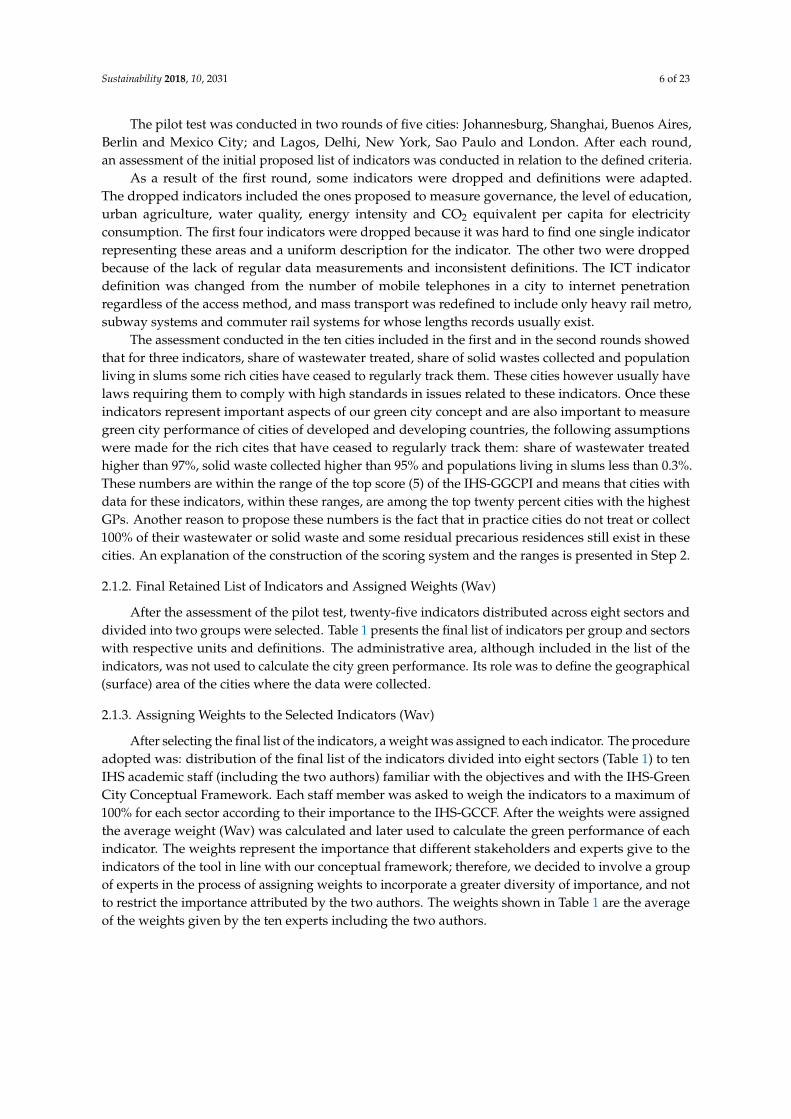
Figure 4 depicts the significant correlation between green performance and population size,GDP and other indicators.
Figure 5 presents complementary data information collected for these indicators. The vertical axisis structured to accommodate the different units of the collected data for the displayed indicators.
Sustainability 2018, 10, 2031 14 of 23Sustainability 2018, 10, x FOR PEER REVIEW 14 of 23
Figure 4. Correlation coefficients of the green performance of selected Indicators with the total GCPs.
Figure 5. Average Values of the Data for Some Indicators per Cluster.
As it can be seen in Figure 4, GDP has a strong and positive correlation with the total GCPs (r = 0.77, p = 0.0%), while the indicator population size is negatively correlated with total GCPs and presents a medium correlation coefficient (r = 0.55, p = 0.0%).
In Figure 5, the average GDP of the cities of Cluster 1 is the highest (47,834.81 US$) among the three clusters. It is four times higher than the average GDP of cities of Cluster 3 (12,351.07 US$). Cities of Cluster 2 have an average GDP equal to almost three times higher (37,625.84 US$) than the average GDPs of cities in Cluster 3. Some of the richest cities of Cluster 2 also have individual GDPs higher than some cities of Cluster 1.
In this same figure, cities of Cluster 3 have the largest population size average (equal to 7,785,373.40) followed by Cluster 2 (7,188,994.39) and Cluster 1 (1,919,391.65).
3.2.4. Influence of Energy on the Total GCPs
Figure 4. Correlation coefficients of the green performance of selected Indicators with the total GCPs.
Sustainability 2018, 10, x FOR PEER REVIEW 14 of 23
Figure 4. Correlation coefficients of the green performance of selected Indicators with the total GCPs.
Figure 5. Average Values of the Data for Some Indicators per Cluster.
As it can be seen in Figure 4, GDP has a strong and positive correlation with the total GCPs (r = 0.77, p = 0.0%), while the indicator population size is negatively correlated with total GCPs and presents a medium correlation coefficient (r = 0.55, p = 0.0%).
In Figure 5, the average GDP of the cities of Cluster 1 is the highest (47,834.81 US$) among the three clusters. It is four times higher than the average GDP of cities of Cluster 3 (12,351.07 US$). Cities of Cluster 2 have an average GDP equal to almost three times higher (37,625.84 US$) than the average GDPs of cities in Cluster 3. Some of the richest cities of Cluster 2 also have individual GDPs higher than some cities of Cluster 1.
In this same figure, cities of Cluster 3 have the largest population size average (equal to 7,785,373.40) followed by Cluster 2 (7,188,994.39) and Cluster 1 (1,919,391.65).
3.2.4. Influence of Energy on the Total GCPs
Figure 5. Average Values of the Data for Some Indicators per Cluster.
As it can be seen in Figure 4, GDP has a strong and positive correlation with the total GCPs(r = 0.77, p = 0.0%), while the indicator population size is negatively correlated with total GCPs andpresents a medium correlation coefficient (r = 0.55, p = 0.0%).
In Figure 5, the average GDP of the cities of Cluster 1 is the highest (47,834.81 US$) among thethree clusters. It is four times higher than the average GDP of cities of Cluster 3 (12,351.07 US$). Citiesof Cluster 2 have an average GDP equal to almost three times higher (37,625.84 US$) than the averageGDPs of cities in Cluster 3. Some of the richest cities of Cluster 2 also have individual GDPs higherthan some cities of Cluster 1.
In this same figure, cities of Cluster 3 have the largest population size average (equal to7,785,373.40) followed by Cluster 2 (7,188,994.39) and Cluster 1 (1,919,391.65).
Sustainability 2018, 10, 2031 15 of 23
3.2.4. Influence of Energy on the Total GCPs
Figures 3–5 show diverse results related to the correlation and data of the energy sector and theirindicators. As mentioned, it can be seen in Figure 3 that the energy sector has a significant but weekcorrelation with the total GCP.
In Figure 5, on average, the cities of Cluster 1 produce more renewable energy than cities ofCluster 3 but consume on average three times more electricity per capita and produce almost threetimes more CO2 emissions per capita. In some Cluster 3 cities, such as Rio de Janeiro and Nairobi,more than 80% of electricity produced and consumed is generated by renewable hydro power. This isalso the case for some cities of Cluster 2 such as Curitiba, Bogota and Sao Paulo.
3.3. Assessing the Claim that a Green City Is also a Sustainable and Liveable City
3.3.1. Assessing Whether a Green City as Defined in the GCGCH Is also a Sustainable City
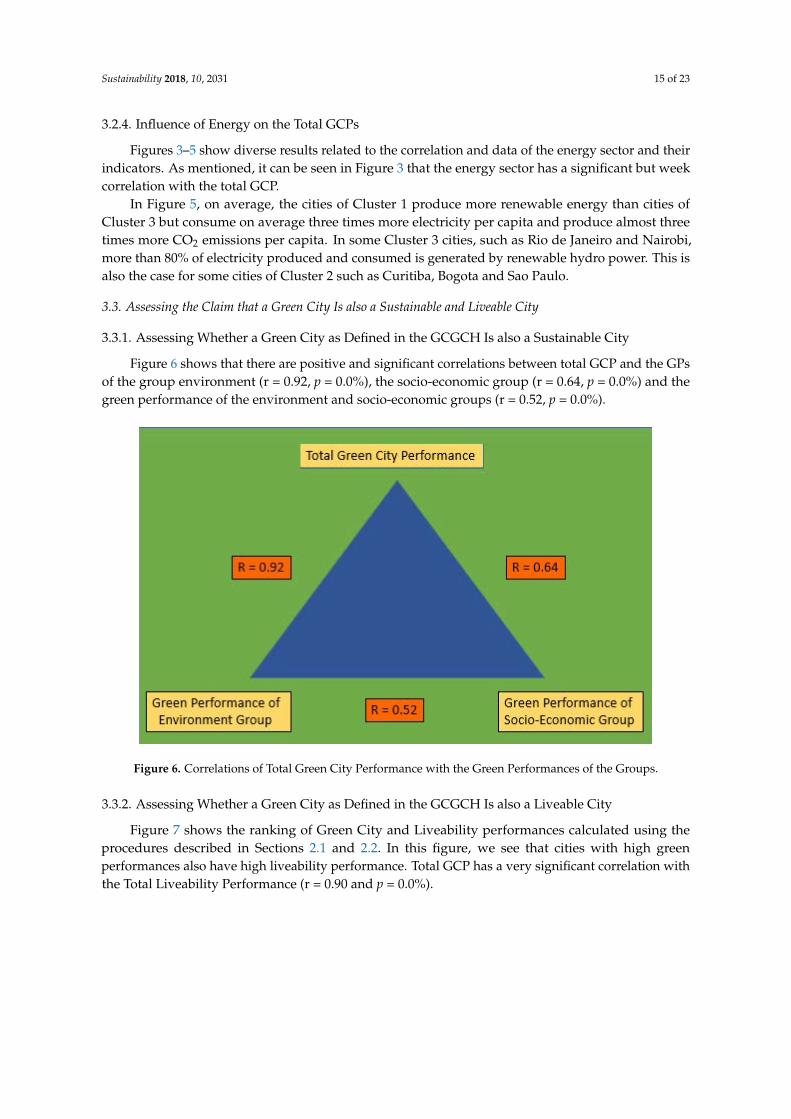
Figure 6 shows that there are positive and significant correlations between total GCP and the GPsof the group environment (r = 0.92, p = 0.0%), the socio-economic group (r = 0.64, p = 0.0%) and thegreen performance of the environment and socio-economic groups (r = 0.52, p = 0.0%).
1
Figure 6. Correlations of Total Green City Performance with the Green Performances of the Groups.
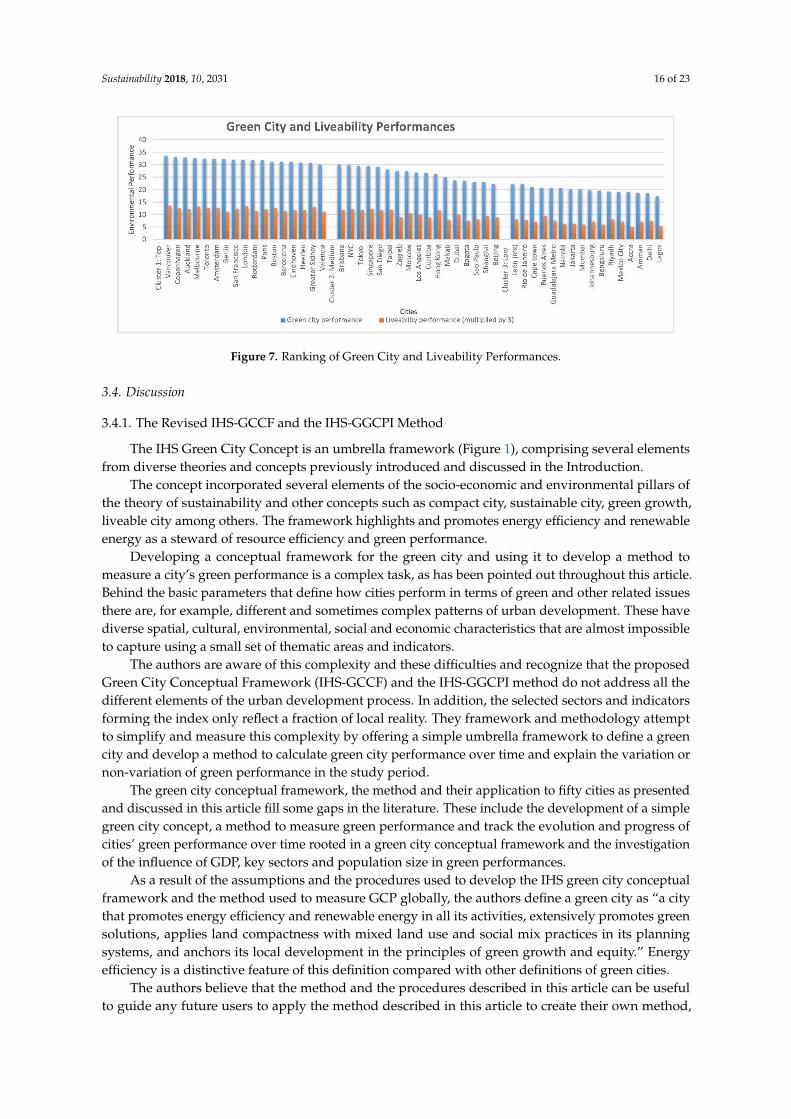
3.3.2. Assessing Whether a Green City as Defined in the GCGCH Is also a Liveable City
Figure 7 shows the ranking of Green City and Liveability performances calculated using theprocedures described in Sections 2.1 and 2.2. In this figure, we see that cities with high greenperformances also have high liveability performance. Total GCP has a very significant correlation withthe Total Liveability Performance (r = 0.90 and p = 0.0%).
Sustainability 2018, 10, 2031 16 of 23Sustainability 2018, 10, x FOR PEER REVIEW 16 of 23
Figure 7. Ranking of Green City and Liveability Performances.
3.4. Discussion
3.4.1. The Revised IHS-GCCF and the IHS-GGCPI Method
The IHS Green City Concept is an umbrella framework (Figure 1), comprising several elements from diverse theories and concepts previously introduced and discussed in the Introduction.
The concept incorporated several elements of the socio-economic and environmental pillars of the theory of sustainability and other concepts such as compact city, sustainable city, green growth, liveable city among others. The framework highlights and promotes energy efficiency and renewable energy as a steward of resource efficiency and green performance.
Developing a conceptual framework for the green city and using it to develop a method to measure a city’s green performance is a complex task, as has been pointed out throughout this article. Behind the basic parameters that define how cities perform in terms of green and other related issues there are, for example, different and sometimes complex patterns of urban development. These have diverse spatial, cultural, environmental, social and economic characteristics that are almost impossible to capture using a small set of thematic areas and indicators.
The authors are aware of this complexity and these difficulties and recognize that the proposed Green City Conceptual Framework (IHS-GCCF) and the IHS-GGCPI method do not address all the different elements of the urban development process. In addition, the selected sectors and indicators forming the index only reflect a fraction of local reality. They framework and methodology attempt to simplify and measure this complexity by offering a simple umbrella framework to define a green city and develop a method to calculate green city performance over time and explain the variation or non-variation of green performance in the study period.
The green city conceptual framework, the method and their application to fifty cities as presented and discussed in this article fill some gaps in the literature. These include the development of a simple green city concept, a method to measure green performance and track the evolution and progress of cities’ green performance over time rooted in a green city conceptual framework and the investigation of the influence of GDP, key sectors and population size in green performances.
As a result of the assumptions and the procedures used to develop the IHS green city conceptual framework and the method used to measure GCP globally, the authors define a green city as “a city that promotes energy efficiency and renewable energy in all its activities, extensively promotes green solutions, applies land compactness with mixed land use and social mix practices in its planning systems, and anchors its local development in the principles of green growth and equity.” Energy efficiency is a distinctive feature of this definition compared with other definitions of green cities.
The authors believe that the method and the procedures described in this article can be useful to guide any future users to apply the method described in this article to create their own method, or to adapt the method to their own city’s needs. The method can also be applied to monitor the
Figure 7. Ranking of Green City and Liveability Performances.
3.4. Discussion
3.4.1. The Revised IHS-GCCF and the IHS-GGCPI Method
The IHS Green City Concept is an umbrella framework (Figure 1), comprising several elementsfrom diverse theories and concepts previously introduced and discussed in the Introduction.
The concept incorporated several elements of the socio-economic and environmental pillars ofthe theory of sustainability and other concepts such as compact city, sustainable city, green growth,liveable city among others. The framework highlights and promotes energy efficiency and renewableenergy as a steward of resource efficiency and green performance.
Developing a conceptual framework for the green city and using it to develop a method tomeasure a city’s green performance is a complex task, as has been pointed out throughout this article.Behind the basic parameters that define how cities perform in terms of green and other related issuesthere are, for example, different and sometimes complex patterns of urban development. These havediverse spatial, cultural, environmental, social and economic characteristics that are almost impossibleto capture using a small set of thematic areas and indicators.
The authors are aware of this complexity and these difficulties and recognize that the proposedGreen City Conceptual Framework (IHS-GCCF) and the IHS-GGCPI method do not address all thedifferent elements of the urban development process. In addition, the selected sectors and indicatorsforming the index only reflect a fraction of local reality. They framework and methodology attemptto simplify and measure this complexity by offering a simple umbrella framework to define a greencity and develop a method to calculate green city performance over time and explain the variation ornon-variation of green performance in the study period.
The green city conceptual framework, the method and their application to fifty cities as presentedand discussed in this article fill some gaps in the literature. These include the development of a simplegreen city concept, a method to measure green performance and track the evolution and progress ofcities’ green performance over time rooted in a green city conceptual framework and the investigationof the influence of GDP, key sectors and population size in green performances.
As a result of the assumptions and the procedures used to develop the IHS green city conceptualframework and the method used to measure GCP globally, the authors define a green city as “a citythat promotes energy efficiency and renewable energy in all its activities, extensively promotes greensolutions, applies land compactness with mixed land use and social mix practices in its planningsystems, and anchors its local development in the principles of green growth and equity.” Energyefficiency is a distinctive feature of this definition compared with other definitions of green cities.
The authors believe that the method and the procedures described in this article can be usefulto guide any future users to apply the method described in this article to create their own method,
Sustainability 2018, 10, 2031 17 of 23
or to adapt the method to their own city’s needs. The method can also be applied to monitor theachievement of proposed targets and actions to improve city green performance and help identify andexplain the factors behind achievements and failures.
3.4.2. Application of the IHS-GGCPI Method to Fifty Cities Globally
Data Quality
The data used to construct the method were collected in 2017 by IHS staff following the criteriapreviously developed and described under Item 2.1 and Step 2 in the Materials and Methods Section.In total, 1298 data were collected for the fifty cities: 79.2% of the total data collected refer to the period2013–2016, 6.2% to 2012 and 14.6% are from before 2012, of which 0.1% are for 2001, the earliestdata collected.
Three main sources were used to collect the data: The World Council for City Data (WCCD,ISO37120) [37] with 36.46%, followed by the CDP, formerly carbon disclosure project [38] from whichwe source the share of renewable electricity generated and emissions per capita for many cities,and from which most of the GDP estimates have been taken. Other official sources included the WorldHealth Organization (WHO), the Word Bank, OECD, UN Habitat, local and national public institutionsand, in the case of data for some indicators of African cities, scientific papers.
The availability and comparability of data across cities was more limited for Africa and a numberof Asian cities than in cities from other continents. Eighty-six per cent of the total data set is fromcity administrative areas, 9% from national, metropolitan and provincial data, 2.1% were blanks(no available data) and 2.9% have assumptions made (see Item 2.1, Step 2 of the section materialsand methods). “Length of cycling lanes” was the indicator presenting the highest number of blanks(9 cities) followed by “green spaces per capita” with four cities. The high number of blanks of the“length of cycling lanes” reflects to some extent the fact that only recently has the building of cyclelanes become popular worldwide and that many cities where cycle lanes are not yet regularly tracked.The “green spaces per capita” indicator is many cities of Africa and Asian is not being regularly trackedor if tracked di different definitions are being used.
As previously mentioned in the Item 2.1, Step 2 in the Materials and Methods Section, assumptionswere made for the indicators of some rich cities such as “share of solid waste collected by the city”(eleven cities), “population living in slums” (nine cities) and “share of waste water treated” (ninecities). Some rich cities as mentioned before are no longer regularly tracking these indicators althoughthey have strict policies and rules controlling them.
In sectors where indicator data were not available (blank) ,the weight of the indicators wereredistributed among the other indicators within the sector to be in line with the criteria that the totalweight of the indicators within a sector adds up to 100%.
Representativeness and consistency was assured by collecting data from global and regionalsources wherever possible and avoiding as much as possible specific documents and other reportswhere differences in definitions and methods of collection could be an issue for data consistency.A record of original data sources is kept at IHS.
Despite following a strict data collection protocol, we acknowledge that some inaccuracies mightremain within the data set due to inconsistencies in definitions, measurements, data collection methodsand lack of data, such as in some African and a few Asian cities which means that the data should beconsidered with a degree of caution.
3.4.3. Ranking of Green City Performances
As can be seen in Figure 2, Vancouver leads the overall ranking of GCP with 33.35 points followedby Copenhagen with 33.06 and Auckland with 32.8. Among the top ten green cites, five are from Europe(Copenhagen, Berlin, Amsterdam, London and Rotterdam), three from North America (Vancouver,Toronto and San Francisco) and two from Oceania (Auckland and Melbourne).
Sustainability 2018, 10, 2031 18 of 23
Per continent, Copenhagen is the top green city in Europe, Vancouver in North America, Aucklandin Oceania, Tokyo in Asia, Curitiba in South America and Cape Town in Africa. Moscow, Shanghai andSao Paulo, important BRICS cities have medium green performances. Per country, two Dutch and twoCanadian cities are among the top 10 green city performances. All studied African and Indian citiessuch as Cape Town, Nairobi, Johannesburg, Accra, Lagos, Mumbai, Bengaluru and Delhi are in Cluster3 with low green performances. Lagos is the city with the lowest green performance (17.27 points) inthis ranking.
The authors are aware that comparing the results of indexes developed to measure and rank citysustainability, city environmental performance or green city performance is an almost impossible task.Although some of these rankings sometimes use elements and indicators that overlap with each other,they very often measure different things, use different approaches, indicators, cities and criteria.
Despite these difficulties, the results obtained with the application of the IHS-GGCPI indexmethod to some extent match with results found in the existing literature. Cities such as Vancouver,Copenhagen, London, Auckland, Amsterdam, Berlin, Toronto, Paris, and Barcelona found to be in thetop Clusters 1 and 2 of the IHS ranking are also very often present in the top list of indexes which rankcities according to their sustainability, environmental performances and liveability [23–27,29–32].
The IHS-GCCPI ranking could be useful for the participating cities to benchmark themselves andpossibly propose targets and actions to improve their GP. For cities not included in the ranking it couldbe also useful to compare themselves with ranked the cities provided they follow the procedures tocalculate their own GP described in the IHS-GGCPI method.
3.4.4. Influence of the Sectors, GDP, Population Size and Energy on the Calculated GreenCity Performances
As can be seen in Figure 3, Sanitation, Air Quality, Water and Transport are the sectors presentingthe strongest correlation coefficients with the total GCPs. Sanitation and Air Quality are the two sectorswith the highest correlation coefficients with total green city performances, 0.71 and 0.70 respectively.Since the Air Quality sector has only one indicator (PM10) this indicator alone predicts 70% of thetotal GCP.
As it can be seen in Figures 2–5, there is an economic bias towards rich cities: the richest cities(Clusters 1 and 2) measured by GDP are greener than the cities of developing countries (Cluster 3).The richest cities of Cluster 1 and most of the cities of Cluster 2 have very high GDPs; small tomedium population size; very good green performance in the Sanitation, Air quality, Waste, Drinkingwater, Transport and Socio-economic sectors; and very high Energy consumption, Production ofrenewable energy, and CO2. Cities of Cluster 3 on the other hand have low green performance for thesesectors, low GDP, low socio-economic levels, large population size, high number of slums, low energyconsumption and low CO2 emissions.
These results suggest that cities in Clusters 1 and 2 have large financial resources to invest inthe sanitation, air quality, drinking water, transport and waste sectors which have contributed to thehigh GPs of these cities. Cities in Cluster 3 on the other hand have low GDPs, low financial resourcecapacity to invest in these sectors and very often also have large population size and slum areas whichcontribute to low GPs in these cities.
Population size, as shown in Figure 4, has a significant negative correlation with the total CGPs.This result seems to indicate that cities with very large population tend to have a low GCP. To someextent the above statement was confirmed by this research. Cities with very large populations such asDelhi, Mumbai, Bengaluru, Mexico City, Lagos, Rio de Janeiro and Jakarta are in Cluster 3, and allhave low green performances. However, a more in-depth look at the results shows London, with morethan 10 million inhabitants, among the top ten greenest cities, as can be seen in Figure 2. This is alsothe case of other cities with large populations such as Tokyo, Los Angeles and New York, which arefound in Cluster 2. This also applies to mega cities such as Shanghai and Beijing with more than twenty
Sustainability 2018, 10, 2031 19 of 23
million inhabitants, which are among the cities of Cluster 2. All these large cities have higher greenperformance than the large cities of Cluster 3.
From the above results it can be said that population size influences total CGP but that otherfactors such as GDP, through its effect on investment capacity, also have an important influence on thetotal GCP. The same applies to other factors such as good governance, planning and managing cultures.This seems to be the case of some rich cities with very large populations found in this research.
The research shows a significant but low correlation (0.42) of the energy sector with total cityGP (see Figure 4). A possible explanation could be that the indicators chosen to represent the energysector only capture part of the relations between energy and the city economy. Energy intensity is abetter indicator of energy efficiency but was not used in the index because it is not regularly monitoredin cities worldwide, and especially in many cities in developing countries. For the same reason,other important indicators, such as energy consumed per sector and source (such as solid fuels, oil,gas, and nuclear) were not included.
It is well recognized that decisions on energy use and sources affect the green performance ofkey sectors such Air quality, Sanitation, Transport and Waste in a significant way. The results of thisresearch showed that cities belonging to Cluster 1 and 2 have very good total green performance aswell as a very high GP for the individual sectors. This can be seen as an indication that these citieshave better overall energy and resource efficiency compared with the cities of Cluster 3.
3.4.5. Assessing the Claim that a Green City Is also a Sustainable and Liveable City
As shown in Figure 6, total green city performance is positively and significantly correlated withgreen performance in the environmental and socio-economic groups, and there is also a significantcorrelation between the green performance of the environmental and socio-economic groups.
The environmental group which contains several sub-groups related to infrastructure, stronglyinfluences total GCP, with a correlation coefficient of 0.92. Several publications have also reported thatenvironmental/infrastructure related issues are very often strongly present in many of the existinggreen city concepts, methodologies and indexes [21,22,26,32,33]. The significant correlation betweenthe total GCP and the GP of the environment and socio-economic groups indicates that the IHS greencity conceptual framework (GCCF) contains elements of the three pillars of the theory of sustainabilitywhich confirms the approach used to develop the conceptual framework. In the literature referred toin the Introduction, the definitions of green cities also very often included elements of sustainability,and sometimes the green city is also called a sustainable or eco-city [22]. As the IHS-GGCPI indexmethod was developed using the IHS-GCF that contains key elements of the three pillars of the theoryof sustainability, these results confirm that a green city as defined in the IHS-GCCF is also sustainable.
A strong positive and significant correlation was found between total green city performance andliveable city performance (r = 0.90). In Figures 2 and 7, we can see that six out of the ten top greencities are also found among the ten most liveable cities, and eight of the ten cities with the lowest GCPsare also found among the ten cities with the lowest liveability performances.
The richest cities of Clusters 1 and 2 are more liveable that the cities in Cluster 3. Cites with largepopulations are in general less liveable than medium and small cities. However, it was found in thegreen city performance discussion, that some cities with large populations have very high liveabilityperformance such as London, Sydney, Tokyo and Hong Kong.
The comparison of cities’ rankings for green city and liveability performance showed importantvariations. London for example, occupies ninth place among the top ten green cities (Figure 2) but isthe second most liveable city (Figure 7). Similarly, Sydney is sixteenth in the GGP ranking but fourthin the liveability ranking. New York, Hong Kong, and Buenos Aires also have higher positions inthe liveability ranking than in the GCP ranking. One possible explanation of why cities vary in theirrankings in these two indexes is the weights assigned to the indicator in each index. The weights givenin the liveability index are different from these same indicators in the green city index (see Tables 1and 3).
Sustainability 2018, 10, 2031 20 of 23
As explained in Items 2.1 and 2.1 of the Materials and Methods Section, the weights assigned forthe indicators in each index represent the importance that is given for the indicator in relation to thekey characteristics of the green city concept or the liveability concept. The characteristics of the greencity and liveability concepts, although overlapping in some respect, have important differences. In theliveability concept, for example, the characteristics of the place and the ways a person living or visitingthe place sees it and feels about it are more important than for the concept of green city [10,11].
Cities with high liveability in this research also score highly for green performance and are oftenfound in the top positions of other liveability indexes [11,31] and environmental performance orsustainability indexes [23,30] which confirms the claim of our group that a green city as defined in ourconcept is also a sustainable and liveable city.
Author Contributions: The first author was responsible for the Supervision and Administration of the researchincluding the Conceptualization, Methodology, Formal Analysis, Investigation, Validation, Writing-Review &Editing of the article. The second author was involved in the Investigation, Formal Analysis, Data Collection(data curation), Software (IBM SPSS) and Visualisation.
Funding: This research received no external funding.
Acknowledgments: The authors would like to thank Julia Skinner, Sharon Welsh and staff and colleagues at theIHS (EUR), for their inputs in the preparation and editing of the article.
Conflicts of Interest: The authors declare no conflict of interest.
Appendix A. Thematic Areas and Description of the Key Elements and Aspects of the IHS-GCCFPresented in Figure 1 of the Article
The IHS-GCCF contains seven thematic areas including diverse elements and aspectsdescribed below:
Appendix A.1. Green Transport and TOD
Green transport in this concept focuses on the improvement of the movement of people(accessibility) as a priority by promoting walking, cycling, efficient public transport, compactnessand connectivity rather than on the improvement of movement of motorised vehicles. Key elementsinclude: promotion of multimodal integration, taking into account affordability and accessibility intransport planning, promotion of extensive use of TOD practices, low or zero emission technologies,green fuels, and smart and electrical cars.
Appendix A.2. Green Urban Agriculture
The huge urban areas of our cities have increased the distances to bring and distribute foodto consumers and consequently increase the consumption of fuels and greenhouse gases (GHGs)by the transport (freight) sector. Producing, processing, distributing, and consuming food near tothe consumer markets helps to shorten the food supply chains, to reduce energy consumption andGHGs emissions and improve local air quality. Many cities are using new technologies and practice todevelop and produce food on the rooftops of buildings and in vertical green farms.
Appendix A.3. Environmental Quality and Water Security
Environmental quality in our concept focuses on the application of green practices to keepand/or improve the quality of water, air and soil quality measured in terms of quality standards.Water efficiency and conservation are some practices cities are also adopting to deal with the problemsrelated to water security.
Appendix A.4. ICT and Green Technologies
ICT in this concept include all related telecommunication technologies and smart tools availableto facilitate the use of public and private services, to disseminate information, and to facilitate the
Sustainability 2018, 10, 2031 21 of 23
integration, management and implementation of the actions proposed by each thematic area tocontribute to the improvement of the overall GCP. Green technologies in this concept also includeall technologies and practices leading to the improvement of energy production, consumption andresources efficiency.
Appendix A.5. Green Buildings
The building sector is one of the three most energy consuming sectors of cities. The thematic areafocused on the extensive use of energy and resources efficiency in combination with the increment ofthe production and use of renewable energy in the sector. Key elements of this thematic area includethe use of low development impact practices in the construction of new buildings and in the retrofit ofthe existing building stocks, the use of building energy labels and energy performance certificates toimprove energy efficiency, the inclusion of building energy performance practices within the local ornational building codes and the increase of recycling and reuse of building wastes together with theapplication of the building for dismantling technologies and approaches.
Appendix A.6. Greening Public Services
The term greening public services in this thematic area is used in reference to the energy efficiencyand renewable energy practices used in the production of public services such as drinking water,wastewater, solid wastes, energy, etc. Another important element of this thematic area is the use ofpractices leading to the increase of physical resilience of the infrastructure systems to adapt them tofuture extreme climatic and non-climatic related events.
Appendix A.7. Green Infrastructure
Green Infrastructure in this concept deals primarily with storm water systems. It focuses on thebuilding of new storm water systems or retrofit the existing ones to be able to reduce downstreamfloods and to improve the water quality of the receiving water bodies. Central elements in this thematicarea are: the use of approaches leading to infiltrate, evaporate, retard or retaining part of the rain waternear to source; use the construction of new storm water systems or retrofit the existing ones to increasegreenery surfaces; improve site landscapes and the creation of multifunctional spaces for preservationof urban wildlife habitat and recreation; and promote the construction of green roofs, green facades,green linear corridors, wet land with or without detention ponds, urban parks and the use semi orpermeable material such as interlocked bricks in walking sides and roads.
References
1. Lehmann, S. What is green urbanism? Holistic principles to transform cities for sustainability. In ClimateChange—Research and Technology for Adaptation and Mitigation; InTech: Rijeka, Croatia, 2011; Chapter 14;pp. 243–266.
2. OECD. Compact City Policies: A Comparative Assessment, Paris ed.; OECD: Paris, France, 2013.3. Freire, M.E. Urbanization and Green Growth in Africa. Green Growth Series, Report Number 1; Growth Dialogue:
Washington, DC, USA, 2013.4. Meadows, D.H.; Meadows, D.L.; Randers, J.; Behrens, W.W., III. The Limits to Gowth. A Report for the Club of
Rome’s Project on the Predicament of Mankind; Universe Books: New York, NY, USA, 1972.5. WCED. Our Common Future; Oxford University Press: Oxford, UK, 1987.6. Campbell, S. Green cities, growing cities, just cities? Urban planning and the contradictions of sustainable
development. J. Am. Plan. Assoc. 1996, 62, 296–312. [CrossRef]7. Tjallingii, S.P. Ecological Conditions. Strategies and Structures in Environmental Planning; TU Delft: Delft,
The Netherlands, 1996.8. Duijvestein, K. Van duurzame ontwikkeling naar duurzaam bouwen en weer terug. Dubo Jaarboek 2002, 21,
15–21.
Sustainability 2018, 10, 2031 22 of 23
9. Lowe, M.; Whitzman, C.; Badland, H.; Davern, M.; Hes, D.; Aye, L.; Butterworth, I.; Giles-Corti, B. Liveable,Healthy, Sustainable: What Are the Key Indicators for Melbourne Neighbourhoods? Research Paper 1, Place, Healthand Liveability Research Program; University of Melbourne: Melbourne, Australia, 2013.
10. National Research Council. Concept of Liveability and Indicators. Community and Quality of Life: Data Needs forInformed Decision Making; The National Academies Press: Washington, DC, USA, 2002.
11. Economist Intelligence Unit. The Global Liveability Report 2017; The Economist: London, UK, 2017.12. Jabareen, Y.R. Sustainable urban forms: Their typologies, models, and concepts. J. Plan. Educ. Res. 2006, 26,
38–52. [CrossRef]13. UN Habitat. Habitat III Issue Papers on Urban and Spatial Planning and Design; UN Habitat: New York, NY,
USA, 2015.14. Irrek, W.; Thomas, S. Defining Energy Efficiency; Wuppertal Institut fur Klima, Umwelt, Energie GmbH:
Wuppertal, Germany, 2008.15. Energy Center Nederland (ECN). Resource Efficiency: What Does it Mean and Why is it Relevant; Energy Center
Nederland: Petten, The Netherlands, 2013.16. Litman, T. Determining Optimal Urban Expansion, Population and Vehicle Density, and Housing Types for
Rapidly Growing Cities. In Proceedings of the World Conference on Transport Research, Shanghai, China,10–15 July 2016.
17. Westerink, J.; Haase, D.; Bauer, A.; Ravetz, J.; Jarrige, F.; Aalbers, C.B.E.M. Compact city strategies in Europecompared for trade-offs. Science for environment. Science for Environment. Eur. Plan. Stud. 2013, 21,473–497. [CrossRef]
18. Matsumoto, T. Compact City Policies: Comparative Assessment. In 47th ISOCARP Congress; ISOCARP:The Hague, The Netherlands, 2011.
19. Brilhante, O. The compact city versus making room for future city expansion in the context of Nampula,Mozambique. TRIALOG 2017, 128, 1.
20. Kahn, M.E. Green Cities: Urban Growth and the Environment; Brookings Institution Press: Washington, DC,USA, 2007.
21. Lindfield, M.; Steinberg, F. (Eds.) Green Cities; ADB: Manila, Philippines, 2012.22. Pace, R.; Churkina, G.; Rivera, M. How Green Is a Green City? A Review of Existing Indicators and Approaches;
IASS: Potsdam, Germany, 2016.23. Economist Intelligence Unit. African, Asian and European Green City Index—Assessing the Environmental
Performance of Major Cities; Siemens: Munich, Germany, 2010.24. Inter-American Development Bank (IDB). Evaluation of IDB’s Emerging and Sustainable Cities Initiative;
Inter-American Development Bank: Washington, DC, USA, 2016.25. Zoeteman, K.; Zande, M.V.D. Integrated Sustainability Monitoring of 58 Eucities: A study of European Green
Capital award Applicant Cities; Tilburg University: Tilburg, The Netherlands, 2015.26. European Bank for Reconstruction and Development (EBRD). Green City Program Methodology; European
Bank for Reconstruction and Development: London, UK, 2016.27. European Union. European Green Capital 2018. Good Practice Report; European Comission: Brussels, Belgium, 2016.28. OECD. Green Growth Indicators 2014; OECD Publishing: Paris, France, 2014.29. Tamanini, J.; Bassi, A.; Hoffman, C.; Valenciano, J. The Global Green Economy Index. Measuring National
Performance in the Green Economy; Dual Citizen Inc.: Washington, DC, USA, 2016.30. Arcadis. Sustainable City Index. Putting People at the Heart of City Sustainability; Arcadis: Rotterdam,
The Netherlands, 2016.31. Parilla, J.; Trujillo, J.L.; Berube, A.; Ran, T. Global Metro Monitor. An Uncertain Recovery; Metropolitan Policy
Program at Brookings: Washington, DC, USA, 2015.32. Asian Development Bank (ADB). Green City Development Tool Kit; Asian Development Bank: Manilla,
Philippines, 2015.33. Sandhu, S.C.; Singru, R.N.; Bachmann, J.; Sankaran, V.; Arnoux, P. GrEEEn Solutions for Livable Cities; Asian
Development Bank: Manilla, Philippines, 2016.34. Ayik, C.; Ayatac, H.; Sertyesilisik, B. A Gap Analysis on Urban Sustainability Studies and Urban Sustainability
Assessment Tools. Archit. Res. 2017, 7, 1–15.35. Saha, D. Empirical research on local government sustainability efforts in the USA: Gaps in the current
literature. Local Environ. 2009, 14, 17–30. [CrossRef]

Sustainability 2018, 10, 2031 23 of 23
36. Derkzen, M.L.; Teeffelen, A.J.A.; Verburg, P.H. Quantifying urban ecosystem services based onhigh-resolution data of urban green space: An assessment for Rotterdam, the Netherlands. J. Appl. Ecol.2015, 52, 1020–1032. [CrossRef]
37. WCCD. World Council for City Data (WCCD, ISO37120). Available online: http://www.dataforcities.org(accessed on 10 October 2017).
38. CDP. Formerly Carbon Disclosure Project. Available online: https://www.cdp.net/ (accessed on 10 October 2017).
© 2018 by the authors. Licensee MDPI, Basel, Switzerland. This article is an open accessarticle distributed under the terms and conditions of the Creative Commons Attribution(CC BY) license (http://creativecommons.org/licenses/by/4.0/).