Embed Size (px)
Citation preview
J. Sep. Sci. 2014, 37, 37–44 37
Cristiano Soleo Funari1,2
Renato Lajarim Carneiro3
Andre Marques Andrade2
Emily Frances Hilder1
Alberto Jose Cavalheiro2
1Australian Centre for Researchon Separation Science(ACROSS), School of Chemistry,University of Tasmania, Hobart,Tasmania, Australia
2Chemistry Institute, Sao PauloState University, Araraquara,Sao Paulo, Brazil
3Department of Chemistry,Federal University of SaoCarlos, Sao Carlos, Sao Paulo,Brazil
Received August 28, 2013Revised October 14, 2013Accepted October 15, 2013
Research Article
Green chromatographic fingerprinting: Anenvironmentally friendly approach for thedevelopment of separation methods forfingerprinting complex matrices
A chromatographic fingerprint is a comprehensive method that reveals the distinctive pat-tern of peaks across the chromatogram for a given sample. It is considered an effectivestrategy to assess the identity and quality of herbal materials, as well as for the control of thequality of their derived products. HPLC is the most employed technique for these purposesand it is used routinely for quality control in industry. Hence, its impact on the environmentshould not be neglected. This work provides a rational and generic procedure to qualita-tively fingerprint complex matrices. Resource- and time-saving experimental designs wereselected; an alternative safer organic solvent was tested and a time-saving and innovativeresponse entitled the green chromatographic fingerprinting response was developed andemployed. This procedure was applied in the development of chromatographic fingerprintsfor extracts of Bauhinia forficata and Casearia sylvestris. Moreover, the response proposedhere can be combined with a complementary metric available in the literature to comparemethods using different solvents. According to this, the chromatographic fingerprints de-veloped here using ethanol as the organic solvent provided a performance better than thatof reference methods in which more harmful acetonitrile or methanol were employed.
Keywords: Bauhinia forficata / Casearia sylvestris / Quality by design / Greenliquid chromatography / Metabolite profilingDOI 10.1002/jssc.201300955
� Additional supporting information may be found in the online version of this articleat the publisher’s web-site
1 Introduction
As the name suggests, a chromatographic fingerprint is acomprehensive method that reveals the distinctive patternof peaks across the chromatogram for a given sample [1, 2].It is generally considered an effective strategy to assess theidentity and quality of herbal materials, as well as for thecontrol of the quality of their derived products, such as phy-totherapeutics, nutraceuticals, and phytocosmetics [2–4]. Themere presence of a marker (or a number of markers) in anherbal material or in its derived product does not necessarilyreflect their global properties. Even compounds present in
Correspondence: Dr. Cristiano Soleo Funari, Australian Centre forResearch on Separation Science (ACROSS), School of Chemistry,University of Tasmania, Private Bag 75, 7001 Hobart, Tasmania,AustraliaE-mail: [email protected]; [email protected]: +61-3-62262858
Abbreviations: CCD, central composite design; forficata_L,hydroethanolic leaf extract of Bauhinia forficata; EAT, en-vironmental assessment tool; EtOH, ethanol; GCFR, greenchromatographic fingerprinting response; MeCN, acetoni-trile; MeOH, methanol; sylvestris_L, ethanolic leaf extract ofCasearia sylvestris
low amount might be important for the efficacy and safety ofthe medicinal plants since their therapeutic effects are oftenbased on synergetic effects among several constituents [1, 2].Furthermore, chemical markers related to the therapeutic ac-tivity observed for medicinal plants are often unavailable inthe market [4]. For these reasons, the World Health Orga-nization and various drug control departments suggest theuse of an appropriate fingerprint chromatogram to certify thequality of herbal drugs [1, 5].
In general, the exact number of compounds in an herbalextract is unknown, but it could contain hundreds of them[1, 4]. As a consequence, despite the recent advances in chro-matographic columns and instrumentation, including mul-tidimensional systems, a number of peaks in a complex fin-gerprint will be unavoidably overlapped due to peak capacityand time constraints [1,2]. However, in contrast to multicom-ponent analysis approaches, where the quality of the data isbased on peak detection and integration, in fingerprint anal-ysis the information of all peaks is used together so that adegree of overlapping peaks is not a concern if the desiredcharacteristic chemical complexity is acquired [4–6].
The crucial steps when developing chromatographic fin-gerprints as well as the strategies for them were very welldescribed by Vander Heyden et al. in recent reviews, among
C© 2013 WILEY-VCH Verlag GmbH & Co. KGaA, Weinheim www.jss-journal.com
38 C. S. Funari et al. J. Sep. Sci. 2014, 37, 37–44
others [1–4]. The challenges during the development of themethod of separation are mostly related to the complexityof herbal extracts, which requires a rational and particularapproach to be fingerprinted. Once the analyst has a cleargoal in mind, a key step to successfully optimize the processof separation for fingerprint purposes is the selection of aresponse that fits his/her goal. The quality of the separationshould be numerically assessed and chromatograms can beranked in order of their desirability using an appropriate re-sponse [6]. Then, in a screening phase, a well-designed set ofexperiments should be carried out in order to evaluate the rel-evance or not of several variables simultaneously in a reducednumber of experiments [1]. Finally, during the so-called opti-mization phase, a new and more robust experimental designshould be performed with the most relevant variables to pre-dict statistically the optimal chromatographic conditions toachieve the optimal response [1, 6].
Among the separation techniques available, HPLC is themost widely utilized for fingerprint purposes, especially whencoupled with UV and MS detectors [1, 4]. This is becauseHPLC is suitable for the analysis of any compound from anextract, is easy to operate, can be fully automated and exhibitshigh resolution, selectivity and sensitivity [1, 3]. The mostused mobile phases in HPLC analyses, however, generatean impact on the environment due to the discharge of non-friendly solvents such as acetonitrile (MeCN) and methanol(MeOH) [1]. It is estimated that 34 million litres of effluent aregenerated every year by HPLC analysis worldwide [7,8]. Suchsolvents can potentially have a negative effect on the health ofthose analysts routinely involved in HPLC analyses, as wellas on the environment [9, 10]. Although this is of particularconcern when the objective of the work is in fact to protectthe environment (e.g. for those working with plants extractsor other bioderived products), analysts addressed fewer at-tempts to replace or eliminate the harmful solvents used inHPLC analysis, and MeOH and MeCN are still preferentiallyused [1, 8]. Ethanol (EtOH) is a biodegradable, nontoxic sol-vent option that can be obtained from renewable resources byfermentation especially as a substitute for MeOH, since bothare in the same group of solvent selectivity [8,11]. It presentsvarious advantageous physical properties (low volatility, mis-cibility with water, and UV cut-off wavelength at 210 nm), butthe high viscosity of EtOH/water mixtures has been identi-fied as its negative characteristic [8,11]. Even for nonstate-of-the-art instruments with lower pressure limits and without acolumn oven, at least two very simple strategies can be used tocircumvent the relative high viscosity of H2O/EtOH mobilephases, thus facilitating the use of EtOH in HPLC withoutany technological development: reducing the mobile phaseflow rate to respect the pressure limit of the system and/oremploying monolithic columns that generate little resistanceto the flow of a mobile phase. However, the replacement ofmore harmful solvents in this way with EtOH while havingdistinct green advantages may not result in a more efficientseparation overall.
Considering the information mentioned above, this workaims to develop a generic, time- and resource-saving approach
compatible with conventional HPLC equipment and columnsto be applied in chromatographic method development toqualitatively fingerprint complex matrices. For that, (i) a newresponse function and a free program to quickly calculate itwere developed, (ii) optimized experimental designs were se-lected, (iii) EtOH was tested as an alternative to the more toxicMeOH, and (iv) a comprehensive hybrid metric that consid-ers both the quality of separation and the greenness of thechemistry involved in HPLC analyses was developed to bet-ter compare methods using different solvents. To check itsapplicability, this integrated strategy was applied in the estab-lishment of chromatographic fingerprints for the leaf extractsof Casearia sylvestris and Bauhinia forficata, both identifiedfor phytotherapeutic product development by the BrazilianHealth Ministry [12].
2 Materials and methods
2.1 Chemicals and reagents
The MeOH, MeCN (J.T. Baker, USA), and EtOH (Merck, Ger-many) used were of HPLC grade. The acetic, formic (Synth,Brazil) and phosphoric acids (Sigma-Aldrich, Germany), andthe trihydrate sodium acetate (Mallinckrodt Baker, Mexico)were of analytical reagent (ACS) grade.
2.2 Plant material
Leaves of C. sylvestris Swartz (Flacourtiaceae) and B. forfi-cata Link (Caesalpiniaceae) were collected from the MedicinalPlant Garden of the Faculty of Pharmaceutical Sciences of theSao Paulo State University (Araraquara, state of Sao Paulo,Brazil) in 2011. Voucher specimens (AGS101 and CSF4, re-spectively) were deposited in the Maria Eneida P. KaufmannState Herbarium of the Institute of Botany (State of Sao Paulo,Brazil) and Herbarium of the Agronomic Institute of Camp-inas (State of Sao Paulo, Brazil), respectively.
2.3 Instrumentation
HPLC analyses were performed by using a HPLC–UV appa-ratus (Shimadzu, Japan), equipped with a degasser (DGU-20A3), two pumps (LC 20AT), an auto-sampler (SIL-20A), UVphotodiode array detector (SPD-M20A), and an oven (CTO-20A). Separation was achieved using a C18 column (Phe-nomenex Synergi Hydro-RP, 250 × 4.6 mm; 4 �m). Chro-matographic data were accessed and processed using theLCSolutions software (Shimadzu, Japan). Statistical analy-ses were performed using Matlab 2011a (Mathworks, USA),OriginPro 8 (OriginLab, USA) and Excel 2007 (Microsoft,USA) software.
2.4 Extraction and concentration
The plant materials were dried in an oven with air circulationat 40�C for 10 days and ground in a knife mill. A portion of
C© 2013 WILEY-VCH Verlag GmbH & Co. KGaA, Weinheim www.jss-journal.com
J. Sep. Sci. 2014, 37, 37–44 Liquid Chromatography 39
43.9 g of dry C. sylvestris leaves was extracted by macerationwith three aliquots of 150 mL of EtOH at 40�C, with constantstirring. A portion of 106.5 g of dry B. forficata leaves wasextracted with ca. 2.7 L of H2O/EtOH 2:1 v/v by percolation[13]. The fluid solutions were collected and concentrated at40�C.
2.5 Pretreatment using SPE
The extracts were treated prior to analysis using SPE (AgilentBond Elut C18, Vac 6 cm3, 500 mg). For both ethanolic leafextract of C. sylvestris (sylvestris_L) and hydroethanolic leafextract of B. forficata (forficata_L), the stationary phases wereactivated with 5.1 mL of EtOH. For sylvestris_L the stationaryphase was equilibrated with 5.1 mL of 15:85 H2O/EtOH v/v,whereas for forficata_L, this equilibration involved 5.1 mL of30:70 H2O/EtOH v/v. For both, the equilibrated stationaryphase was then loaded with ca. 50 mg of the dry extract andeluted with 5.1 mL of the equilibrating solution in order toremove chlorophylls and other low-polarity compounds. Forsylvestris_L, the dried eluate was solubilized in pure EtOH,whereas 2:1 H2O/EtOH v/v was used to solubilize forficata_Lto yield concentrations of 10, 15 and 20 mg/mL.
3 Results
3.1 Screening variables—fractional factorial designs
Fractional factorial designs consist of a statistically selectedfraction of the experimental runs of a full factorial design [14].They are useful to discern between relevant and irrelevantvariables in a reduced number of experiments (thus, requir-ing less resources such as solvents and energy) compared to afull factorial design. Six factors were screened for sylvestris_Land seven for forficata_L, including the concentration of thegreener EtOH in binary or ternary mobile phases (Table 1).
Table 1. Factors and levels investigated in the screening designs
Factor Units sylvestris_L forficata_L
Level Level−1 +1 −1 +1
X1: Initial percentage of B v/va) % 5 30 5 20X2: Gradient time Min 30 60 30 60X3: Conc. of EtOH in B v/va) % 0 100 0 100X4: Flow rate mL/min. 0.6 0.8 0.6 0.8X5: pH of buffer (A)b) — — — 3.6 4.4X5: Conc. of formic acid in A v/vb) % 0 0.5 — —X6: Sample conc. mg/mL 10 20 10 20X7: Final percentage of B v/v a) % — — 50 70
a) B is MeOH or EtOH in binary mobile phase or a mixture of themin ternary mobile phase.b) A is the aqueous solvent of the mobile phase.
Two-level fractional factorial designs (2IV6–2 and 2III
7–3 forsylvestris_L and forficata_L, respectively) were used, with 16experiments per design [14]. During this initial step, the num-ber of peaks obtained from a given chromatogram was theresponse, with peaks constituting all manifestations with aminimal S/N of 3 [4]. Column equilibration time and injec-tion volume were fixed at 30 min and 20 �L, respectively.
In the range evaluated, X1, X2, and X3 (Table 1) provedto be statistically significant at a confidence level of 95% forsylvestris_L. Linear adjustment using only these three factorsand without consideration of interactions revealed an R2 of0.89 and explained 89.49% of the variance, which shows theimportance of these factors. For forficata_L, X1, X2, and X7
were significant (at a confidence level of 95%). Linear ad-justment of these factors yielded an R2 of 0.90, and theseexplained 89.84% of the variance.
For both extracts, flow rates of up to 0.8 mL/min (factorX4 of Table 1) were accommodated without exceeding theestablished HPLC pressure limit (270 bar) even when EtOHwas the only organic solvent in the mobile phase.
3.2 Optimization of chromatographic conditions by a
novel response
Once the relevant variables were determined, a central com-posite design (CCD) was applied for the optimization of thechromatographic conditions (Table 2) [14]. CCD is a betteralternative to the full three-level factorial design, since it de-mands a smaller number of experiments, thus, requiring lessresource such as solvent and energy while providing compa-rable results [14]. Variables that proved to be statistically irrel-evant in the screening step were fixed. For sylvestris_L thesewere flow rate (0.7 mL/min), concentration of formic acid(0%) and sample concentration (20 mg/mL) (Table 1). Forforficata_L, these were concentration of EtOH in B (100%),flow rate (0.7 mL/min), pH of buffer (4.0) and sample con-centration (20 mg/mL) (Table 1).
During this optimization step, the number of peaks ob-tained from a given chromatogram was not the only pa-rameter taken into consideration, but an approach calledGreen Chromatographic Fingerprint has been proposed. The
Table 2. Factors and levels included in the Central Composite De-signs
Factors Units −1.68 −1 0 +1 +1.68
X1: Initial percentage of B v/va) % 3.3 5 7.5 10 11.7X2: Gradient time Min 28.2 35 45 55 61.8X3: Concentration of EtOH in B v/vb) % 0 20 50 80 100X7: Final percentage of B v/vc) % 48.2 55 65 75 81.8
a) B is MeOH or EtOH in binary mobile phase or a mixture of themin ternary mobile phase.b) This factor was applied only for sylvestris_L.c) This factor was applied only for forficata_L.
C© 2013 WILEY-VCH Verlag GmbH & Co. KGaA, Weinheim www.jss-journal.com
40 C. S. Funari et al. J. Sep. Sci. 2014, 37, 37–44
delimited goals of this approach were: (i) to find a trade-off among number of peaks, their distribution across thechromatogram and time of analysis in an optimized method;(ii) to speed up both the extraction of information from agiven chromatogram and the calculation of the response it-self used to rank chromatograms for optimization purposes;(iii) to find a response function useful to the development ofthe first dimension of 2D chromatography (where a more ho-mogeneous distribution of peaks across the chromatogrammentioned in (i) is desirable) in future works, since a newgeneration of multidimensional fingerprints has been gain-ing importance; and (iv) to be compatible with the greenerbut more viscous EtOH when conventional HPLC equipmentand columns are used, thus being applicable to a large num-ber of analysts.
As we could not find in the literature a response functionfor the separation of a complex matrix which fits all the char-acteristics outlined above, this concept was implemented forthe first time here as the green chromatographic fingerprint-ing response (GCFR; Eq. (1a)), and provides a metric for thequantification of a chromatographic run:
GCFR =nx(FP/MP)(n/t) (1a)
GCFR = (nx+1/t)(FP/MP) (1b)
where n is the total number of peaks of a given chromatogram,x is the exponent of n, t is the total run time, FP is thenumber of peaks in the section of the chromatogram withfewer peaks and MP is the number of peaks in the section ofthe chromatogram of equal length but with more peaks.
Equation (1a) was idealized as a product of the three termssince multiplication has the meaning of “and” (whereas ad-dition has the meaning of “or”) and in this case all termswere simultaneously important for our application. The firsttwo terms of Equation (1a) refer to the quality parameters forfingerprints. In the first term, n indicates the total numberof peaks revealed in a given run, with its weight indicated bythe exponent assigned to it (x = 2 in the example presentedhere, but one could decrease or increase the importance of nby using x = 0 or 1, depending on the goal of the investiga-tion). The second term of Equation (1a) FP/MP indicates howevenly this information is distributed between equal sectionsof the chromatogram. Here the part of the chromatogramfrom the dead time t0 to the final time t is divided into equalsections identifiable on the chromatogram (into two equalsections in the examples explored here). For this, the closerthe value is to one the better, indicating that a more homo-geneous distribution of the peaks between the sections wasacquired. Values under one will contribute to lowering thefinal score given by GCFR, thus acting as a penalty. On theother hand, the third term n/t reveals the amount of informa-tion (peaks) acquired per unit of time. The higher this ratiothe better, since it will indicate that more peaks were acquiredper unit of time, improving the score given by GCFR (thus,acting as a bonus). This is especially relevant in the develop-ment of chromatographic methods for complex matrices such
as plant extracts, in which the ratio between information ac-quired and the duration of analysis should be considered. Inother words, this term n/t indicates how efficient the processis. It might also act as a rapid estimation of the informa-tion acquired per resource consumed (solvent and energy,for example) in the separation process. Equation (1a) can berewritten as a product of two terms as Equation (1b). In thisway the trade-off between number of peaks and time of anal-ysis can be easily visualized in the first term. According tothe value of x, an equal (x = 0) or higher (x ≥ 1) weight couldbe attributed to the number of peaks (n) relative to time (t).A free Excel R©-based program to quickly calculate the GCFRscore is provided in the Supporting Information.
Table 3 shows the designs performed to create a mathe-matical model for the response GCFR as a function of initialpercentage of B (X1), gradient time (X2), concentration ofEtOH in B (X3, only for sylvestris_L) or final percentage of B(X7, only for forficata_L).
From the experiments developed with sylvestris_L(Table 3), the mathematical model (Eq. (2), 90% confidence)was found to be as follows:
y = 9948.66± 262.14
− 1073.93± 309.11
x1 + 1817.31± 309.11
x2 − 578.75± 309.11
x3
− 924.61± 403.99
x2x3 + 825.54± 403.99
x1x2x3 (2)
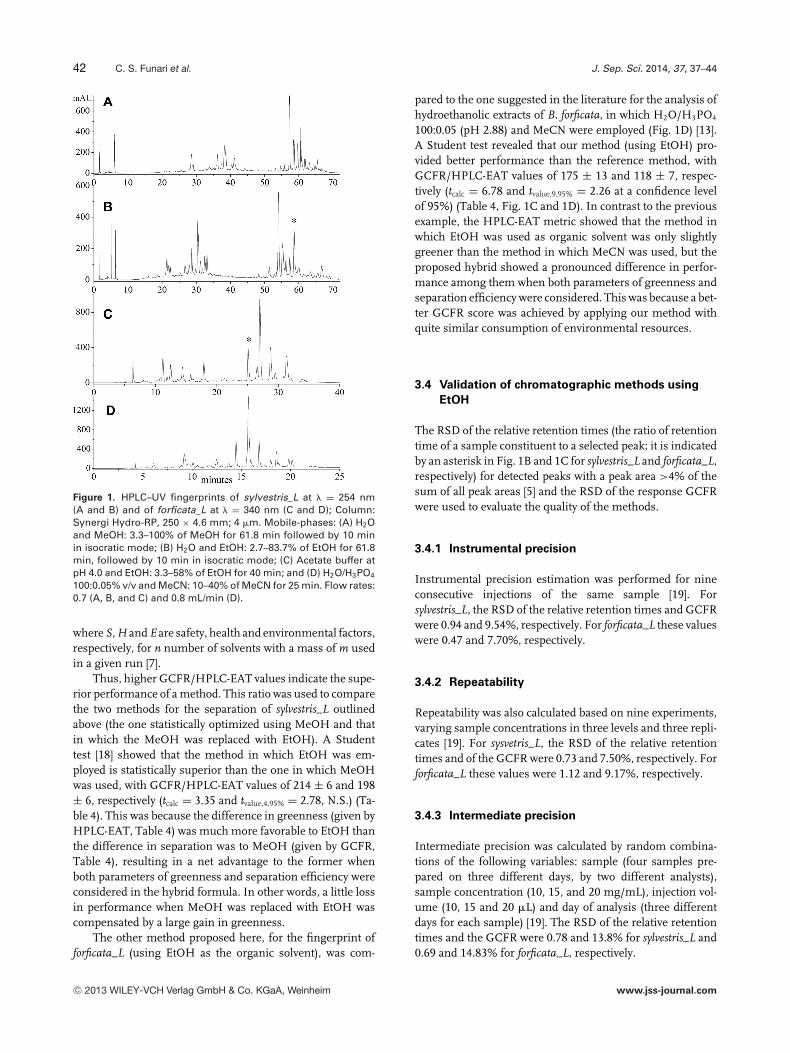
with an R2 value of 0.82 and 95.3% of the explainable varia-tion. Once the mathematical model of the analytical processwas created (Eq. (2)), it should be possible to reach the math-ematical optimum value of independent variables to obtainthe best response (y). The predicted optimum values for thethree variables for sylvestris_L led to the following gradient:3.3 to 100% of pure MeOH in 61.8 min; this result was ap-plied in triplicate, leading to a GCFR of 17936 ± 520 (Table 4).This average value surpassed all the experiments performedpreviously with this sample. A representative chromatogramis shown in Fig. 1A.
Although the predicted optimum point pointed by Equa-tion (2) led to pure MeOH as B, further efforts were ad-dressed to make these results greener. MeOH was replacedwith EtOH, which required the adjustment of the eluotropicstrengths at the beginning and end of the gradient; thesemodifications led to a reduction of 16.4% in the consumptionof the organic solvent during the chromatographic analysis,since EtOH has higher eluotropic strength than MeOH inRP-HPLC. The resulting GCFR was 16626 ± 445 (Table 4,Fig. 1B). These methods were later directly compared hereby employing a hybrid formula also proposed in this work.The first half of the chromatogram of sylvestris_L (Fig. 1B) ismainly dominated by compounds with UV spectra typical offlavonoids, whereas the second half presents peaks with UVspectra typical of clerodane diterpenes, classes of substancesthat have been reported for C. sylvestris [15, 16].
From the experiments developed with forficata_L, themodel (Eq. (3), 90% confidence level) was found to be as
C© 2013 WILEY-VCH Verlag GmbH & Co. KGaA, Weinheim www.jss-journal.com
J. Sep. Sci. 2014, 37, 37–44 Liquid Chromatography 41
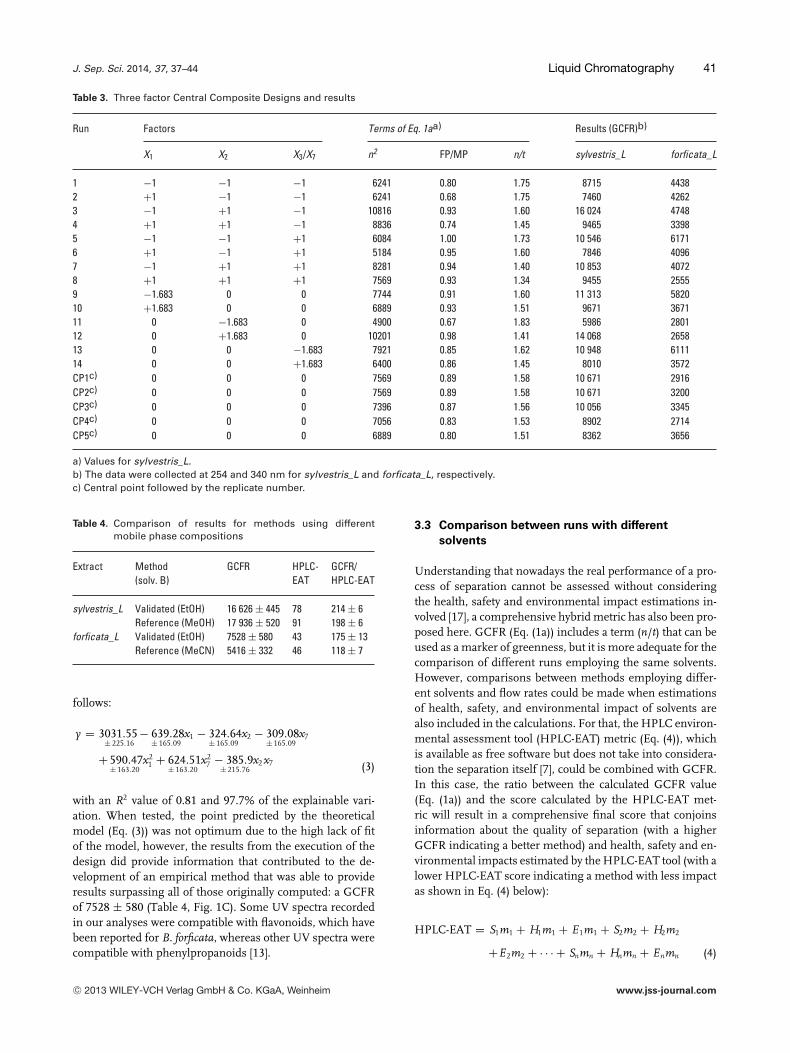
Table 3. Three factor Central Composite Designs and results
Run Factors Terms of Eq. 1aa) Results (GCFR)b)
X1 X2 X3/X7 n2 FP/MP n/t sylvestris_L forficata_L
1 −1 −1 −1 6241 0.80 1.75 8715 44382 +1 −1 −1 6241 0.68 1.75 7460 42623 −1 +1 −1 10816 0.93 1.60 16 024 47484 +1 +1 −1 8836 0.74 1.45 9465 33985 −1 −1 +1 6084 1.00 1.73 10 546 61716 +1 −1 +1 5184 0.95 1.60 7846 40967 −1 +1 +1 8281 0.94 1.40 10 853 40728 +1 +1 +1 7569 0.93 1.34 9455 25559 −1.683 0 0 7744 0.91 1.60 11 313 582010 +1.683 0 0 6889 0.93 1.51 9671 367111 0 −1.683 0 4900 0.67 1.83 5986 280112 0 +1.683 0 10201 0.98 1.41 14 068 265813 0 0 −1.683 7921 0.85 1.62 10 948 611114 0 0 +1.683 6400 0.86 1.45 8010 3572CP1c) 0 0 0 7569 0.89 1.58 10 671 2916CP2c) 0 0 0 7569 0.89 1.58 10 671 3200CP3c) 0 0 0 7396 0.87 1.56 10 056 3345CP4c) 0 0 0 7056 0.83 1.53 8902 2714CP5c) 0 0 0 6889 0.80 1.51 8362 3656
a) Values for sylvestris_L.b) The data were collected at 254 and 340 nm for sylvestris_L and forficata_L, respectively.c) Central point followed by the replicate number.
Table 4. Comparison of results for methods using differentmobile phase compositions
Extract Method GCFR HPLC- GCFR/(solv. B) EAT HPLC-EAT
sylvestris_L Validated (EtOH) 16 626 ± 445 78 214 ± 6Reference (MeOH) 17 936 ± 520 91 198 ± 6
forficata_L Validated (EtOH) 7528 ± 580 43 175 ± 13Reference (MeCN) 5416 ± 332 46 118 ± 7
follows:
y = 3031.55± 225.16
− 639.28± 165.09
x1 − 324.64± 165.09
x2 − 309.08± 165.09
x7
+ 590.47± 163.20
x21 + 624.51
± 163.20x2
7 − 385.9± 215.76
x2x7 (3)
with an R2 value of 0.81 and 97.7% of the explainable vari-ation. When tested, the point predicted by the theoreticalmodel (Eq. (3)) was not optimum due to the high lack of fitof the model, however, the results from the execution of thedesign did provide information that contributed to the de-velopment of an empirical method that was able to provideresults surpassing all of those originally computed: a GCFRof 7528 ± 580 (Table 4, Fig. 1C). Some UV spectra recordedin our analyses were compatible with flavonoids, which havebeen reported for B. forficata, whereas other UV spectra werecompatible with phenylpropanoids [13].
3.3 Comparison between runs with different
solvents
Understanding that nowadays the real performance of a pro-cess of separation cannot be assessed without consideringthe health, safety and environmental impact estimations in-volved [17], a comprehensive hybrid metric has also been pro-posed here. GCFR (Eq. (1a)) includes a term (n/t) that can beused as a marker of greenness, but it is more adequate for thecomparison of different runs employing the same solvents.However, comparisons between methods employing differ-ent solvents and flow rates could be made when estimationsof health, safety, and environmental impact of solvents arealso included in the calculations. For that, the HPLC environ-mental assessment tool (HPLC-EAT) metric (Eq. (4)), whichis available as free software but does not take into considera-tion the separation itself [7], could be combined with GCFR.In this case, the ratio between the calculated GCFR value(Eq. (1a)) and the score calculated by the HPLC-EAT met-ric will result in a comprehensive final score that conjoinsinformation about the quality of separation (with a higherGCFR indicating a better method) and health, safety and en-vironmental impacts estimated by the HPLC-EAT tool (with alower HPLC-EAT score indicating a method with less impactas shown in Eq. (4) below):
HPLC-EAT = S1m1 + H1m1 + E1m1 + S2m2 + H2m2
+E2m2 + · · · + Snmn + Hnmn + Enmn (4)
C© 2013 WILEY-VCH Verlag GmbH & Co. KGaA, Weinheim www.jss-journal.com
42 C. S. Funari et al. J. Sep. Sci. 2014, 37, 37–44
Figure 1. HPLC–UV fingerprints of sylvestris_L at � = 254 nm(A and B) and of forficata_L at � = 340 nm (C and D); Column:Synergi Hydro-RP, 250 × 4.6 mm; 4 �m. Mobile-phases: (A) H2Oand MeOH: 3.3–100% of MeOH for 61.8 min followed by 10 minin isocratic mode; (B) H2O and EtOH: 2.7–83.7% of EtOH for 61.8min, followed by 10 min in isocratic mode; (C) Acetate buffer atpH 4.0 and EtOH: 3.3–58% of EtOH for 40 min; and (D) H2O/H3PO4
100:0.05% v/v and MeCN: 10–40% of MeCN for 25 min. Flow rates:0.7 (A, B, and C) and 0.8 mL/min (D).
where S, H and E are safety, health and environmental factors,respectively, for n number of solvents with a mass of m usedin a given run [7].
Thus, higher GCFR/HPLC-EAT values indicate the supe-rior performance of a method. This ratio was used to comparethe two methods for the separation of sylvestris_L outlinedabove (the one statistically optimized using MeOH and thatin which the MeOH was replaced with EtOH). A Studenttest [18] showed that the method in which EtOH was em-ployed is statistically superior than the one in which MeOHwas used, with GCFR/HPLC-EAT values of 214 ± 6 and 198± 6, respectively (tcalc = 3.35 and tvalue,4,95% = 2.78, N.S.) (Ta-ble 4). This was because the difference in greenness (given byHPLC-EAT, Table 4) was much more favorable to EtOH thanthe difference in separation was to MeOH (given by GCFR,Table 4), resulting in a net advantage to the former whenboth parameters of greenness and separation efficiency wereconsidered in the hybrid formula. In other words, a little lossin performance when MeOH was replaced with EtOH wascompensated by a large gain in greenness.
The other method proposed here, for the fingerprint offorficata_L (using EtOH as the organic solvent), was com-
pared to the one suggested in the literature for the analysis ofhydroethanolic extracts of B. forficata, in which H2O/H3PO4
100:0.05 (pH 2.88) and MeCN were employed (Fig. 1D) [13].A Student test revealed that our method (using EtOH) pro-vided better performance than the reference method, withGCFR/HPLC-EAT values of 175 ± 13 and 118 ± 7, respec-tively (tcalc = 6.78 and tvalue,9,95% = 2.26 at a confidence levelof 95%) (Table 4, Fig. 1C and 1D). In contrast to the previousexample, the HPLC-EAT metric showed that the method inwhich EtOH was used as organic solvent was only slightlygreener than the method in which MeCN was used, but theproposed hybrid showed a pronounced difference in perfor-mance among them when both parameters of greenness andseparation efficiency were considered. This was because a bet-ter GCFR score was achieved by applying our method withquite similar consumption of environmental resources.
3.4 Validation of chromatographic methods using
EtOH
The RSD of the relative retention times (the ratio of retentiontime of a sample constituent to a selected peak; it is indicatedby an asterisk in Fig. 1B and 1C for sylvestris_L and forficata_L,respectively) for detected peaks with a peak area >4% of thesum of all peak areas [5] and the RSD of the response GCFRwere used to evaluate the quality of the methods.
3.4.1 Instrumental precision
Instrumental precision estimation was performed for nineconsecutive injections of the same sample [19]. Forsylvestris_L, the RSD of the relative retention times and GCFRwere 0.94 and 9.54%, respectively. For forficata_L these valueswere 0.47 and 7.70%, respectively.
3.4.2 Repeatability
Repeatability was also calculated based on nine experiments,varying sample concentrations in three levels and three repli-cates [19]. For sysvetris_L, the RSD of the relative retentiontimes and of the GCFR were 0.73 and 7.50%, respectively. Forforficata_L these values were 1.12 and 9.17%, respectively.
3.4.3 Intermediate precision
Intermediate precision was calculated by random combina-tions of the following variables: sample (four samples pre-pared on three different days, by two different analysts),sample concentration (10, 15, and 20 mg/mL), injection vol-ume (10, 15 and 20 �L) and day of analysis (three differentdays for each sample) [19]. The RSD of the relative retentiontimes and the GCFR were 0.78 and 13.8% for sylvestris_L and0.69 and 14.83% for forficata_L, respectively.
C© 2013 WILEY-VCH Verlag GmbH & Co. KGaA, Weinheim www.jss-journal.com
J. Sep. Sci. 2014, 37, 37–44 Liquid Chromatography 43
4 Discussion
In order to exemplify how the final GCFR works (Eq. (1a)), thevalue obtained for each one of its three terms together withthe final GCFR score for the runs performed with sylvestris_Lare shown in Table 3. For example, run 4 presented 94 peaks(n2 = 8836), which ranked it as the top three among the14 experiments of this series (Table 3, 1st term of Eq. (1a)).However, the distribution of peaks between the two halves ofthe chromatogram and the number of peaks per minute (2ndand 3rd terms of Eq. (1a)) were comparatively very low, withvalues of 0.74 and 1.45, respectively. Thus, the initial value of8836 given by the first term of Equation (1a) was only slightlyincreased to reach a final GCFR score of 9465, which was onlythe eighth value among the fourteen experiments of the CCD(Table 3). On the other hand, run 5 showed 78 peaks (n2 =6084), the 12th value of the first term of Equation (1a) amongthe 14 experiments of this series, but the best distribution ofthese peaks between the two halves of the chromatogram (2ndterm was 1.0) and a relatively efficient process of separation(1.73 peaks/min, 3rd term of Eq. (1a)) resulted in run 5 beingpromoted to the sixth value of the series, with a final GCFRscore of 10 546 (Table 3). Comparing runs 8 and CP1 (Table 3),both presented 87 peaks (n2 = 7569). The peaks presented inrun 8 were slightly better distributed between the two halvesof the chromatogram (2nd term of Eq. (1a), with values of 0.93and 0.89, respectively), but the CP1 showed a most prominentadvantage regarding the efficiency of the method, with 1.58peaks per minute against 1.34 of run 8 (17.9% more efficient).That guaranteed to CP1 a better final score compared withrun 8 (10 671 and 9455, respectively, Table 3).
There are some other responses proposed in literaturefor multicomponent sample separations. They are based onoverall resolution and in general are applicable for samplescontaining a limited and known number of peaks, wherethe separation of all compounds is desired [6]. Their advan-tages and drawbacks were discussed by Klein and Rivera andAlaerts et al. among others [4, 6]. Responses based on theproduct of resolution between consecutive peak pairs lead tofalse-positive results when peaks are coeluting in one chro-matogram and slightly separated in other since the resolu-tion product should be higher for the first case, which wouldwrongly be better ranked [6]. On the other hand, those basedon the sum of resolutions may give wrong impressions whensome compounds show high-resolution values [4, 5]. For ex-ample, for three compounds when in one chromatogram acoelution of two of them is observed, but they are very wellseparated from the third one (Rs = 4, for example). In anotherchromatogram, all three compounds may be separated withresolution Rs = 1 between consecutive peaks. In that case thefirst chromatogram would present �Rsi = 4, thus being betterranked than the second one (�Rsi = 2). This means that suchresponse functions are not necessarily suitable for fingerprintapplications, where usually the number of compounds is un-known, baseline separation of all compounds is not practicallyfeasible and coelution of peaks (without necessarily negativelyaffecting the quality of the fingerprint if no quantification of
co-eluting compounds is required) is expected even whenmultidimensional chromatography is applied [2, 4, 5]. Afterall, responses based on estimations of resolution of severalconsecutive peak pairs may be time consuming, which clearlyundermines one of our main goals described above, (ii). As analternative, a response called Hierarchical ChromatographicResponse Function, in which only the resolution of the leastresolved pair of peaks is taken into consideration, was em-ployed to develop a fingerprint method for a Ginkgo biloba ex-tracts [5]. From the output value of this response, the numberof peaks, the worst resolution and time of analysis are appar-ent [5]. However, the final score for each analysis is almostcompletely dominated by the number of peaks. The othertwo terms serve only to break ties when two runs show thesame number of peaks indicating that this response does notrepresent an alternative to statistical optimization developedusing only the total number of peaks. Indeed, the authorsused it not to predict an optimal condition from a mathemat-ical model but to choose one experimental condition fromthe experimental design [5]. The drawbacks for these differ-ent approaches probably explain why the number of peaks isthe most applied response in fingerprint developments forqualitative purposes [1, 4]. In addition to the separation per-formance for qualitative fingerprinting purposes revealed bythe new response GCFR proposed here (the performance isunderstood here as a trade-off among the number of peaks,their distribution across the chromatogram, and the time perpeak detected), the data necessary for the calculation of thisresponse were conveniently accessed (these data can be ex-tracted in <1 min. from a given chromatogram), and thecalculation itself were easily and quickly performed.
The observed RSD for relative retention time was muchlower than that observed for the GCFR response (Section3.4). This is due to the fact that for the latter, the RSD valueobserved expresses the sum of the individual RSD valuesof the terms from Eq. (1a) and also because the number ofpeaks (n) is elevated by three when x = 2 (Eq. (1a)) as inour examples; thus variations in number of peaks amongreplicates will lead to higher variations in GCFR.
5 Concluding remarks
This work introduces a rational and generic procedure to fin-gerprint complex matrices for qualitative purposes througha green and time-saving approach from the beginning tothe end of the method development. For that, resource- andtime-saving experimental designs were selected; an alterna-tive safer organic solvent (EtOH) was tested and a time savingresponse (GCFR) was developed and employed.
It also provided a strategy to the assessment of the perfor-mance of a method considering both information about thequality and efficiency of the process of separation (given bythe GCFR) and its impact from the point of view of health,safety, and the environment (given by the HPLC-EAT). Fromthe combination of both metrics (GCFR/HPLC-EAT), a com-prehensive picture of the process of separation developed
C© 2013 WILEY-VCH Verlag GmbH & Co. KGaA, Weinheim www.jss-journal.com
44 C. S. Funari et al. J. Sep. Sci. 2014, 37, 37–44
here could be achieved and comparisons between methodsusing different solvents and flow rates could be performedin a contemporary way, since the achievement of more sus-tainable process is a trend also in analytical scale. It is alsoimportant to highlight that it is not limited to the solventsand samples considered in our examples.
This work also demonstrates that simple and cost-effective strategies that do not require any instrument mod-ifications can be used by analysts to circumvent problemsrelated to the migration to more sustainable methods. Here,the reduction of mobile phase flow rate to respect the pres-sure limit of a conventional HPLC system equipped with acommercial packed column was used to develop two methodsin which the more viscous mixtures of water and EtOH wereemployed for the mobile phases. The application of this strat-egy might be suitable in ultra HPLC as well. Although thesesystems can support higher pressures than traditional HPLCsystems, the new generations of packed columns presentssub 2 �m packing materials and are generally developed foranalyses in which the less viscous MeCN and MeOH are usedas the organic solvent of the mobile phase.
GCFR (with x = 0 or 1) may also prove useful in thedevelopment of 2D chromatographic methods in which a ho-mogeneous distribution of peaks in the first dimension isdesirable. For this purpose, further work in which a chro-matogram is divided in more sections (thus, enhancing theweight given to the second term of Eq. (1a)) is in developmentby our group.
Analysts in general are encouraged to include environ-mental and safety parameters in work routines. Such a col-lective effort may contribute to a change in the presentculture of solvent choice, reducing the amount of harmfulsolvents used per mass of compound identified or isolatedand preserving the health of students and researchers in-volved in the research. In our opinion, denominations suchas high-performance or ultra high performance chromatogra-phy should be revised since it could become anachronistic ifno information about sustainability was considered togetherwith traditional parameters of separation.
The authors would like to thank the Sao Paulo ResearchFoundation (FAPESP) for the postdoctoral fellowship (of C.S.F.)and for the partial financial support (proc. 2010/16520-5 and2012/15844-7), the Brazilian Coordination for the Improvementof Personnel in Higher Education (CAPES) and the BrazilianNational Council for Scientific and Technological Development(CNPq) for the student and research fellowships (of A.M.A.,A.J.C., and R.L.C.), and the Australian Research Council Dis-covery Funding Scheme for the partial financial support and for aFuture Fellowship (of E.F.H.). The authors also acknowledge theassistance of the mathematician Professor Jorge M. V. Capela ofthe Sao Paulo State University (IQ-UNESP) for the discussionabout the new response presented in this work.
The authors have declared no conflict of interest.
6 References
[1] Tistaert, C., Dejaegher, B., Vander Heyden, Y., Anal.Chim. Acta 2011, 690, 148–161.
[2] Liang, Y., Xie, P., Chau, F., J. Sep. Sci. 2010, 33,410–421.
[3] Liu, S., Yi, L. Z., Liang, Y. Z., J. Sep. Sci. 2008, 31,2113–2137.
[4] Alaerts, G., Dejaegher, B., Smeyers-Verbeke, J., Van-der Heyden, Y., Comb. Chem. High Throughput Screen.2010, 13, 900–922.
[5] Ji, Y. B., Xu, Q. S., Hu, Y. Z., Vander Heyden, Y., J. Chro-matogr. A 2005, 1066, 97–104.
[6] Klein, E. J., Rivera, S. L., J. Liq. Chromatogr. Relat. Tech-nol. 2000, 23, 2097–2121.
[7] Gaber, Y., Tornvall, U., Kumar, M. A., Ali Amin, M., Hatti-Kaul, R., Green Chem. 2011, 13, 2021–2025.
[8] Welch, C. J., Wu, N., Biba, M., Hartman, R., Brkovic,T., Gong, X., Helmy, R., Schafer, W., Cuff, J.,Pirzada, Z., Zhou, L., Trends Anal. Chem. 2010, 29,667–680.
[9] Pritchard, J. D., Health Protection Agency Compendiumof Chemical Hazards: Methanol, Public Health England2011.
[10] Henderson, R. K., Jimenez-Gonzalez, C., Constable, D. J.C., Alston, S. R., Inglis, G. G. A., Fisher, G., Sherwood,J., Binks, S. P., Curzons, A. D., Green Chem. 2011, 13,854–862.
[11] Sandra, P., Vanhoenacker, G., David, F., Sandra, K.,Pereira, A. S., LC GC Europe 2010, 23, 242–259.
[12] Brasil, M. S. d., Relacao Nacional de Plantas Medici-nais de Interesse ao SUS, Ministerio da Saude do BrasilDAF/SCTIE/MS, Brasilia 2009.
[13] Cunha, A. M., Menon, S., Menon, R., Couto, A. G.,Burger, C., Biavatti, M. W., Phytomedicine 2010, 17,37–41.
[14] Ferreira, S. L., Bruns, R. E., da Silva, E. G., Dos Santos,W. N., Quintella, C. M., David, J. M., de Andrade, J. B.,Breitkreitz, M. C., Jardim, I. C., Neto, B. B., J. Chromatogr.A 2007, 1158, 2–14.
[15] Raslan, D. S., Jamal, C. M., Duarte, D. S., Borges,M. H., de Lima, M. E., Boll. Chim. Farm. 2002, 141,457–460.
[16] Santos, A. G., Ferreira, P. M. P., Junior, G. M. V., Perez, C.C., Tininis, A. G., Silva, G. H., Bolzani, V. S., Costa-Lotufo,L. V., Pessoa, C. O., Cavalheiro, A. J., Chem. Biodivers.2010, 7, 205–215.
[17] Kaljurand, M., Koel, M., in: Guardia, M. d. l., Gar-rigues, S. (Eds.), Challenges in Green Analytical Chem-istry, Royal Society of Chemistry, Cambridge 2011,pp. 168–198.
[18] Skoog, D. A., West, D. M., Holler, F. J., Crouch, S. R.,Fundamentos de Quımica Analıtica, Cengage Learning,Sao Paulo 2008.
[19] ICH Harmonised Tripartite Guideline: Validation of Ana-lytical Procedures Q2 (R1), Step 4 Version, ICH, Geneva,Switzerland 2005.
C© 2013 WILEY-VCH Verlag GmbH & Co. KGaA, Weinheim www.jss-journal.com