Embed Size (px)
Citation preview

by ROB WATSONExecutive Editor
REPORT2010
GREEN BUILDING
IMPACT MARKET
AN
D
Defining and accelerating the business of sustainability.

2 © 2010 GreenBiz Group Inc. (www.greenbizgroup.com). May be reproduced for noncommercial purposes only, provided credit is given to GreenBiz Group Inc. and includes this copyright notice.
Co
nten
ts
Researched and Written by Rob Watson
For GreenBiz Group:
Joel Makower, Chairman and Executive Editor
Matthew Wheeland, Managing Editor
Leslie Guevarra, Associate Editor
Pete May, Chief Executive Officer
Eric Faurot, President and Chief Strategist
Samuel Smith, Marketing Manager
Infographics by Seth Fields
Thanks to Our Sponsors:
© 2010 GreenBiz Group Inc. (www.greenbizgroup.com). May be reproduced for noncommercial purposes only, provided credit is given to GreenBiz Group Inc. and includes this copyright notice.
Executive Summary ............................................................................. 3
LEED Market Trends ...................................................................................5
Homes ......................................................................................................11
International Market .................................................................................14
Site and Land Use Impacts .......................................................................16
Water Efficiency Impacts ..........................................................................19
Energy Impacts .........................................................................................21
Materials Impacts .....................................................................................29
Indoor Environmental Quality ..................................................................31
The Big Picture .........................................................................................34
Appendix: Methodology ................................................................... 37
About the Author .....................................................................................43
About the sponsors ..................................................................................44
About GreenBiz Group .............................................................................45

3 © 2010 GreenBiz Group Inc. (www.greenbizgroup.com). May be reproduced for noncommercial purposes only, provided credit is given to GreenBiz Group Inc. and includes this copyright notice.
Confounded Expectations Redux We’re really wearing this one out, using it two years in a row, but there’s just no way around it… The great American philosopher Yogi Berra once noted: “It’s tough to make predictions, especially about the future.” In 2009, we assumed that the phenomenal growth we had seen the previous three years was not abnormal (even though it exceeded the total new floor area added in the US last year) and would somehow continue in some fashion going forward. Clearly, economic realities proved us wrong.
Our predictions of continued strong growth in LEED registrations were completely turned on their head as 2010 brought precipitous declines. Nonetheless, our certifications forecast remain steadfast: we came close with last year’s total floor area prediction, though LEED New Construction and LEED Core & Shell did not grow as much as anticipated.
New Certifications Break Records, but Falls Short of Registration Boom There is good news on the certification front: This year’s total certified floor area nearly equals the previous ten years’ certified floor area combined. Last year, LEED for Existing Buildings Operations and Maintenance (EBOM) certified half (49 percent) of all the domestic floor area in the LEED system and a quarter of the international projects to equal the certified floor area of LEED for New Construction (NC) and LEED for Core & Shell (CS) combined.
Also, given that certifications almost equaled registrations this year, even more impressive is that certified newly-built LEED floor area exceeded 20 percent of new construction additions. All this notwithstanding, in order to keep pace with earlier registration rates, certifications were going to have to triple instead of only double. So, the sad result is that the percent of LEED projects “graduating” to certification fell below the 70 percent goal that we believe represents a healthy graduation rate.
Appropriately Mixed Metaphors: Registrations Tank, but Is that Really So Bad? Any “green lifeboat” we were positing last year was simply a mirage. The spike of registrations most likely was some sort of panic or “irrational exuberance” driven by the sunsetting of Version 2.2 or some last-ditch gambit to somehow ride the green wave into financing or whatever.
Our year-end forecast of LEED registrations has them down almost 70 percent compared to last year (NC and CS are off 80 percent and 90 percent in the U.S. respectively). As bad as that sounds, these lower registration numbers actually represent about 22 percent of the total expected new floor area to be added this year, which puts LEED near the top of its anticipated full market saturation point of 25 percent of new construction.
LEED EB is the Certification Champion, CI Mirrors LEED Overall In 2010 LEED EBOM certified almost 50 percent more floor area—over 80 million square feet—than did LEED NC, growing nearly 80 percent year on year. Cumulatively, since its launch in 2004, LEED EBOM has certified nearly the same total floor area as LEED NC since its launch in 2000. In spite of this success, we believe that LEED EBOM is less than halfway to where it needs to be to sufficiently contribute to minimizing climate change.
LEED CI showed similar schizophrenia as the rest of the system, growing certified floor area by nearly 60 percent, while registered floor area declined by 65 percent.
Executive Summary ............................................................................. 3
LEED Market Trends ...................................................................................5
Homes ......................................................................................................11
International Market .................................................................................14
Site and Land Use Impacts .......................................................................16
Water Efficiency Impacts ..........................................................................19
Energy Impacts .........................................................................................21
Materials Impacts .....................................................................................29
Indoor Environmental Quality ..................................................................31
The Big Picture .........................................................................................34
Appendix: Methodology ................................................................... 37
About the Author .....................................................................................43
About the sponsors ..................................................................................44
About GreenBiz Group .............................................................................45
Exe
cuti
ve S
umm
ary
4 © 2010 GreenBiz Group Inc. (www.greenbizgroup.com). May be reproduced for noncommercial purposes only, provided credit is given to GreenBiz Group Inc. and includes this copyright notice.
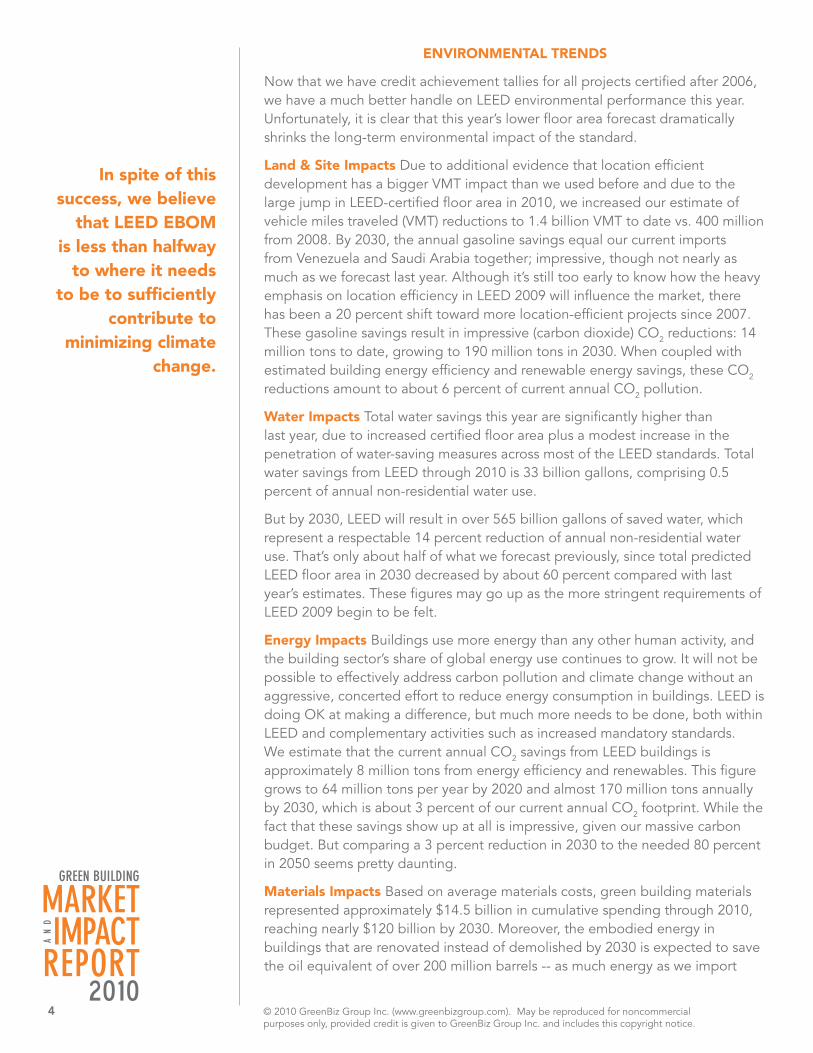
ENVIRONMENTAL TRENDS
Now that we have credit achievement tallies for all projects certified after 2006, we have a much better handle on LEED environmental performance this year. Unfortunately, it is clear that this year’s lower floor area forecast dramatically shrinks the long-term environmental impact of the standard.
Land & Site Impacts Due to additional evidence that location efficient development has a bigger VMT impact than we used before and due to the large jump in LEED-certified floor area in 2010, we increased our estimate of vehicle miles traveled (VMT) reductions to 1.4 billion VMT to date vs. 400 million from 2008. By 2030, the annual gasoline savings equal our current imports from Venezuela and Saudi Arabia together; impressive, though not nearly as much as we forecast last year. Although it’s still too early to know how the heavy emphasis on location efficiency in LEED 2009 will influence the market, there has been a 20 percent shift toward more location-efficient projects since 2007. These gasoline savings result in impressive (carbon dioxide) CO2 reductions: 14 million tons to date, growing to 190 million tons in 2030. When coupled with estimated building energy efficiency and renewable energy savings, these CO2 reductions amount to about 6 percent of current annual CO2 pollution.
Water Impacts Total water savings this year are significantly higher than last year, due to increased certified floor area plus a modest increase in the penetration of water-saving measures across most of the LEED standards. Total water savings from LEED through 2010 is 33 billion gallons, comprising 0.5 percent of annual non-residential water use.
But by 2030, LEED will result in over 565 billion gallons of saved water, which represent a respectable 14 percent reduction of annual non-residential water use. That’s only about half of what we forecast previously, since total predicted LEED floor area in 2030 decreased by about 60 percent compared with last year’s estimates. These figures may go up as the more stringent requirements of LEED 2009 begin to be felt.
Energy Impacts Buildings use more energy than any other human activity, and the building sector’s share of global energy use continues to grow. It will not be possible to effectively address carbon pollution and climate change without an aggressive, concerted effort to reduce energy consumption in buildings. LEED is doing OK at making a difference, but much more needs to be done, both within LEED and complementary activities such as increased mandatory standards. We estimate that the current annual CO2 savings from LEED buildings is approximately 8 million tons from energy efficiency and renewables. This figure grows to 64 million tons per year by 2020 and almost 170 million tons annually by 2030, which is about 3 percent of our current annual CO2 footprint. While the fact that these savings show up at all is impressive, given our massive carbon budget. But comparing a 3 percent reduction in 2030 to the needed 80 percent in 2050 seems pretty daunting.
Materials Impacts Based on average materials costs, green building materials represented approximately $14.5 billion in cumulative spending through 2010, reaching nearly $120 billion by 2030. Moreover, the embodied energy in buildings that are renovated instead of demolished by 2030 is expected to save the oil equivalent of over 200 million barrels -- as much energy as we import
In spite of this success, we believe
that LEED EBOM is less than halfway
to where it needs to be to sufficiently
contribute to minimizing climate
change.

5 © 2010 GreenBiz Group Inc. (www.greenbizgroup.com). May be reproduced for noncommercial purposes only, provided credit is given to GreenBiz Group Inc. and includes this copyright notice.
this year from Russia. In addition, an average of over 60 percent of C&D Waste is diverted from LEED projects, totaling almost 53 million tons to date and exceeding 430 million tons per year by 2030.
IEQ Impacts While operational savings are real and important, the financial benefits in LEED are largely achieved through the enhancement of employee productivity: Salaries represent approximately 90 percent of the money flow through a building. Although our floor area projections are down, and as a result the total employees affected by LEED is lower, we feel that the preponderance of evidence allows us to increase the estimated productivity benefits, which keeps the total economic impact of LEED quite similar to last year.
We estimate that an average of more than 1.5 million employees are enjoying improved indoor environments in LEED buildings at present. Looking ahead, the “green building workforce” is expected to approach 5 million by 2020, and almost 17 million strong by 2030. The productivity benefits from LEED buildings to date are estimated at $6.4 billion and we expect this number to exceed $22 billion by 2020, and nearly reach $75 billion by 2030.
§ § §
LEED MARKET TRENDS
It turns out that the green lifeboat wasn’t as big as we originally assumed. In the 2009 Green Building Market and Impact Report, we supposed that the huge pulse of projects into the LEED system was in part due to the hopes of owners and developers that green certification would somehow keep them from drowning in the emerging economic chaos. Like a brilliant chemically induced insight that we were sure would change everything, we projected that these phenomenal numbers would continue into the future. But they didn’t. Now in the sober light of day, it seems that, until this year, a sort of “irrational exuberance” has gripped the market since 2007, with LEED’s penetration of cumulative new construction reaching 54 percent during this period.
If we had just stuck with our estimates of LEED environmental performance and market penetration to date, we would not be in the position of having to admit that last year’s irrationally exuberant estimates of growth in LEED going forward were just flat-out wrong. It’s cold comfort to say that we’re in good company considering how badly others have forecast the circumstances in which we have found ourselves in the last two years. Regardless, we have a great deal more information about how LEED-certified buildings earned their plaques, which gives us greater certainty about certified buildings’ environmental performance.
Newsflash: LEED is no longer a new construction standard. Domestically, the total new floor area in LEED for Existing Buildings: Operations and Maintenance in both registrations and certifications exceeds all floor area in LEED for New Construction, plus LEED for Core and Shell, plus LEED Schools (together, the building design and construction standards) for the first time. As recently as 2007, BD&C standards were 80 percent of the floor area in LEED. Globally, EBOM represented 46 percent of certifications, while BD&C standards comprised about 54 percent of the certified floor area this year and over 60 percent of registered floor area.
LEE
D M
arke
t Tr
end
s

6 © 2010 GreenBiz Group Inc. (www.greenbizgroup.com). May be reproduced for noncommercial purposes only, provided credit is given to GreenBiz Group Inc. and includes this copyright notice.
This year still saw the addition of over 800 million square feet of registered floor area—about 35 percent overseas—for a cumulative total of over 7 billion square feet of registered floor area worldwide since LEED was launched in 20001. Eight hundred million square feet seems like a large number, and it is, until you realize that total registered floor area anticipated for 2010 declined by almost 70 percent compared to last year’s totals. Cumulatively, we estimate that nearly 1.2 billion square feet will have been certified by the end of the year.
The growth of LEED this year was quite bifurcated between certification and registration. Certification continued its torrid pace—exceeding last year’s record by over 50 percent—and we project that the newly certified floor area added this year will nearly equal all certified floor area for the previous ten years. Cumulatively, LEED-certified buildings now total more than 1 billion square feet.
A total of 7 billion square feet is registered in LEED, about 2 billion of which (28 percent) is outside the United States. But, unlike the expansion of certifications in 2010, registrations dropped like a stone—for the first time in LEED’s history—compared with 2008 and 2009, not quite even reaching the registration totals
This year still saw the addition of over
800 million square feet of certified and registered floor area for a
cumulative total of 7 billion square feet
Worldwide since LEED was launched
in 2000.
1In last year’s report we mistakenly added total certified with total registered floor area, when certified floor area should have been a subset. The LEED system had nearly 6.1 billion square feet, not 7 billion as reported.
449
1,125
6,715
18,965
430
2,020
3,453
143
438
1,804
65
Cumulative LEED NC Certified SF Cumulative LEED CS Certified SF Cumulative LEED CI Certified SF Cumulative LEED EB Certified SF
2010 2020 2030
GBMIR Floor Area Forecast(in Millions of Square Feet)
2,995
7 © 2010 GreenBiz Group Inc. (www.greenbizgroup.com). May be reproduced for noncommercial purposes only, provided credit is given to GreenBiz Group Inc. and includes this copyright notice.
of 2007. To be fair, the entire non-residential market has tanked since 2007, perhaps with the exception of schools and government projects, starting about 35 percent less floor area in 2010. Indeed, it is now apparent that the last year’s surge in registrations was an aberration caused by the sunsetting of Version 2.2. However, there is a silver lining in all this: 2010 NC/CS/Schools registrations still exceeded 20 percent of new construction starts, which is consistent with the market penetration expected and desired for the system.
Not unexpectedly, USGBC’s membership counts have also suffered somewhat over the last year, declining more than 15 percent from its early-2009 high of approximately 20,000. These appear to be principally smaller firms and current member retention rates are still quite healthy, though below those of the last couple of years.
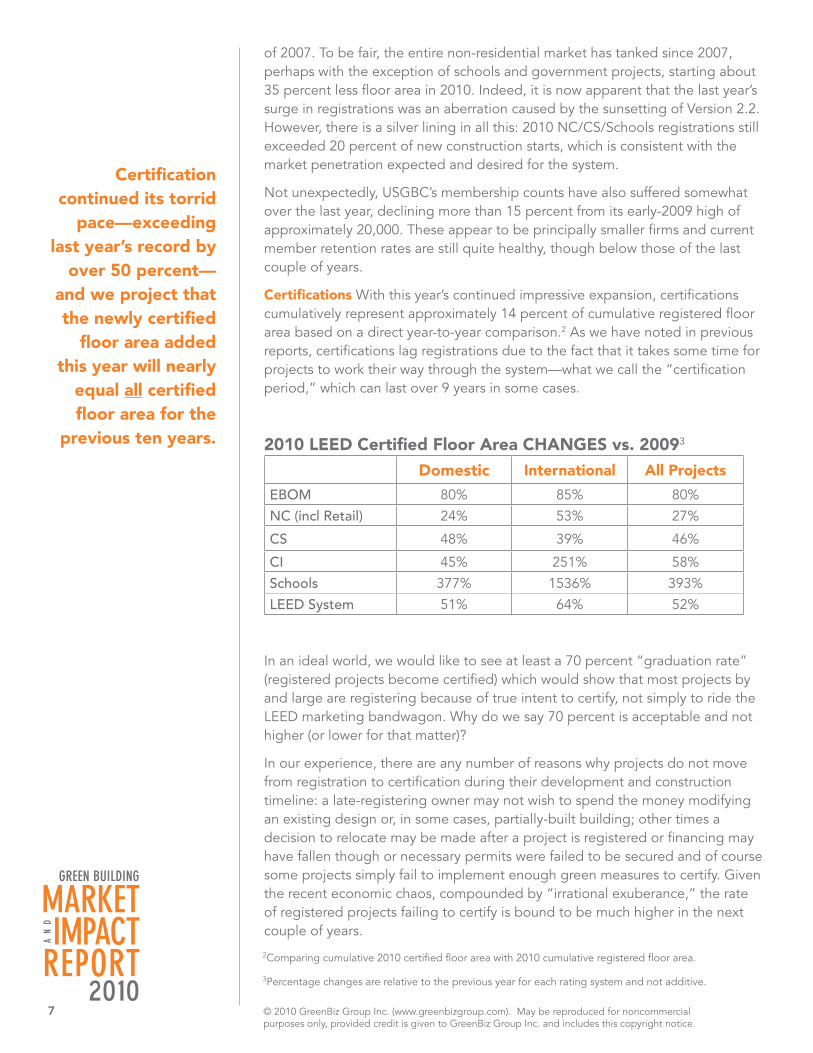
Certifications With this year’s continued impressive expansion, certifications cumulatively represent approximately 14 percent of cumulative registered floor area based on a direct year-to-year comparison.2 As we have noted in previous reports, certifications lag registrations due to the fact that it takes some time for projects to work their way through the system—what we call the “certification period,” which can last over 9 years in some cases.
2010 LEED Certified Floor Area CHANGES vs. 20093
Domestic International All Projects
EBOM 80% 85% 80%
NC (incl Retail) 24% 53% 27%
CS 48% 39% 46%
CI 45% 251% 58%
Schools 377% 1536% 393%
LEED System 51% 64% 52%
In an ideal world, we would like to see at least a 70 percent “graduation rate” (registered projects become certified) which would show that most projects by and large are registering because of true intent to certify, not simply to ride the LEED marketing bandwagon. Why do we say 70 percent is acceptable and not higher (or lower for that matter)?
In our experience, there are any number of reasons why projects do not move from registration to certification during their development and construction timeline: a late-registering owner may not wish to spend the money modifying an existing design or, in some cases, partially-built building; other times a decision to relocate may be made after a project is registered or financing may have fallen though or necessary permits were failed to be secured and of course some projects simply fail to implement enough green measures to certify. Given the recent economic chaos, compounded by “irrational exuberance,” the rate of registered projects failing to certify is bound to be much higher in the next couple of years.
Certification continued its torrid
pace—exceeding last year’s record by
over 50 percent—and we project that the newly certified
floor area added this year will nearly
equal all certified floor area for the
previous ten years.
2Comparing cumulative 2010 certified floor area with 2010 cumulative registered floor area.
3Percentage changes are relative to the previous year for each rating system and not additive.

8 © 2010 GreenBiz Group Inc. (www.greenbizgroup.com). May be reproduced for noncommercial purposes only, provided credit is given to GreenBiz Group Inc. and includes this copyright notice.
Last year we reported that LEED exceeded a 70 percent graduation rate based on a three-year “graduation cycle.” That is most definitely not the case this year. As we noted in 2009:
However, in order to keep up with the pace of registrations, certifications in 2010 will need to triple compared to 2009. There is sufficient capacity in the certification pipeline, but it remains to be seen what impact the economy has and whether acceptable “graduation rates” can continue.
Although impressive, this year’s increase in certified floor area could not keep pace with the expansion of registered floor area begun in 2007. This year, we have more accurate data on the certification period for each of the LEED standards, as shown in the table below. Applying these periods to the registration and certification of each standard yields a rough graduation rate.
As can be seen from the table, a two-year-or-less graduation rate is most appropriate for all but LEED NC. For this reason, most standards decreased their graduation rate against last year’s report. Given the strong pulse of projects that came in during 2007-2009, it’s still too early to fully know what the eventual graduation rate is, but USGBC analysis estimates that over the long-term it should be about 60 percent, which may be a bit high compared with what we’ve seen so far, but not unreasonable.4
It was the Worst of Forecasts… In the 2009 Green Building Market & Impact Report we talked about lifeboats and other metaphors for what we were seeing in terms of LEED registration growth—the growth in certifications had a very rational explanation; the USGBC was starting to get good at it—but maybe it was just panic. Panic about the sunset of a familiar system, panic about needing some sort of external imprimatur to get financing, we don’t know. What we do know is that the doldrums that hit the real estate market overall have finally caught up with LEED registration numbers in complete contravention of what happened last year. So, how do we look forward 20 years? More on that in the Methodology section.
It’s About Operations, Stupid Last year LEED EBOM surpassed LEED NC for the first time and this year there is no question that this is the domestic trend. This year, EBOM surpassed BD&C (NC, CS + Schools) combined for both registered and certified floor area in the U.S., though BD&C still rules overseas. EBOM certified floor area grew by 80 percent compared with last year. New floor area registered in EBOM decreased by 55 percent—a precipitous decline,
Although impressive, this
year’s increase in certified floor area
could not keep pace with the expansion of registered floor
area begun in 2007.
LEED Standard LEED EBOM LEED NC LEED CS LEED CILEED for Schools
LEED System
Certification Period: Time from registration to certification 17 mo. 32 mo. 24 mo. 18 mo. 26 mo. 24 mo.
Period-weighted certification Rates vs. registrations 42% 42% 21% 36% 9% 34%
2009 Estimated Graduation Rate (2-year, except for NC) 72% 57% 14% 68% 3% 29%
4In our modeling, we use graduation rates that vary between 50 and 70 percent depending on the standard.

9 © 2010 GreenBiz Group Inc. (www.greenbizgroup.com). May be reproduced for noncommercial purposes only, provided credit is given to GreenBiz Group Inc. and includes this copyright notice.
of course, but compared to the 80 to 90 percent declines in NC and CS, respectively, it doesn’t look so bad. Including last year’s surge, the cumulative certified floor area for EBOM is now nearly equal to that of LEED NC.
2010 LEED Registered Floor Area CHANGES vs. 20095
Domestic International All Projects
EBOM -59% -36% -56%
NC (incl Retail) -76% -82% -79%
CS -90% -24% -58%
CI -72% 72% -65%
Schools -53% 1396% -44%
LEED System -70% -61% -68%
Cumulative Certifications 2000-20106 (sq. ft.)
EBOM NC & Retail CS CI Schools
445,921,051 472,296,456 172,603,480 71,891,745 6,010,253
38% 40% 15% 6% 0.50%
Beauty is Still on the Inside Again this year LEED Commercial Interiors (CI), continues to somewhat defy trends. CI certified floor area grew by 60 percent compared with last year’s total, exceeding the 50 percent system-wide average.
Although CI mirrored the large percentage drop in registrations of LEED NC domestically, it was the only established standard that actually grew in registered floor area in any market, increasing by more than 70 percent overseas.
2010 LEED System Share—Certified Projects
EBOM NC & Retail CS CI Schools
445,921,051 472,296,456 172,603,480 71,891,745 6,010,253
38% 40% 15% 6% 0.50%
New Construction: (Mostly) In the Toilet New construction certification (NC + CS) grew 30 percent compared to 2009, significantly less than average certification growth this year, though at least it grew.
On the registration front, the question becomes “How low can you go?” Well, U.S. Core & Shell registrations were down a stunning 90 percent compared to last year’s, while New Construction registrations in the U.S. were down 80 percent. Of modest comfort, the total floor area registered in NC, CS and Schools was equivalent to about 22 percent of estimated total construction floor area forecast to be completed this year.
CI certified floor area grew by 60
percent compared with last year’s
total, exceeding the 50 percent system-
wide average.
5Percentage changes are relative to the previous year for each rating system and not additive.
62010 certification totals are estimated from year-to-date figures through September and trend-lined through the rest of the year.

10 © 2010 GreenBiz Group Inc. (www.greenbizgroup.com). May be reproduced for noncommercial purposes only, provided credit is given to GreenBiz Group Inc. and includes this copyright notice.
The total floor area registered in NC,
CS and Schools was equivalent to about 22 percent
of estimated total construction floor
area forecast to be completed this year.
2010 LEED System Share—Registered Projects
Domestic International All Projects
EBOM 48.6% 16.2% 37.2%
NC (incl Retail) 33.2% 30.2% 32.2%
CS 3.7% 46.8% 18.8%
CI 8.4% 4.8% 7.1%
Schools 6.1% 2.0% 4.7%
Application Guides Gain Traction On the Application Guide front, LEED for Schools saw a four-fold surge in certified floor area (off an admittedly small base) and continues to do better relative to other new construction standards on the registration front, declining only half as much as NC or CS.
LEED Retail continues to lag, principally due to the delayed public release of the standard that was approved earlier this year. The imminent release of the Retail new construction standard and the soon-to-be-introduced volume-build program should cause floor area in this Application Guide to expand rapidly.
LEED V3 Teaser We have summary data for only 37 Version 3 certified projects encompassing almost 11 million square feet across all V3 rating systems, but we couldn’t resist a sneak preview of what these projects look like from certification perspective.
Not surprisingly, EB and CI are off to early starts, simply because they have much shorter average certification periods than the other standards.
Standard Penetration
EB 59%
NC 8%
CS 3%
CI 30%
Domestic 81%
International7 19%
Perhaps more interesting is the distribution of certification levels. Version 3 represents a decent jump in stringency, including higher percentage achievement in several categories, as well as benchmarking to more stringent standards, such as the most recent ASHRAE 90.1. As you might expect soon after an increase in stringency, the certification levels are tending toward the lower awards, Certified and Silver. Also interesting is the relatively high proportion of Platinum—three times the percentage under the earlier standards. Granted, this is a very small sample, but it may also indicate the presence of a group of “super-users”—who are experienced and early adopters of the
7Interestingly, most of the international projects certified are in China.

11 © 2010 GreenBiz Group Inc. (www.greenbizgroup.com). May be reproduced for noncommercial purposes only, provided credit is given to GreenBiz Group Inc. and includes this copyright notice.
standard—are making a strong early showing.
Distribution of Certification LevelsCertified 32%
Silver 35%
Gold 16%
Platinum 16%
Homes is Where the Green is The U.S. residential sector represents more than half of the economic and environmental impact of the built environment. Because of the inherent disaggregation of the residential market, the LEED system has been slower to develop and penetrate, with the LEED for Homes standard only released in 2007. As of this year, we anticipate that a total of over 9,500 homes—both single-family and multi-family—will be certified by the end of this year, with another 30,000 homes in the registration queue. (If anything, the residential construction market was harder hit than the non-residential sector by the last three years’ economic upheaval, so the market characteristics upon which the calculations of this section are based are somewhat atypical.)
Estimated LEED-certified Homes Total Single-family Multi-family
Projected Floor Area
2007-2010 9,630 4,064 5,566 16.8 million ft2
The LEED for Homes pattern is similar to the non-residential pattern: LEED registrations are off 30 percent compared to the previous 12 months, but the number of certified homes doubled.
Interestingly, the preponderance of LEED certification has been in the multi-family sector, which represents almost 60 percent of the homes certified, even though it represents 20 percent of housing starts over the last 5 years.
% of LEED Homes CertifiedSingle-Family Multi-Family
2007 31% 69%
2008 60% 40%
2009 63% 37%
2010 29% 71%
Cumulative 42% 58%
Ho
mes
12 © 2010 GreenBiz Group Inc. (www.greenbizgroup.com). May be reproduced for noncommercial purposes only, provided credit is given to GreenBiz Group Inc. and includes this copyright notice.
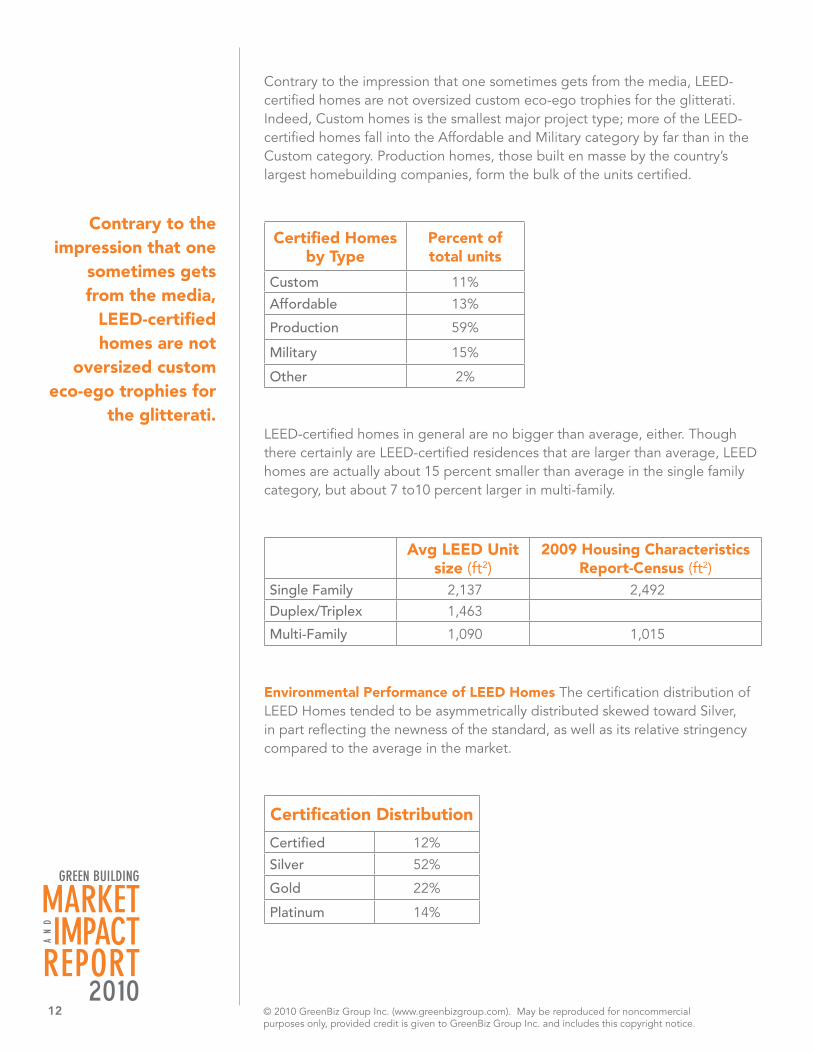
Contrary to the impression that one sometimes gets from the media, LEED-certified homes are not oversized custom eco-ego trophies for the glitterati. Indeed, Custom homes is the smallest major project type; more of the LEED-certified homes fall into the Affordable and Military category by far than in the Custom category. Production homes, those built en masse by the country’s largest homebuilding companies, form the bulk of the units certified.
Certified Homes by Type
Percent of total units
Custom 11%
Affordable 13%
Production 59%
Military 15%
Other 2%
LEED-certified homes in general are no bigger than average, either. Though there certainly are LEED-certified residences that are larger than average, LEED homes are actually about 15 percent smaller than average in the single family category, but about 7 to10 percent larger in multi-family.
Avg LEED Unit size (ft2)
2009 Housing Characteristics Report-Census (ft2)
Single Family 2,137 2,492
Duplex/Triplex 1,463
Multi-Family 1,090 1,015
Environmental Performance of LEED Homes The certification distribution of LEED Homes tended to be asymmetrically distributed skewed toward Silver, in part reflecting the newness of the standard, as well as its relative stringency compared to the average in the market.
Certification Distribution
Certified 12%
Silver 52%
Gold 22%
Platinum 14%
Contrary to the impression that one
sometimes gets from the media,
LEED-certified homes are not
oversized custom eco-ego trophies for
the glitterati.

13 © 2010 GreenBiz Group Inc. (www.greenbizgroup.com). May be reproduced for noncommercial purposes only, provided credit is given to GreenBiz Group Inc. and includes this copyright notice.
Below, we will restrict our detailed environmental focus on LEED Homes’ energy performance to date, without any projections.
Energy Energy is the largest section in LEED for Homes, with almost twice the points of any other section. Scoring energy for LEED for Homes relies on the Home Energy Rating (HERS) Index, which is a scoring system established by the Residential Energy Services Network (RESNET) in which a home built to the specifications of the HERS Reference Home (based on the 2006 International Energy Conservation Code) scores a HERS Index of 100, while a net zero energy home scores a HERS Index of 0. The lower a home’s HERS Index, the more energy-efficient it is in comparison to the HERS Reference Home.
Each one-point decrease in the HERS Index corresponds to a 1 percent reduction in energy consumption compared to the HERS Reference Home. Thus a home with a HERS Index of 85 is 15 percent more energy efficient than the HERS Reference Home and a home with a HERS Index of 80 is 20 percent more energy efficient.7
LEED Homes average a HERS score of 62.5, which makes them almost 40 percent more energy efficient than a conventional home built to IECC 2006 code, which just over half the states have adopted. By comparison, Energy Star Homes have a minimum HERS score requirement of 85, though on average they tend to score between 70 and 80.
All told, the estimated energy savings from LEED Homes is equivalent to approximately 100,000 barrels of oil per year.
7http://www.energystar.gov/index.cfm?c=bldrs_lenders_raters.nh_HERS
All told, the estimated energy
savings from LEED Homes is equivalent
to approximately 100,000 barrels of
oil per year.
14 © 2010 GreenBiz Group Inc. (www.greenbizgroup.com). May be reproduced for noncommercial purposes only, provided credit is given to GreenBiz Group Inc. and includes this copyright notice.
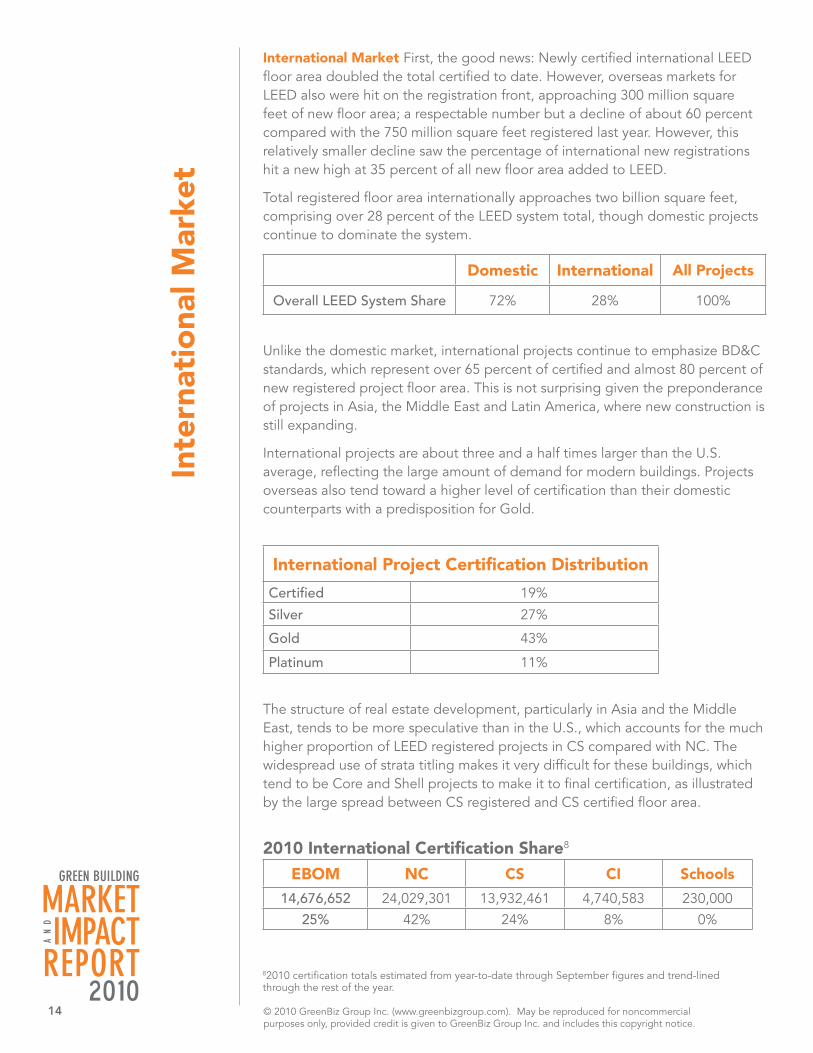
International Market First, the good news: Newly certified international LEED floor area doubled the total certified to date. However, overseas markets for LEED also were hit on the registration front, approaching 300 million square feet of new floor area; a respectable number but a decline of about 60 percent compared with the 750 million square feet registered last year. However, this relatively smaller decline saw the percentage of international new registrations hit a new high at 35 percent of all new floor area added to LEED.
Total registered floor area internationally approaches two billion square feet, comprising over 28 percent of the LEED system total, though domestic projects continue to dominate the system.
Domestic International All Projects
Overall LEED System Share 72% 28% 100%
Unlike the domestic market, international projects continue to emphasize BD&C standards, which represent over 65 percent of certified and almost 80 percent of new registered project floor area. This is not surprising given the preponderance of projects in Asia, the Middle East and Latin America, where new construction is still expanding.
International projects are about three and a half times larger than the U.S. average, reflecting the large amount of demand for modern buildings. Projects overseas also tend toward a higher level of certification than their domestic counterparts with a predisposition for Gold.
International Project Certification Distribution
Certified 19%
Silver 27%
Gold 43%
Platinum 11%
The structure of real estate development, particularly in Asia and the Middle East, tends to be more speculative than in the U.S., which accounts for the much higher proportion of LEED registered projects in CS compared with NC. The widespread use of strata titling makes it very difficult for these buildings, which tend to be Core and Shell projects to make it to final certification, as illustrated by the large spread between CS registered and CS certified floor area.
2010 International Certification Share8
EBOM NC CS CI Schools
14,676,652 24,029,301 13,932,461 4,740,583 230,000
25% 42% 24% 8% 0%
82010 certification totals estimated from year-to-date through September figures and trend-lined through the rest of the year.
Inte
rnat
iona
l Mar
ket

15 © 2010 GreenBiz Group Inc. (www.greenbizgroup.com). May be reproduced for noncommercial purposes only, provided credit is given to GreenBiz Group Inc. and includes this copyright notice.
Top 10 Countries (Registered + Certified)
Country # Projects Floor area (ft2)Average Project Floor Area (ft2)
India (Includes LEED-India) (1) 866 482,000,000 556,582
United Arab Emirates 708 475,500,000 671,555
Greater China (2) 442 293,000,000 683,141
Canada (Includes LEED Canada) (1) 2794 131,900,000 47,240
South Korea 106 131,000,000 1,236,061
Saudi Arabia 101 123,600,000 1,223,274
Brazil 169 57,400,000 339,714
Mexico 139 51,600,000 370,982
Qatar 68 24,500,000 360,391
Germany 116 23,900,000 205,676
Average International Project Size (all projects) 578,835
United States Average Project Size 164,707
(1) International project environmental calculations in report do not include Canada LEED or India LEED
(2) Includes Hong Kong, Macau & Taiwan
92010 registration totals estimated from year-to-date through September figures and trend-lined through the rest of the year.
2010 International Registration Share9
EBOM NC CS CI Schools
47,433,233 88,437,271 137,029,914 13,961,609 5,984,404
16% 30% 47% 5% 2%
USGBC continues to refine a project certification structure that can adapt to the current portfolio of projects, but further improvements are needed before LEED can penetrate the international market at the same level as the U.S. market. Challenges to increased penetration in large international markets include:
• benchmarking LEED’s environmental performance standards, particularly energy
• development of qualified professionals, from designers to builders
• translation of support materials to local language
• infrastructure necessary to support, protect and certify to the LEED brand

16 © 2010 GreenBiz Group Inc. (www.greenbizgroup.com). May be reproduced for noncommercial purposes only, provided credit is given to GreenBiz Group Inc. and includes this copyright notice.
LEED addresses impacts to the land in a wide variety of ways, which can be summarized in three principal categories: location efficiency, site protection and restoration and site performance.
Location Efficiency Our chosen indicator of location efficiency—reductions in vehicle miles traveled (VMT)—is used to illustrate the aggregate value of LEED’s siting & alternative transportation requirements.
Research on transit-oriented development communities by G.B. Arrington and Robert Cevero for the Transportation Research Board10 indicates that density, transit service and proximity to mixed uses combine to reduce trips by nearly 45 percent. John Holzclaw’s research for the Natural Resources Defense Council shows similar correlations, reducing VMT by about 30 percent. We chose a conservative value of 35 percent savings for the combination of LEED’s location efficiency and sustainable transportation measures.
The 2010 estimates for VMT reductions more than double those of 2009, growing to over 1.4 billion fewer VMT avoided. This is a combination of the 50 percent growth in LEED-certified floor area coupled and the commuting travel reductions under EBOM as new data have become available. Also driving this growth are a greater percentage of LEED projects in transit-rich locations and new research showing higher trip reductions from transit-oriented development. Because of our dramatically reduced floor area forecast, projected environmental benefits are much lower than before.
Our projections indicate that occupants of LEED buildings will drive roughly 8.7 billion VMT by 2020, down significantly from last year’s projection of 15 billion, but up from 4 billion from 2008. By 2030, we estimate people living and working in LEED buildings will drive 20 billion VMT less per year.
10Effects of TOD on Housing, Parking, and Travel, Transit Cooperative Research Program Report 128, Transportation Research Board, 2008.
11LEED NC and CS projects only.
12LEED NC and CS projects only.
LEED Sustainable Site Trends
(Floor Area-Weighted Credit Achievement)
VMT reductions by LEED building
occupants11
Site Restoration and Reduced disturbance12
Brownfield Redevelopment
Stormwater Management
Heat Islands
2008Non-comparable
methodology with other reports
35% 20% 24% 65%
2009 49% 44% 19% 52% 59%
2010 51% 44% 19% 44% 56%
Site
and
Lan
d U
se Im
pac
ts

17 © 2010 GreenBiz Group Inc. (www.greenbizgroup.com). May be reproduced for noncommercial purposes only, provided credit is given to GreenBiz Group Inc. and includes this copyright notice.
2010 2020 2030
VMT reductions 1.44 billion 8.66 billion 19.93 billion
% VMT Reduction All Trips 0.07% 0.3% 0.5%
% Commute VMT Reduction 0.34% 1.36% 2.50%
Vehicle equivalents reduced 123,000 741,000 1,706,000
Gallons reduced 58,800,000 354,000,000 813,000,000
EMISSIONS REDUCTIONS (TONS)
Hydrocarbons 119 715 1,646
CO 5,396 32,434 74,626
NOx 175 1,049 2,414
Particulates 16 95 219
CO2 14,000,000 84,000,000 193,000,000
These reductions are the equivalent of over 120,000 vehicles off the road and almost 30 million gallons of fuel saved to date, eliminating approximately 14 million tons of CO2. These figures grow to 1.7 million vehicle-equivalents and over 800 million gallons of fuel saved annually by 2030, preventing nearly 200 million tons each year of CO2 emissions, as well as almost 80,000 tons of air pollutants, such as carbon monoxide, NOx, and hydrocarbons.
Site Protection There was little change in the adoption rates of land protection measures, so the 40-plus percent decline in site protection measure impacts vs. the 2009 report is principally due to decreased forecast growth of LEED-certified projects. As of 2010, we estimate that LEED-certified buildings prevented nearly 1.3 million tons of soil erosion to date and five million tons of prevented soil loss by 2020, which grows to almost 8.5 million tons by 2030.
The 2010 estimates for vehicle miles
traveled (VMT) reductions more
than double those of 2009, growing to over 1.4 billion VMT
avoided.
1,441
Exit: 2010
Fewer miles traveled:
(in millions)
8,662
Exit: 2020
Fewer miles traveled:
(in millions)
19,929
Exit: 2030
Fewer miles traveled:
(in millions)
Site Impacts: VMT Reductions

18 © 2010 GreenBiz Group Inc. (www.greenbizgroup.com). May be reproduced for noncommercial purposes only, provided credit is given to GreenBiz Group Inc. and includes this copyright notice.
Through 2010, we estimate that
LEED stormwater prevention
and treatment requirements have avoided or treated
over 1 billion gallons of toxic
flush.
Forecasts for sensitive land impacts similarly decline, due to the slower growth in the number of projects and the strong shift to urban development and increased relative penetration of Existing Buildings. To date we estimate that development on approximately 40,000 acres of sensitive lands has been avoided, compared with 24,000 acres calculated in the 2009 report, because of certified project growth. Forecast impacts show about 81,000 acres in 2020 vs. 70,000 forecast in 2008. By 2030, the total exceeds 122,000 acres.
There was a small shift in the fraction of certified projects seeking the Brownfield restoration certification between 2009 & 2010, but a jump in total certifications indicates that LEED has resulted in an estimated 8,800 acres of Brownfield reclamation vs. 4,800 calculated acres last year. We expect reclaimed Brownfield acres to grow to over 17,000 acres by 2020 and 27,000 acres by 2030.
Stormwater Through 2010, we estimate that LEED stormwater prevention and treatment requirements have avoided or treated over 1 billion gallons of toxic flush—significantly more than we calculated in 2009—due to the growth in certified projects and the land associated with these projects. The volume prevented and treated grows to exceed 2.2 billion gallons per storm event, quite a bit less than the 350 million gallons forecast last year, but a healthy increase compared with 1 billion gallons estimated in the 2008 report. By 2030, LEED projects reduce or treat over 3.6 billion gallons of stormwater per each ¾-inch storm event.
Urban Heat Islands About 26,000 acres of land and rooftops have implemented measures to reduce urban heat islands and we expect almost 130,000 acres of measures by 2020 and 250,000 by 2030.
Looking Ahead LEED 2009 criteria significantly boosted the amount of credit given to projects that are “location efficient,” meaning in fill lots adjacent to mass transit. Given this shift in emphasis, we expect that the transportation and land-related impacts going forward will be greater relative to earlier versions. And, credits such as the much-maligned “bike-rack credit” receive much less weight compared to location efficiency (1 point vs. 11 points) within the Sustainable Sites field. However, there are only about 50 projects that have certified to the version 3 criteria, so it is too soon to tell whether certified projects will become more location efficient as a result.

19 © 2010 GreenBiz Group Inc. (www.greenbizgroup.com). May be reproduced for noncommercial purposes only, provided credit is given to GreenBiz Group Inc. and includes this copyright notice.
Other Sustainable Site Impacts
2010 2020 2030
Topsoil Preserved from Erosion Control Requirements
1,721,000 (Tons)
6,035,000 (Tons)
11,672,000 (Tons)
Sensitive Land Avoided & Open Space increased from Site Selection Requirements
40,000 (Acres)
81,000 (Acres)122,000 (Acres)
Brownfield Acres Redeveloped 8,800 (Acres) 17,600 (Acres) 27,200 (Acres)
Acres of Heat Islands Mitigated
26,000 (Acres)
80,800 (Acres) 161,000 (Acres)
Gallons Reduced per first 3/4" Stormwater 'Toxic Flush'
995,200,000 (gallons)
2,232,000,000 (gallons)
3,648,000,000 (gallons)
LEED Version 3 increased the prerequisite savings to 20 percent above minimum standards and to reward 30-40 percent savings. We expect to have data next year on the overall savings in projects certified under LEED V3.
The number of projects using greywater treatment systems again dropped slightly, in large part because water chemistry is very complicated and these systems require a great deal of maintenance and capital cost to install. It remains to be seen whether, as on-site wastewater treatment experience grows and technology improves—not to mention the expected $1 trillion water and sewer
Total Water Savings(in Billions of Gallons)
33.4 236.7 565.4
2010 2020 2030
Wat
er E
ffici
ency
Imp
acts

20 © 2010 GreenBiz Group Inc. (www.greenbizgroup.com). May be reproduced for noncommercial purposes only, provided credit is given to GreenBiz Group Inc. and includes this copyright notice.
infrastructure bill our local jurisdictions are facing in the next decade—there will be increased emphasis on buildings treating their own sewage on-site.
Aggregate Water Savings: Cumulative savings in 2010 from plumbing, landscaping, and cooling towers usages combined is over 33 billion gallons, comprising 1 percent of annual non-residential water use. By 2020, with LEED floor area exceeding 19 billion square feet, this figure is expected to approach 237 billion gallons of water, or 6.7 percent of annual non-residential water, an increase of over 700 percent. This number will more than double by 2030, reaching 565 billion gallons of saved water, which represents a decent 14 percent savings of annual non-residential water use.
Wastewater Reductions Based on the fraction of LEED projects pursuing water efficiency combined with innovative wastewater treatment, we calculated that 9.6 billion gallons of wastewater have been avoided to date, a 0.2 percent reduction in the annual wastewater generated.
ETI expects savings of over 52 billion gallons of wastewater generation avoided by 2020, which grows to more than 101 billion gallons by 2030. These figures represent 1.3 percent and over 2.5 percent reduction in annual wastewater generation, respectively.
Conservative These estimates are conservative because they don’t include all of the reduced wastewater generated due to the savings from cooling towers and plumbing fixtures that are less than the 50 percent threshold of the credit. Indeed the plumbing fixture savings are probably a more accurate estimate
13Numbers may not add exactly due to rounding.
14Please see the Methodology section for an explanation of the updated figures.
Water Efficiency and Treatment ImpactsUnits Impact to Date Projected Impact
2020Projected Impact
2030
Total Water Savings13 Million Gallons
33,400 236,700 565,400
Plumbing Water SavingsMillion Gallons
5,672 47,135 115,904
Landscape Water SavingsMillion Gallons
17,698 105,322 245,315
Cooling Tower Water SavingsMillion Gallons
9,986 84,206 204,149
Annual Non-Residential Water Use
% 1.0 6.7 14.3
Water Waste Reduction
TotalMillion Gallons
9,628 52,161 101,297
Corrected 2009 Annual Waste Water Reduction14
Million Gallons
3,984 52,914 99,487
Original 2009 Annual Waste Water Reduction
Million Gallons
18,100 852,000 1,890,000

21 © 2010 GreenBiz Group Inc. (www.greenbizgroup.com). May be reproduced for noncommercial purposes only, provided credit is given to GreenBiz Group Inc. and includes this copyright notice.
of the true wastewater reductions, but we also have the potential for double-counting projects that save more water than LEED gives credit for.
Energy performance in LEED buildings certified under the BD&C standards continues to be criticized and so, once again, we looked at this question: Do new LEED buildings save energy compared to standard buildings or not? And, once again, the answer is: Absolutely. However, not all LEED buildings perform as designed, just like all cars do not get their EPA driving test certified fuel economy (your mileage may vary!).
How do we support our bold assertions of LEED energy performance? First off, most critics are behind the times when they make blanket statements about LEED. LEED is not just about new building design any more. As readers of this report know, LEED EBOM this year comprised nearly half of all registered and certified projects and requires an Energy Star score, which is based on actual billing data. The average Energy Star score of certified EBOM projects is 85 and, indeed, over 20 percent of EBOM certified projects have an Energy Star score of 93 or above.15
Second, on the new building front, the National Research Council of Canada, Institute for Research in Construction (IRC) confirms that, on average, LEED buildings use from 18 to 39 percent less energy than comparable buildings.16 However, IRC also found that nearly one-third of these newly built buildings consume more energy than their counterparts. This is of course a serious cause for concern, and the subject of the extensive research underway through the Building Performance Partnership, launched by USGBC in 2009.
Energy Savings Trends in LEED As shown in the Table below17, the average predicted energy savings of new buildings falls solidly in the middle of the range expected by the Canadian study. We now have data on nearly 600 EB and EBOM certified buildings, whereas in 2009 we had information on barely 100 and in 2008 none at all.
2010 Green Building Market & Impact
Report
Average % Savings in
LEED Projects% Savings in 2009 Report
% Savings in 2008 Report
All Projects Low – High Low – High
LEED NC (2.0, 2.1 & 2.2) 24% 16-31% 25-31%
CS 2.0 (whole building) 17% 15-20% 25-31%
EB/EBOM18 28%/35%
(Energy Star 85)28-37% 37%
CI 21.1 (kBtu/ft2) 14.1 (kBtu/ft2) N.A.
Ene
rgy
Imp
acts
15At the bottom end of the spectrum, the minimum energy prerequisite for EBOM certified projects ranges from an Energy Star score of 60 (EB 2004) to 69 (EB 2009).16Do LEED-certified buildings save energy? Yes, but … Guy R. Newsham, Sandra Mancini, Benjamin J. Birt, National Research Council Canada – Institute for Research in Construction, August 2009.
17More details can be found in the Methodology section.
18EB savings figures are only used in 2010; EBOM going forward. EB projects represent about 1/3 of the certified projects to date. The weighted average savings is 33 percent or Energy Star 83.

22 © 2010 GreenBiz Group Inc. (www.greenbizgroup.com). May be reproduced for noncommercial purposes only, provided credit is given to GreenBiz Group Inc. and includes this copyright notice.
As reported last year, in 2007, USGBC responded to alarming trends of projects not pursuing energy credits with a minimum requirement to achieve a minimum of 2 points in order to certify. Projects registered prior to June 27, 2007 were grandfathered under the earlier standard that did not require energy savings beyond the ASHRAE 90.1 baseline. But, as shown below, the adoption of this policy proved to be quite effective in pushing projects to save more energy.
Percent of NC 2.2 projects achieving
EA Credit 1.2 (14% Savings from ASHRAE 90.1 2004)
2007 78%
2008 80%
2009 90%
2010 95%
Most of the change in energy savings (0.08 Quads* in 2010 vs. 0.03/0.04 Quads Low/High in 2009) is driven by the rapid growth in LEED-certified floor area. Also, this year we have better information on all standards, which allows us to use a single forecast case with confidence. From last year’s report there are minor changes in the expected savings from the various standards, but LEED CI stands out, as there is a marked increase in energy savings based on the more comprehensive information we have this year.
Given the contraction in forecast LEED-certified floor area over the next 20 years, energy savings are significantly below last year’s estimates. By 2020, energy savings are expected to reach 0.71 Quads and approximately 1.8 Quads by 2030, or 3.4 percent and 7.8 percent, respectively, of national annual commercial building energy use. Although much lower than last year’s estimate, the energy saving equivalent amount of coal would be enough to fill every major football or soccer stadium in each of the 50 states, plus Washington DC, the Commonwealth of Puerto Rico and the U.S. Virgin Islands.
Given the contraction in
forecast LEED-certified floor area over the
next 20 years, energy savings
are significantly below last year’s
estimates.
*”Quad” = 1 quadrillion Btu or about 8 billion gallons of gasoline.

23 © 2010 GreenBiz Group Inc. (www.greenbizgroup.com). May be reproduced for noncommercial purposes only, provided credit is given to GreenBiz Group Inc. and includes this copyright notice.
2010 2020 2030
TOTAL LEED ENERGY SAVINGS (Quads) 0.08 0.83 2.08
Net Commercial Building Consumption 19.28 20.26 20.64
Percent of 2010 Baseline 100% 105% 107%
Projected U.S. Commercial Building Consumption - Q
19.36 21.09 22.72
% Savings of Total Commercial Energy Use 0.41% 3.94% 9.17%
If LEED is to make any significant
contribution to absolute reductions
in non-residential energy use, a
concerted effort will be needed to rapidly grow the
penetration of LEED EBOM.
3.97
41.5
104.21
2010 2020 2030
Energy Savings(in Millions of Short Tons of Coal)

24 © 2010 GreenBiz Group Inc. (www.greenbizgroup.com). May be reproduced for noncommercial purposes only, provided credit is given to GreenBiz Group Inc. and includes this copyright notice.
The level of savings based on this year’s lower LEED penetration assumptions do not overcome increased energy use driven by floor area growth. As a result, there is still an absolute increase in non-residential energy use by 2030 compared with 2010.
Given that growth in new construction is unlikely to resume to any significant degree in the near future, if LEED is to make any significant contribution to absolute reductions in non-residential energy use, a concerted effort will be needed to rapidly grow the penetration of LEED EBOM.
In order to achieve zero net growth in non-residential energy use by 2020, LEED EBOM would need to at least double our forecast floor area to 15 billion square feet. This would entail adding an average of 1.4 billion new square feet per year in certified EBOM projects. Very aggressive to be sure, but definitely doable under the right circumstances.
Renewable Energy Impact: Because renewable energy stands as a crucial objective for delivering still more significant environmental impact, we felt it was important to measure the added energy from renewable sources contributed by green buildings so far. The percentage of renewably derived energy associated with green buildings has grown considerably, both in the form of on-site adoption of renewable energy technologies as well as (in the case of LEED EB, in particular) using clean sources of energy to power buildings through renewable energy certificates, or RECs, and direct purchases of renewable energy.
The percentage of renewably
derived energy associated with
green buildings has grown considerably, both in the form of on-site adoption of renewable energy
technologies as well as using
clean sources of energy to power
buildings through renewable energy
certificates and direct purchases of renewable energy.
3,464,451
17,296,407
39,012,499
2010 2020 2030
Renewable Energy SummaryCO2 reductions (in tons)

25 © 2010 GreenBiz Group Inc. (www.greenbizgroup.com). May be reproduced for noncommercial purposes only, provided credit is given to GreenBiz Group Inc. and includes this copyright notice.
Summary Energy Impacts:
2010 2020 2030
On-Site Generation (Billion kWh) 0.20 0.81 1.38
Grid Renewable Electricity Purchased (Billion kWh)
5.57 27.97 63.52
% Non-residential Electricity that's renewable
0.4% 1.6% 3.1%
Household Equivalents powered by renewables
541,000 2,701,000 6,091,000
Annual CO2 reductions (tons) 3,464,451 17,296,407 39,012,499
From our findings, we concluded that LEED buildings have purchased or generated 5.8 BkWh total renewable electricity to date, representing 0.4 percent of annual nationwide non-residential electricity.
Commensurate with our lower expectations for continued green building growth, but higher penetration of renewable energy purchases, we forecast that green building electricity from renewable sources will approach 28 billion kilowatt-hours by 2020, exceeding 63 billion kWh by 2030. These numbers represent 1.6 percent and 3.1 percent, respectively, of forecasted annual nationwide non-residential electricity, equivalent to the energy use of more than 6 million homes.
CO2 Emissions Reductions from Energy Efficiency & Renewables We estimate that the annual CO2 savings from LEED buildings is approximately 7.3 million tons from energy efficiency and renewable energy. This figure grows to nearly 63 million tons per year by 2020 and over 168 million tons annually by 2030.
Total CO2 Reductions Efficiency + Renewables
7,300,000 62,600,000 168,200,000
Financial Savings from Commissioning and Monitoring & Verification (M&V) In 2009, the Lawrence Berkeley National Laboratory (LBNL) updated its 2004 study on the “Cost Effectiveness of Commercial-Building Commissioning.” In this update, no direct calculation of the economic value of non-energy benefits for Commissioning was included, reflecting the difficulty of evaluating the multi-faceted aspects of the commissioning process and lack of a baseline of comparison.
The LBNL report did indicate that non-energy benefits were likely to offset all or most of the upfront costs of Commissioning. LBNL found, on average, that projects for new and existing buildings resulted in median energy savings of 13 percent and 16 percent, respectively, and had good paybacks: 4.2 years for new construction and 1.1 years for existing buildings.
LEED buildings have purchased or
generated 6.8 BkWh total renewable
electricity to date, representing
0.4 percent of annual nationwide
non-residential electricity.
26 © 2010 GreenBiz Group Inc. (www.greenbizgroup.com). May be reproduced for noncommercial purposes only, provided credit is given to GreenBiz Group Inc. and includes this copyright notice.
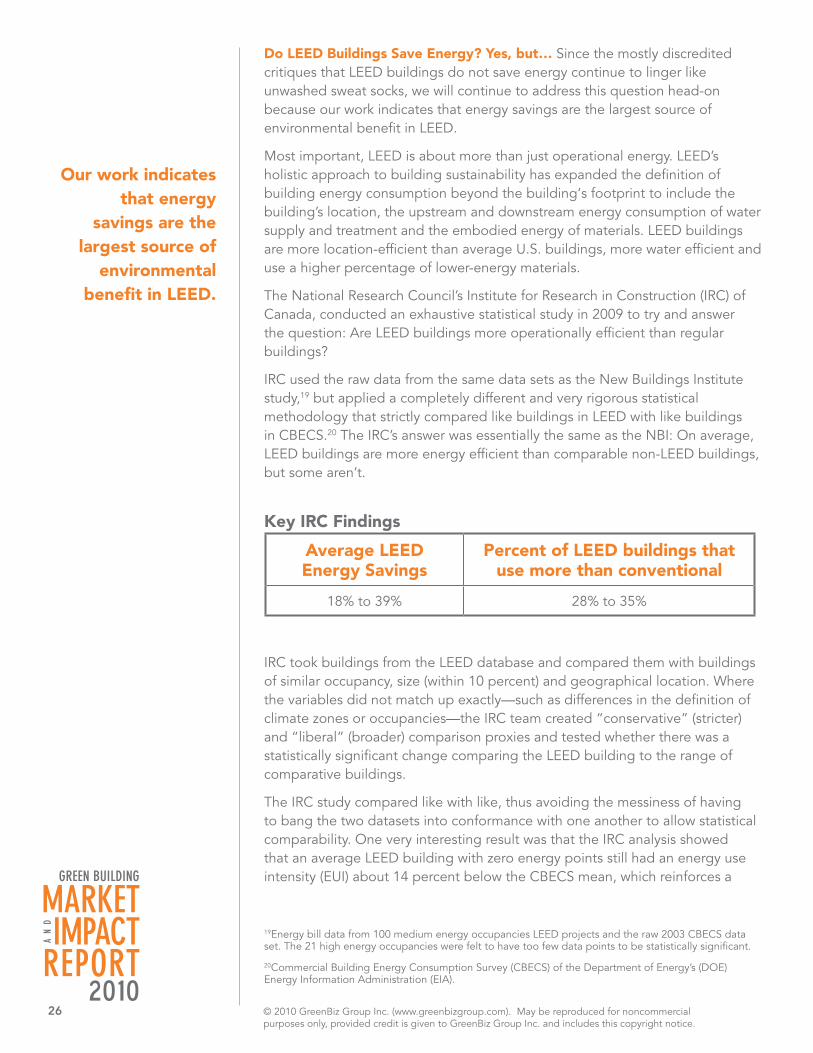
Do LEED Buildings Save Energy? Yes, but… Since the mostly discredited critiques that LEED buildings do not save energy continue to linger like unwashed sweat socks, we will continue to address this question head-on because our work indicates that energy savings are the largest source of environmental benefit in LEED.
Most important, LEED is about more than just operational energy. LEED’s holistic approach to building sustainability has expanded the definition of building energy consumption beyond the building‘s footprint to include the building’s location, the upstream and downstream energy consumption of water supply and treatment and the embodied energy of materials. LEED buildings are more location-efficient than average U.S. buildings, more water efficient and use a higher percentage of lower-energy materials.
The National Research Council’s Institute for Research in Construction (IRC) of Canada, conducted an exhaustive statistical study in 2009 to try and answer the question: Are LEED buildings more operationally efficient than regular buildings?
IRC used the raw data from the same data sets as the New Buildings Institute study,19 but applied a completely different and very rigorous statistical methodology that strictly compared like buildings in LEED with like buildings in CBECS.20 The IRC’s answer was essentially the same as the NBI: On average, LEED buildings are more energy efficient than comparable non-LEED buildings, but some aren’t.
Key IRC Findings
Average LEEDEnergy Savings
Percent of LEED buildings that use more than conventional
18% to 39% 28% to 35%
IRC took buildings from the LEED database and compared them with buildings of similar occupancy, size (within 10 percent) and geographical location. Where the variables did not match up exactly—such as differences in the definition of climate zones or occupancies—the IRC team created “conservative” (stricter) and “liberal” (broader) comparison proxies and tested whether there was a statistically significant change comparing the LEED building to the range of comparative buildings.
The IRC study compared like with like, thus avoiding the messiness of having to bang the two datasets into conformance with one another to allow statistical comparability. One very interesting result was that the IRC analysis showed that an average LEED building with zero energy points still had an energy use intensity (EUI) about 14 percent below the CBECS mean, which reinforces a
Our work indicates that energy
savings are the largest source of
environmental benefit in LEED.
19Energy bill data from 100 medium energy occupancies LEED projects and the raw 2003 CBECS data set. The 21 high energy occupancies were felt to have too few data points to be statistically significant.
20Commercial Building Energy Consumption Survey (CBECS) of the Department of Energy’s (DOE) Energy Information Administration (EIA).

27 © 2010 GreenBiz Group Inc. (www.greenbizgroup.com). May be reproduced for noncommercial purposes only, provided credit is given to GreenBiz Group Inc. and includes this copyright notice.
point we made in last year’s Green Building Market & Impact Report that even minimum conformance with ASHRAE 90.1 represents a significant step up in many parts of the country.
Somewhat counter-intuitive, but not entirely confounding, was the finding that there was no correlation with the level of certification of a LEED project and its energy efficiency. One of the keys to LEED’s success is its flexibility in allowing projects to pick the best mix of credits for their situation. To LEED’s energy critics, this is a fatal flaw, but we are absolutely certain that without its hallmark flexibility LEED would be much less widely utilized and in a much weaker position to push for change.
Also interesting, and to our mind a much more important finding, is the weak correlation between energy points and energy performance. Clearly, the improving the accuracy of modeling and real life performance will be key for improving confidence in the use of these tools to design better buildings. As far as the overall environmental performance of LEED going forward, the shift to EBOM as the core standard of LEED makes this accuracy less important in the US. But because of the continued growth in new construction overseas, this will be an important question to tackle.
IRC also reviewed several post-occupancy studies of relatively small cohorts of LEED-certified buildings that came to similar conclusions: on average, buildings performed fairly closely to predictions, but that on an individual-building basis there was a tremendous amount of variability, with several projects consuming quite a bit more than expected.
Summary of the New Buildings Institute Study Although rendered moot by the findings of the Canadian research, the NBI study continues to receive the bulk of the attention and undue criticism.
About 550 projects were certified by LEED by the end of 2006 and all of these projects were surveyed asked to supply their energy consumption information. About 120 projects responded with all of the necessary information. Another 128 projects responded, but with insufficient data for comparison. A total response rate of approximately 45 percent is pretty phenomenal, given the sensitive nature of the information being sought. However, the NBI study discovered some problems in the cohort of certified projects, the most prevalent of which was that the majority of projects were not adequately metered to respond to the survey. As a result of this finding, all LEED buildings certified to Version 3.0 are required to report their energy consumption.
LEED Building Consumption Compared to “Average” One of the most persistent criticisms of the NBI study involves the comparison of the median value of the NBI dataset with the mean value of the CBECS dataset. Everyone agrees that this is not a great match statistically, the NBI study authors included. However, the NBI authors should not be criticized for doing the right thing for their dataset: for a small, highly variable dataset, the median is a better metric to use because it fluctuates much less as the data expands. Of course, the larger the dataset, the more robust the mean value becomes and the more appropriate it is to use that measure of central tendency.
There is no doubt that CBECS uses the mean value for all of their datasets, but
One of the keys to LEED’s success is its flexibility in
allowing projects to pick the best mix
of credits for their situation.

28 © 2010 GreenBiz Group Inc. (www.greenbizgroup.com). May be reproduced for noncommercial purposes only, provided credit is given to GreenBiz Group Inc. and includes this copyright notice.
the question is never asked whether in the 2003 report they should have used it for the data set of energy use of buildings built after 2000. As shown in the table below, for small datasets the CBECS mean is wildly variable—the 1990-1992 EUI mean increases by over 65 percent between the 1992 and 1995 CBECS surveys. The exact same thing may actually happen with the EUI of the 2000-2003 buildings when the 2007 CBECS is released. We just don’t know. What we do know is the mean value of the EUI for 1990s buildings becomes less variable over time with a larger data set, but still varies significantly (EUI of 89 in 2003 vs. 69 in 1992) from the initial survey values.21
90s Buildings - Cohorts
EUI-Site Energy
EUI-Primary Energy
Source
1992 CBECS‘90-’92
69 157Table 3.2-Total Energy Consumption by Major Fuel, 1992
1995 CBECS‘90-92 22 115 242
1995 CBECS-Table 1. Total Consumption Tables
‘90-’95 105 2251995 CBECS-Table 1. Total Consumption Tables
1999 CBECS-90s 98 220Table C1: Total Energy Consumption by Major Fuel
2003 CBECS-90s 89 201 2003 CBECS Table C1(Non-Mall Buildings) p. 249
The other issue involves the mix of buildings in the underlying dataset, particularly the impact of high- and low-energy energy buildings on the overall EUI. The LEED dataset has about 17 percent of its buildings in the high-energy category, compared with 11 percent in the CBECS survey. In addition, CBECS includes such low-energy structures such as vacant buildings and warehouses, comprising 8 percent of the floor area, whereas LEED has none of these.
In conclusion, it’s important to understand what the NBI study is and isn’t.
What it is:
• The first and largest post-occupancy study of LEED buildings to date.
• An initial validation that average energy saving estimates of early LEED-certified buildings range from 25 to 30 percent.
• Based on projects that certified to LEED NC 2.0 and 2.1 four or more years ago.
• An important warning that a large minority LEED buildings to not perform as expected.
What the NBI study is not:
The LEED dataset has about 17 percent of its
buildings in the high-energy
category, compared with 11 percent in the CBECS survey.
CBECS includes such low-energy
structures such as vacant buildings and warehouses,
whereas LEED has none of these.
21It’s obvious for the coherence of the CBECS report overall that a common statistical measurement should be used, which is why the mean is used consistently throughout. Most of the datasets support the use of that measure.
22Commercial Building Energy Consumption Survey (CBECS) Energy Information Administration (EIA).
29 © 2010 GreenBiz Group Inc. (www.greenbizgroup.com). May be reproduced for noncommercial purposes only, provided credit is given to GreenBiz Group Inc. and includes this copyright notice.
• Representative of the LEED system as a whole: only 2 percent of all LEED-certified New Construction projects were evaluated.
• Inclusive of LEED EBOM projects that rely on measured energy.
• The last USGBC-sponsored research on this topic.
• A cause for complacency that all is well on the LEED energy front.
LEED continues to rapidly tighten its energy requirements and the Building Performance Initiative was launched a year ago to figure out how and why some buildings’ performance does not at all conform with modeling predictions and in a large minority of cases is worse than existing buildings.
Building & Materials Reuse Perhaps people are staying put in existing buildings and not doing any rehab, but the percentage of certified projects reusing buildings decreased to 8-11 percent for LEED-certified projects compared with last year’s 12-15 percent of LEED NC and LEED CS projects reporting significant reuse of buildings and interior components.
For Commercial Interiors on the other hand, significantly more floor area was kept “as-is,” which made up for most of the decline in the new building area. In square footage terms this exceeds 107 million square feet to date, a slightly larger percentage increase compared with the increase in certified floor area. Our calculations show that rehabilitated floor area will exceed 400 million square feet by 2020 and approach 800 million square feet by 2030.
Embodied Energy Impacts We estimate that building and materials reuse in LEED buildings have saved cumulatively almost 73 million barrels of oil equivalent in embodied energy, which will grow to over 200 million barrels equivalent by 2030, which is approximately equivalent to the amount of oil currently imported from Russia.
Construction & Demolition Waste This year’s report benefits from updated waste diversion figures from the US EPA. Aggregate data show that over 60 percent of the C&D waste generated by LEED NC projects is diverted. CS and CI projects are estimated to have a weighted waste diversion rate also exceeding 60 percent. We also have information on EB solid waste management and occupant waste diversion, which are included this year. Between cumulative Certified and “Built To” projects, we estimate that, so far, LEED buildings have recycled or reused elsewhere a total of nearly 53 million tons of construction and consumer waste. These diversion figures are expected to expand to nearly 216 million tons in 2020 and 433 million tons in 2030.
Green Materials Impacts The varied use of materials and the lack of good data make an evaluation of materials’ other environmental impacts difficult. For this reason, LEED chose to evaluate several materials categories on a dollar basis, as will we.
Based on average materials costs, local and recycled-content building materials represented approximately $15 billion in cumulative spending through 2010. By 2030, cumulative spending in this area is expected to approach $120 billion. We note again this year that we believe these figures are conservative because they
Mat
eria
ls Im
pac
ts

30 © 2010 GreenBiz Group Inc. (www.greenbizgroup.com). May be reproduced for noncommercial purposes only, provided credit is given to GreenBiz Group Inc. and includes this copyright notice.
do not include the value of materials that are evaluated based on their indoor environmental quality characteristics, such as paints and adhesives.
Certified Wood There was a fairly substantial growth in the number of LEED projects specifying Forest Stewardship Council (FSC) wood compared with last year’s penetration of this measure.
Percent Projects Specifying FSC Wood23
NC CS CI
2010 41% 47% 27%
2009 38% 18% 19%
Based on average non-residential wood use estimates and the penetration of the certified wood credit in LEED, our evaluation shows that to date, over 580 million board-feet equivalent of certified wood has been installed in LEED projects. If current penetration rates continue, this utilization will exceed 5.3 billion board feet by 2030.
Anyone who fails to LEED-certify their green building, preferring to spend their
23For 50 percent of the value of wood products.
To date, over 580 million board-
feet equivalent of certified wood has
been installed in LEED projects.
2020
580 2,492 5,343
2020
LEED Use of Certified Wood(in Millions of Board Feet)
2010 2020 2030

31 © 2010 GreenBiz Group Inc. (www.greenbizgroup.com). May be reproduced for noncommercial purposes only, provided credit is given to GreenBiz Group Inc. and includes this copyright notice.
money on “real” green features, is foregoing thousands of dollars of market value for every dollar they “save.”
In the intervening year since our last look at the data, new reports on the market impact of LEED certification have emerged that clearly show the flaws of the “90/10 Syndrome” where people spend 90 percent of their time quantifying 10 percent of the benefits.
While operational savings are real and important, they are 10 percent or less of the economic value of LEED. The financial benefits in LEED are largely achieved through the enhancement of employee productivity and higher income from the market value of the LEED brand that gives confidence that the building is a better building. A growing number of studies are showing productivity gains far in excess of what we have been conservatively using in previous reports. In addition, there is growing data on the market value of LEED.
Productivity Salaries represent approximately 90 percent of the money flow through a building, the rest being amortized construction costs, operations & maintenance, including utilities. For our past estimates of green building benefits from LEED, we assumed a conservative range of 1 to 2 percent
$6,436
$74,620
203020202010
Indoor Air QualityImpacts of LEED(in millions of dollars)
$22,325
Ind
oo
r E
nvir
onm
enta
l Qua
lity

32 © 2010 GreenBiz Group Inc. (www.greenbizgroup.com). May be reproduced for noncommercial purposes only, provided credit is given to GreenBiz Group Inc. and includes this copyright notice.
24EPA Pamphlet: How Does Indoor Air Quality Impact Student Health and Performance? April 2010
25DCS is partly owned by Johnson Diversey, a sponsor of this report.
26Fuerst, F.; McAllister, P.M. (2008). Does it Pay to Be Green? Connecting Economic and Environmental Performance in Commercial Real Estate Markets
productivity increase in “built-to” and LEED-certified projects.
We believe that our past productivity estimates understate the true benefits of green. This year we up our LEED building productivity gain estimate to 4.88 percent, which is the reported value found by research by the University of San Diego (USD) with support from CB Richard Ellis on over 500 tenants in 124 buildings and a follow-up longitudinal study of 75 LEED EB projects indicate a productivity gain of nearly 5 percent. These buildings also reported an average of nearly three fewer sick days taken for an additional productivity gain of 1.2 percent. As a conservatism we do not include the reduced sick days benefit in our value of productivity assessment.
While not all buildings studied by USD reported these benefits, a range of studies reviewed by the USD researchers have uncovered productivity increases from green building measures ranging from 1 percent in manufacturing to over 25 percent in an Australian law office.
Green Cleaning and Productivity Maintenance costs are also a large part of the overall Net Operating Income (NOI) of a building, which often is used to evaluate the asset value of a property. The cost of cleaning a building can approach that of energy in many parts of the country, so boosting effectiveness and productivity in this area is important to the bottom line.
As experience with green cleaning grows, the evidence shows that costs come down and that productivity, whether it’s lower absenteeism or lower infection rates in schools as reported by the US EPA, increases24. And the 2008 book “Green Cleaning for Dummies” notes that effective green cleaning practices can reduce cleaning costs by 10 to 20 percent.
Daylight cleaning case studies by Daylight Cleaning Systems25 show that energy costs can decline by almost 8 percent, while tenants have expressed greater satisfaction in cleaning services and janitorial employees have lower turnover. In southern California, Fluor Corporation lowered cleaning costs by more than 20 cents per square foot—over 12 percent—using a daytime cleaning strategy and cleaning-related complaints decreased.
Some concerns raised about daylight cleaning include the practice of “waving off” maintenance staff if an occupant does not wish the room to be cleaned, which can present potential health problems if the room is not cleaned at all. In addition, for a variety of reasons, not all janitorial staff prefer daytime cleaning.
Market Value In 2008, Furst & McAllister26 conducted an analysis of over 3,000 US commercial properties of which 500 were either LEED-certified or Energy Star. After controlling for potentially confounding factors such as location, building age, size and vacancy rate, the analysis found that LEED buildings were renting for over 9 percent more than their conventional building counterparts and selling for an impressive 31 percent more. A follow-on study in 2009 by the same authors using an expanded data set of 15,000 benchmark buildings, 200 LEED buildings and over 800 Energy Star buildings found slightly lower rental premiums of 5 percent and an average sale price premium of 26 percent for
As experience with green cleaning
grows, the evidence shows that costs come down and
that productivity, whether it’s lower
absenteeism or lower infection
rates in schools, increases.

33 © 2010 GreenBiz Group Inc. (www.greenbizgroup.com). May be reproduced for noncommercial purposes only, provided credit is given to GreenBiz Group Inc. and includes this copyright notice.
27Miller & Pogue, 2009
LEED building.
These findings are corroborated by additional work done by CB Richard Ellis (CBRE) on LEED and BREEAM certified projects internationally, which found rental premiums between 2 and 6 percent. The same study found that green building cost premiums essentially offset the rental premiums, but goes on to note that the energy savings implemented through the greening program were essentially free.
Aggregate Economic Value from LEED We quantify the impact of the indoor environmental quality (IEQ) measures rewarded by LEED in terms of the economic value of increased productivity. Most of the IEQ measures in LEED do impact features that employees have said they value, such as daylight and views, good indoor air quality and thermal comfort. LEED buildings have been found to have better IEQ performance than their conventional counterparts.
Percentage of Respondents Agreeing or Strongly Agreeing27
47% Healthier indoor environment
55% Convenient access to transit
61% Easier to attract/retain employees
74% Good image for clients & public
70% Good image for owners & shareholders
Taking an average of the number of employees affected by various features of green buildings, we ascertained that an average of at least 1.5 million employees are currently enjoying improved indoor environments in LEED buildings at present. Even at the lower forecast growth rate of green, “green building workforce” is expected to approach 5 million by 2020, becoming almost 18 million strong by 2030. Even though these future head-counts are way below last year’s value, the increase in estimated productivity more than makes up for it.
More than ever, our results reinforce the notion that the bottom line of green is black: an estimated $6.4 billion has already been saved through added productivity of the “green building workforce.” Given continued growth in green buildings, we expect this number to grow significantly in the future: reaching between $22 billion by 2020, and totaling between $75 billion by 2030.
An estimated $6.4 billion has already
been saved through added productivity
of the “green building workforce.”
34 © 2010 GreenBiz Group Inc. (www.greenbizgroup.com). May be reproduced for noncommercial purposes only, provided credit is given to GreenBiz Group Inc. and includes this copyright notice.
The Big Picture 2010 Unfortunately, our crumbling, archaic economic system is causing retrenchment at the exact time we need to be redoubling our efforts.
This year is on pace to be the warmest year since records have been kept. Based on business as usual trends, the current worst-case climate scenarios make earlier projections seem quaint by comparison.
Last year, based on trends from the previous three years, cautious optimism that business-as-usual LEED might make a real difference was warranted. Optimism was cautious because, while LEED was penetrating rapidly, there was some unevenness in building performance, so our projections required a fairly broad span to accommodate a reasonable confidence interval.
So while we can say that over the last year our knowledge and certainty in the environmental performance of LEED buildings has grown, our forecasts of how rapidly this performance will further penetrate have shrunk considerably, to the point where at best there might be a zeroing-out of growth at 2008 levels of non-residential CO2 emissions, but there is quite unlikely to be any overall decrease even by 2030, unless it is forced by some draconian economic or energy crisis.
CO2 concentrations in excess of 450 parts per million (ppm)—current CO2 levels are at 380 ppm and rising 2-3 ppm per year—are feared to give rise to unmanageable global warming: A scenario that defies mitigation or adaptation. The general scientific consensus is that in order to maintain global carbon dioxide levels at less than 450 ppm, by 2050 carbon dioxide emissions would need to be reduced by 80 percent below those of the year 2000. To put the magnitude of this challenge in perspective, in spite of U.S. projected floor space increases of 150 percent, total building sector emissions will need to be only 20 percent of their current levels.
The Little Picture The good news is that LEED buildings continue to be a bit ahead in terms of their own performance relative to this goal. Average LEED non-residential buildings are 25 percent more efficient than average, which means they are about 4 years ahead of the trend.
The bad news is that LEED is improving at only a fraction of the 1.6 percent annual pace and will soon be overtaken. And when one considers that it’s not just LEED buildings that have to improve this rapidly, but the entire building sector must hit this reduction target, any complacency must evaporate.
The sad fact is that LEED buildings’ better performance will make little to no dent in reducing of building sector CO2 emissions without greater penetration. And without greater savings per building, we have no hope of hitting the 80 percent reduction.
We need more savings, and faster, in order to reduce total emissions at the necessary scale, scope and speed.
And for all the LEED critics’ braying about its inadequacy at saving energy and the need to move to Living Building Challenge or some other “real” green building certification scheme, one can’t help but notice that only three Living Buildings have been certified in the four years since the system launched and those in October 2010.
The sad fact is that LEED buildings’
better performance will make little to no
dent in reducing of building sector CO2
emissions without greater penetration.
The
Big
Pic
ture

35 © 2010 GreenBiz Group Inc. (www.greenbizgroup.com). May be reproduced for noncommercial purposes only, provided credit is given to GreenBiz Group Inc. and includes this copyright notice.
This is not at all to knock LBC and deeper green systems. Pushing the envelope is crucial and needed: Indeed, LEED is developing a “beyond Platinum” tier.
Rather, we bring this up to point out that you can lead a horse to water, but you can’t make it drink. There are market, technical and operational challenges in progressing beyond the bar LEED has set without trespassing on the paradox of Gandhi’s heretic: Leaders are tolerated so long as they are not too far ahead of the pack.
In practice, LEED buildings are getting more energy-efficient, but they are not by any means bumping up against the energy efficiency credit limits within the system. So, LEED’s lack of energy requirements is not the problem. There are structural problems in our economic and political systems that prevent adoption of the necessary technological and operational changes to bring on more building efficiency more quickly.
USGBC improvements to the LEED system have led to increased energy efficiency, but the current market downturn makes longer-term predictions highly uncertain. While LEED EB energy-saving performance is on track at 35 percent average savings, its penetration is severely lagging what we believe is necessary to hit any kind of meaningful reduction in carbon pollution. Updated BD&C standard certification figures show that average energy efficiency has improved by about 7 percent since 2007, but it is still less than 30 percent more efficient than the ASHRAE 90.1 requirements. New construction penetration is bumping up against the 25 percent market share upper limit
The efficiency performance of certified LEED EB projects and their growing penetration is encouraging, but even our most optimistic forecast would need to double and be coupled with significant improvements in minimum efficiency standards—for example national adoption of ASHRAE 189, which itself would need to improve about 5 percent during each three-year revision cycle—in order to have even a remote chance of hitting the building wedge even in the United States.
Market Transformation Market mechanisms in the form of technology incentives and energy prices that reflect true environmental and social costs will also be needed to accomplish these goals.
• Regulators must enable utilities to significantly ramp up their energy efficiency incentive programs.
• “Golden carrots” or X-Prizes for more efficient new-generation appliances and equipment should be continuously available
• Grid connection fees could be established that reward efficient “grid-smart” buildings with low to no fees, while code-minimum buildings should get socked with hefty fees.
• Banks and insurance companies must follow leaders such as Fireman’s Fund and expand their current offerings for green buildings to reflect the lower risks of green buildings, as well as help minimize total extra initial costs of green.
• Non-economic incentives, such as accelerated permit approval and project density bonuses for advanced levels of efficiency will also help
The efficiency performance of
LEED EB projects and their growing
penetration is encouraging, but
even our most optimistic forecast
would need to double in order to
have even a remote chance of hitting
the building wedge in the U.S.

36 © 2010 GreenBiz Group Inc. (www.greenbizgroup.com). May be reproduced for noncommercial purposes only, provided credit is given to GreenBiz Group Inc. and includes this copyright notice.
improve green uptake.
• In addition, policymakers must price carbon. We know with 100% certainty that zero is the only price that is precisely wrong. No matter what price is put on carbon, approximately right will be better than what we have now.
Unfortunately, under our current economic construct, we are required to cost-justify our continued existence as a species and our financial tools render all costs and benefits insignificant within twenty years, so how can we possibly make “rational” decisions on reducing carbon emissions where the effective time scale is centuries or even a millennia?

37 © 2010 GreenBiz Group Inc. (www.greenbizgroup.com). May be reproduced for noncommercial purposes only, provided credit is given to GreenBiz Group Inc. and includes this copyright notice.
Floor Area Calculations The calculation of environmental impacts in this report has its foundation in a spreadsheet model that quantifies and projects the total floor space of certified and registered LEED NC, LEED CS, LEED CI, LEED EB/EBOM and LEED for Schools and LEED for Retail Application Guide projects. Based on data available from the USGBC and the methodology described below, we calculated floor area streams of LEED-certified and “built-to” LEED projects into the future. Projects that register, but do not certify are classified as “built-to” LEED (see below).
2000-2010: We used actual historical figures from the US Green Building Council though 2009. For 2010, we used actual project figures through the end of September 2010 and assumed that 4th quarter results would mirror monthly average registrations and certifications from the first three quarters.
2020 and 2030 Projections: Based on reported construction starts and LEED project registration data, we can estimate a “penetration” of LEED projects in the market. This penetration data served as the starting point for making a best guess on the future trajectory of LEED. We modeled our post-2010 projections of LEED registrations based on a Pearl-Reed growth curve, which is an S-shaped function that trends toward an upward limit. Pearl-Reed curves often are used to simulate and predict technology penetration trends.
We assume that the maximum penetration of LEED registered projects is 25 percent of the “addressable market” for any given standard. This forms the upward limit of the Pearl-Reed S-curve. Each standard, based on historical performance and market size has a different curve. Using historical data, we then made a best fit to a Pearl-Reed curve and used this curve to project registrations forward.
In our 2009 analysis, based on the previous three years’ experience, it appeared that the addressable market was bigger than originally thought, which led us to expand the size of this market—the biggest impact here was in the Existing Building market. It also appeared, based on the previous three years’ registered floor area, that LEED projects were penetrating the market quickly. The combination led us to use fairly short, steep S-curves28 that flattened at fairly high annual floor area numbers.
This year’s results threw cold water on our own “irrational exuberance” and we re-evaluated the addressable market for each standard and the rate at which it would penetrate. In all cases, the addressable market was smaller and the penetration curve flatter29 than last year’s analysis, which is why there is a lot less projected floor area in LEED in this year’s analysis than last year’s.
Once we determine expected project registrations through the application of the Pearl-Reed formula to the addressable market, we then “graduate” the registered projects to either certified or “built-to” projects. On average, based on historical certification rates to date, about 50 percent of CS, CI & EBOM projects that register ultimately certify, though NC projects seem to only certify about 40 percent of registered projects, which is down from 70 percent and 60 percent, respectively last year.
28Based on data through last year, the best-fitting curve was a 12-year curve.
29We re-set most of the S-curves to 20-year curves which are much flatter than the 12-year curves we used earlier. The flatter rate of uptake reflects both the expected lingering effects of the economic crisis and the expected continuing ramp-up of green requirements for LEED certification.
Ap
pen
dix
: Met
hod
olo
gy

38 © 2010 GreenBiz Group Inc. (www.greenbizgroup.com). May be reproduced for noncommercial purposes only, provided credit is given to GreenBiz Group Inc. and includes this copyright notice.
“Built to LEED” and other Free-driver effects In evaluating the impacts of LEED we also created a category we call “built to LEED”. Generally, these are projects that register, but don’t certify—approximately 50 percent of registered projects to date according to our research. While we do not expect these buildings to achieve the same level of green performance of LEED-certified buildings, the performance is not zero and, in aggregate, their environmental impact is not trivial. Though we do not have measured figures to corroborate the impact of LEED on these buildings, we assume that their achievement is half that of a certified project.
Even this might be conservative due to other free-driver effects of the system. For example, anecdotal evidence that many projects design to LEED but don’t bother to register. In addition, we do not give any credit to LEED for driving improvements in the ASHRAE standards. From 1989 to 1999 there were no changes or improvements in ASHRAE 90.1, but since LEED was introduced in 2000, which used ASHRAE 90.1 as the core of its energy performance requirements, the standard has been upgraded in 2001, 2004 and again, this year. 2007, Moreover, ASHRAE 189 is a green building model code inspired by LEED.
International Projects The number of overseas LEED projects has grown to represent over 28 percent of all the floor area in the system. However, because of the infeasibility of developing environmental performance baselines for the more than 100 countries where LEED projects are registered, the commercial model evaluates only the environmental impacts of green buildings in the U.S. As an order of magnitude, however it would be safe to say that the global environmental impact of LEED is at least 20 percent larger than is reported here.
Environmental Impact Calculations We used credit achievement data from nearly 3,000 LEED-certified Projects certified since 2006. In each system we know what percentage of projects are awarded for each credit. To determine the “average” achievement of a typical LEED building, we take this percentage of achievement and apply it to the level of performance to get a weighted average savings amount, which we then multiply that a baseline as described in each section below. Where credits had several tiers, we calculated the marginal achievement at each level by subtracting the next highest tier from the previous one. For example, if 70 percent of projects achieve MR4.1 and 50 percent of projects achieve MR4.2, then we know that 20 percent of projects achieve only MR4.1. If MR4.1 has 10 percent green materials and 4.2 has 20 percent, then on average we know that (.2*.1)+(.5*.2) an “average” LEED project has 12 percent green materials. We use this figure across the value of materials for projects that are LEED-certified and “Built-to” LEED.30
Site/Land-Use Impacts Methodology For the various site-related impacts, we calculate an average plot size based on average project floor area and an estimated average floor-area ratio (FAR) for each project. From this we calculate the reductions in erosion runoff, site disturbance, heat islands, etc.
According to research by the Natural Resources Defense Council (NRDC) and the Transportation Research Board of the National Academies, location-efficient development—a combination of density and transit accessibility—results in a
30As a conservatism, Built-to LEED projects are assumed to have half of the green impact of a LEED-certified building.
39 © 2010 GreenBiz Group Inc. (www.greenbizgroup.com). May be reproduced for noncommercial purposes only, provided credit is given to GreenBiz Group Inc. and includes this copyright notice.
30 percent reduction in vehicle miles traveled (VMT) and a 44 percent reduction in trip generation, respectively. We use a somewhat conservative figure of 35 percent VMT reduction as a proxy for the range of measures used in LEED for reduce travel demand.
WATER SAVINGS
We derived baseline water consumption figures from the recently released 2005 US Geological Survey (USGS) figure for daily water use in order to obtain an annual per square foot figure for water consumption in commercial buildings. This served as a baseline case against which LEED water savings were measured.
Plumbing and Cooling Tower Savings: To derive water savings estimates from this end-use, we took a weighted average of the percentage of water saved in LEED buildings based on the percentage of projects that have achieved specific credit ratings and quantifiable (20 percent or 30 percent) water savings requirements. In order to ascertain total savings, we first multiplied the percentage savings by the baseline gallons of water consumed per square foot of commercial space. Taking climate disparities into consideration—i.e. warmer climates demand more air conditioning, and thus buildings in warm climates use more water in cooling tower applications—as well as the water consumption levels that differ according to the age of buildings, we conservatively took 13 gallons of water per square foot per day as the baseline number against which we compared NC and CS buildings, and 22 gallons against which we compared existing buildings. We finally used the derived gallons of water per square foot per day saved in green buildings and multiplied it by total LEED floor area to yield an aggregate figure.
For cooling tower savings, we had pretty good idea about water use for plumbing and for landscaping, as well as total consumption. The rest we assumed was for cooling towers between 33 & 37 gallons per square foot per day depending on the type of building. We compared this aggregate figure with some cooling tower water saving case studies and found pretty good agreement. Water savings we assumed were proportional to energy savings.
Landscaping Water Reductions To derive landscaping-related water savings, we similarly took a weighted average of the percentage of water saved in LEED buildings based on the percentage of projects that have achieved quantified landscaping water reductions. In order to ascertain total savings, we first multiplied the percentage savings times the baseline gallons of water consumed on landscaping per square foot of commercial space to get the per square foot savings. As with plumbing and cooling tower use, we took geographic water consumption disparities into consideration, and conservatively used 10 gallons of water per square foot per day as the baseline number of water used for landscaping. We finally took the derived gallons of water per square foot saved in landscaping of green buildings and multiplied it by total LEED floor area to yield an aggregate figure.
Wastewater Reductions Wastewater figures were derived in a similar fashion, using an average of 55 gallons of water generated per square foot daily in commercial buildings. Considering that implied reduction in usage from efficient cooling towers is not included, the final estimated savings are believed to be a

40 © 2010 GreenBiz Group Inc. (www.greenbizgroup.com). May be reproduced for noncommercial purposes only, provided credit is given to GreenBiz Group Inc. and includes this copyright notice.
conservative estimate.
Correction of 2009 wastewater numbers. Upon review of the 2009 numbers we found several methodological issues and errors which we have corrected in this version, but because these mistakes reduce the total waste water volume savings so much that we felt we needed to put forward the recalculated numbers as a basis for comparison. These figures are summarized and compared with the original wastewater reduction numbers in the table above. Perhaps the largest source of inflation of the wastewater figures was using the values for landscape water reduction, which had much higher penetration, than the actual incidence for the wastewater reduction credit. In addition, we mistakenly projected the wastewater reduction credit from the original LEED EB out through 2030, when there is now no such credit in EBOM V2 or V3. We simply have multiplied to cumulative amount for the 2010 value for the additional years, with a small factor for project retirement.
Energy Methodological Issues We continued to use the 2003 CBECS (Commercial Building Energy Consumption Survey) report as the primary data source for Base Case primary energy, as opposed to DOE’s Buildings Energy Data Book (BEDB). We felt that CBECS provided a more consistent and survey-based data source across the range of calculations than the BEDB, which combines survey data with calculations. Unfortunately, the 2007 CBECS data is still not available, though the rumor is that the mean EUI for year 2000 to date buildings went up compared to 2003. This is actually not surprising given that is exactly what happened between the 1992 CBECS and the 1995 CBECS for 1990s buildings as shown in the table below.
90s Buildings - Cohorts
EUI-Site Energy
EUI-Primary Energy Source
1992 CBECS‘90-’92
69 157Table 3.2-Total Energy Consumption by Major Fuel, 1992
1995 CBECS‘90-9231
115 2421995 CBECS-Table 1. Total Consumption Tables
‘90-’95 105 2251995 CBECS-Table 1. Total Consumption Tables
1999 CBECS-90s 98 220Table C1: Total Energy Consumption by Major Fuel
2003 CBECS-90s 89 201 2003 CBECS Table C1 (Non-Mall Buildings) p. 249
2003 CBECS‘00-’03
80 187 2003 CBECS Table C1 (Non-Mall Buildings) p. 249
2010 Savings & Baseline Estimates vs. 2008 & 2009 Report The two tables below compare the underlying information behind the calculated energy savings.
31Commercial Building Energy Consumption Survey (CBECS)

41 © 2010 GreenBiz Group Inc. (www.greenbizgroup.com). May be reproduced for noncommercial purposes only, provided credit is given to GreenBiz Group Inc. and includes this copyright notice.
The data from nearly 3,000 LEED-certified project scorecards provided the percentage savings for the report. Because we had so much more data this year, we did not feel as though we needed to present high and low cases for the energy savings.
Renewable Energy Savings Methodology We used the breakdown of LEED projects that have attained various percentages of on-site renewable energy generation to obtain a weighted average of total renewable source electricity green buildings have contributed. We introduced a 20 percent measurement adjustment for LEED CS floor area to reflect the smaller baseline of consumption and to account for potential double-counting of LEED CI projects. Finally, we assumed that all renewable energy associated with LEED EB/EBOM came in the form of RECs and not on-site generated electricity.
Commissioning This year, as an additional conservatism, we have assumed that the value of commissioning and M&V is represented in the energy savings only. Although less than 25 percent of the 640+ buildings in the updated 2009 LBNL report on the value of commissioning were commissioned in the context of LEED, we assume that the value of energy and non-energy benefits resulting from commissioning are embedded in the LEED energy savings results. Consistent with this approach we also assumed that the achievement of M&V credits contributed exclusively to the persistence of energy savings and do not represent an independent benefit of LEED.
Base Case-Primary Energy
(kBtu/SF)
% Savings in LEED Projects
LEED Primary Energy Savings
(kBtu/SF)
2010 & 2009 2008 2010 2009 & 2008 2010 2009 & 2008
LEED NC 2.0, 2.1 20932 241 23% 22-31% 48.5 60-75
LEED NC 2.2 19433 24% 16-24% 46 33-49
CS 2.0 7734 241 17% 15-31% 33 12-15
EB/EBOM 19135 241 33% 28-37% 63 54-71
CI 17% 14.1 14.1
31Commercial Building Energy Consumption Survey (CBECS)
32Consistent with primary energy use in buildings built in the1990s per 2003 CBECS.
33Consistent with primary energy use in buildings built in the 2000s per 2003 CBECS. Though we believe this dataset is too small to be reliable and that actual energy use in this cohort may be higher than the initial reporting, we use this figure as a conservatism.
34Assumed to be 40 percent of New Construction baseline to reflect smaller portion of load addressed by the standard.
35Consistent with primary energy use in “all buildings” surveyed in the 2003 CBECS, including mall buildings.

42 © 2010 GreenBiz Group Inc. (www.greenbizgroup.com). May be reproduced for noncommercial purposes only, provided credit is given to GreenBiz Group Inc. and includes this copyright notice.
Conservatisms in Energy Calculation Given the range of inconsistent data sources, we continue to be conservative in our calculation methods. When ranges of impacts of LEED measures were calculated, we used the low figures derived. In addition, we only based our savings on the LEED requirement, as opposed to thresholds actually achieved. For example, if a project purchased renewable electricity to cover 75 percent of its needs, that project only would be quantified at the 50 percent LEED threshold. Similarly, projects achieving energy efficiency credit in between the point thresholds are assumed to save at the lower level. In addition, we assume no “free driver” effects—for example, improvements in the ASHRAE 90.1 standard or the development of ASHRAE Standard 189.
Materials For most of the materials items (recycled content, rapidly renewable, etc. but not wood or low-emitting materials) we estimated an average construction cost per square foot based on Census data for value put in place and the estimated floor area built during the last ten years. We then used the default materials value in LEED–45 percent of total costs–as a proxy for the value of construction materials. Then as per the methodology described above, we took the floor area-weighted penetration of each standard times the tiered LEED requirement. For example, if rapidly renewable materials for 5 percent of material value had a 5 percent penetration in a particular standard, then we would multiply 5 percent by 5 percent times the floor area times the average value of construction for that type of floor area—both Core & Shell and CI had fractional values of the average New Construction floor area cost.
IEQ Methodology To determine the number of employees currently enjoying better IEQ through green building design, we began by using the CBECS figure for commercial floor space per employee. Determining the average number of employees was a simple expression of the total floor space divided by the per employee floor space. This figure probably understates the actual number of people who work in an average LEED building, but we use it as a conservatism.
The “green building workforce” figure was then multiplied by the implementation rate—or the percentage of floor space affected by various IEQ-related improvements. For example, improved ventilation effectiveness was implemented by roughly 25 percent of LEED projects, so the number of employees affected by this feature would be roughly one-fourth the total “green building workforce.” Then these workforce figures were averaged to get the final figure.
Using Department of Commerce figures to determine average annual earnings of the employed workforce. This value is less than half of the average salary figures from the University of San Diego (USD) survey of 124 buildings. Given an increasing convergence around the 5 percent productivity number from various studies, we used the 4.88 percent productivity found by the USD study of CBRE buildings. Additionally, this calculation excludes some green building-related health benefits such as fewer reported sick days, increasing its conservatism.
36For CS we used 70 percent the NC value and for CI we used 30 percent.

43 © 2010 GreenBiz Group Inc. (www.greenbizgroup.com). May be reproduced for noncommercial purposes only, provided credit is given to GreenBiz Group Inc. and includes this copyright notice.
Ab
out
the
Aut
hor
Rob Watson is the Executive Editor of GreenerBuildings.com, the one-stop website for the green design, construction and operation of commercial and institutional buildings. GreenerBuildings.com is produced by GreenBiz Group, the leading media and business information services company focused exclusively on the greening of mainstream business.
Described by Thomas Friedman as “one of America’s best environmental minds,” Watson also serves as the Chairman, CEO & Chief Scientist of the EcoTech International Group, which helps clients around the world achieve cost-effective high performance green buildings through design, technology and operations.
Under Rob’s direction as the “Founding Father of LEED” and as its national Steering Committee Chairman between 1994 and 2005, the U.S. Green Building Council’s LEED rating system became the most widespread and fastest-growing standard by which green buildings are measured worldwide. A pioneer of the modern green building movement for over 20 years, in 2007 Rob founded the EcoTech International Group to meet the fast-growing demand for green building technologies and services in China, India and the U.S.

44 © 2010 GreenBiz Group Inc. (www.greenbizgroup.com). May be reproduced for noncommercial purposes only, provided credit is given to GreenBiz Group Inc. and includes this copyright notice.
Diversey, Inc. is committed to a cleaner, healthier future. Its products, systems and expertise make food, drink and facilities safer and more hygienic for consumers and for building occupants. With sales into more than 175 countries, Diversey is a leading global provider of commercial cleaning, sanitation and hygiene solutions. The company serves customers in the building management, lodging, food service, retail, health care, and food and beverage sectors. Diversey is headquartered in Sturtevant, Wisconsin, USA. Diversey, Inc. is formerly JohnsonDiversey, Inc. To learn more, visit www.diversey.com
DNV is a global provider of services for managing risk, helping customers to safely and responsibly improve their business performance. We offer assessment services related to green building, and energy efficiency strategies including Leadership in Energy and Environmental Design (LEED™), ASHRAE 90.1, California Title-24, Energy Star, ISO 50001. Visit www.dnv.us for more information.
As a global specialist in energy management with operations in more than 100 countries, Schneider Electric offers integrated solutions across multiple market segments, including leadership positions in energy and infrastructure, industrial processes, building automation, and data centers/networks, as well as a broad presence in residential applications. Focused on making energy safe, reliable, and efficient, the company’s 100,000+ employees achieved sales of more than $22 billion in 2009, through an active commitment to help individuals and organizations “Make the most of their energy.” Visit www.schneider-electric.us to learn more.
Ab
out
the
sp
ons
ors
45 © 2010 GreenBiz Group Inc. (www.greenbizgroup.com). May be reproduced for noncommercial purposes only, provided credit is given to GreenBiz Group Inc. and includes this copyright notice.
GreenBiz Group is the leading media and business information services company focusing on the greening of mainstream business. In addition to our award-winning website, GreenBiz.com®, GreenBiz Group also produces research, including the annual State of Green Business report and the Green Building Market and Impact Report; events, including the State of Green Business Forums and the GreenBiz Innovation Forum; and the GreenBiz Executive Network, a peer-to-peer learning forum for senior sustainability executives.
More information: www.greenbizgroup.com.
Ab
out
Gre
enB
iz G
roup
Defining and accelerating the business of sustainability.


![Materials Technology for Environmentally Green Micro ...lsi.usp.br/~acseabra/grad/2613_files/[4] Materials Technology for... · Materials Technology for Environmentally Green](https://img.dokumen.tips/doc/110x75/5b14f03d7f8b9a294c8cdbae/materials-technology-for-environmentally-green-micro-lsiuspbracseabragrad2613files4.jpg)