Embed Size (px)
Citation preview

United States Office of Water EPA/820/B-95/008 Environmental Protection Office of Science and Technology March 1995 Agency Washington, DC 20460
Great Lakes Water Quality Initiative Criteria Documents for
the Protection of Wildlife
DDT Mercury
2,3,7,8-TCDD PCBs

EPA/820/B-95/008 March 1995
Great Lakes
Water Quality Initiative Criteria Documents for
the Protection of Wildlife DDT; Mercury; 2,3,7,8-TCDD; PCBs
Office of Science and Technology Office of Water United States Environmental Protection Agency Washington, D.C. 20460

DISCLAIMER This document has been reviewed by the Health and Ecological Criteria Division, Office of Science and Technology, U.S. Environmental Protection Agency, and approved for publication as a support document for the Great Lakes Water Quality Initiative. Mention of trade names and commercial products does not constitute endorsement of their use. AVAILABILITY NOTICE This document is available for a fee upon written request or telephone call to:
National Technical Information Center (NTIS)
U.S. Department of Commerce 5285 Port Royal Road
Springfield, VA 22161 (800) 553-6847 (703) 487-4650
NTIS Document Number: PB95-187324
or
Education Resources Information Center/Clearinghouse for Science, Mathematics, and Environemntal Education (ERIC/CSMEE)
1200 Chambers Road, Room 310 Columbus, OH 43212
(614) 292-6717 ERIC Number: D052

Contents CHAPTER 1 Tier I Wildlife Criteria for p,p'- Dichlorodiphenyltrichloroethane (DDT) and Metabolites I. Literature Review............................................................................................................................. 1-1 II. Calculation of Mammalian Wildlife Value ...................................................................................... 1-1
i. Acute and Short-term Toxicity Studies..................................................................................... 1-1 ii. Subchronic and Chronic Toxicity Studies ................................................................................ 1-2 iii. Mammalian Wildlife Value Calculation ................................................................................... 1-6 iv. Sensitivity Analysis for Mammalian Wildlife Value................................................................ 1-8
III. Calculation of Avian Wildlife Value ............................................................................................... 1-9
i. Acute and Short-term Toxicity Studies..................................................................................... 1-9 ii. Subchronci and Chronic Toxicity Studies .............................................................................. 1-10 iii. Avian Wildlife Value Calculation........................................................................................... 1-15 iv. Sensitivity Analysis for Avian Wildlife Value ....................................................................... 1-17
IV. Great Lakes Wildlife Criterion...................................................................................................... 1-20
i. Discussion of Uncertainties .................................................................................................... 1-20 V. References ...................................................................................................................................... 1-20 CHAPTER 2 Tier I Wildlife Criteria for Mercury (Including Methylmercury)
I. Literature Review ............................................................................................................................ 2-1 II. Calculation of Mammalian Wildlife Value...................................................................................... 2-1
i. Acute and Short-term Toxicity ................................................................................................. 2-1 ii. Subchronic and Chronic Toxicity ............................................................................................. 2-2 iii. Mammalian Wildlife Value Calculation ................................................................................... 2-5 iv. Sensitivity Analysis for Mammalian Wildlife Value ................................................................ 2-8
III. Calculation of Avian Wildlife Value ............................................................................................... 2-8
i. Acute and Short-term Toxicity ................................................................................................ 2-8 ii. Subchronic and Chronic Toxicity ........................................................................................... 2-10 iii. Avian Wildlife Value Calculation........................................................................................... 2-15
iv Sensitivity Analysis for Avian Wildlife Value .............................................................................. 2-17 IV. Great Lakes Wildlife Criterion ...................................................................................................... 2-18
i. Discussion of Uncertainties..................................................................................................... 2-18 V. References...................................................................................................................................... 2-18
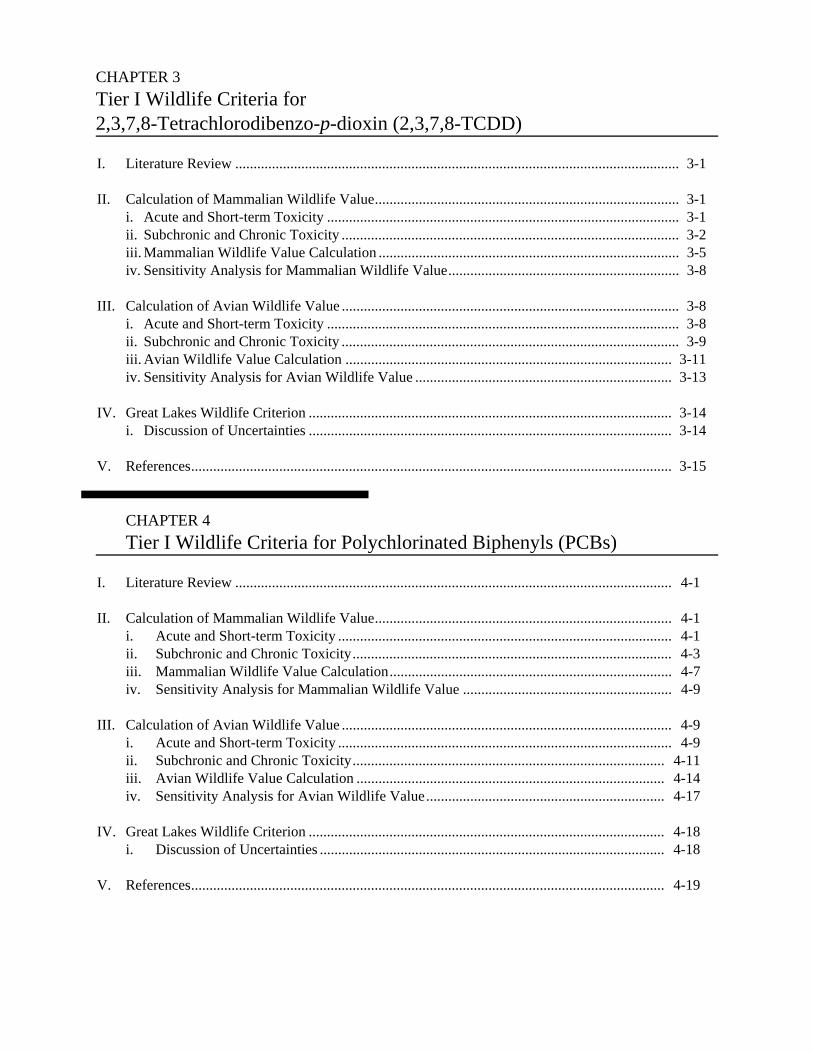
CHAPTER 3 Tier I Wildlife Criteria for 2,3,7,8-Tetrachlorodibenzo-p-dioxin (2,3,7,8-TCDD)
I. Literature Review ......................................................................................................................... 3-1
II. Calculation of Mammalian Wildlife Value................................................................................... 3-1
i. Acute and Short-term Toxicity ................................................................................................ 3-1 ii. Subchronic and Chronic Toxicity ............................................................................................ 3-2 iii. Mammalian Wildlife Value Calculation .................................................................................. 3-5 iv. Sensitivity Analysis for Mammalian Wildlife Value............................................................... 3-8
III. Calculation of Avian Wildlife Value ............................................................................................ 3-8 i. Acute and Short-term Toxicity ................................................................................................ 3-8 ii. Subchronic and Chronic Toxicity ............................................................................................ 3-9 iii. Avian Wildlife Value Calculation ......................................................................................... 3-11 iv. Sensitivity Analysis for Avian Wildlife Value ...................................................................... 3-13
IV. Great Lakes Wildlife Criterion ................................................................................................... 3-14 i. Discussion of Uncertainties ................................................................................................... 3-14
V. References................................................................................................................................... 3-15 CHAPTER 4 Tier I Wildlife Criteria for Polychlorinated Biphenyls (PCBs)
I. Literature Review ....................................................................................................................... 4-1
II. Calculation of Mammalian Wildlife Value................................................................................. 4-1 i. Acute and Short-term Toxicity ........................................................................................... 4-1 ii. Subchronic and Chronic Toxicity....................................................................................... 4-3 iii. Mammalian Wildlife Value Calculation............................................................................. 4-7 iv. Sensitivity Analysis for Mammalian Wildlife Value ......................................................... 4-9
III. Calculation of Avian Wildlife Value .......................................................................................... 4-9 i. Acute and Short-term Toxicity ........................................................................................... 4-9 ii. Subchronic and Chronic Toxicity..................................................................................... 4-11 iii. Avian Wildlife Value Calculation .................................................................................... 4-14 iv. Sensitivity Analysis for Avian Wildlife Value................................................................. 4-17
IV. Great Lakes Wildlife Criterion ................................................................................................. 4-18 i. Discussion of Uncertainties .............................................................................................. 4-18
V. References................................................................................................................................. 4-19


1-1
Tier I Wildlife Criteria for p,p'- Dichlorodiphenyltrichloroethane (DDT) and Metabolites I. Literature Review A review of mammalian and avian toxicity data for p,p'-dichlorodiphenyltrichloroethane (DDT)
and its metabolites (DDD and DDE), collectively referred to as DDTr, was based on literature received through computer-based (CAS and BIOSIS) as well as manual searches. A total of 110 references were screened for dose-response data. The majority of those references consisted of studies on avian species. Those references which were reviewed in detail, specifically those that contain dose-response data, are cited in Section V. In this chapter, ppm indicates parts per million on a wet weight basis unless otherwise indicated.
II. Calculation of Mammalian Wildlife Value i. Acute and Short-term Toxicity According to the RTECS database (NIOSH, 1992), the single-dose oral LD50 values for DDT
range from 87 mg/kg for the rat to more than 5,000 mg/kg for the hamster (See Table 1-1). LD50 values for DDT administered by other exposure routes range from 9.1 to 1,930 mg/kg (NIOSH, 1992). Aulerich and Ringer (1970) reported a 48-hour lethal dose for intraperitoneal (i.p.) injection of DDT in mink (Mustela vison) to be between 350 and 400 mg/kg; however, they did not report an LD50 value.
Table 1-1. Single Dose Mammalian Toxicity Values for DDT (Cont.)
Route
Species
LD50 (mg/kg)
oral
rat
87
oral
rat
152a
oral
mouse
135
oral
dog
150

Table 1-1. Single Dose Mammalian Toxicity Values
for DDT (Cont.)
Route
Species
LD50 (mg/kg)
oral monkey 200
oral
cat
250
oral
rabbit
250
oral
guinea pig
150
oral
hamster
> 5,000
dermal
rat
1,930
dermal
rabbit
300
dermal
guinea pig
1,000
i.p.
rat
9.1
i.p.
mouse
32
s.c.
rat
1,500
s.c.
rabbit
250
s.c.
guinea pig
900
i.v.
rat
68
i.v.
mouse
68.5 Source: NIOSH (1992).
ii. Subchronic and Chronic Toxicity No suitable subchronic or chronic studies were found for mammalian wildlife in which dose-
response data were reported. Gilbert (1969) did examine the effects of DDE found in fish collected from the Miramichi River in New Brunswick, Canada, on mortality and reproduction in mink. Gilbert (1969) fed 10 male and 10 female mink a contaminated fish ration containing 0.58 ppm DDE and only traces of DDT and other DDT metabolites; same-sex litter mates served as controls. Three male and two female mink (total of 5/20 mink) exposed to DDE in their diet died within 20 days, whereas none of the control mink died during that time. The animals that died exhibited higher liver and brain tissue DDTr concentrations than animals that did not die during the experiment. Thus a LOAEL, but no NOAEL, could be identified for mortality in mink. Using a captive ranch mink body weight of 1 kg and food consumption rate of 0.15 kg/day, provided in the Great Lakes Water Quality Initiative (GLWQI) Technical Support Document (TSD) for Wildlife Criteria, the results from this study suggest an unbounded LOAEL for mink mortality of 0.087 mg/kg-day (0.58 ppm in the diet). This value may overestimate the toxicity of DDE to mink, however, because Gilbert did not examine the fish for residues of other toxic contaminants, such as PCBs or mercury, that also could be toxic to mink. Moreover, the mink that died showed paralysis of the back limbs and other symptoms of thiaminase poisoning (a thiamine-destroying enzyme occurs in certain fish species). Thus, the mink that died may have been stressed by thiaminase in addition to DDE. With the death of the five mink, the remainder of the experimental group was then maintained on a control ration, and intermittently on contaminated feed, for two different periods lasting up to 47 days. DDTr residues were found to

1-3
be greatest in adipose tissues and to consist primarily of DDE. The whelping rate among the experimental animals was approximately half that of controls, and the average number of live kits 24 hours after birth was significantly reduced among the experimental females. However, it is not possible to identify a LOAEL for reproductive effects from these data because the exposures to DDE were intermittent and the total DDTr intake after day 20 could not be quantified.
Aulerich and Ringer (1970) exposed mink kits to either 0 ppm DDTr, 100 ppm DDE, 100 ppm
DDD, or 100 ppm DDT and 50 ppm DDD from weaning through furring, reproduction, and early kit growth. They found no effects on survivorship or growth, and histopathologic examination of the tissues after five months of exposure revealed no pathological lesions that could be attributed to the chlorinated hydrocarbon poisoning. Because the investigators did not report the body weights or food ingestion rates of the growing mink, it is not possible to estimate the average exposure dose expressed as mg DDT,DDD/kg-day.
From the study of Bernard and Gaertner (1964), a LOAEL for reproduction and a LOAEL and
NOAEL for mortality in mice exposed to DDT in their diet is indicated. In one test, mice were exposed to dietary levels of DDT of 0, 100, 200, 300, and 600 ppm for up to 90 days. DDT-related mortality occurred in the 300 ppm group, suggesting a LOAEL for mortality of 300 ppm and a NOAEL of 200 ppm. Assuming that adult laboratory mice consume 0.17 grams of food for every gram of body weight (i.e., 0.17 kg/kg-day; U.S. EPA, 1988 and GLWQI TSD for Wildlife Criteria), the LOAEL for mortality would correspond to a dose of 51 mg/kg-day, and the NOAEL would correspond to 34 mg/kg-day. In two other tests, Bernard and Gaertner (1964) examined the reproductive success of mice exposed to 0, 200, or 300 ppm DDT in the diet for up to 70 days. The number of females producing litters was much smaller in the 200 ppm group than in the control group in one of the two tests. This indicates an unbounded LOAEL for reproduction in mice of 200 ppm. Using the same food ingestion rate as above, the LOAEL for reproduction in mice would correspond to a dose of 34 mg/kg-day.
A study by Cannon and Holcomb (1968) identified a lower unbounded LOAEL for mortality in
mice (4 to 5 months old) exposed to DDT than the LOAEL in Bernard and Gaertner's (1964) study. Cannon and Holcomb (1968) exposed mice to DDT at levels of 0, 200, and 300 ppm DDT in the diet for up to 72 days. The number of male mice dying during the study and the number of female mice dying during gestation were higher and the number of young surviving was lower for both test groups compared with the control. This study therefore identifies an unbounded LOAEL of 200 ppm for mortality. Using the same food ingestion assumption as above, the LOAEL for mortality in mice corresponds to a dose of 34 mg/kg-day.
Turasov et al. (1973) conducted a six-generation study of tumors in CF-1 mice exposed to DDT.
The investigators exposed mice to dietary DDT levels of 0, 2, 10, 50, and 250 ppm DDT for six consecutive generations in a study that included 3,987 individual mice. Survival was statistically decreased and liver tumors increased in males of all the exposure groups compared to the controls, although only survival of the males exposed to 250 ppm was reduced by as much as 20 percent. In contrast, in females, only the highest dose of 250 ppm shortened the lifespan. The average lifespan of males and females in the 250 ppm exposure group was reduced from a control level of approximately 100 to 120 weeks to approximately 80 to 90 weeks, or by approximately 20 to 35 percent. Decreased longevity of male, but not female, mice is not likely to have population-level impacts in the field. Thus, the 250 ppm exposure level represents a LOAEL for reduced lifespan in female mice and the corresponding NOAEL would be 50 ppm. Using the same food ingestion rate as above (i.e., 0.17 g/g-day), the LOAEL for reduced survival of female mice corresponds to a dose of 43 mg/kg-day, and the NOAEL corresponds to 8.5 mg/kg-day. Reproductive endpoints were not examined in this study.

Rossi et al. (1983) identified a LOAEL for reduced growth in Syrian golden hamsters. In a test of the carcinogenicity of DDT and DDE, the investigators exposed hamsters to dietary levels of 1,000 ppm DDT, 500 or 1,000 ppm DDE, or 0 ppm of both (control) for 120 weeks. There was no DDT- or DDE-related mortality in any groups. Growth was depressed from about 20 weeks of exposure in all exposed groups relative to the control. From this study, an unbounded LOAEL for growth in hamsters exposed to dietary DDE is 500 ppm. Assuming that Syrian golden hamsters consume 0.16 grams of food per gram of body weight (U.S. EPA, 1988),the LOAEL for growth would be 80 mg/kg-day.
The study of Durham et al. (1963) indicates a LOAEL and NOAEL for mortality in Rhesus
monkeys exposed to DDT. Twenty-two adult monkeys of both sexes were exposed to technical-grade DDT and nine served as controls. DDT was fed to the monkeys in laboratory chow at concentrations of 5, 50, 200, or 5,000 ppm for periods up to 7.5 years. Four monkeys on the 50 ppm ration were switched to 5,000 ppm DDT after 1.6 to 1.7 years. Once exposure to 5,000 ppm DDT began, monkeys died within 11 days to 0.5 years, and all exhibited tremors, convulsions, and other symptoms of DDT poisoning. There was no evidence of any DDT-related histopathology in the 200 ppm group after exposures to DDT for 5.5 years. Thus, a LOAEL for DDT-induced mortality in Rhesus monkeys is 5,000 ppm and the NOAEL is 200 ppm. The authors reported that 200 ppm (the NOAEL) corresponded to an average dose of 3.9 mg/kg-day. Assuming the animals exposed to 5,000 ppm were exposed to 25 times the amount that the 200 ppm group was exposed to, the LOAEL for mortality in Rhesus monkeys would be 97 mg/kg-day.
Clement and Okey (1974) conducted two similar studies that identified both a LOAEL and a
NOAEL for offspring growth in rats. In one test, Clement and Okey (1974) exposed Wistar rats to dietary o,p'-DDT at levels of 0, 20, 200, and 1,000 ppm and to p,p'-DDT at levels of 0, 20, 200, and 500 ppm. Exposures lasted for the six-month breeding period, and effects were followed through the F1 generation. The only exposure of the F1 generation to DDT was through lactation. Growth was depressed in the pups nursing on dams exposed to 200 or to 500 ppm p,p'-DDT and all pups born to dams fed 500 ppm p,p'-DDT were dead by 10 days after birth. Females originating from mothers fed 1,000 ppm o,p'-DDT showed a decrease in whelping success. Thus, a LOAEL for offspring growth is equal to 200 ppm, and the corresponding NOAEL is 20 ppm for rats exposed to p,p'-DDT. Using a body weight of 0.32 kg and food ingestion rate of 0.026 kg/d for mature female Wistar rats (i.e., 0.081 kg/kg-day; U.S. EPA, 1988), the LOAEL for reduced offspring growth in rats corresponds to a dose of 16 mg/kg-day (200 ppm) and the corresponding NOAEL is 1.6 mg/kg-day (20 ppm).
The study of Fitzhugh (1948) identified a reproductive LOAEL and NOAEL for rats exposed to
DDT. In a 2-year study, Fitzhugh (1948) provided rats with a diet that contained 0, 10, 50, 100, and 600 ppm DDT. The number of litters, number of live young at birth, average weight at birth, and the number of young surviving through the weaning period were quantified. The number of litters, number of living young at birth, and average weight at birth did not appear to differ with dosage level. At a concentration of 50 ppm DDT, the number of weanling rats was reduced by approximately 20 percent. The NOAEL was 10 ppm DDT since no effect was observed at that level. Based on a rat food ingestion rate of 0.08 g/g-day (U.S. EPA, 1988; see the GLWQI TSD for Wildlife Criteria), the LOAEL for reduced reproductive success in rats derived from this study is 4.0 mg/kg-day (50 ppm) and the NOAEL is 0.80 mg/kg-day (10 ppm). The results of the mammalian studies described above are summarized in Table 1-2.

1-5
Table 1-2. Summary of Subchronic and Chronic Mammalian Studies of DDT (DDE) Toxicity
Species
Exposure Duration
LOAEL
(mg/kg-day)
NOAEL
(mg/kg-day)
Toxic Effect
Observed
Reference Mink (DDE)
20 to 67 days
(0.087)a
Mortality
Gilbert, 1969
70 days
34
Females producing litters
Mice
90 days
51
34
Mortality
Bernard and Gaertner, 1964
Mice
72 days
34
Mortality
Cannon and Holcomb, 1968
Mice
6 generations
43
8.5
Female mortality
Turasov et al., 1973
Hamster
120 weeks
80
Growth
Rossi et al., 1983
Rhesus macaque
7.5 years
97
3.9
Mortality
Durham et al., 1963
Wistar rats
6 months
16
1.6
Offspring growth
Clement and Okey, 1974
Rat
2 years
4.0
0.8
Reproductive success
Fitzhugh, 1948
a This value may overestimate the toxicity of DDE to mink because the fish collected from the Miramichi River were measured for DDE residues only; they were not examined for residues of other toxic contaminants, such as PCBs or mercury, that also could be toxic to mink.
The study by Fitzhugh (1948) was selected for developing the Tier I mammalian wildlife value because the Fitzhugh (1948) study consists of repeated oral exposures for over the lifetime of the animal, and reproductive effects were demonstrated. Therefore, this study fulfills the requirements for an appropriate study for wildlife criteria development as described in Appendix D to 40 CFR 132. The LOAEL for reproductive effects reported in Fitzhugh (1948) was 4.0 mg/kg-day (50 ppm) and the NOAEL was 0.8 mg/kg-day (10 ppm).
iii. Mammalian Wildlife Value Calculation
As indicated in the previous paragraph, a NOAEL for reproductive effects of 0.8 mg/kg-day from a 2-year rat study by Fitzhugh (1948) is used to establish the mammalian wildlife value (WV). There are three types of uncertainty factors that need to be considered for use with this NOAEL, interspecies uncertainty factors for extrapolating from the test species to the representative species (UFA), a subchronic-to-chronic uncertainty factor (UFS), and a LOAEL-to-NOAEL uncertainty factor (UFL).
In calculating WVs, a UFA within the range of 1 to 100 is recommended in Appendix D to 40
CFR 132 to accommodate differences in toxicological sensitivity between the experimental animal and the representative species (i.e., mink and river otter). Because of the incomplete data available for

mink and because the subchronic and chronic mammalian studies assessing the toxicity of DDT or its metabolites are limited to a few species, a UFA of 10 was used to extrapolate from the rat (Order Rodentia) NOAEL to a NOAEL for the mink and otter (Order Carnivora).
The UFS does not need to be greater than 1, because Fitzhugh's (1948) study was chronic,
exposing rats to DDT for two years.
A UFL can be set to 1 because the study identified a NOAEL.
Input parameters for the wildlife equation are presented in Table 1-3. Body weights (Wt), ingestion rates (F), and drinking rates (W) for free-living mink and river otter are presented in Table D-2 of the methodology document (Appendix D to 40 CFR 132) and shown in Table 1-4. The bioaccumulation factors (BAFs) relate concentration of DDT in fish tissue to the concentration of DDT in the water column. The BAFs for DDT for trophic levels 3 and 4 are derived based on the procedure specified in Appendix B to 40 CFR 132, Great Lakes Water Quality Initiative Methodology for Deriving Bioaccumulation Factors.
Table 1-3. Input Parameters for Calculating the Mammalian Wildlife Value for DDT
Parameter Category
Notation
Value
Test Dose
TD(mammalian)
0.80 mg/kg-day
Interspecies Uncertainty Factor
UFA(mink) UFA(otter)
10 10
Subchronic-to-Chronic Uncertainty Factor
UFS
1
LOAEL-to-NOAEL Uncertainty Factor
UFL
1
Bioaccumulation Factors for DDT
BAF3 (trophic level 3) BAF4 (trophic level 4) BAF(other) (terrestrial)
1,336,000 Ρ/kg body weight 3,706,000 Ρ/kg body weight
0 Table 1-4. Exposure Parameters for Representative Mammalian Wildlife Species
Species
Adult Body Weight (Wt)
(kg)
Water (W)
Ingestion Rate (Ρ/day)
Food (F) Ingestion Rate of Prey in
Each Trophic Level (kg/day)a
Mink
0.80
0.081
TL3: 0.159 Other: 0.0177
Otter
7.4
0.60
TL3: 0.976 TL4: 0.244
a Only two digits are significant, but three digits are used for intermediate calculations.

1-7
The equations and calculations of mammalian wildlife values are presented below.
WV(mink)
=
TD x [1/(UFA(mink) x UFS x UFL)] x Wt(mink) W(mink) + [(F(mink,TL3) x BAF3) + (F(mink,other) x BAFother)]
WV(mink)
=
0.80 mg/kg-d x [1/(10 x 1 x 1)] x 0.80 kg
0.081 Ρ/d + [(0.159 kg/d x 1,336,000 Ρ/kg) + (0.0177 kg/d x 0 Ρ/kg)]
WV(mink)
=
301 pg/Ρ
WV(otter) = TD x [1/(UFA(otter) x UFS x UFL)] x Wt(otter)
W(otter) + ((F(otter,TL3) x BAF3) + (FA(otter, TL4) x BAF4)]
WV(otter)
=
0.80 mg/kg-d x [1/(10 x 1 x 1)] x 7.4 kg 0.60 Ρ/d + [(0.976 kg/d x 1,336,000 Ρ/kg) + (0.244 kg/d x 3,706,000 Ρ/kg)]
WV(otter)
=
268 pg/Ρ
The geometric mean of these two mammalian wildlife values results in
WV (mammalian)
= e([ln WV(mink) + ln WV(otter)]/2)
WV (mammalian)
=
e([ln 301 pg/Ρ + ln 268 pg/Ρ]/2)
WV (mammalian)
=
280 pg/Ρ (two significant digits)
iv. Sensitivity Analysis for Mammalian Wildlife Value
The values of the various parameters used to derive the mammalian WV presented above
represent the most reasonable assumptions. The purpose of this section is to illustrate the significance of these assumptions and the variability in the mammalian WV if other assumptions are made for the values of the various parameters from which the mammalian WV is derived. The intent of this section is to let the risk manager know, as much as possible, the influence on the magnitude of the mammalian WV of the assumptions made in its derivation.
In estimating the hazards of DDT to mammalian wildlife, a UFA(mink) of 10 and a UFA(otter) of 10

were used to reflect the uncertainty in extrapolating toxicity data from the rat to mink and river otter. Based on the lack of mammalian chronic toxicity data, the use of such a factor seems reasonable. However, Aulerich and Ringer (1970) inferred from their study that mink may be relatively tolerant to DDT. It is difficult to interpret this study, however, because little information concerning the experimental design is provided and only a single dose level of DDD, DDE, or DDT (plus DDD) was used. In addition, it is difficult to necessarily conclude that mink are less sensitive than rats to DDT based on a comparison of reproductive performance results reported by Aulerich and Ringer (1970) and Fitzhugh (1948) because the exposure lengths are quite different in the two studies. The reproduction study in rats involved a two-generation exposure that was significantly longer than the exposure duration used in the mink study, which is important given the high bioaccumulation potential of DDT and DDE (i.e., to estimate what the LOAEL for the mink might have been after a few years of exposure, a UFS would be required). In contrast to the Aulerich and Ringer study (1970), the study by Gilbert (1969) could suggest that mink are quite sensitive to DDE, although this investigation is also difficult to interpret given the possible role of additional contaminants. Given the available data for mink are limited and somewhat conflicting, if it were assumed that a UFA of 3 was appropriate for extrapolating the rat reproductive NOAEL to NOAELs for the mink and otter, the mammalian WV would be 950 pg/Ρ instead of 280 pg/Ρ.
In deriving the DDT mammalian WV, it was assumed that 90 percent of the mink diet was
comprised of fish and ten percent of the diet came from strictly terrestrial food chains. This assumption may lead to an overestimate of DDT exposure for mink that are not primarily foraging for fish. As indicated in the GLWQI TSD for Wildlife Criteria, the proportion of a mink diet that comes from strictly terrestrial sources can vary from almost none to one third of their diet. Furthermore, not all of the prey that mink take from aquatic sources are fish; mink may consume large quantities of crayfish where they are available, and depending on the location and season, up to 50 percent of the diet of mink can be comprised of waterfowl, muskrat, amphibians, and other air-breathing animals that feed from aquatic food chains. In 21 dietary studies of mink summarized in Volumes I and III of Trophic Level and Exposure Analyses for Selected Piscivorous Birds and Mammals (U.S. EPA, 1995), the proportion of a mink diet comprised of fish varies from less than 10 percent to the 90 percent assumed in the mink WV derivation presented above. If it were assumed that only 50 percent of a mink's diet was from aquatic resources and the remaining 50 percent of the diet was uncontaminated, the estimated DDT exposure would be reduced by a factor of 1.8. Using a UFA(mink) and a UFA(otter) of 10 (Table 1-3), the resulting WV for DDT for the mink would be 542 pg/Ρ, and the mammalian WV would be 380 pg/Ρ, rather than the mammalian WV of 280 pg/Ρ.
III. Calculation of Avian Wildlife Value i. Acute and Short-term Toxicity
Long-term exposure of birds to DDT has been demonstrated to result in eggshell thinning in
several species; however, the acute toxicity of DDT to birds has not been well established. Bernard (1963) observed tremors within 7 days in robins (Turdus migratorius) ingesting feed contaminated with 300 ppm DDT. For clapper rails (Rallus longirostris), the DDT oral LC50 value was 1,600 ppm for males and 1,900 ppm for females (Van Veltzen and Kreitzer, 1975). Gallinaceous birds appear to be more sensitive. The RTECS database (NIOSH, 1992) listed the oral LD50 value for chickens (Gallus) as 300 mg/kg. The LC50 value for juvenile (2 to 3 weeks old) ring-necked pheasant (Phasianus colchicus) exposed to DDT in their feed for five days was 310 ppm (Hill et al., 1975). LC50s for the same test protocol for juvenile quail (Coturnix japonica; 7 days old) was 570 and for bobwhites (Colinus virginianus; 23 days old) was 160 ppm (Hill et al., 1975). Ducks (Order Anseriformes) may be less sensitive. The value for juvenile mallard ducks (Anas platyrhynchos) was

1-9
found to be 1,900 ppm (Hill et al., 1975). Table 1-5 summarizes these acute avian toxicity tests for DDT.
LC50 values for DDT concentrations in brain tissue also have been determined for avian species.
The geometric mean brain DDT residue LC50 values range from 23 ppm wet weight for the blue jay (Cyanocitta cristata) to 109 ppm wet weight for the cardinal (Richmondena cardinalis) (Van Veltzen and Kreitzer, 1975). Stickel et al. (1984) established that 300 to 400 ppm DDE wet weight in brain tissue caused death in grackles (Quiscalus guiscula), red-winged blackbirds (Agelaius phoeniceus), brown-headed cowbirds (Molothrus ater) and starlings (Sturnus vulgaris). DDE residues in brains of two kestrels (Falco sparverius) that died following 14 months of exposure to 2.8 ppm dietary DDE (wet weight, or 10 ppm dry weight) were 213 and 301 ppm wet weight (Porter and Wiemeyer, 1972).
Table 1-5. Summary of Acute and Short-term Avian Toxicity Values for DDT
Route
Species
Exposure Duration
Endpoint: Dose
Reference diet
robins
7 days
Tremors: 300 ppm
Bernard, 1963
diet
clapper rail
up to 5 days
LC50 male: 1,600 ppm female: 1,900 ppm
Van Veltzen and Kreitzer, 1975
oral
chicken
single dose
LC50: 300 mg/kg
NIOSH, 1992
diet
ring-necked pheasant (21 days old)
up to 5 days
LC50: 310 ppm
Hill et al., 1975
diet
Japanese quail (7 days old)
up to 5 days
LC50: 570 ppm
Hill et al., 1975
diet
northern bobwhite (23 days old)
up to 5 days
LC50: 610 ppm
Hill et al., 1975
diet
mallard (2-3 wks old)
up to 5 days
LC50: 1,900 ppm
Hill et al., 1975
ii. Subchronic and Chronic Toxicity The long-term toxicity of DDT has been documented in a number of avian orders, including
gallinaceous birds (Order Galliformes, e.g., chicken, pheasant, quail), ducks (Order Anseriformes), birds of prey (Order Falconiformes, e.g., bald eagle, kestrel), and pelicans (Order Pelecaniformes).
A study by Smith et al. (1970) indicates a LOAEL for reproductive effects in one-year old
Kimber 127 chickens exposed to DDT. Hens were exposed to dietary DDT for 2 months at levels of 0, 1.0, 2.5, 5.0, 7.5, or 10 ppm. Decreased egg production and eggshell thickness were observed only at the highest dose, but analyses were not conducted to determine if the decrease was statistically significant, and the effect was not large (reduction from 69 percent of hens laying to 59 percent of hens laying daily). Using a generic chicken weight of 2.0 kg (Scott et al., 1976) and a food ingestion rate of 0.067 kg food/kg body weight per day (the food ingestion rate of 2.0 kg white leghorn hens on feed consisting of 9.1 percent water; Medway and Kare, 1959; see the GLWQI TSD for Wildlife Criteria), the LOAEL for reduced egg production in chickens is 0.67 mg/kg-day (10 ppm).
Sauter and Steele (1972) identified a LOAEL for reproduction in chickens exposed to DDT.
White Leghorn hens were exposed to dietary DDT at levels of 0, 0.1, 1, and 10 ppm for up to 10

weeks and several indicators of reproductive performance were measured. The lowest level tested elicited significant increase in embryonic mortality. A clear dose-response function for this and other reproductive endpoints was not evident, however, perhaps because the group administered 1.0 ppm DDT performed as poorly in the pre-exposure period as the group administered 0.1 ppm performed during the exposure period. During the exposure period, the 1.0 ppm group also performed worse than the group administered 10 ppm. Assuming the effects seen at 0.1 ppm were valid, and that the group exposed to 1.0 ppm was impaired at the beginning of the study, this investigation indicates an unbounded LOAEL of 0.1 ppm. No data on body weight or food consumption were provided in this report. Using the food ingestion rate identified for white leghorn hens above (i.e., 0.067 kg/kg-day), the LOAEL would be expressed as a DDT intake of 0.0067 mg/kg-day. The irregular dose-response data, however, makes this study undesirable for establishing wildlife criteria.
The study of Davison et al. (1976) may have identified a LOAEL and a NOAEL for
reproduction in Japanese quail exposed to dietary DDT, but the results were not analyzed statistically. The investigators performed two tests with DDT and one test with DDE. The DDT exposure levels were 0, 2.5, 10, and 40 ppm in the diet for 12 or 16 weeks. The DDE exposure levels were 0, 2, 10, 40, and 200 ppm in the diet for 13 weeks. None of the groups exposed to DDE showed reduction in the number of eggs laid, egg weight, or eggshell thickness. Sixteen weeks of exposure to DDT at 40 ppm did not reduce the number of eggs laid per hen, eggshell thickness, fertility, or hatchability. However, in one experiment, quail fed DDT at 40 ppm and caged in male-female pairs broke more eggs than quail caged in pairs but fed lower concentrations of DDT or than quail fed an equal amount of DDT but caged alone. Using a body weight of 0.12 kg (Davison et al., 1976; Altman and Dittmer, 1972), a food ingestion rate of 0.090 kg dry food/kg body weight per day was estimated from Nagy's (1987) allometric equation for non-passerine birds (see the GLWQI TSD for Wildlife Criteria). Assuming the laboratory feed to be 10 percent water (Altman and Dittmer, 1972), this would correspond to a food ingestion rate of 0.10 kg of food for every kg of body weight per day. Thus, a LOAEL for pairs breaking their eggs would be 4 mg/kg-day (40 ppm) and the NOAEL would be 1 mg/kg-day (10 ppm).
Shellenberger's (1978) four-generation study indicates a similar LOAEL and NOAEL for
reproduction in quail as the single generation study of Davison et al. (1976). Shellenberger (1978) exposed quail (Coturnix coturnix) to dietary DDT at levels of 0, 5, or 50 ppm for four consecutive generations (i.e., parental, F1, F2, and F3 generations). No adverse effects of DDT were observed on growth, mortality, or most of the reproductive endpoints throughout the duration of the study. However, the egg fertility of the F2 generation in the 50 ppm group was lower than that for the 5 ppm and the control groups. Although no statistical tests were presented, the author judged the decrease in egg fertility of about 14 to 16 percent to be marginally significant. Using the same food ingestion rate of 0.10 kg/kg-day as derived above, the suggested LOAEL for decreased egg fertility in quail would be equivalent to 5 mg/kg-day (50 ppm) and the suggested NOAEL would be 0.5 mg/kg-day (5 ppm).
The study of Stickel and Rhodes (1970) indicates a LOAEL and NOAEL for mortality and a
LOAEL for reproductive effects in quail exposed to dietary p,p'-DDT. The quail were exposed for approximately half a year to dietary DDT levels of 0, 2.5, 10, and 25 ppm. Significant DDT-related mortality was evident only in the 25 ppm group; suggesting a mortality LOAEL of 25 ppm and a corresponding NOAEL of 10 ppm. Egg production and eggshell thickness were significantly decreased at the 2.5 ppm level, indicating an unbounded LOAEL for these reproductive parameters of 2.5 ppm. Using the same food ingestion rate for quail as above (i.e., 0.10 kg/kg-day), the LOAEL for mortality corresponds to a dose of 2.5 mg/kg-day (25 ppm), the NOAEL for mortality corresponds to 1 mg/kg-day (10 ppm), and the unbounded LOAEL for reproduction is equivalent to 0.25 mg/kg-day (2.5 ppm).
Robson et al. (1976) identified a NOAEL for mortality in Japanese quail exposed to DDE and

1-11
DDT that is approximately one order of magnitude higher than the NOAEL (with a corresponding LOAEL) for mortality in quail exposed to DDT identified in the study of Stickel and Rhodes (1970). Robson et al. (1976) exposed quail to DDT at dietary levels of 0 or 100 ppm for approximately 24 weeks, and did not observe any adverse effects on growth, mortality, or reproduction. In another test, the investigators exposed quail to DDE at dietary levels of 0, 100, or 300 ppm and observed an increase in mortality and a decrease in body weights in the quail exposed to 300 ppm. Using a food ingestion rate of 0.10 kg/kg-day for quail (see above), the NOAEL for mortality in quail exposed to DDT is 10 mg/kg-day. Using the same food ingestion rate, the LOAEL for mortality in quail exposed to DDE is 30 mg/kg-day (300 ppm) and the corresponding NOAEL is 10 mg/kg-day (100 ppm).
Azvedo et al. (1965) identified a LOAEL and NOAEL for mortality in ring-necked adult
pheasants. Adult pheasants were exposed to DDT at levels of 0, 10, 100, and 500 ppm in the diets for up to 14 weeks. There were no deaths in the 10 ppm group, but significant mortality before 14 weeks occurred in the groups exposed to 100 and 500 ppm DDT. Therefore, the LOAEL for adult survival over a 14-week exposure period is 100 ppm and the NOAEL is 10 ppm. Using an average body weight of 1.1 kg for males and females combined (Nelson and Martin, 1953), a food ingestion rate of 0.053 kg of dried feed/kg body weight per day is derived from Nagy's (1987) allometric equation for non-passerine birds (see the GLWQI TSD for Wildlife Criteria). Assuming that laboratory feed for pheasants consists of 10 percent water (Altman and Dittmer, 1972), the food ingestion rate would be equivalent to 0.058 kg of feed/kg body weight per day. The corresponding doses would be a LOAEL of 5.8 mg/kg-day (100 ppm) for survival of adult pheasants and a NOAEL of 0.58 mg/kg-day (10 ppm).
Numerous studies of DDT and/or DDE ingestion by mallard ducks at levels ranging from 10 to
50 ppm in feed for a period ranging from 5 weeks prior to egg laying through two years have demonstrated significant reduction in eggshell thickness (Haegele and Hudson, 1974; Longcore and Samson, 1973; Davison and Sell, 1973; Risebrough and Anderson, 1975; Kolaja and Hinton, 1977).
Davison and Sell (1974) identified a LOAEL and NOAEL for eggshell thinning in mallards
exposed to dietary DDT for 11 months. They exposed female mallards to technical grade DDT and pure p,p'-DDT at 0, 2, 20, and 200 ppm in the diet for about 11 months and assessed effects on eggshell thickness. Significant reduction in eggshell thickness was observed at 20 ppm (the LOAEL), and the NOAEL was 2 ppm. Lethality was observed at 200 ppm dietary DDT. Using a mallard body weight of 1 kg (Delnicki and Reinecke, 1986), a food ingestion rate of 0.054 kg of dried feed/kg body weight per day is derived from Nagy's (1987) allometric equation for non-passerine birds (see the GLWQI TSD for Wildlife Criteria). Assuming that the laboratory feed for mallards consists of 10 percent water (Altman and Dittmer, 1972), the food ingestion rate would be equivalent to 0.060 kg of feed/kg body weight per day. From this estimate, a LOAEL value of 1.2 mg/kg-day (20 ppm) and a NOAEL of 0.12 mg/kg-day (2 ppm) can be estimated for eggshell thinning in mallards.
Using only a 30-day exposure period, Kolaja (1977) found an even lower LOAEL for eggshell
thinning and egg weight in mallards exposed to DDT or DDE. Birds were exposed to dietary DDT or DDE at 0, 10 and 50 ppm for 30 days. Eggshell thickness and weight were significantly reduced at both dose levels for either DDT or DDE. Using the mallard body weight and ingestion rate presented above, the LOAEL determined in this study is 0.60 mg/kg-day (10 ppm) for eggshell thinning and reduced egg weight in mallards.
Heath et al. (1969) studied reproductive effects in mallards exposed to DDE, DDD, and DDT in
their diets for two full years. Ducks were exposed to dietary DDE or DDD in commercial feed at 0, 10, and 40 ppm or DDT at 0, 2.5, 10, and 40 or 25 ppm (the higher concentration was reduced after breeders died). Endpoints evaluated were percent cracked eggs, embryo mortality, hatchling

survivability, and number of ducklings per hen. DDE severely impaired reproductive success at both dose levels, and duckling production per hen was reduced by 50 to 75 percent. The DDE LOAEL for reproductive success obtained from this study was 10 ppm, or 0.60 mg/kg-day calculated using the body weight and feed ingestion rate presented previously for mallards. Heath et al. (1969) also reported that DDD impaired reproductive success, but less severely than did DDE. DDT in the diet at concentrations of 2.5 and 10 ppm did not have measurable effects on reproduction. Therefore, the LOAEL for DDT in the diet of mallard ducks based on reproductive success is 1.5 mg/kg-day (25 ppm) and the NOAEL is 0.60 mg/kg-day (10 ppm).
The American black duck (Anus rubripes) is as sensitive to DDE, as exhibited by reproductive
effects, as the mallard is to DDT. Longcore et al. (1971) exposed adult American black ducks to dietary DDE at levels of 0, 10, and 30 ppm for approximately 6 months. Significantly decreased eggshell thickness, increased proportion of eggs cracking, and decreased survival of embryos and newly hatched ducklings were evident at the lowest dose tested. Therefore, an unbounded LOAEL of 10 ppm for reproductive and developmental effects is evident from this study. Using a body weight of 1.1 kg (Dunning, 1984), a food ingestion rate of 0.053 kg dry food/kg body weight per day is derived from Nagy's (1987) allometric equation for non-passerine birds (see the GLWQI TSD for Wildlife Criteria). Assuming that the laboratory diet consists of 10 percent water (Altman and Dittmer, 1972), this corresponds to a food ingestion rate of 0.058 mg feed/kg body weight per day. The corresponding LOAEL for reproductive effects of DDE in the American black duck is 0.58 mg/kg-day.
Lincer (1972) performed a test to determine the effect of DDE on eggshell thinning in American
kestrels (Falco columbarius). Wild-trapped kestrels were exposed to dietary DDE at levels of 0, 0.3, 3.0, 6.0, or 10 ppm for about half a year. Levels of 3.0 ppm or higher caused statistically significant eggshell thinning. This study, therefore, identified a LOAEL for eggshell thinning in American kestrels of 3.0 ppm DDE, and a NOAEL of 0.3 ppm DDE. Using a female kestrel body weight of 0.120 kg (Bloom, 1973; Bird and Clark, 1983), and assuming that the diet, comprised of chickens injected with the DDE, consisted of 75 percent water (U.S. EPA, 1993a), a food ingestion rate of 0.37 kg/kg-day is derived from Nagy's (1987) allometric relationship for non-passerine birds (see the GLWQI TSD for Wildlife Criteria). Using this food ingestion rate, the LOAEL for eggshell thinning in the kestrel is 1.1 mg/kg-day (3ppm) and the NOAEL is 0.11 mg/kg-day (0.3 ppm).
Chura and Stewart (1967) and Stickel et al. (1966) identified a NOAEL for mortality in bald
eagles (Haliaeetus leucocephalus). Bald eagles were exposed to dietary levels of 0 or 3 ppm DDT for 120 days or to 0, 3, 48, 240, or 1,200 ppm DDT for 112 days (Stickel et al., 1966). In the first test, 15 eagles were exposed at 3ppm, while in the second test, there were only 2 or 3 individuals in each exposure group. After 112 days of exposure, the eagles in the 48, 240, and 1,200 groups exhibited clinical symptoms of DDT toxicity and died. One of the eagles in the 48 ppm group survived to 112 days, but exhibited the tremors typical of DDT poisoning. No adverse DDT-related effects were observed in eagles exposed to 3 ppm DDT in either experiment. Thus, a NOAEL for mortality in bald eagles exposed to dietary DDT is 3 ppm and the corresponding LOAEL is 48 ppm. The authors estimated that the 3 ppm group was receiving a dosage of 0.3 mg/kg-day (NOAEL) and the 48 ppm group received 3.0 mg/kg-day (LOAEL) before their food ingestion rates began to decline and symptoms of DDT toxicity began.
Anderson et al. (1975, 1977) studied the reproductive success of brown pelicans (Pelecanus
occidentalis) off the coast of southern California for the years of 1969 through 1974. Concentrations of DDT and its metabolites in northern anchovies, the major food source of this pelican colony, and in pelican eggs were measured during the course of this investigation. Over the five years, combined concentrations of DDT, DDD, and DDE in the food source steadily declined from 4.27 ppm in 1969 to 0.15 ppm in 1974. The average composition of the DDTr in anchovies was 69.4% DDE and 30.6%

1-13
for DDT and DDD combined. At 0.15 ppm total DDTr in the food source, the fledging rate was 30 percent below the estimated rate necessary to maintain a stable population. Based on the results of this study, a LOAEL of 0.15 ppm total DDTr can be inferred for reproductive success in pelicans. Using a pelican body weight of 3.5 kg (Dunning, 1984), and Nagy's (1987) allometric equation for seabirds presented in the GLWQI TSD for Wildlife Criteria, the calculated food ingestion rate for pelicans is 0.155 kg/day (dry weight). Because the DDT bioaccumulation factor for the pelican's food source is provided in terms of wet weight, the calculated dry weight food ingestion rate is converted to a wet weight food ingestion rate by assuming the diet of fish consists of 75 percent water (U.S. EPA, 1993a). This results in a food ingestion rate of 0.62 kg/day. Multiplying the LOAEL (0.15 ppm) by the food ingestion rate and dividing by the pelican body weight gives a LOAEL of 0.027 mg/kg-day for reproductive success.
The results of the studies described above are summarized in Table 1-6. The Anderson et al.
(1975, 1977) study with brown pelicans was judged most appropriate for avian wildlife Table 1-6. Summary of Subchronic and Chronic Avian Toxicity Values for DDTr
Species
Co .
Exposure Duration
LOAEL
(mg/kg-day)
NOAEL
(mg/kg-day)
Toxic Effect
Observed
Reference Chicken
DDT
2 months
(0.67)a
Reduced laying
Smith et al., 1970
Chicken
DDT
10 weeks
0.0067
Embryo mortality
Sauter and Steele, 1972
Quail
DDT
16 weeks
4
1
Pairs breaking eggs
Davison et al., 1976
Quail
DDT
3 gen.
(5.0)a
(0.5)a
Fertility
Shellenberger, 1978
0.25
Reduced laying, eggshell thinning
Quail
DDT
26 weeks
2.5
1
Mortality
Stickel and Rhodes, 1970
DDE
24 weeks
30
10
Mortality
Quail
DDT
24 weeks
10
Mortality
Robson et al., 1976
Pheasant
DDT
14 weeks
5.8
0.58
Mortality
Azvedo et al., 1965
Mallard
DDT
11 months
1.2
0.12
Eggshell thinning
Davison and Sell, 1974
Mallard
DDT, DDE
30 days
0.60
Eggshell thinning
Kolaja, 1977
DDE
2 years
0.60
Embryo mortality, cracked eggs
Mallard
DDT
2 years
1.5
0.60
Reproductive success
Heath et al., 1969
American Black Duck
DDE
6 months
0.58
Reproductive effects
Longcore et al., 1971

Kestrel
DDE
5.5 months
1.1
0.11
Eggshell thinning
Lincer, 1972
Bald Eagles
DDT
112 days
3.0
0.3
Mortality
Chura and Stewart 1967, and Stickel et al., 1966
Pelican
DDTr
5 years
0.027
Reproductive effects
Anderson et al., 1975
Note: The column header "Co." indicates "compound". aResults were not tested statistically.
value development because it consists of a peer-reviewed field study of a wildlife species that provides a chemical-specific dose-response curve for reproductive success. Although it is possible that the LOAEL of 0.027 mg/kg-day identified in the Anderson et al. (1975) study was this low because other contaminants occurring in the anchovies contributed to the reproductive impairment observed in the pelicans, this is considered unlikely. Anderson et al. (1975) documented significant declines in DDT/DDE levels in both the eggs and prey of the brown pelicans, over the same time period that they documented only very slight declines in the concentrations of PCBs, mercury, and lead in the pelican eggs (Anderson et al., 1977). Also, throughout the duration of the study, declining DDTr concentrations were associated with increasing eggshell thickness as well as improving reproductive success. According to the methodology presented in Appendix D to 40 CFR 132, a study of this type takes precedence over other studies in the development of a Tier I criterion.
iii. Avian Wildlife Value Calculation
As indicated in the previous paragraph, a LOAEL for reproductive effects of 0.027 mg/kg-day, from the pelican study by Anderson et al. (1975, 1977), is used to establish the avian wildlife value (WV). There are three types of uncertainty factors that need to be considered for use with this LOAEL, interspecies uncertainty factors for extrapolating the LOAEL from the pelican to the kingfisher, herring gull, and bald eagle (i.e., a UFA for each of the three species), a subchronic-to-chronic uncertainty factor (UFS), and a LOAEL-to-NOAEL uncertainty factor (UFL).
The pelican is a piscivorous bird species in the Order Pelicaniformes and is one of the most
sensitive of the species of birds on which chronic studies have been conducted (see Table 1-6). The results of Sauter and Steele's (1972) study on leghorn chickens indicates that the LOAEL identified for pelicans using Anderson et al.'s (1975, 1977) studies is reasonable.Given that the pelican itself is piscivorous, an UFA of 1 is considered appropriate for the kingfisher, herring gull, and bald eagle.
The UFS was set to 1 because the study of Anderson et al. (1975) is chronic, covering several
years.
A UFL of greater than 1 is needed because the study of Anderson et al. (1975) established a LOAEL, but not a NOAEL, for the number of young fledged per nest. The LOAEL corresponds to a level associated with only a 30 percent decrement in reproductive performance compared to what Anderson et al. (1975) postulate is necessary to maintain a stable population. Thus, the LOAEL should be relatively close to a threshold for effects, and the full factor 10 is not needed to extrapolate to a NOAEL. A value of 3 therefore is used for the UFL as a value intermediate between 1 and 10.
The wildlife equation and input parameters are presented in Table 1-7. The BAFs relate
concentration of DDTr in fish tissue to the concentration of DDTr in the water column. Because DDT, DDE, and DDD exhibit somewhat different magnitudes of bioaccumulation in fish, the BAFs for DDTr was determined on the basis of measured ratios of the three compounds in tissues of fish from the Great Lakes (GLWQI TSD for Wildlife Criteria). The BMF relates the likely concentration

1-15
of DDTr in herring gulls, which are consumed by bald eagles, to the concentration of DDTr in trophic level 3 fish. Braune and Norstrom (1989) have reported that DDE bioaccummulates in Lake Ontario herring gulls at a level approximately 85 times higher and that DDT bioaccumulates to a level approximately 3.2 times higher than that observed in alewife. Assuming that DDD behaves similarly to DDT,
Table 1-7. Input Parameters for Calculating the Avian Wildlife Value for DDTr Parameter Category
Notation
Value
Test Dose
TD(avian)
0.027 mg/kg-day
Interspecies Uncertainty Factor
UFA(kingfisher)
UFA(gull) UFA(eagle)
1 1 1
Subchronic-to-Chronic Uncertainty Factor
UFS
1
LOAEL-to-NOAEL Uncertainty Factor
UFL
3
Bioaccumulation Factors for DDTr
BAF3 (trophic level 3) BAF4 (trophic level 4) BAF(other) (terrestrial)
1,687,000 Ρ/kg body weight 9,357,000 Ρ/kg body weight
0 Biomagnification Factor for DDTr
BMF(TL3 to gulls)
63
and using the measured ratios of the three compounds in Great Lakes fish, the BMF for DDTr is estimated to be 63 (Appendix K to the GLWQI TSD for the Procedure to Determine Bioaccumulation Factors). Values for body weights (Wt), food ingestion rates (F), and drinking rates (W) for kingfisher, osprey and eagle are presented in Table D-2 of the methods document (Appendix D to 40 CFR 132) and shown in Table 1-8.
Table 1-8. Exposure Parameters for Representative Avian Wildlife Species
Species
Adult Body Weight (Wt)
(kg)
Water (W)
Ingestion Rate (Ρ/day)
Food (F) Ingestion Rate of Prey in
Each Trophic Level (kg/day)a
Belted Kingfisher
0.15
0.017
TL3: 0.0672
Herring Gull
1.1
0.063
TL3: 0.192 TL4: 0.0480 Other: 0.0267
Bald Eagle
4.6
0.16
TL3: 0.371 TL4: 0.0928 PB: 0.0283 Other: 0.0121
a Only two digits are significant, but three digits are used for intermediate calculations. TL3 = trophic level three fish; TL4 = trophic level 4 fish; PB = piscivorous birds (e.g., herring gulls); other = non-aquatic birds and mammals.

Calculations of avian wildlife values are summarized below.
WV(kingfisher) = TD x [1/(UFA(kingfisher) x UFS x UFL)] x Wt(kingfisher)
W(kingfisher) + (F(kingfisher,TL3) x BAF3)
WV(kingfisher)
=
0.027 mg/kg-d x [1/(1 x 1 x 3)] x 0.15 kg 0.017 Ρ/d + (0.0672 kg/d x 1,687,000 Ρ/kg)
WV(kingfisher)
=
11.9 pg/Ρ
WV(gull) = TD x [1/(UFA(gull) x UFS x UFL)] x Wt(gull)
W(gull) + [(F(gull,TL3) x BAF3) + (F(gull,TL4) x BAF4) + (F(gull,other) x BAFother]
WV(gull)
=
0.027 mg/kg-d x [1/(1 x 1 x 3)] x 1.1 kg 0.063 Ρ/d + [(0.192 kg/d x 1,687,000 Ρ/kg) + (0.0480 kg/d x 9,357,000 Ρ/kg) + (0.0267 kg/d x 0 Ρ/kg)]
WV(gull)
=
12.8 pg/Ρ
WV(eagle) = TD x [1/(UFA(eagle) x UFS x UFL)] x Wt(eagle)
W(eagle) + [(F(eagle,TL3) x BAF3) + (F(eagle,TL4) x BAF4) + (F(eagle, gulls) x BAF3 x BMF(TL3 to gulls)) + (F(eagle,other) x BAFother)]
WV(eagle)
=
0.027 mg/kg-d x [1/(1 x 1 x 3)] x 4.6 kg 0.16 Ρ/d + [(0.371 kg/d x 1,687,000 Ρ/kg) + (0.0928 kg/d x 9,357,000 Ρ/kg) + (0.0283 kg/d x 1,687,000 Ρ/kg x 63) + (0.0121 kg/d x 0 Ρ/kg]
WV(eagle)
=
9.19 pg/Ρ
The geometric mean of these three avian wildlife values results in
WV (avian)
=
e([ln WV(kingfisher) + ln WV(gull) + ln WV(eagle)]/3)
WV (avian)
=
e([ln 11.9 pg/Ρ + ln 12.8 pg/Ρ + ln 9.19 pg/Ρ]/3)
WV (avian)
=
11 pg/Ρ (two significant digits)
iv. Sensitivity Analysis for Avian Wildlife Value

1-17
The values of the various parameters used to derive the avian WV presented above represent the
most reasonable assumptions. The purpose of this section is to illustrate the significance of these assumptions and the variability in the avian WV if other assumptions are made for the values of the various parameters from which the avian WV is derived. The intent of this section is to let the risk manager know, to the extent possible, the influence on the magnitude of the avian WV of the assumptions made in its derivation.
The DDT and DDE LOAELs for embryo mortality in the chicken (Sauter and Steele, 1972) and
mallard (Heath et al., 1969), respectively, were not used to calculate an avian WV because the study of Anderson et al. (1975, 1977) with pelicans was determined to be more representative of potential effects in piscivorous birds. In addition, the ratio of DDT and metabolites in the anchovy diet of the pelicans, in which DDE predominates, is similar to DDTr ratios found in the Great Lakes (see Appendix K to the GLWQI TSD for the Procedure to Determine Bioaccumulation Factors). However, it could be argued that some of the effects observed in the pelicans could have been due to other contaminants in the anchovies. To evaluate the appropriateness of the pelican-based NOAEL in deriving the avian WV, TDs derived from the Sauter and Steele (1972) and Heath et al. (1969) studies were used to calculate alternate avian WVs. The DDT LOAEL for embryo mortality of 0.0067 mg/kg-day (0.1 ppm in the diet) from the study of Sauter and Steele (1972) was not used to derive the definitive avian WV, in part, because a well-behaved dose-response was not evident; i.e., the response at the intermediate dose of 1.0 ppm was more severe than the response at the highest dose (10 ppm). Eliminating the 1.0 ppm dose group, the LOAEL of 0.1 ppm for embryonic mortality in chickens exposed to DDT, which corresponds to a dose of 0.0067 mg/kg-day, is used to calculate the avian WV. Although the exposure duration was only 10 weeks, the exposure was timed appropriately to elicit reproductive/developmental effects. Thus, the UFS to calculate an avian WV could remain at the value of 1. To extrapolate from a LOAEL to a NOAEL, a UFL of 3 would still be appropriate. Using an intermediate UFA of 3 or a UFA of 1 to extrapolate the LOAEL from the chicken to each of the three representative species, the avian WV would have been 1.4 to 4.1 pg/Ρ instead of 11 pg/Ρ. Note that in calculating these WVs, the BAF values for DDT only (presented in Table 1-3 for mammals) are used instead of the BAF values for DDTr. Using the LOAEL from Heath et al. (1969), an alternative WV of 6.8 pg/Ρ (UFA = 10) or 23 pg/Ρ (UFA = 3), instead of 11 pg/Ρ, could be derived. In calculating these values, a UFL of 10 was used because mallard duckling production was reduced by as much as 50 to 75 percent per hen at the DDE LOAEL of 0.60 mg/kg-day. In addition, BAF values for DDE of 1,891,000 for trophic level 3 and 9,656,000 for trophic level 4 (GLWQI Methodology for Deriving Bioaccumulation Factors) were used in the derivations. These analyses indicate that the avian WV based on the pelican field study of Anderson et al. (1975, 1977) is consistent with WVs that could be derived from laboratory studies with the chicken or mallard.

When using the study of Anderson et al. (1975) to establish the avian WV, it was assumed that
the DDTr concentration measured in the anchovies in the last year of the study was the dietary concentration associated with the reproductive performance of 0.922 young fledged per nest, considered a LOAEL, in the same year. It is possible, however, that the reduction in DDTr concentrations in the pelicans, which live many years, lagged behind the reduction of DDTr concentrations in their prey, and that the DDTr concentration measured in the anchovies one or two years earlier might have been more appropriate to pair with the reproductive performance of the pelicans in the last year of the study. Exhibit 1-1 summarizes the results of the Anderson et al. (1975) study. The precipitous drop in DDTr concentrations in anchovies between 1969 and 1970 corresponded with the cessation of DDT releases to the environment in early 1970. Anchovies are small fish which can reach adult size within one year, hence the rapid response (under one year) of the anchovy DDTr concentrations to the cessation of environmental inputs of DDT is expected. A dramatic increase in pelican fledging success, on the other hand, did not occur until 1972, or approximately two years after their prey DDTr contamination dropped. This could suggest that pelican residue levels responded to changes in levels of DDTr in their food more slowly, with perhaps as much as a two-year lag. Haegele and Hudson (1974) specifically examined the degree to which DDE exposure can still affect reproduction in mallards one year after exposure has ceased. A group of mallards were exposed to 40 ppm of p,p'-DDE for 96 days. This group laid eggs with shells averaging about 15 to 20 percent thinner than those of control birds. The birds were held over to a second breeding year, but not fed any more DDE. Approximately 11 months after they were last exposed to DDE, they laid eggs averaging 7.4 percent thinner than control eggs. Similarly, their body DDE residues had declined from 33.1 ppm at the end of the exposure period to 9.6 ppm 11 months later. Thus, DDE residue levels may not return to preexposure levels for over a year following the cessation of exposure. A sensitivity analysis therefore was conducted assuming a one-year and a two-year time lag in the decrease of pelican DDTr residue levels in response to the decrease in anchovy DDTr residue levels. Using the pelican body weight and food ingestion rates indicated earlier, a DDTr concentration of 1.12 ppm in anchovies in 1972 corresponds to a LOAEL of 0.20 mg/kg-day, and a DDTr concentration of 0.29 ppm in anchovies in 1973 corresponds to a LOAEL for pelicans of 0.052 mg/kg-day. Using the 1972 value of 0.20 mg/kg-day, which assumes a two-year lag in reproductive effects, the resulting avian WV is 83 pg/Ρ instead of 11 pg/Ρ. Using the 1973 value of 0.052 mg/kg-day, which assumes a one-year lag, the resulting avian WV is 22 pg/Ρ instead of 11 pg/Ρ. These estimated avian WVs, however, are likely based on dietary DDTr levels that somewhat overestimate the actual LOAEL because these calculations assume the DDTr exposures in 1973 and/or 1974 do not contribute to reproductive effects observed in the last year of the study (1974).
The BMF for DDT and metabolites from trophic level 3 fish to herring gulls in the Great Lakes
is high, a factor of 63. The diet of the bald eagle is variable; the birds take advantage of whatever prey are easiest to obtain at any given time and location. For purposes of calculating the avian WV,
Exhibit 1-1. Summary of Pelican Fledging Success and DDTr Concentrations in Their Diet (Anderson et al., 1975)
Year
DDTr Concentration in Anchovies (ppm
wet weight)
No. Young Fledged per
Nest 1969
4.27
0.004
1970
1.40
0.007
1971
1.34
0.065
1972
1.12
0.405
1973
0.29
0.225
1974
0.15
0.922

1-19
the diet of the bald eagle was assumed to consist of 5.8 percent herring gulls based on the average value for eight pairs studied on Lake Superior (Kozie, 1986). The diets of individual pairs or populations in other areas of the Great Lakes may include a greater or lesser proportion of herring gulls. The proportion of herring gulls in the diet of a pair of bald eagles nesting next to a gull colony was estimated to be 12.5 percent (GLWQI TSD for Wildlife Criteria). A sensitivity analysis was conducted using the dietary composition estimated for this pair of eagles, which was 338 g trophic level 3 fish, 84.5 g trophic level 4 fish, 61.3 g herring gulls, and 6.0 g of non-aquatic birds (see GLWQI TSD for Wildlife Criteria). Keeping all other input parameters the same as indicated in Tables 1-7 and 1-8, the bald eagle WV for DDT and metabolites would be 5.3 pg/Ρ, instead of 9.2 pg/Ρ, and the avian WV would be equal to 9.3 pg/Ρ instead of 11 pg/Ρ. On the other hand, if bald eagles ate only fish, they would require 527 grams daily (GLWQI TSD for Wildlife Criteria), of which about 422 grams would be trophic level 3 fish and 105 grams would be trophic level 4 fish. This dietary composition would result in a bald eagle WV of 24.4 pg/Ρ, and the avian WV would be 15.5 pg/Ρ instead of 11 pg/Ρ.
IV. Great Lakes Wildlife Criterion
The Tier I Great Lakes Wildlife Criterion for p,p'-DDT and metabolites is determined by the lower of the mammalian WV (280 pg/Ρ) and the avian WV (11 pg/Ρ). The avian WV was determined to be approximately one order of magnitude smaller that the mammalian wildlife value and is based on total DDT plus its metabolites. Therefore, the Great Lake Wildlife Criterion for total DDT and metabolites is 11 pg/Ρ.
i. Discussion of Uncertainties Wildlife populations inhabiting the Great Lakes Basin would not be impacted from the intake of
drinking water or prey taken from surface water containing total DDT in concentrations of 11 pg/Ρ, based on available exposure, toxicity and bioaccumulation information, and uncertainty factors applied to account for data gaps and the variability inherent in the DDT risk assessment. Criteria for other ecoregions may require an analysis of different wildlife species with different diets and body masses. In addition, the bioaccumulation factors in this analysis were based on an analysis specific for the Great Lakes; different bioaccumulation factors may be more appropriate for other waterbodies.
Generic assumptions were made in assessing the hazards of DDT and its metabolites to wildlife
populations through the use of LOAELs and NOAELs for reproduction and development. The use of these levels assumes no hazards to wildlife populations would result from the direct exposure of individuals to DDT and its metabolites. However, it could be argued that some increase in density independent mortality, or decrease in density independent reproductive success, which could be attributable to exposure to DDT or its metabolites, could be incurred without impacting the population dynamics of a species. In general, well-validated population models do not yet exist for the species analyzed, and it is difficult to estimate the extent of mortality or reproductive failure that could be incurred. In addition, the interaction of additional chemical as well as non-chemical stressors on wildlife population responses is also poorly resolved at this time.

V. References Alsop, F.J. 1972. Eggshell thickness from red-winged blackbird (Agelaius phoeniceus)
populations with different exposures to DDT. Dissertation Abstracts 33:5571-B. Altman, P.L. and D.S. Dittmer, eds. 1972. Biology Data Book, Second Edition, Volumes I - III.
Federation of American Societies for Experimental Biology, Bethesda, MD; pp. 195-215, 1450-1457.
Anderson, D.W., J.R. Jehl, R.W. Risebrough, L.A. Woods, L.R. Deweese, and W.G. Edgecombe. 1975. Brown pelicans: improved reproduction off the southern California coast. Science 190:806-808.
Anderson, D.W., R.M. Jurek, and J.O. Keith. 1977. The status of brown pelicans at Anacapa Island in 1975. Calif. Fish and Game 1:4-10.
Azvedo, J.A., Jr., E.G. Hunt, and L.A. Woods, Jr. 1965. Physiological effects of DDT on pheasants. Calif. Fish and Game 51:276-293.
Bernard, R.F. 1963. Studies on the effects of DDT on birds. Biological Series Mi. State U. Museum 2:159-191.
Bernard, R.F. and R.A. Gaertner. 1964. Some effects of DDT on reproduction in mice. J. Mammal. 45:272-276.
Bird, D.M. and R.G. Clark. 1983. Growth of body components in parent- and hand-reared captive kestrels. Raptor Res. 17:77-84.
Bloom, P.H. 1973. Seasonal variation in body weight of sparrow hawks in California. Western Bird Bander 48:17-19.
Braune, B.M. and R.J. Norstrom. 1989. Dynamics of organochlorine compounds in herring gulls: III. Tissue distribution and bioaccumulation in Lake Ontario gulls. Environ. Toxicol. Chem. 8:957-968.
Cannon, M.S. and L.C. Holcomb. 1968. The effect of DDT on reproduction in mice. Ohio J. Sci. 68:19-24.
Chura, N.J. and P.A. Stewart. 1967. Care, food consumption, and behavior of bald eagles used in DDT tests. Wilson Bull. 79:441-448.
Clement, J.G. and A.B. Okey. 1974. Reproduction in female rats born to DDT-treated parents. Bull. Environ. Contam. Toxicol. 12:373-377.
Davison, K.L. and J.L. Sell. 1973. DDT and dieldrin effects on mallard ducks. Federal Proceedings 32:320.
Davison, K.L. and J.L. Sell. 1974. DDT thins shells of eggs from mallard ducks maintained on ad libitum or controlled-feeding regimens. Arch. Environ. Contam. Toxicol. 2:222-232.
Davison, K.L., K.A. Engebretson, and J.H. Cox. 1976. p,p'-DDT and p,p'-DDE effects on egg production, eggshell thickness, and reproduction of Japanese quail. Bull. Environ. Contam. Toxicol. 15:265-270.
Delnicki, D. and K.J. Reinecke. 1986. Mid-winter food uses and body weights of mallards and wood ducks in Mississippi. J. Wildl. Manage. 50:43-51.
Dunning, J.B. 1984. Body Weights of 686 North American Birds. Monograph #1. Western Bird Banding Association.
Durham, W.F., P. Ortega, and W.J. Hayes, Jr. 1963. The effect of various dietary levels of DDT on liver function, cell morphology, and DDT storage in rhesus monkey. Arch. Int. Pharmacodyn. CXLI:111-129.
Fitzhugh, O. 1948. Use of DDT insecticides on food products. Indust. Eng. Chem. 40:704-705. Gilbert, F. 1969. Physiological effects of natural DDT residues and metabolites on ranch mink.

1-21
J. Wildl. Manage. 33:933-943. Haegele M.A. and R.H. Hudson. 1974. Eggshell thinning and residues in mallards one year after
DDE exposure. Arch. Environ. Contam. Toxicol. 2:356-363. Heath, R.G., J.W. Spann, and J.F. Kreitzer. 1969. Marked DDE impairment of mallard
reproduction in controlled studies. Nature 224:47-48. Hill, E.F., R.G. Heath, J.W. Spann, and J.D. Williams. 1975. Lethal Dietary Toxicities of
Environmental Pollutants to Birds. U.S. Fish Wildl. Serv. Spec. Sci. Rep. Wildl. No. 191. Kolaja, G.J. 1977. The effect on DDT, DDE and their sulfonated derivatives on eggshell
formation in the mallard duck. Bull. Environ. Contam. Toxicol. 17:697-701. Kolaja, G.J. and D.E. Hinton. 1977. Effects of DDT on eggshell quality and calcium adenosine
triphosphatase. J. Toxicol. Environ. Health 3:699-704. Laug, E.P., A. Nelson, G. Fitzhugh, and F. Kunze. 1950. Liver cell alteration and DDT storage
in fat of the rat induced by dietary levels of 1 to 50 ppm DDT. Pharmacol. Exp. Therap. 98:268-273.
Lincer, J.L. 1972. DDE-induced eggshell-thinning in the American kestrel: a comparison of the field situation and laboratory results. J. Appl. Ecology 12:781-293.
Longcore, J.R. and F.B. Samson. 1973. Eggshell breakage by incubating black ducks fed DDE. J. Wildl. Manage. 37:390-394.
Longcore, J.R., F.B. Samson, and T.W. Whittendale, Jr. 1971. DDE thins eggshells and lowers reproductive success of captive black ducks. Bull. Environ. Contam. Toxicol. 6:485-490.
Medway, W. and Kare, M.R. 1959. Water metabolism of the growing domestic fowl with special reference to water balance. Poultry Sci. 38:631-637.
Mitjavila, S., G. Carrera, R.A. Boigegrain and R. Derache. 1981. I. Evaluation of the toxic risk of DDT in the rat: during accumulation. Arch. Environ. Contam. Toxicol. 10:459-469.
National Institute for Occupational Safety and Health (NIOSH). 1992. General toxicity file for DDT (CAS No. 59-29-3). In: Registry of Toxic Effects of Chemical Substances (RTECS database, available only on microfiche or as an electronic database). Cincinnati, OH.
Nagy, K.A. 1987. Field metabolic rate and food requirement scaling in mammals and birds. Ecol. Monogr. 57:111-128.
Nelson, N.L. and A.C. Martin. 1953. Gamebird weights. J. Wildl. Manage. 17:36-42. Porter, R.D. and S.N. Wiemeyer. 1972. DDE at low dietary levels kills captive American
kestrels. Bull. Environ. Contam. Toxicol. 8:193-199. Risebrough, R.W. and D.W. Anderson. 1975. Some effects of DDE and PCB on mallards and
their eggs. J. Wildl. Manage. 39:508-513. Robson, W.A., G.H. Arscott, and J.J. Tinsley. 1976. Effect of DDE, DDT and calcium of the
performance of adult Japanese quail (Coturnix coturnix japonica). Poultry Sci. 55:2222-2227.
Rossi, L., O. Barbieri, M. Sanguineti, J.R. Cabral, P. Bruzzi, and L. Santi. 1983. Carcinogenicity study with technical-grade dichlorodiphenyltrichloroethane and 1,1-dichloro-2,2-bis(p-chlorophenyl)ethylene in hamsters. Cancer Res. 43:776-781.
Sauter, E.A. and E.E. Steele. 1972. The effect of low level pesticide feeding on the fertility and hatchability of chicken eggs. Poultry Sci. 51:71-76.
Scott, M.L., M.C. Nesheim., and R.J. Young. 1976. Nutrition of the Chicken. Second Edition. Department of Poultry Science and Division of Nutritional Sciences, Cornell University. M.L. Scott and Associates, Ithaca, NY.
Shellenberger, T.E. 1978. A multi-generation toxicity evaluation of p,p'-DDT and dieldrin with

Japanese quail: I. Effects on growth and reproduction. Drug Chem. Toxicol. 1:137-146. Smith, S.I., C.W. Weber, and B.L. Reid. 1970. Dietary pesticides and contamination of yolks
and abdominal fat of laying hens. Poultry Sci. 49:233-237. Stickel, L.F. and L.I. Rhodes. 1970. The thin eggshell problem. In: J.W. Gillett, ed., Proceedings
of the Symposium, The Biological Impact of Pesticides in the Environment, Oregon State University, Corvallis, OR; pp. 31-35.
Stickel, W.H., L.F. Stickel, R.S. Dyrland, and D.L. Hughes. 1984. DDE in birds: lethal residues and loss rates. Arch. Environ. Contam. Toxicol. 13:1-6.
Stickel, L.F., N.J. Chura, P.A. Stewart, C.M. Menzie, R.M. Prouty, and W.L. Reichel. 1966. Bald eagle pesticide relations. Trans. 31st N. Am. Wildl. Nat. Resourc. Conf. 31:190-201.
Turusov, V.S., N.E. Day, L. Tomatis, E. Gati, and R.T. Charles. 1973. Tumors in CF-1 mice exposed for six consecutive generations to DDT. J. Nat. Cancer Inst. 51:983-997.
U.S. Environmental Protection Agency (EPA). 1980, Nov. 28. Water Quality Criteria Documents, Availability. Federal Register 45:79318-79378.
U.S. Environmental Protection Agency. 1988. Recommendations for, and Documentation of Biological Values for Use in Risk Assessment. Office of Research and Development, Cincinnati, OH. NTIS-PB88-179874.
U.S. Environmental Protection Agency (EPA). 1993a. Wildlife Exposure Factors Handbook. Volume I. Office of Research and Development, Washington, DC. EPA/600/R-93/187a.
U.S. Environmental Protection Agency (EPA). 1993b. Wildlife Exposure Factors Handbook. Volume II. Office of Research and Development, Washington, DC. EPA/600/R-93/187b.
U.S. Environmental Protection Agency (EPA). 1995. Trophic Levels and Exposure Analyses for Selected Piscivourous Birds and Mammals. Volumes I and III. Office of Water, Washington, DC.
Van Veltzen, W. and P. Kreitzer. 1975. The toxicity of p,p'-DDT to the clapper rail. J. Wildl. Manage. 39:305-309.

CHAPTER 1 Tier I Wildlife Criteria for p,p'- Dichlorodiphenyltrichloroethane (DDT) and Metabolites Contents I. Literature Review.............................................................................................................................. 1-1
II. Calculation of Mammalian Wildlife Value ....................................................................................... 1-1
i. Acute and Short-term Toxicity .................................................................................................. 1-1
ii. Subchronic and Chronic Toxicity .............................................................................................. 1-2
iii. Mammalian Wildlife Value Calculation .................................................................................... 1-6
iv. Sensitivity Analysis for Mammalian Wildlife Value................................................................. 1-8
III. Calculation of Avian Wildlife Value ................................................................................................ 1-9
i. Acute and Short-term Toxicity .................................................................................................. 1-9
ii. Subchronic and Chronic Toxicity ............................................................................................ 1-10
iii. Avian Wildlife Value Calculation............................................................................................ 1-15
iv. Sensitivity Analysis for Avian Wildlife Value ........................................................................ 1-17
IV. Great Lakes Wildlife Criterion........................................................................................................ 1-20
i. Discussion of Uncertainties ..................................................................................................... 1-20
V. References ....................................................................................................................................... 1-20

2-1
Tier I Wildlife Criteria for Mercury (Including Methylmercury) I. Literature Review A review of the available literature on the environmental cycling, fate, and toxicity of mercury
(Hg) and mercury compounds indicates that criterion derivation for mercury is most appropriately based on methylmercury. A review of mammalian and avian toxicity data for methylmercury was based on literature identified through computer-based (CAS and BIOSIS), as well as manual, searches. A total of 65 references on the toxicity of mercury to birds and mammals were screened; those references which were reviewed in detail are cited in Section V and primarily include studies that contain dose-response data. Throughout this chapter, all dietary concentrations and doses of mercury compounds are expressed as concentrations of the element mercury only (e.g., mg Hg/kg-day) unless otherwise noted.
II. Calculation of Mammalian Wildlife Value i. Acute and Short-term Toxicity Inorganic mercury is corrosive, and acute exposure to humans and other mammals may cause
salivation, vomiting, bloody diarrhea, upper gastrointestinal tract edema, and hemorrhaging (Klaassen et al., 1986). The main toxic effects from ingestion of organic mercury compounds are neurological effects such as paresthesia, visual disturbances, ataxia, stupor, coma, and death (Klaassen et al., 1986). Methylmercury and other organomercury compounds are toxic to mammals at lower doses than the inorganic forms of mercury (Eisler, 1987). Experimentally induced acute mercury poisoning in mule deer was characterized by belching, bloody diarrhea, piloerection (i.e., the hair was more erect than usual), and loss of appetite (Hudson et al., 1984). In adult mammals, the brain or peripheral nerves are critically affected by ingestion of organic mercury as methylmercury, and probably also as ethylmercury; the kidney appears to be the critical organ affected by ingestion of inorganic mercury (e.g., mercuric mercury) (Suzuki, 1979). In the fetus, the brain is the principal target (Khera, 1979).
The differential toxicity of organic and inorganic forms of mercury is exemplified by the results
of a study by Aulerich et al. (1974). They found that found dietary exposure of adult mink to 5 ppm of methylmercury was lethal in about 1 month, while exposure to 10 ppm of mercuric chloride did not produce adverse effects over 5 months.
Death in sensitive mammalian species has been associated with daily organomercury doses of
0.1 to 0.5 mg/kg body weight and 1 to 5 ppm in the diet (Eisler, 1987). Larger mammals, such as

2-2
mule deer and harp seals, appear to be more resistant to the toxic effects of mercury than smaller mammals (Eisler, 1987). Hudson et al. (1984) reported a single oral dose LD50 value for organomercury of 18 mg/kg body weight, and Ronald et al. (1977) found that two harp seals exposed to mercury at 25 mg/kg body weight per day died within 26 days of dietary exposure (both studies cited in Eisler, 1987). Doses of 1.0 ppm in the diet produced death in all experimental mink within 2 months of exposure (Kirk, 1971 cited in Sheffy and St. Amant, 1982). Eaton et al. (1980) reported that cats exposed to 0.14 mg Hg/kg-day (0.20 mg Hg/kg for 5/7 days per week) in their diet developed neurological abnormalities ("mercury toxicosis") after 68 to 90 days (mean 78 days) of exposure. In contrast, inorganic mercury has been found toxic at higher doses. For example, Kostial et al. (1978) found the acute oral toxicity of two-week-old albino rats dosed with mercuric chloride to be 35 mg Hg/kg. Table 2-1 summarizes these acute toxicity studies for organic mercury only.
Table 2-1. Summary of Acute and Short-Term Mammalian Toxicity Values for Organic Mercury
Route
Species
Exposure Duration
Endpoint: Dose
Reference
oral
mule deer (Odocoileus hemionus)
single dose
LD50: 18 mg/kg
Hudson et al., 1984
oral
harp seal (Pagophilus
groenlandicus)
20 to 26 days
LD100: 25 mg/kg-day
Ronald et al., 1977
diet
mink (Mustela vison)
2 months
LC100: 1 ppm
LD100: 0.15 mg/kg-day
Kirk, 1971 cited in Sheffy and
St. Amant, 1982
diet
mink (M. vison)
1 month
LC100: 5 ppm
Aulerich et al., 1974
diet
domestic cat (Felis domesticus)
68 to 90 days
LOAEL: 0.14 mg/kg-day
Eaton et al., 1980
ii. Subchronic and Chronic Toxicity
Fitzhugh et al. (1950) illustrated the higher toxicity of organic compared with inorganic mercury in two chronic tests with rats. In the first study, rats were exposed to dietary phenyl mercuric acetate (an organic form of mercury) at levels of 0, 0.1, 0.5, 2.5, 10, 40, or 160 ppm Hg for up to two years. Dietary levels as low as 10 ppm Hg significantly reduced growth in males, and 40 ppm Hg significantly reduced growth in both males and females, but survival was decreased only in the 160 ppm group. Thus, for female rats exposed to organic mercury, the LOAEL and NOAEL for growth were 40 and 10 ppm Hg, respectively, and the LOAEL and NOAEL for survivorship were 160 and 40 ppm Hg, respectively. In the second test, rats were exposed to dietary mercuric acetate (an inorganic form of mercury) at the same dose levels also for up to two years. Growth was reduced slightly in males exposed to 160 ppm, otherwise no mortality or growth effects were observed in the exposed animals. Thus, for rats exposed to inorganic mercury, the NOAEL for growth in female rats was 160 ppm Hg.
2-3
To estimate the intake of Hg associated with these dietary concentrations, the average body weights and food ingestion rates of the test rats over the exposure period are needed. The exposure began with weanling rats weighing approximately 0.050 kg. Mature male control rats reached a weight of 0.33 kg, and mature female control rats reached a weight of 0.22 kg. Thus, the average weight of the male and female control rats at maturity was 0.275 kg. The final weight of rats exposed to 160 ppm phenyl mercuric acetate was approximately 0.20 kg for males and 0.15 kg for females. Thus, the average weight of the male and female rats exposed to 160 ppm Hg at maturity was 0.175 kg. Fitzhugh et al. (1950) estimated that the mercury intake for rats exposed to either phenylmercuric acetate or mercuric acetate at 160 ppm Hg in the diet was 2.4 mg Hg/rat-day, at 40 ppm Hg in the diet was 0.6 mg Hg/rat-day, at 10 ppm Hg in the diet was 0.15 mg Hg/rat-day, and at 2.5 ppm Hg in the diet was 0.0375 mg Hg/rat-day. They did not explain the derivation of these values, nor did they distinguish mercury intake rates for males from that of females, indicate different food ingestion rates for diets supplemented with inorganic or organic forms of mercury, or indicate that they had considered the reduced body weight of the rats exposed to 10 ppm and above in their diet compared to rats exposed to lower dietary mercury levels.
Using data provided by the authors to the extent possible, the dose for rats exposed to 160 ppm
Hg is estimated to be 14 mg Hg/kg body weight per day assuming a body weight of 0.175 kg. This dose represents the LOAEL for mortality in rats exposed to organic mercury and the NOAEL for growth in female rats exposed to inorganic mercury.
The dose for rats exposed to dietary concentrations lower than 160 ppm Hg is difficult to
estimate because the Fitzhugh et al. (1950) did not present body weight data for these groups. Assuming that rats exposed to lower levels had the same body weights as the control animals, the NOAEL for male and female growth of 10 ppm is equivalent to 0.56 mg Hg/kg-day. Again assuming the same body weights as control animals, the LOAEL for male and female growth and the LOAEL for survivorship of 40 ppm dose would be 2.2 mg Hg/kg-day.
Rizzo and Furst (1972) orally administered 2 mg of inorganic Hg (as HgO) to pregnant rats on
day 5, 12, or 19 of gestation. A high incidence of runts were born and ocular defects occurred in offspring of dams exposed on day 5 of gestation. In contrast, none of the offspring in the control group were undersized and no ocular defects occurred. Using a rat weight of 0.29 kg (the reported weights ranged from 0.26 to 0.31 kg), a LOAEL of 7 mg/kg (one-time administration) can be inferred.
Several experiments with rats indicate that exposure of females to methylmercury during
gestation can adversely affect reproduction and development. Khera and Tabacova (1973) fed weanling female rats diets of 0, 0.002, 0.01, 0.05, or 0.25 mg Hg/kg-day as methylmercuric chloride in the diet for up to 122 days. Females were mated at maturity with untreated males. No adverse effects were apparent in fetuses at birth at any dose. Postnatal ocular defects occurred in all groups, including the controls. A NOAEL of 0.25 mg Hg/kg-day can be inferred for reproduction in rats.
Fuyuta et al. (1978) dosed Wistar rats with 0, 2, 4, or 6 mg Hg/kg-day as methylmercuric
chloride on days 7 through 14 of gestation. At 6 mg/kg-day, dam growth was significantly reduced, and 9/20 dams exhibited neurotoxic effects, such as spasms, gait disturbance, and hind limb crossing. At 4 and 2 mg/kg-day, dam growth was less than that of control dams on some days during gestation. Thus, 6 mg/kg-day was the LOAEL and 4 mg/kg-day the NOAEL for growth and neurotoxic effects on dams. Offspring growth was significantly reduced at 4 mg/kg-day, and was also reduced at the 6

2-4
mg/kg-day level, although the latter reduction was not significant at p = 0.01 The number of malformations were significantly higher at the 4 and 6 mg/kg-day levels than at the 2 mg/kg-day level or for controls. Thus, for developmental effects in Wistar rats, including reduced offspring growth, a LOAEL of 4 mg Hg/kg-day and a NOAEL of 2 mg Hg/kg-day can be inferred.
Geyer et al. (1985) administered methylmercuric chloride to Sprague-Dawley albino rats at
levels of 0, 0.2, 1, 2, and 4 mg Hg/kg-day during gestation days 6 through 15. No live offspring were born to dams given 4 mg/kg-day. At 2 mg/kg-day, dam and offspring weights were significantly reduced, and physical development (e.g., incisor eruption, eye opening, vaginal patency) and surface righting ability were reduced in offspring. No effects occurred to offspring of dams receiving 1 mg/kg-day or less. Thus a LOAEL of 2 mg/kg-day and a NOAEL of 1 mg/kg-day can be inferred for offspring growth and development in rats.
Vorhees (1985) treated pregnant Sprague-Dawley rats with 1.6 or 4.8 mg Hg/kg-day as
methylmercuric chloride on days 6 through 9 of gestation or animals treated with 0 Hg/kg-day received daily gavage with distilled water; animals left untreated were not manipulated. A dose of 4.8 mg/kg-day lengthened the gestation period, reduced the maternal weight, increased the preweaning mortality of offspring, reduced offspring weight by 60 days of age, and resulted in numerous developmental effects. The 1.6 mg/kg-day dose resulted in no significant effects, except accelerating negative geotaxis turning and swimming angle development. Thus, a LOAEL of 4.8 mg/kg-day and a NOAEL of 1.6 mg/kg-day can be inferred for offspring mortality and development in rats.
Suter and Schon (1986) provided methylmercuric chloride in drinking water at doses equivalent
to 0.21, 0.75, and 1.6 mg Hg/kg-day to female HAN-Wistar rats from 13 days prior to mating until day 21 post partum. At 1.6 mg/kg-day, high mortality occurred in offspring and clinical signs of toxicity (ataxia and slight paresis of hind legs) occurred in dams. No effects on litter size, perinatal or postnatal mortality, or offspring body weight occurred at 0.21 or 0.75 mg/kg-day. However, other developmental effects occurred in offspring of dams fed 0.21 and 0.75 mg/kg-day; for offspring of dams fed 0.21 mg/kg-day, vaginal opening was delayed, midair righting reflex was impaired, and swimming ability was impaired. Thus, an unbounded LOAEL of 0.21 mg Hg/kg-day can be inferred for developmental effects.
Wobeser et al. (1976a) examined the effects of organic and inorganic mercury compounds on
mink. Wobeser et al. (1976a) fed adult female and juvenile ranch mink normal mink rations mixed with fish from Lake Winnipeg, Manitoba, which contained on average 0.44 ppm of total mercury. Two different rations were prepared, one consisting of 50 percent fish and one of 75 percent fish. The corresponding concentrations of Hg in the diet are 0.22 and 0.33 ppm. Wobeser et al. (1976a) did not attempt to determine what fraction of the mercury was inorganic compared with organic in form. Over the course of the 145-day experiment, no clinical or pathological signs of intoxication were observed at these exposure concentrations, suggesting an unbounded NOAEL of 0.33 ppm. Using the captive ranch mink body weight of 1.0 kg and food ingestion rate of 0.15 kg/day provided in the Great Lakes Water Quality Initiative (GLWQI) Technical Support Document (TSD) for Wildlife Criteria, the NOAEL from this study is 0.05 mg/kg-day.
In a subsequent dose-response study, Wobeser et al. (1976b) fed adult female mink rations
treated with methylmercury chloride at concentrations of 1.1, 1.8, 4.8, 8.3, and 15.0 ppm total mercury for up to 93 days. All mink exposed to dietary mercury concentrations of 1.8 ppm and greater developed clinical signs of mercury intoxication (anorexia and ataxia). Of the five mink

2-5
exposed to 1.8 ppm Hg in their diet, two developed ataxia and died, and the remaining three were killed for examination soon after they developed ataxia. The time to onset of the toxic effects and death was directly related to the mercury content of the ration. Pathological alterations in the nervous system were observed at the 1.1 ppm concentration, although they were not associated with any obvious clinical evidence of toxicity. Because these lesions were observed in the nervous systems of animals receiving 1.1 ppm Hg, the authors argued that distinct clinical signs of toxicity would have developed in animals at that dose had the experimental period been longer. Based on these results, the LOAEL for anorexia, ataxia, and mortality in mink fed methylmercury is 1.8 ppm, and the NOAEL is 1.1 ppm. Using the mink body weight and food ingestion rate presented above, the LOAEL is 0.27 mg/kg-day, and the NOAEL is 0.16 mg/kg-day.
Table 2-2 summarizes the subchronic and chronic toxicity test results for mammals exposed to
mercury in their diet. The LOAEL for pathological alterations in the nervous system of mink associated with the 0.16 mgHg/kg-day in the absence of clinical symptomology, does not have clear implications for population-level effects on mink. Thus, the NOAEL for anorexia, ataxia, and death of 0.16 mg Hg/kg-day as methylmercury chloride reported by Wobeser et al. (1976b) is used to calculate a mammalian-based mercury wildlife value (WV). This study consists of repeated oral exposures for over a 90-day period using a mammalian wildlife species, and therefore meets the criteria for an appropriate study for wildlife criteria development as described in Appendix D to 40 CFR 132.
iii. Mammalian Wildlife Value Calculation
As indicated in the previous paragraph, a NOAEL of 0.16 mg/kg-day Hg (administered as methylmercury chloride) from a 90-day mink study by Wobeser et al. (1976a) is used to establish the mammalian WV. There are three uncertainty factors that need to be considered for use with this NOAEL, an interspecies uncertainty factor for extrapolating from one species to another (UFA), a subchronic-to-chronic uncertainty factor (UFS), and a LOAEL-to-NOAEL uncertainty factor (UFL).
In calculating WVs, a UFA within the range of 1 to 100 is recommended in Appendix D to 40
CFR 132 to accommodate differences in toxicological sensitivity between the experimental animal and the representative species (i.e., mink and river otter). The UFA(mink) equals 1 because mink were tested. Otter are closely related to mink (in the same family, Mustelidae), and therefore are likely to be similarly sensitive. Thus, a UFA(otter) equals 1.
The UFS needs to be greater than 1 to extrapolate from a 93-day, subchronic, study to a chronic
exposure. Wobeser et al. (1976b) concluded that the pathological alterations in the nervous system observed at the 1.1 ppm concentration after 93 days, considered a NOAEL for purposes of developing a wildlife criterion, would have resulted in distinct clinical signs of toxicity (anorexia, ataxis, death) had the exposure period been longer. The NOAEL of 0.05 mg Hg/kg-day demonstrated in the 145-day administration of contaminated fish to mink (Wobeser et al., 1976a) is approximately a factor of 3 less than the 93-day (subchronic) NOAEL of 0.16 mg Hg/kg-day from the Wobeser et al. (1976b) study, but 145 days also represents a relatively short subchronic exposure compared with the lifespan of 6 or 7 years for mink (U.S. EPA, 1993a,b). The UFS therefore is set to 10.
A UFL can be set to 1 because the study identified a NOAEL.

2-6
Table 2-2. Summary of Subchronic and Chronic Mammalian Toxicity Values for Mercury
Species
Exposure Duration
LOAEL
(mg/kg-day)
NOAEL
(mg/kg-day)
Mercury
Compound
Toxic Effect
Observed
Reference
2.2 0.56 Growth
rat
2 years
14
2.2
organic
Mortality
Fitzhugh et al., 1950
rat
2 years
14
inorganic
Reproduction, Development
Fitzhugh et al., 1950
rat
Gestation, day 5
7
inorganic
Development
Rizzo and Furst, 1972
rat
122 days
0.25
organic
Reproduction, Development
Khera and Tabacova, 1973
6
4
organic
Adult growth; Neurological
rat
Gestation days 7-14
4
2
organic
Development
Fuyuta et al., 1978
rat
Gestation days 6-15
2
1
organic
Development
Geyer et al., 1985
rat
Gestation days 6-9
4.8
1.6
organic
Offspring mortality and Development
Vorhees, 1985
rat
8 weeks
0.21
organic
Development
Suter and Schon, 1986
mink
145 days
0.05
in fisha
Reproduction, Development
Wobeser et al. 1976a
mink
93 days
0.27
0.16
organic
anorexia, ataxia, and mortality
Wobeser et al. 1976b
a In a recent review of available data, Bloom (1992) concluded that methylmercury generally comprises over 95 percent of the total mercury in fish. Bloom (1992) observed that older reports of lower fractions of methylmercury in fish may have been biased by analytical variability.
The input parameters for the wildlife criteria equation described above are summarized in Table 2-3. Body weights (Wt), ingestion rates (F), and drinking rates (W) for free-living mink and river otter are presented in Table D-2 of Appendix D to 40 CFR 132 and shown in Table 2-4. The bioaccumulation factors (BAFs) relate concentration of methylmercury in fish tissue to the concentration of total mercury in the water column. The methylmercury BAFs for trophic levels 3 and 4 are derived based on the procedure specified in Appendix B to 40 CFR 132, Great Lakes Water Quality Initiative Methodology for Deriving Bioaccumulation Factors.

2-7
Table 2-3. Input Parameters for Calculating the Mammalian Wildlife Value for Mercury
Parameter Category
Notation
Value
Test dose
TD(mammalian)
0.16 mg/kg-day
Interspecies Uncertainty Factor
UFA(mink) UFA(otter)
1 1
Subchronic-to-Chronic Uncertainty Factor
UFS
10
LOAEL-to-NOAEL Uncertainty Factor
UFL
1
Bioaccumulation Factors
BAF3 (trophic level 3) BAF4 (trophic level 4) BAFother (terrestrial)
27,900 Ρ/kg body weight 140,000 Ρ/kg body weight
0 Table 2-4. Exposure Parameters for Representative Mammalian Wildlife Species
Species
Adult Body Weight (Wt)
(kg)
Water Ingestion
Rate (W) (Ρ/day)
Food Ingestion Rate of Prey in Each
Trophic Level (F) (kg/day)a
Mink
0.80
0.081
TL3: 0.159 Other: 0.0177
Otter
7.4
0.60
TL3: 0.976 TL4: 0.244
a Only two digits are significant, but three digits are used for intermediate calculations.
The equations and calculations of mammalian wildlife values are presented below. WV(mink) = TD x [1/(UFA(mink) x UFS x UFL)] x Wt(mink)
W(mink) + [(F(mink,TL3) x BAF3) + (F(other) x BAFother)]
WV(mink)
=
0.16 mg/kg-d x [1/(1 x 10 x 1)] x 0.80 kg 0.081 Ρ/d + [(0.159 kg/d x 27,900 Ρ/kg) + (0.0177 kg/d x 0 Ρ/kg)]
WV(mink)
=
2,880 pg/Ρ
WV(otter) = TD x [1/(UFA(otter) x UFS x UFL)] x Wt(otter)
W(otter) + ((F(otter,TL3) x BAF3) + (FA(otter, TL4) x BAF4)]
0.16 mg/kg-d x [1/(1 x 10 x 1)] x 7.4 kg

2-8
WV(otter) = 0.60 Ρ/d + [(0.976 kg/d x 27,900 Ρ/kg) + (0.244 kg/d x 140,000 Ρ/kg)]
WV(otter)
=
1,930 pg/Ρ
The geometric mean of these two mammalian wildlife values results in
WV (mammalian)
=
e([ln WV(mink) + ln WV(otter)]/2)
WV (mammalian)
=
e([ln 2,880 pg/Ρ + ln 1,930 pg/Ρ]/2)
WV (mammalian)
=
2,400 pg/Ρ (two significant digits)
iv. Sensitivity Analysis for Mammalian Wildlife Value
The values of the various parameters used to derive the mammalian WV presented above represent the most reasonable assumptions. The purpose of this section is to illustrate the significance of these assumptions and the variability in the mammalian WV if other assumptions are made for the values of the various parameters from which the mammalian WV is derived. The intent of this section is to let the risk manager know, as much as possible, the influence on the magnitude of the mammalian WV of the assumptions made in its derivation.
In deriving the mammalian WV for mercury, it was assumed that 90 percent of the mink diet
was comprised of fish and ten percent of the diet came from strictly terrestrial food chains. This assumption may lead to an overestimate of mercury exposure for mink that are not primarily foraging for fish. As indicated in the GLWQI TSD, the proportion of a mink diet that comes from strictly terrestrial sources can vary from almost none to one third of their diet. Furthermore, not all of the prey that mink take from aquatic sources are fish; mink may consume large quantities of crayfish where they are available, and depending on the location and season, up to 50 percent of the diet of mink can be comprised of waterfowl, muskrat, amphibians, and other air-breathing animals that feed from aquatic food chains. In 21 dietary studies of mink summarized in Volumes I and III of Trophic Level and Exposure Analyses for Selected Piscivorous Birds and Mammals (U.S. EPA, 1995), the proportion of a mink diet comprised of fish varies from less than 10 percent to the 90 percent assumed in the mink WV derivation presented above. If it were assumed that only 50 percent of a mink's diet was from aquatic resources and the remaining 50 percent was uncontaminated, the estimated mercury exposure would be reduced by a factor of 1.8. The mink WV would be 4,460 pg/Ρ and the mammalian WV would be 2,900 pg/Ρ, rather than the mammalian WV of 2,400 pg/Ρ.
III. Calculation of Avian Wildlife Value
i. Acute and Short-term Toxicity Methylmercury has been shown to be more toxic to avian species than inorganic mercury. Acute
oral toxicity of methylmercury produced LD50 values ranging from 2.2 to 24 mg/kg for mallards, 11

2-9
to 27 mg/kg for quail, 14 to 34 for Japanese quail, and 24 mg/kg for northern bobwhite. Inorganic mercury produced LD50 values of 26 to 54 mg/kg in quail, and 31 mg/kg in Japanese quail (Eisler, 1987). The LD50 values for avian species are summarized in Table 2-5.
Table 2-5. Summary of Single-dose Oral Avian Toxicity Values for Mercury
Mercury Form
Species
LD50
(mg Hg/kg)
References Japanese quail (Coturnix japonica)
31
Hill and Soares, 1984
Inorganic
Coturnix (Coturnix coturnix)
26 - 54
Hill, 1981
Mallard (Anas platyrhynchos)
2.2 - 24
Hudson et al., 1984
Fulvous whistling duck (Dendrocygna bicolor)
38
Hudson et al., 1984
Northern bobwhite (Colinus virginianus)
24
Hudson et al., 1984
Coturnix (C. coturnix)
11 - 27
Hill, 1981
Ring-necked pheasant (Phasianus colchicus)
12 - 27
Hudson et al., 1984
House sparrow (Passer domesticus)
13 - 38
Hudson et al., 1984
Organic: methylmercury
Japanese quail (C. japonica)
14 - 34
Hudson et al., 1984; Hill and Soares, 1984
Chukar (Alectoris chukar)
27
Hudson et al., 1984
Japanese quail (C. japonica)
21
Hudson et al., 1984
Rock dove (Columba livia)
23
Hudson et al., 1984
Mallard (A. platyrhynchos)
76
Hudson et al., 1984
Gray partridge (Perdix sp.)
18
Hudson et al., 1984
Ring-necked pheasant (P. colchicus)
12
Hudson et al., 1984
Organic: ethylmercury
Prairie chicken (Tympanucus cupido)
12
Hudson et al., 1984
Domestic chicken (Gallus domesticus)
60
Mullins et al., 1977
Organic: phenylmercury
Ring-necked pheasant (P. colchicus) 65-100
Mullins et al., 1977; Hudson et al., 1984
Mercury poisoning in birds is characterized by muscular incoordination, falling, slowness, fluffed feathers, calmness, withdrawal, hyperactivity, hypoactivity, and eyelid drooping (Eisler, 1987). Following acute oral exposures, signs of mercury poisoning have been observed within 20 minutes after administration in mallards, to 2.5 hours after administration in pheasants. Death occurred between 4 and 48 hours in mallards and 2 and 6 days in pheasants (Hudson et al., 1984).

2-10
ii. Subchronic and Chronic Toxicity
Fimreite (1970) raised two-week old leghorn cockerel chicks (Gallus) on commercial feed containing methylmercury dicyandiamide at concentrations of 0, 6, 12, and 18 ppm for 21 days. A significant increase in mortality was observed at the highest concentration of methylmercury (18 ppm); however, mortality in chicks maintained at 6 or 12 ppm was not significantly different than that in the control group. Hence, the LOAEL for mortality is 18 ppm and the corresponding NOAEL is 12 ppm. Growth was significantly reduced in chicks maintained on mercury-treated feed, suggesting an unbounded LOAEL for growth of 6 ppm. The initial weights of the chicks were not reported. The final weights at five weeks of age ranged from 0.41 kg (18 ppm Hg) to 0.44 kg (controls). Using data on body weight and age for female white leghorn chicks from Medway and Kare (1959; see GLWQI TSD for Wildlife Criteria), the average body weight for the chicks between two and five weeks of age would be approximately 0.15 kg (weight at 3 weeks; Medway and Kare, 1959) plus 0.25 kg (weight at 4 weeks; Medway and Kare, 1959) plus 0.425 kg (final weight; Fimreite, 1970) divided by 3, or = 0.28 kg. Fimreite estimated the total mercury intake over the three-week experiment to be 1.7 mg Hg/chick (0.081 mg Hg/chick-day) for the group exposed to 6 ppm Hg, 3.4 mg Hg/chick (0.16 mg Hg/chick-day) for the group exposed to 12 ppm Hg, and 5.1 mg Hg/chick (0.24 mg Hg/chick-day) for the group exposed to 18 ppm Hg. Using 0.28 kg as the average chick body weight over the course of the experiment, the corresponding doses would be 0.29 mg/kg-day (6 ppm Hg), 0.57 mg/kg-day (12 ppm), and 0.86 mg/kg-day (18 ppm). The LOAEL and NOAEL for mortality resulting from ingestion of methylmercury by chickens therefore are 0.86 mg/kg-day and 0.57 mg/kg-day, respectively, and the unbounded LOAEL for growth in chicks is 0.29 mg/kg-day.
Scott (1977) provided white leghorn laying hens with methylmercury chloride at dietary
concentrations of 0, 10, and 20 ppm Hg, and inorganic mercury (mercuric sulfate) at dietary concentrations of 0, 100, and 200 ppm Hg for three weeks. Methylmercury at 10 and 20 ppm Hg in the diet was found to severely impact egg production and weight, fertility of eggs, hatchability of fertile eggs, and eggshell strength. Dietary levels of 100 or 200 ppm Hg as inorganic mercury had little or no effect on egg production, hatchability, shell quality, morbidity, and mortality. An unbounded LOAEL for reproductive effects of methylmercury in white leghorn chickens from this study therefore is 10 ppm Hg. Using a white leghorn hen food ingestion rate of 0.067 kg food/kg body weight per day (kg/kg-day) (Medway and Kare, 1959), the LOAEL for reproductive effects of methylmercury in chickens is 0.67 mg/kg-day.
Spann et al. (1972) tested the effects of dietary organic mercury (ethylmercury p-toluene
sulfonanilide) on the survival of ring-necked pheasants. Adult birds were exposed to dietary concentrations of 0., 4.2, 12.5, 37.4, and 112 ppm Hg for up to 350 days. Exposures to diets containing 12.5 ppm Hg were generally fatal within 2 to 3 months, and exposure to higher concentrations of mercury were fatal in shorter periods of time. At 4.2 ppm Hg in the diet, mortality was no different from control levels; however, egg production was reduced and there was increased embryo mortality in the few eggs laid. Therefore, the LOAEL for mortality for pheasants was 12.5 ppm, and the corresponding NOAEL was 4.2 ppm, while the unbounded LOAEL for reproductive effects was 4.2 ppm. Using an average body weight of 1.1 kg for males and females combined (Nelson and Martin, 1953), a food ingestion rate of 0.053 kg of dried feed/kg fresh body weight per day is derived from Nagy's (1987) allometric equation for non-passerine birds (see the GLWQI TSD for Wildlife Criteria). Assuming that the seeds fed to the pheasants consists of 10 percent water

2-11
(Altman and Dittmer, 1972; U.S. EPA, 1993a indicates 9 percent water), the food ingestion rate would be equivalent to 0.059 kg of fresh feed/kg body weight per day. Using these values, the LOAEL for mortality in pheasants is estimated to be equivalent to a dose of 0.74 mg Hg/kg-day (12.5 ppm Hg) and the NOAEL to be equivalent to 0.25 mg Hg/kg-day (4.2 ppm Hg). The unbounded LOAEL for reproductive effects in pheasants is equivalent to 0.25 mg Hg/kg-day.
Fimreite (1971) identified a LOAEL for reproduction in ring-necked pheasants to
methylmercury. Fimreite (1971) exposed ring-necked pheasants to grain treated with a seed dressing containing methylmercury dicyandiamide at doses of mercury equivalent to approximately 0.093 mg/kg-day, 0.16 mg/kg-day, and 0.27 mg/kg-day for 12 weeks (based on the total mercury intake over 12 weeks and the weight of hens at the beginning of the experiment as reported by Fimreite, 1971). These mercury exposures did not increase adult mortality; however, adverse reproductive effects were observed in hens at all dose levels. At a dose of 0.093 mg Hg/kg-day, egg hatchability decreased, the number of shell-less eggs increased, and embryonic mortality increased, although egg production was not significantly reduced. Egg production was significantly reduced, however, at a dose of 0.16 mg Hg/kg-day. The results of this study suggest an unbounded LOAEL for methylmercury effects on reproduction in pheasants of 0.093 mg Hg/kg-day.
Eskeland and Nafstad (1978) identified a LOAEL and NOAEL for offspring mortality in
Japanese quail exposed to methylmercury. In a multigenerational study of reproductive and developmental effects of methylmercury, Eskeland and Nafstad (1978) exposed Japanese quail to dietary methylmercury at levels of 0, 1, 2, 4, or 8 ppm Hg for 6 weeks. Offspring mortality was significantly increased at levels of 4 and 8 ppm, but not at the lower exposure levels. Therefore, the LOAEL for offspring mortality was 4 ppm, and the corresponding NOAEL was 2 ppm for Japanese quail. Assuming a body weight of 0.12 kg (Davidson et al., 1976; Altman and Dittmer, 1972), a food ingestion rate of 0.091 kg dry food/kg fresh body weight per day was estimated from Nagy's (1987) allometric equation for non-passerine birds (see the GLWQI TSD for Wildlife Criteria). Assuming the laboratory feed to be 10 percent water (Altman and Dittmer, 1972), this would correspond to a food ingestion rate of 0.10 kg of fresh food/kg fresh body weight daily. The authors reported a food ingestion rate of 0.021 kg/bird-day for the 4 ppm group and of 0.0195 kg/bird-day for the 2 ppm group, but did not indicate the body weight of the birds. If their birds weighed 0.12 kg, the average food ingestion rate would be (0.020 kg fresh food per day)/(0.12 kg body weight) or 0.17 kg/kg-day. If the birds were heavy for Japanese quail, weighing 0.15 kg per female (Altman and Dittmer, 1972), the food ingestion rate would be (0.020 kg fresh food per day)/(0.15 kg body weight) or 0.13 kg fresh food/kg fresh body weight daily. Using the latter value of 0.13 kg/kg-day as a food ingestion rate that is more consistent with the allometric predictions, the LOAEL for offspring mortality in Japanese quail was 0.52 mg Hg/kg-day (4 ppm) and the NOAEL was 0.26 mg Hg/kg-day (2 ppm).
Fimreite and Karstad (1971) identified a LOAEL and a NOAEL for neurological and growth
effects and for mortality in red-tailed hawks exposed to organic mercury in their diet. Fimreite and Karstad (1971) exposed one-year-old red-tailed hawks to mercury in poultry chicks that had been fed methylmercury dicyanidamide at three different levels. The total mercury content of the chicks was estimated from measures of their mercury intake and an estimate of their mercury elimination rate. The resulting concentrations of Hg in the chicks (which served as food for the hawks), estimated from data on total mercury intake and body weights reported by the authors (in Table 2), were 2.6, 5.2, and 7.8 ppm Hg (and 0 ppm for the control group). For each exposure level, two different exposure durations were used: 4 and 12 weeks. None of the six control animals or the six animals exposed to 2.6 ppm Hg in their diet showed signs of mercury intoxication and none died. One of the six hawks in

2-12
the 5.2 ppm/12 week exposure group developed severe neurological symptoms and died. Three of the six hawks in the 7.8 ppm Hg group developed behavioral symptoms of neurological toxicity and died (one of three hawks in the 4-week exposure group and two of three hawks in the 12-week exposure group). Lesions in nerve axons and myelin sheaths were found in the affected birds. Thus, the LOAEL for serious neurological effects and mortality in red-tailed hawks is 5.2 ppm, and the corresponding NOAEL is 2.6 ppm Hg in the diet. Using Fimreite and Karstad's (1971) estimates of the total mercury ingestion and body weights for hawks in each exposure group, the LOAEL for mortality and serious neurological effects in red-tailed hawks is 1.2 mg Hg/kg-day and the NOAEL is 0.49 mg Hg/kg-day.
Passerine birds may be similarly sensitive to organic mercury. Scheuhammer (1988) exposed
zebra finches to dietary methylmercury for up to 76 days at levels of 0, 1.0, 2.5, and 5.0 ppm Hg. Behavioral signs of mercury intoxication and increased mortality were found in the 5.0 ppm group. Therefore, the LOAEL for mercury-related mortality for zebra finches was 5.0 ppm Hg, and the NOAEL was 0.5 ppm Hg. The corresponding daily doses, estimated by Scheuhammer (1988), for the LOAEL was 1.75 mg Hg/kg-day and for the NOAEL was 0.88 mg Hg/kg-day.
Heinz and Locke (1976) identified a LOAEL and NOAEL for mortality and neurological effects
in the offspring of mallard ducks exposed to methylmercury in their diet. Adult mallards were exposed to 0, 0.5, or 3 ppm Hg in their diet for about a year and a half. The offspring of the 3 ppm Hg exposure group exhibited tremors and reduced survival. Brain lesions also were evident in the affected offspring. Thus, the LOAEL for these endpoints was 3 ppm Hg, and the corresponding NOAEL was 0.5 ppm Hg. Using a mallard body weight of 1 kg (Delnicki and Reinecke, 1986), a food ingestion rate of 0.054 kg of dried feed/kg fresh body weight per day is derived from Nagy's (1987) allometric equation for non-passerine birds (GLWQI TSD for Wildlife Criteria). Assuming that the laboratory feed for mallards consists of 10 percent water (Altman and Dittmer, 1972), the food ingestion rate would be equivalent to 0.060 kg of standard feed/kg fresh body weight per day. Using this food ingestion rate, the corresponding LOAEL is 0.18 mg Hg/kg-day (3 ppm Hg) and the corresponding NOAEL is 0.030 mg Hg/kg-day (0.5 ppm Hg).
In two series of studies on mallards described in several reports, Heinz (1974, 1975, 1976a,
1976b, 1979) assessed the effects of dietary methylmercury on the reproduction of adult hens for two consecutive breeding seasons and on reproduction and behavior in three consecutive generations of mallards. In the first series of experiments, adult mallards were maintained through two breeding seasons on a diet of commercial feed treated with methylmercury dicyandiamide at concentrations equivalent to 0, 0.5, or 3.0 ppm Hg starting at 18 months of age (Heinz, 1974, 1975, 1976a). In the second series of experiments, the second season offspring from adult mallards exposed to 0.5 ppm dietary mercury were themselves exposed to the same dietary concentration of mercury beginning at 9 days of age, and continuing through their first reproductive season (Heinz, 1976b). Finally, the offspring of these birds became the third generation to be exposed to 0.5 ppm Hg in their diet, again starting at 9 days of age (Heinz, 1979). The nominal treatment levels were confirmed by atomic absorption analysis for elemental mercury.
In the first series of experiments (Heinz; 1974, 1975, 1976a), several measures of reproductive
success and behavioral effects were applied to the first and second breeding seasons of the mallards. During the first breeding season (a few weeks to 4.5 months following the start of mercury administration), there were no consistent differences in eggshell thickness among the three groups; however, egg production stopped earlier among the 3 ppm group than among the 0.5 ppm or control

2-13
group (Heinz, 1974). Moreover, hatching success and hatchling viability, as measured by the number of normal hatchlings and survival of hatchlings through one week, were significantly reduced in the 3.0 ppm group but not in the 0.5 ppm group, compared with the control group. During the second breeding season (approximately 11 to 17 months after mercury administration had started), most measures of reproduction for hens exposed to 3.0 ppm Hg in the diet had improved from the first breeding season and matched control levels (Heinz, 1976a). Only the percent of normal hatchlings surviving through one week remained significantly lower for hens fed 3 ppm Hg in their diet than for controls. These results may indicate an improved ability of the adults to tolerate methlymercury poisoning over time. These results indicate a LOAEL for the reproductive performance of adult mallards exposed to mercury in their diet of 3.0 ppm and a NOAEL of 0.5 ppm.
In a second experimental series, the next two generations of mallards were maintained on a diet
containing 0 or 0.5 ppm Hg (Heinz 1976b, 1979). Breeders used in the second-generation study were offspring of the control and 0.5 ppm ducks from the two-year reproductive study (Heinz, 1976a). As discussed above, the first generation of exposed adults showed no significant reproductive effects based on an assessment of percent cracked eggs, egg production, the percentage of eggs laid outside the nest box, or the number of eggs producing normal hatchlings, which is the NOAEL of 0.5 ppm observed for reproduction in the two-year breeding experiment (Heinz, 1976a). However, a statistically significant increase in eggs laid outside of the nest box and decrease in the number of one-week-old ducklings produced were observed in the second generation exposed to 0.5 ppm Hg in the diet (Heinz, 1976b). Similar, but non-significant, trends were observed for both measures in the third generation (Heinz, 1979), and the results from the second and third generation combined were significantly different from controls on both measures (Heinz, 1979). These results suggest that methylmercury at 0.5 ppm Hg in the diet may be associated with reproductive effects in multigenerational exposures. The results of the multigenerational study (Heinz, 1976b, 1979) combined with the single-generation investigation (Heinz, 1974, 1975, and 1976a) provide the means to more fully interpret the long-term reproductive effects of 0.5 ppm Hg as methylmercury in the diet. Hens exposed to 3 ppm Hg, but not 0.5 ppm Hg, exhibited reproductive impairment in the first generation, but by the second generation, hens exposed to 0.5 ppm Hg in their diet also exhibited reproductive impairment.
Based on the observed adverse reproductive effects across the generations, a LOAEL of 0.5
ppm Hg, as methylmercury, can be inferred. The average food ingestion rate for treated mallards in the second and third generations was 0.156 kg/kg-day. Multiplying the 0.5 ppm dietary mercury LOAEL by the food consumption rate of 0.156 kg/kg-day results in a LOAEL of 0.078 mg/kg-day.
Table 2-6. Summary of Subchronic and Chronic Avian Toxicity Values for Organomercury
Compounds
Species
Exposure Duration
LOAEL
(mg/kg-day)
NOAEL
(mg/kg-day)
Toxic Effect
Observed
Reference 21 days
0.29
Growth
Chicken (juvenile)
21 days 0.86
0.57
Mortality
Fimreite, 1970
Chicken
21 days
0.67
Reproduction
Scott, 1977
350 days
0.74
0.25
Mortality
Spann et al., 1972

2-14
Pheasant 0.25
Reproduction
Pheasant
12 weeks
0.093
Reproduction
Fimreite, 1971
Japanese quail
6 weeks
0.52
0.26
Offspring mortality
Eskeland and Nafstad, 1978
Red-tailed hawk
12 weeks
1.0
0.55
Mortality, Neurological
Fimreite and Karstad, 1971
Zebra finch
76 days
1.75
0.88
Mortality, Neurological
Scheuhammer, 1988
Mallard
1.5 yrs
0.18
0.030
Offspring mortality, Neurological
Heinz and Locke, 1976
Mallard
3 generations
0.078
Reproduction
Heinz, 1974, 1975, 1976a, 1976b, 1979
The results of the studies described above are summarized in Table 2-6. The results of the Heinz
(1974, 1975, 1976a, 1976b, and 1979) studies of the effects of methylmercury on mallard ducks were judged to be the most appropriate for derivation of the avian wildlife value. These studies provide a chemical-specific dose-response curve with explicitly quantified effects on reproduction. These effects clearly have potential consequences on populations of mallards exposed to methylmercury.
iii. Avian Wildlife Value Calculation
As indicated in the previous paragraph, a LOAEL of 0.078 mg/kg-day, from the mallard study by Heinz (1974, 1975, 1976a, 1976b, and 1979), is used to establish the avian wildlife value (WV). There are five uncertainty factors that need to be considered for use with this LOAEL, interspecies uncertainty factors for extrapolating the LOAEL from the mallard to the kingfisher, herring gull, and bald eagle (i.e., a UFA for each of the three species), a subchronic-to-chronic uncertainty factor (UFS), and a LOAEL-to-NOAEL uncertainty factor (UFL).
A UFA greater than 1 is needed to extrapolate from the mallard to calculate a wildlife value for
the belted kingfisher, herring gull, and bald eagle, each of which are in different orders than the mallard. Of the six species (representing four orders) for which LOAELs and NOAELs are presented in Table 2-6, the mallard and the pheasant are the most sensitive. A UFA of 10, therefore, is likely to be overly conservative. However, given the short exposure duration (12 weeks) for the pheasant study, it might be even more sensitive than the mallard. An intermediate value of 3 therefore is used for the UFA for all three of the representative species.
A UFS greater than 1 is not necessary because the Heinz' series of studies covered three
generations.
The UFL was assigned a value of 2 because the LOAEL appeared to be very near the threshold for effects of mercury on mallards.

2-15
Input parameters for the wildlife equation are presented in Table 2-7. The BAFs relate concentration of mercury (methylated) in fish tissue to the concentration of total mercury in the water column. The BMF relates the concentration of methylmercury in herring gulls to the concentration of methylmercury in trophic level 3 fish. Data in the reports of Noreheim and Forslie (1978), Wren (1983), and Vermeer et al. (1973) indicate that tissue concentrations of Hg in piscivorous birds tend to be from 3 to 12 times higher than the tissue concentrations
Table 2-7. Input Parameters for Calculating the Avian Wildlife Value for Mercury
Parameter Category
Notation
Value
Test Dose
TD(avian)
0.078 mg/kg-day
Interspecies Uncertainty Factor
UFA(kingfisher)
UFA(gull) UFA(eagle)
3 3 3
Subchronic-to-Chronic Uncertainty Factor
UFS
1
LOAEL-to-NOAEL Uncertainty Factor
UFL
2
Bioaccumulation Factors
BAF3 (trophic level 3) BAF4 (trophic level 4) BAF(other) (terrestrial)
27,900 Ρ/kg body weight
140,000 Ρ/kg body weight 0
Biomagnification Factor
BMF(TL3 to gulls)
10
of Hg in the fish that the birds feed on. A value of 10 therefore is assigned to the BMF for mercury to derive the avian WV. Values for body weights (Wt), food ingestion rates (F), and drinking rates (W) for the kingfisher, herring gull, and bald eagle are presented in Table D-2 of the methods document (Appendix D to 40 CFR 132) and shown in Table 2-8.
Table 2-8. Exposure Parameters for Representative Avian Wildlife Species
Species
Adult Body Weight (Wt)
(kg)
Water (W)
Ingestion Rate (Ρ/day)
Food (F) Ingestion Rate of Prey in
Each Trophic Level (kg/day)a
Belted Kingfisher
0.15
0.017
TL3: 0.0672
Herring Gull
1.1
0.063
TL3: 0.192 TL4: 0.0480 Other: 0.0267
Bald Eagle
4.6
0.16
TL3: 0.371 TL4: 0.0928 PB: 0.0283 Other: 0.0121

2-16
a Only two digits are significant, but three digits are used for intermediate calculations. TL3 = trophic level three fish; TL4 = trophic level 4 fish; PB = piscivorous birds (e.g., herring gulls); other = non-aquatic birds and mammals.
Calculations of avian wildlife values are summarized below. WV(kingfisher) = TD x [1/(UFA(kingfisher) x UFS x UFL)] x Wt(kingfisher)
W(kingfisher) + (F(kingfisher,TL3) x BAF3)
WV(kingfisher)
=
0.078 mg/kg-d x [1/(3 x 1 x 2)] x 0.15 kg 0.017 Ρ/d + (0.0672 kg/d x 27,900 Ρ/kg)
WV(kingfisher)
=
1,040 pg/Ρ
WV(gull) = TD x [1/(UFA(gull) x UFS x UFL)] x Wt(gull)
W(gull) + [(F(gull,TL3) x BAF3) + (F(gull,TL4) x BAF4) + (F(gull,other) x BAFother]
WV(gull)
=
0.078 mg/kg-d x [1/(3 x 1 x 2)] x 1.1 kg 0.063 Ρ/d + [(0.192 kg/d x 27,900 Ρ/kg) + (0.0480 kg/d x 140,000 Ρ/kg) + (0.0267 kg/d x 0 Ρ/kg)]
WV(gull)
=
1,190 pg/Ρ
WV(eagle) = TD x [1/(UFA(eagle) x UFS x UFL)] x Wt(eagle)
W(eagle) + [(F(eagle,TL3) x BAF3) + (F(eagle,TL4) x BAF4) + (F(eagle, gulls) x BAF3 x BMF(TL3 to gulls)) + (F(eagle,other) x BAFother)]
WV(eagle)
=
0.078 mg/kg-d x [1/(3 x 1 x 2)] x 4.6 kg 0.16 Ρ/d + [(0.371 kg/d x 27,900 Ρ/kg) + (0.0928 kg/d x 140,000 Ρ/kg) + (0.0283 kg/d x 27,900 Ρ/kg x 90) + (0.0121 kg/d x 0 Ρ/kg)]
WV(eagle)
=
1,920 pg/Ρ
The geometric mean of these three avian wildlife values results in
WV (avian)
=
e([ln WV(kingfisher) + ln WV(gull) + ln WV(eagle)]/3)
WV (avian)
=
e([ln 1,040 pg/Ρ + ln 1,190 pg/Ρ + ln 1,920 pg/Ρ]/3)
WV (avian)
=
1,300 pg/Ρ (two significant digits)

2-17
iv. Sensitivity Analysis for Avian Wildlife Value
The values of the various parameters used to derive the avian wildlife value presented above represent the most reasonable assumptions. The purpose of this section is to illustrate the significance of these assumptions and the variability in the avian wildlife value if other assumptions are made for the values of the various parameters from which the avian wildlife value is derived. The intent of this section is to let the risk manager know, as much as possible, the influence on the magnitude of the avian wildlife value of the assumptions made in its derivation.
In deriving the avian WV, a UFL of 2, a UFS of 1, and a UFA of 3 for each of the representative
species were used. If it were assumed that 0.078 mg/kg-day was a NOAEL, and the UFL therefore set to 1, the resulting avian WV would be 2,600 pg/Ρ instead of 1,300 pg/Ρ. If it were assumed that piscivorous birds were similarly sensitive to mercury intoxication (i.e., UFA for each representative species set to 1), then the avian WV would be 3,900 pg/Ρ.
Among the exposure-related input parameter values needed to estimate an avian WV, the
selection of a BMF for mercury from trophic level 3 fish to herring gulls was based on a possible range of values of 3 to 12. A sensitivity analysis of the avian WV to the magnitude of the BMF was therefore conducted. If the BMF value is set to 3, the avian WV is 1,400 pg/Ρ instead of 1,300 pg/Ρ. If the BMF value is set to 12, the resulting avian WV does not change significantly from 1,300 pg/Ρ (derived with a BMF = 10).
The diet of the bald eagle is variable, as the birds take advantage of whatever prey are easiest to
obtain at any given time. For purposes of calculating the avian WV, the diet of the bald eagle was assumed to consist of 5.8 percent herring gulls based on the average value for eight pairs studied on Lake Superior (Kozie, 1986). The diets of individual pairs or populations in other areas of the Great Lakes may include a greater or lesser proportion of herring gulls. The proportion of herring gulls in the diet of a pair of bald eagles nesting next to a gull colony was estimated to be 12.5 percent herring gulls (GLWQI TSD for Wildlife Criteria). A sensitivity analysis was conducted using the dietary composition estimated for this pair of eagles, which was 338 g trophic level 3 fish, 84.5 g trophic level 4 fish, 61.3 g herring gulls, and 6.0 g of non-aquatic birds (GLWQI TSD for Wildlife Criteria). Keeping all other input parameters the same as indicated in Tables 2-7 and 2-8, the bald eagle WV would be 1,560 pg/Ρ, instead of 1,920 pg/Ρ, and the avian WV would be equal to 1,200 pg/Ρ instead of 1,300 pg/Ρ. On the other hand, if bald eagles ate only fish, they would require 527 grams daily (GLWQI TSD for Wildlife Criteria), of which about 422 grams would be trophic level 3 fish and 105 grams would be trophic level 4 fish. This dietary composition would result in a bald eagle WV of 2,260 pg/Ρ, instead of 1,920 pg/Ρ, and the avian WV would be 1,400 pg/Ρ instead of 1,300 pg/Ρ.
IV. Great Lakes Wildlife Criterion The Great Lakes Wildlife Criterion for mercury is determined by the lower of the mammalian
wildlife value (2,400 pg/Ρ) and the avian wildlife value (1,300 pg/Ρ). The avian wildlife value is one order of magnitude lower than the mammalian value. Therefore the Great Lakes Wildlife Criterion for mercury is 1,300 pg/Ρ.
2-18
i. Discussion of Uncertainties Wildlife populations inhabiting the Great Lakes Basin would not be impacted from the intake of
drinking water or prey taken from surface water containing total mercury in concentrations of 1,300 pg/Ρ, based on available exposure, toxicity and bioaccumulation information, and uncertainty factors applied to account for data gaps and the variability inherent in the mercury risk assessment. Criteria for other ecoregions may require an analysis of different wildlife species with different diets and body masses than were used for the Great Lakes Basin. In addition, the bioaccumulation factors in this analysis were based on an analysis specific for the Great Lakes; different bioaccumulation factors may be more appropriate for other waterbodies.
Finally, generic assumptions were made in assessing the hazards of mercury to wildlife
populations through the use of LOAELs and NOAELs for reproduction and development. The use of these levels assumes no hazards to wildlife populations would result from the direct exposure of individuals to mercury. However, it could be argued that some increase in density independent mortality, or decrease in density independent reproductive success, which could be attributable to mercury exposure, could be incurred without impacting the population dynamics of a species. In general, well-validated population models do not yet exist for the species analyzed, and it is difficult to estimate the extent of mortality or reproductive failure that could be incurred. In addition, the interaction of additional chemical as well as non-chemical stressors on wildlife population responses is also poorly resolved at this time.
V. References Altman, P.L. and Dittmer, D.S., eds. 1972. Biology Data Book, Second Edition, Volumes I - III.
Federation of American Societies for Experimental Biology, Bethesda, MD; pp. 195-215, 1450-1457.
Aulerich, R.J., R.K. Ringer, and S. Iwamoto. 1974. Effects of dietary mercury on mink. Arch. Environ. Contam. Toxicol. 2:43-51.
Bloom, N.S. 1992. On the chemical form of mercury in edible fish and marine invertebrate tissue. Can. J. Fish. Aquat. Sci. 49:1010-1017.
Braune, B.M. and R.J. Norstrom. 1989. Dynamics of organochlorine compounds in herring gulls: III. Tissue distribution and bioaccumulation in Lake Ontario gulls. Environ. Toxicol. Chem. 8:957-968.
Eskeland, B. and I. Nafstad. 1978. The modifying effect of multiple generation selection and dietary cadmium on methyl mercury toxicity in Japanese quail. Arch. Toxicol. 40:303-314.
Eisler, R. 1987. Mercury Hazards to Fish, Wildlife, and Invertebrates: A Synoptic Review. U.S. Fish Wildl. Serv. Biol. Rep. 85; 90 pp.
Fimreite, N. 1970. Effects of methyl mercury treated feed on the mortality and growth of leghorn cockerels. Can. J. Anim. Sci. 50:387-389.
Fimreite, N. 1971. Effects of methyl mercury on ring-necked pheasants. Canadian Wildlife Service Occasional Paper Number 9. Department of the Environment; 39 pp.
Fimreite, N. and L. Karstad. 1971. Effects of dietary methyl mercury on red-tailed hawks. J. Wildl. Manage. 35:293-300.
Fitzhugh, O.G., A.A. Nelson, E.P. Laug, and F.M. Kunze. 1950. Chronic oral toxicities of mercuri-phenyl and mercuric salts. Indust. Hyg. Occup. Med. 2:433-442.

2-19
Fuyuta, M., T. Fujimoto, and S. Hirata. 1978. Embryotoxic effects of methylmercuric chloride administrated to mice and rats during organogenesis. Teratology 18:353-366.
Geyer, M.A., R.E. Butcher, and K. Fite. 1985. A study of startle and locomotor activity in rats exposed prenatally to methylmercury. Neurobehav. Toxicol. Teratol. 7:759-765.
Heinz, G.H. 1974. Effects of low dietary levels of methyl mercury on mallard reproduction. Bull. Environ. Contam. Toxicol. 11:386-392.
Heinz, G.H. 1975. Effects of methylmercury on approach and avoidance behavior of mallard ducklings. Bull. Environ. Contam. Toxicol. 13:554-564.
Heinz, G.H. 1976a. Methylmercury: Second-year feeding effects on mallard reproduction and duckling behavior. J. Wildl. Manage. 40:82-90.
Heinz, G.H. 1976b. Methylmercury: Second-generation reproductive and behavioral effects on mallard ducks. J. Wildl. Manage. 40:710-715.
Heinz, G.H. 1979. Methylmercury: reproductive and behavioral effects on three generations of mallard ducks. J. Wildl. Manage. 43:394-401.
Heinz, G.H. and L.N. Locke. 1976. Brain lesions in mallard ducklings from parents fed methylmercury. Avian Diseases 20:9-17.
Hudson, R.H., R.K. Tucker, and M.A. Haegele. 1984. Handbook of Toxicity of Pesticides to Wildlife. U.S. Fish Wildl. Serv. Resour. Publ. 153; 90 pp.
Khera, K.S. 1979. Teratogenic and genetic effects of mercury toxicity. In: J.O. Nriagu, ed., The Biogeochemistry of Mercury in the Environment. Elsevier/North-Holland Biomedical Press, New York, NY; pp. 501-518.
Khera, K.S. and S.A. Tabacova. 1973. Effects of methylmercuric chloride on the progeny of mice and rats treated before or during gestation. Food Cosmet. Toxicol. 11:245-254.
Klaassen, C.D., M.O. Amdur, and J. Doull. 1986. Casarett and Doull's Toxicology. 3rd Edition. New York, NY: Macmillan Publishing Company.
Kirk, R.J. 1971. Fish meal, higher cereal levels perform well. U.S. Fur Rancher 50:4-6. Kostial, K., D. Kello, S. Jugo, I. Rabar, and T. Maljkovic. 1978. Influence of age on metal
metabolism and toxicity. Environ. Health Perspect. 25:81-86. Kucera, E. 1983. Mink and otter as indicators of mercury in Manitobal waters. Canad. J. Zool.
61:2250-2256. Lillie, R.J., H.C. Cecil, J. Bitman, and G.F. Fries. 1975. Toxicity of certain polychlorinated and
polybrominated biphenyls on reproductive efficiency of caged chickens. Poultry Sci. 54:1500-1555.
Medway, W. and M.R. Kare. 1959. Water metabolism of the growing domestic fowl with special reference to water balance. Poultry Sci. 38:631-637.
National Institute for Occupational Safety and Health (NIOSH). 1991. Registry of Toxic Effects of Chemical Substances (RTECS database, available only on microfiche or as an electronic database). Cincinnati, OH.
Nelson, N.L. and A.C. Martin. 1953. Gamebird weights. J. Wildl. Manage. 17:36-42. Noreheim, G. and A. Forslie. 1978. The degree of methylation and organic distribution in some
birds ofprey. Acad. Pharmacol. Toxicol. 43:196-204. Ronald, K., S.V. Tessaro, J.F. Uthe, H.C. Freeman, and R. Frank. 1977. Methylmercury
poisoning in the harp seal (Pagophilus groenlandicus). Sci. Total Environ. 8:1-11.

2-20
Scheuhammer, A.M. 1988. Chronic dietary toxicity of methylmercury in the zebra finch, Poephila guttata. Bulletin of Environmental Contamination and Toxicology 40:123-130.
Scott, M. L. 1977. Effects of PCBs, DDT, and mercury compounds in chickens and Japanese quail. Federation Proceedings. 36:1888-1893.
Spann, J.W., R.G. Heath, J.F. Kreitzer, and L.N. Locke. 1972. Ethyl mercury p-toluene sulfonanilide: Lethal and reproductive effects on pheasants. Science 175:328-331.
Suter, K.E. and H. Schon. 1986. Testing strategies in behavioral teratology: I. Testing battery approach. Neurobehav. Toxicol. Teratol. 8:561-566.
Suzuki, T. 1979. Dose-effect and dose-response relationships of mercury and its derivatives. In: J.O. Nriagu, ed., The Biogeochemistry of Mercury in the Environment. Elsevier/North-Holland Biomedical Press, New York, NY; pp. 399-431.
U.S. Environmental Protection Agency. 1988. Recommendations for, and Documentation of Biological Values for Use in Risk Assessment. Office of Research and Development, Cincinnati, OH. NTIS-PB88-179874.
U.S. Environmental Protection Agency. 1995. Trophic Level and Exposure Analyses for Selected Piscivorous Birds and Mammals. Volumes I and III. Office of Water, Office of Science and Technology, Washington, DC.
Vermeer, K., F.A.J. Armstrong, and D.R.M. Hatch. 1973. Mercury in aquatic birds at Clay Lake, Western Ontario. J. Wildl. Manage. 37:58-61.
Vorhees, C. 1985. Behavioral effects of prenatal methylmercury in rats: a parallel trial to the collaborative behavioral teratology study. Neurobehav. Toxicol. Teratol. 7:717-725.
Wobeser, G., N.D. Nielsen, and B. Schiefer. 1976. Mercury and Mink I: The use of mercury contaminated fish as a food for ranch mink. Can. J. Comp. Med. 40:30-33.
Wobeser, G., N.D. Nielsen, and B. Schiefer. 1976a. Mercury and Mink II: Experimental methyl mercury intoxication. Can. J. Comp. Med. 40:34-45.
Wren, C.D., H.R. MacCrimmon, and B.R. Loescher. 1983. Examination of bioaccumulation and biomagnification of metals in a precambrian shield lake. Water, Air, and Soil Pollut. 19:277-291.


CHAPTER 2 Tier I Wildlife Criteria for Mercury (Including Methylmercury) Contents I. Literature Review............................................................................................................................. 2-1
II. Calculation of Mammalian Wildlife Value ...................................................................................... 2-1
i. Acute and Short-term Toxicity Studies..................................................................................... 2-1
ii. Subchronic and Chronic Toxicity Studies ................................................................................ 2-2
iii. Mammalian Wildlife Value Calculation ................................................................................... 2-5
iv. Sensitivity Analysis for Mammalian Wildlife Value................................................................ 2-8
III. Calculation of Avian Wildlife Value ............................................................................................... 2-8
i. Acute and Short-term Toxicity Studies..................................................................................... 2-8
ii. Subchronic and Chronic Toxicity Studies .............................................................................. 2-10
iii. Avian Wildlife Value Calculation........................................................................................... 2-15
iv Sensitivity Analysis for Avian Wildlife Value ....................................................................... 2-17
IV. Great Lakes Wildlife Criterion....................................................................................................... 2-18
i. Discussion of Uncertainties .................................................................................................... 2-18
V. References ...................................................................................................................................... 2-18

3-1
Tier I Wildlife Criteria for 2,3,7,8-Tetrachlorodibenzo-p-dioxin (2,3,7,8-TCDD) I. Literature Review A review of mammalian and avian toxicity data for 2,3,7,8-TCDD was based on literature
received through computer-based (CAS and BIOSIS) as well as manual searches. A total of 26 references were screened; those references that were reviewed in detail are cited in Section V, and primarily include those that contain dose-response data. In this chapter, all dietary concentrations of 2,3,7,8-TCDD are expressed as parts per trillion (ppt), and all doses are expressed as micrograms/kg body weight (Φg/kg) for a single dose or Φg/kg-day for a daily dose.
II. Calculation of Mammalian Wildlife Value i. Acute and Short-term Toxicity The toxicity of 2,3,7,8-TCDD to mammals varies greatly both across mammalian species and
within a given mammalian species. Large differences between mammalian species exist in the lethal dosages and toxic effects associated with single oral doses of 2,3,7,8-TCDD. A difference of more than 8,400 fold for LD50 values following single oral doses exists between guinea pigs (0.6 to 2 Φg/kg) and hamsters (1,160 to 5,050 Φg/kg) (see Table 3-1). Intraspecific differences in acute toxicity have also been observed. For example, LD50 values following oral exposure to 2,3,7,8-TCDD have varied from 182 to 2,570 Φg/kg body weight in three different strains of mice (Chapman and Schiller, 1985).
Acute toxic responses to 2,3,7,8-TCDD by mammals have been characterized by progressive
loss of body weight, appetite suppression, and delayed lethality (Eisler, 1986). Rats treated with a single oral dose of 2,3,7,8-TCDD (5, 15, 25, and 50 Φg/kg) have displayed a dose-related depression in food intake and body weight (Seefeld and Peterson, 1983), and a "wasting syndrome" has been characterized at the highest dosage (Seefeld et al., 1984). This is consistent with necropsy examinations in which the most constant observations noted in mammals are thymic atrophy and general loss of body condition. Hepatic toxicity also appears to be a prominent component of dioxin toxicity in many mammals, although for monkeys, effects on the bone marrow and epithelial tissue are more prominent (Kociba and Schwetz, 1982.)

3-2
Table 3-1. Summary of Acute and Short-term Mammalian Toxicity Values for
2,3,7,8-TCDD
Route
Species Exposure Duration
LD50 (Φg/kg)a
Reference
oral
guinea pig
single dose
0.6 - 2.1
Schwetz et al., 1973
oral
rat
single dose
22 - 45
Schwetz et al., 1973
oral
Rhesus monkey
single dose
~ 70
Kociba and Schwetz, 1982
oral
dog
single dose
~ 100 - 200
Kociba and Schwetz, 1982
oral
mouse
single dose
114 - 284
Kociba and Schwetz, 1982
oral
rabbit
single dose
115
Schwetz et al., 1973
oral
hamster
single dose
1,160 - 5,050
Kociba and Schwetz, 1982
oral
mink (males)
28 days
4.2
Hochstein et al., 1988
i.p.
mink (kits)
12 days
< 0.1
Aulerich et al., 1988
aUnits in micrograms per kilogram body weight (Φg/kg) for single doses, or Φg/kg-day for doses over several days.
Hochstein et al. (1988) studied the effects of 2,3,7,8-TCDD on adult male mink (Mustela vison) by administering single oral doses of 0, 2.5, 5.0, and 7.5 Φg/kg body weight and found a 28-day LD50 of 4.2 Φg/kg body weight for adult male mink. These results reveal that mink are among the most acutely sensitive species to 2,3,7,8-TCDD. This conclusion is supported by the work of Aulerich et al. (1988) who administered 2,3,7,8-TCDD at doses of 0, 0.1, and 1 Φg/kg body weight via intraperitoneal (i.p.) injection to newborn mink for 12 consecutive days and observed the kits for up to 19 weeks. All kits exposed at the higher dose died within two weeks and by 19 weeks mortality in the lower dose group had reached 62 percent.
ii. Subchronic and Chronic Toxicity No subchronic or chronic studies were identified for mammalian wildlife species, however,
chronic toxicity of 2,3,7,8-TCDD in wildlife species can be extrapolated from the results of a number of subchronic and chronic studies using laboratory animals.
Kociba et al. (1978) reported on a two-year toxicity and oncogeny study, using rats (Sprague-
Dawley, 50 males and 50 females per group) administered dietary doses of 2,3,7,8-TCDD of 0, 0.001, 0.01, and 0.1 Φg/kg-day (2,200, 210, and 22 ppt TCDD in the diet) for up to two years. Mortality, food consumption, body weight, urinary and serum parameters, and gross and microscopic observations on tissues for tumors and tumor-like lesions were evaluated. Animals given the highest dose (0.1 Φg/kg-day) exhibited increased mortality (in females only), decreased body weight gain, changes in urinary and serum parameters, and increased tumor incidence. Increased tumor incidence was seen to a lesser extent in the mid-dose group. The general body condition also was consistently

3-3
affected. Degenerative, inflammatory, and necrotic changes in the liver were observed in rats given 0.1 or 0.01 Φg/kg-day. Kociba et al. (1978) concluded that lifetime ingestion of 0.001 Φg/kg-day caused no effects of toxicological significance. This study, therefore, reported a LOAEL and NOAEL of 0.01 and 0.001 Φg/kg-day for effects on the liver, and a LOAEL of 0.1 Φg/kg-day for mortality in female rats with an associated NOAEL of 0.01 Φg/kg-day.
In an experiment with a relatively short duration of exposure, Khera and Ruddick (1973)
assessed the postnatal effect of prenatal exposure to 2,3,7,8-TCDD. Pregnant Wistar rats were given 0, 0.125, 0.25, 0.5, or 1.0 Φg/kg-day TCDD from days 6 through 15 of gestation. Dose-related decreases in the average litter size and pup weight at birth were noted in all but the 0.125 Φg/kg-day dose groups. Survival of pups until weaning (day 21) and average pup weight of the weanlings were significantly reduced at the two highest dose groups, with no pups surviving until weaning in the 1.0 Φg/kg-day group. In addition, decreases in the incidence of pregnancy and average litter size were noted in the f1 generation of the 0.5 Φg/kg-day group but not the 0.25 Φg/kg-day group. Based on the average litter size and pup weight at birth, these results suggest a NOAEL of 0.125 Φg/kg-day and a LOAEL of 0.25 Φg/kg-day for reproductive effects of TCDD on rats.
Murray et al. (1979) exposed three generations (f0, f1, and f2 generations) of Sprague-Dawley
rats to dietary 2,3,7,8-TCDD. Rats were maintained on diets equivalent to daily intake rates of 0, 0.001, 0.01, and 0.1 Φg/kg-day for at least 90 days prior to gestation and throughout the gestation period. In the f0 generation, fertility and neonatal survival of their pups were significantly reduced among the rats given 0.1 Φg/kg-day. At the 0.01 Φg/kg-day dose, no effect on fertility was observed among the f0 rats, but a significant reduction in fertility was observed among the f1 and f2 rats. No significant difference was observed between the fertility of the 0.001 Φg/kg-day rats and the controls. Significantly decreased litter sizes and increased incidence of stillbirths (pups dead at birth) were noted among the f0 0.1 Φg/kg-day group and the f1 and f2 rats receiving TCDD at 0.01 Φg/kg-day. The percentage of pups alive at birth also was significantly higher among the litters of the 0.001 Φg/kg-day f1 generation, but not in earlier or later generations. Significant decreases in postnatal body weight were observed among the litters of the f1 and f2 generations but not among the litters from the f0 generation exposed to 0.01 Φg/kg-day. However, average body weight of pups of rats given 0.1 Φg/kg-day, or any generation of the 0.01 Φg/kg-day group, were not significantly different from those of control pups. Based on the results summarized above, the reproductive capacity of rats in the 0.001 Φg/kg-d group was not significantly affected in any generation, but it was reduced in the f1 and f2 generations of the 0.01 Φg/kg-day group. Therefore, a LOAEL of 0.01 Φg/kg-day and a NOAEL of 0.001 Φg/kg-day for reproductive capacity of Sprague-Dawley rats were determined from this study.
In addition to rodent studies, there are also a number of chronic studies assessing the effects of
2,3,7,8-TCDD to primates. Allen et al. (1979) fed adult female Rhesus monkeys diets containing 0, 50, and 500 ppt 2,3,7,8-TCDD. After 7 months of exposure, the females were bred. Both groups of exposed females exhibited significantly impaired reproduction with only 1/8 normal births in the 500 ppt group, 2/8 normal births in the 50 ppt group, and 8/8 normal births in the control group. Using an adult female Rhesus monkey body weight of 9 kg and food ingestion rate of 0.37 kg/day (values for mature females from U.S. EPA, 1988), the LOAEL of 50 ppt dietary exposure corresponds to a dose of 0.0021 Φg/kg-day.

3-4
Bowman et al. (1989a, 1989b) reported impaired social behavior and decreased survival of young Rhesus monkeys whose mothers had been exposed to 25 ppt but not to 5 ppt 2,3,7,8-TCDD in feed following exposures of between 7 to 48 months. The exposures were discontinued after 42 months (5 ppt group) or 48 months (25 ppt group). Starting 10 months after TCDD exposure stopped, the females were bred again. No indication of reproductive impairment was observed in females that had been exposed 10 months earlier to either dose level. The offspring from these breeding experiments were evaluated for survivorship and developmental and behavioral effects (Bowman et al., 1989a). While no significant effects of TCDD exposure were found on birth weight, growth, or physical appearance of the offspring, significantly fewer offspring survived to weaning in the group exposed to 25 ppt 2,3,7,8-TCDD (Bowman et al., 1989b) and results of some behavioral tests, including alterations in social behavior, were considered to be indicative of TCDD effects in the offspring of this group (Bowman et al, 1989a). Using the food ingestion rate of 0.19 kg/day provided by Bowman et al. (1989b) and a body weight of 8.0 kg (value for chronic exposure of females; U.S. EPA, 1988), the reproduction study of Bowman et al. (1989b) provides evidence of a LOAEL for offspring mortality of 0.00059 Φg/kg-day and a NOAEL at 0.00012 Φg/kg-day for Rhesus monkeys exposed to TCDD.
The results of the chronic and reproductive studies described above are summarized in Table 3-
2. The study reported by Murray et al. (1979), in which three generations of Sprague-Dawley rats were exposed to 2,3,7,8-TCDD, was selected for use in developing the mammalian wildlife value. This study was selected because it consists of a multi-generational study that demonstrates a dose-response to 2,3,7,8-TCDD exposure for reproductive effects in which a NOAEL was identified. Although the studies of Allen
Table 3-2. Summary of Subchronic and Chronic Mammalian Toxicity Values for 2,3,7,8-TCDD
Species
Exposure Duration
LOAEL
(Φg/kg-day)
NOAEL
(Φg/kg-day)
Toxic Effect Observed
Reference
Rat
2 years
0.1
0.01
Female mortality
Kociba et al., 1978
Rat
gestation days 6 to 15
0.25
0.125
Litter size, Pup weight
Khera and Ruddick, 1973
Rat
3 generations
0.01
0.001
Reproductive capacity
Murray et al., 1979
Rhesus Monkey
7 months
0.0021
Number births
Allen et al., 1979
Rhesus Monkey
7 - 48 months maternal
0.00059
0.00012
Reproductive
Bowman et al., 1989b
et al. (1979) and Bowman et al. (1989a, 1989b) suggest that Rhesus monkeys are more sensitive to reproductive effects of 2,3,7,8-TCDD than are rats, the study by Murray et al. (1979) was selected to derive the TD because: (1) the length of exposure was significantly longer than that used in the monkey study, and (2) there exist complementary short-term TCDD toxicity data for the rat and

3-5
mink to guide the selection of a UFA. The influence of not using the Rhesus monkey data to derive a mammalian WV is discussed in the sensitivity analysis.
iii. Mammalian Wildlife Value Calculation
As indicated in the previous paragraph, a NOAEL for reproductive effects of 0.001 Φg/kg-day from the three-generation rat study by Murray et al (1979) is used to establish the mammalian wildlife value (WV) (Table 3-3). There are three types of uncertainty factors that need to be considered for use with this NOAEL, interspecies uncertainty factors for extrapolating from the test species to the representative species (UFA), a subchronic-to-chronic uncertainty factor (UFS), and a LOAEL-to-NOAEL uncertainty factor (UFL).
Table 3-3. Input Parameters for Calculating the Mammalian Wildlife Value for 2,3,7,8-TCDD
Parameter Category
Notation
Value
Test Dose
TD(mammalian)
0.001 Φg/kg-day
Interspecies Uncertainty Factor
UFA(mink) UFA(otter)
10 10
Subchronic-to-Chronic Uncertainty Factor
UFS
1
LOAEL-to-NOAEL Uncertainty Factor
UFL
1
Bioaccumulation Factors
BAF3 (trophic level 3) BAF4 (trophic level 4) BAFother (terrestrial)
172,100 Ρ/kg body weight 264,100 Ρ/kg body weight
0
In calculating WVs, a UFA within the range of 1 to 100 is recommended in Appendix D to 40 CFR 132 to accommodate differences in toxicological sensitivity between the experimental animal and the representative species (i.e., mink and river otter). Based on the limited number of mammalian species for which chronic data are available, and the extreme sensitivity of mink among those mammalian species for which acute toxicity data are available, the UFA(mink) is set equal to 10. Based on the limited number of mammalian species for which chronic data are available, and the lack of any acute or chronic toxicity data for the river otter, the UFA(otter) also is set equal to 10.
The UFS does not need to be greater than 1, because Murray et al. (1979) exposed the rats to
2,3,7,8-TCDD over three generations.
A UFL can be set to 1 because the study identified a NOAEL.
Input parameters for the wildlife equation are presented in Table 3-3. Body weights (Wt), ingestion rates (F), and drinking rates (W) for free-living mink and river otter are presented in Table D-2 of the methodology document (Appendix D to 40 CFR 132) and shown in Table 3-4. The bioaccumulation factors (BAFs) relate the concentration of 2,3,7,8-TCDD in fish tissue to the concentration of 2,3,7,8-TCDD in the water column. The BAFs for trophic levels 3 and 4 are derived based on the procedure specified in Appendix B to 40 CFR 132, Great Lakes Water Quality Initiative Methodology for Deriving Bioaccumulation Factors.

3-6
Table 3-4. Exposure Parameters for Representative Mammalian Wildlife Species
Species
Adult Body Weight (Wt)
(kg)
Water (W)
Ingestion Rate (Ρ/day)
Food (F) Ingestion Rate of Prey in Each Trophic Level (kg/day)a
Mink
0.80
0.081
TL3: 0.159 Other: 0.0177
Otter
7.4
0.60
TL3: 0.976 TL4: 0.244
a Only two digits are significant, but three digits are used for intermediate calculations.
The equations and calculations of mammalian wildlife values are presented below. WV(mink) = TD x [1/(UFA(mink) x UFS x UFL)] x Wt(mink)
W(mink) + [(F(mink,TL3) x BAF3) + (F(mink,other) x BAFother)]
WV(mink)
=
0.001 mg/kg-d x [1/(10 x 1 x 1)] x 0.80 kg 0.081 Ρ/d + [(0.159 kg/d x 172,100 Ρ/kg) + (0.0177 kg/d x 0 Ρ/kg)]
WV(mink)
=
0.00292 pg/Ρ
WV(otter) = TD x [1/(UFA(otter) x UFS x UFL)] x Wt(otter) W(otter) + ((F(otter,TL3) x BAF3) + (FA(otter, TL4) x BAF4)]
WV(otter)
=
0.001 mg/kg-d x [1/(10 x 1 x 1)] x 7.4 kg
0.60 Ρ/d + [(0.976 kg/d x 172,100 Ρ/kg) + (0.244 kg/d x 264,100 Ρ/kg)]
WV(otter)
=
0.00318 pg/Ρ
The geometric mean of these two mammalian wildlife values results in
WV (mammalian)
=
e([ln WV(mink) + ln WV(otter)]/2)
WV (mammalian) = e([ln0.00292 pg/Ρ + ln 0.00318 pg/Ρ]/2)
WV (mammalian)
=
0.0031 pg/Ρ (two significant digits)
3-7
iv. Sensitivity Analysis for Mammalian Wildlife Value
The values of the various parameters used to derive the mammalian WV presented above represent the most reasonable assumptions. The purpose of this section is to illustrate the significance of these assumptions and the variability in the mammalian WV if other assumptions are made for the values of the various parameters from which the mammalian WV is derived. The intent of this section is to let the risk manager know, to the extent possible, the influence on the magnitude of the mammalian WV of the assumptions made in its derivation.
In deriving the mammalian WV for 2,3,7,8-TCDD, it was assumed that 90 percent of the mink
diet was comprised of fish and ten percent of the diet came from strictly terrestrial food chains. This assumption may lead to an overestimate of the 2,3,7,8-TCDD exposure for mink that are not primarily foraging on fish. As indicated in the Great Lakes Water Quality Initiative (GLWQI) Technical Support Document (TSD) for Wildlife Criteria, the proportion of a mink diet that comes from strictly terrestrial sources can vary from almost none to one third of their diet. Furthermore, not all of the prey that mink take from aquatic sources are fish; mink may consume large quantities of crayfish where they are available, and depending on the location and season, up to 50 percent of the diet of mink can be comprised of waterfowl, muskrat, amphibians, and other air-breathing animals that feed from aquatic food chains. In 21 dietary studies of mink summarized in Volumes I and III of Trophic Level and Exposure Analyses for Selected Piscivorous Birds and Mammals (U.S. EPA, 1995), the proportion of a mink diet comprised of fish varies from less than 10 percent to the 90 percent assumed in the mink WV derivation presented above. If it were assumed only 50 percent of a mink's diet was from aquatic resources and the remaining 50 percent of the diet was uncontaminated, the estimated 2,3,7,8-TCDD exposure would be reduced by a factor of 1.8. The resulting mink WV would be 0.00526 pg/Ρ, and the mammalian WV would be 0.0042 pg/Ρ, rather than the mammalian WV of 0.0031 pg/Ρ.
As with many criterion derivations, there may be more than one interpretation of the results of a
multiparameter, multigenerational, toxicity study. The NOAEL of 0.001 Φg/kg-day derived from Murray et al.(1979) for reproductive effects of 2,3,7,8-TCDD on rats concludes that no adverse effects will be observed at that dose. However, a reevaluation of the Murray et al. (1979) data by Nisbet and Paxton (1982) using different statistical methods (i.e. pooling data from different generations) indicated that the 0.001 Φg/kg-day dose level resulted in toxic effects, including significant reductions in offspring survival indices, increases in liver and kidney weight of pups, decreased thymus weight of pups, decreased neonatal weights, and increased incidence of dilated renal pelvis. Nisbet and Paxton (1982) concluded that 0.001 Φg/kg-day was a LOAEL and not a NOAEL for the Murray et al. (1979) study. Another evaluation by Kimmel (1988) considered the Murray et al. (1979) data to be suggestive of a pattern of decreased offspring survival and increased offspring renal pathology at 0.001 Φg/kg-day, even though the pooling of generations by Nisbet and Paxton (1982) was considered to be biologically inappropriate. Assuming that 0.001 Φg/kg-day is a LOAEL, and dividing this LOAEL by a LOAEL-to-NOAEL uncertainty factor (UFL) of 3 results in a mammalian WV of 0.0010 pg/Ρ instead of the mammalian WV of 0.0031 pg/Ρ.
The mammalian assessment assumed that the mink is one of the most sensitive mammalian
species to the toxic effects of TCDD, and both the UFA(mink) and UFA(otter) were set equal to 10 to estimate NOAELs for mink and otter from the rat NOAEL. A comparison of toxic effect levels between the Rhesus monkey (Allen et al., 1979; Bowman et al., 1989b) and the rat (Murray et al.,

3-8
1979) suggests that the monkey is more sensitive to reproductive effects from 2,3,7,8-TCDD than is the rat. Therefore, a sensitivity analysis was conducted using the Rhesus monkey NOAEL of 0.00012 Φg/kg-day from the study of Bowman et al. (1989b) to calculate the mammalian WV. Assuming that the mink and otter are similar to the monkey in sensitivity to TCDD, the UFA(mink) and UFA(otter) would be set to 1, and the resulting mammalian WV would be 0.0037 pg/Ρ instead of 0.0031 pg/Ρ.
III. Calculation of Avian Wildlife Value i. Acute and Short-term Toxicity Hudson et al. (1984) presented single-dose oral LD50 values for three avian species for 2,3,7,8-
TCDD. These LD50 values vary from 15 Φg/kg body weight in male 7-month old northern bobwhite quail to more than 108 Φg/kg body weight for mallards and more than 810 Φg/kg body weight for adult male ringed turtle doves. For all three species, death occurred between 13 and 37 days after treatment and remission in survivors apparently occurred by 30 days after treatment. Gross necropsies of the ringed turtle dove survivors revealed enlarged livers and necropsies of the dead bobwhite revealed severe emaciation and accumulation of fluids in the pericardium and abdominal cavity (Hudson et al. 1984).
Gallinaceous birds are among the more sensitive of the species tested. Greig et al. (1973)
estimated an oral LD50 for 4- to 6-week old white leghorn chickens of 25 to 50 Φg/kg, finding accumulation of serous fluid in the pericardial sac, as described for the "chick edema syndrome" (Gilbertson et al., 1991) in the chicks that died. Schwetz et al. (1973) orally administered 2,3,7,8-TCDD to 3-day old white leghorn cockerels for 20-21 days at doses of 0, 0.01, 0.10, 1.0, and 10 Φg/kg-day to assess occurrence of chick edema. For both mortality and chick edema, as indicated by gross lesions, they found a LOAEL of 1.0 Φg/kg-day and a NOAEL of 0.10 Φg/kg-day. Nosek et al. (1992b) treated ring-necked pheasant hens via i.p. injection with single doses of 2,3,7,8-TCDD of 0, 6.25, 25 or 100 Φg/kg body weight and observed the animals for 11 weeks post treatment. The pheasant hens showed a dose-dependent increase in cumulative percent mortality preceded by a dose-dependent decrease in body weight. All hens treated at the highest dose of 100 Φg/kg body weight died within six weeks of treatment, and no mortality was observed in the control or 6.25 Φg/kg body weight group. Mortality in the 25 Φg/kg body weight group occurred more than six weeks post-exposure, with 75 percent mortality occurring at the termination of the study, 11 weeks post-exposure. The acute toxicity data for avian species are summarized in Table 3-5.
Table 3-5. Summary of Acute and Short-term Avian Toxicity Values for 2,3,7,8-TCDD
Route
Species
Duration of Exposure/
Observations
Endpoint: Dose
(Φg/kg-day)
Reference
oral
Northern bobwhite quail (Colinus virginianus)
single dose/
37 days
LD50: 15
Hudson et al., 1984
oral
Ringed turtle dove
(Streptopelia risoria)
single dose/
37 days
LD50: >810
Hudson et al., 1984

3-9
oral Mallard (Anas platyrhynchos)
single dose/ 37 days
LD50: >108 Hudson et al., 1984
oral
Domestic chicken
(Gallus domesticus)
single dose/
12 to 21 days
LD100: 25-50
Greig et al., 1973
oral
Domestic chicken (G. domesticus)
(starting at age 3 days)
daily doses for 20 to 21 days/ 20 to 21 days
LOAEL: 1.0
NOAEL: 0.10 (mortality)
Schwetz et al., 1973
i.p.
Ring-necked pheasant hens
(Phasianus colchicus)
single dose/
11 weeks
LD75: 25a
Nosek et al., 1992b
a Seventy-five percent of the test animals in this dose group died; the value is not derived from a statistical analysis of the exposure-response curve. ii. Subchronic and Chronic Toxicity Environmental mixtures of halogenated aromatic hydrocarbons have been implicated in a
number of adverse impacts in the field including reproductive failure in avian species (Gilbertson et al., 1991). In such field studies, the observation of reduced reproduction has been correlated to 2,3,7,8-TCDD equivalents; however, the dose-response relationship specific to 2,3,7,8-TCDD itself cannot be discerned from the effects of other contaminants in the field. Most of the laboratory research directed at the determination of dose-response relationships with TCDD has been based on mammalian species, with very little attention given to chronic or reproductive studies of avian species (see Table 3-6a). More work with avian species involves egg-injection as a means of studying developmental effects (see Table 3-6b).
The research of Nosek et al. (1992a, 1992b, and 1993) represents the only comprehensive laboratory investigation of the subchronic toxicity and toxicokinetics of 2,3,7,8-TCDD among avian species. Nosek et al. (1992b) dosed ring-necked pheasants weekly, intraperitoneally (i.p.), for 10 weeks at a rate equivalent to 0.14, 0.014 and 0.0014 Φg/kg-day. Egg production was significantly reduced among pheasants from the 0.14 Φg/kg-day group, but not in pheasants from the two lowest dose groups when compared to controls. In addition, the 0.14 Φg/kg-day dose was associated with a significant increase in
Table 3-6. Summary of Avian Subchronic, Chronic, and Egg Injection Avian Toxicity Values for 2,3,7,8-TCDD
(a) Subchronic and Chronic Studies
Route
Species
Exposure Duration
LOAEL
(Φg/kg-day)
NOAEL
(Φg/kg-day)
Toxic Effect Observed
Reference i.p.
Pheasant
10 weeks
0.14
0.014
Fertility, Embryo mortality
Nosek et al.,1992b, 1993

3-10
(b) Egg Injection Studies
Species
Injection
Site
Exposure Duration
LOAEC
(pg/g egg)
NOAEC
(pg/g egg)
Toxic Effect
Observed
Reference
yolk
single dose
10,000
1,000
Mortality
Pheasant
albumin
single dose
1,000
100
Mortality
Nosek et al., 1993
Chicken
airspace
single dose
LD50: 240
Mortality
Allred and Strange, 1977
albumin
single dose
---a
450a
Mortality
Chicken
albumin
single dose
9.3
Cardiovasc. malformations
Cheung et al., 1981
airspace
single dose
---b
100b
Chicken
yolk
single dose
---b
100b
Mortality
Henshel et al., 1993
Bluebird
albumin
single dose
LD100: 10,000
LD0: 1,000
Mortality
Martin et al., 1989c
aNo mortality above controls was reported from 0.05 pg/g through 450 pg/g, the highest dose examined. bNo mortality above controls was reported for 10 and 100 pg/g; mortality level not specified at 300 and 1,000 pg/g. cCited in Nosek et al., 1993.
mortality of embryos from the fertilized eggs of those hens. Therefore, the LOAEL determined from this study is 0.14 Φg/kg-day and the corresponding NOAEL is 0.014 Φg/kg-day for the endpoints of fertility and embryo mortality.
A summary of avian in ovo toxicity studies is provided in a U.S. EPA (1993) report entitled Interim Report on Data and Methods for Assessment of 2,3,7,8-Tetrachlorodibenzo-p-dioxin Risks to Aquatic Life and Associated Wildlife, and is included in Table 3-6b. The egg injection studies indicate that the chicken (Gallus) may be more sensitive to 2,3,7,8-TCDD injected into the egg than are the ring-necked pheasant or eastern bluebird (Siala sialis).
The reproductive effect NOAEL for 2,3,7,8-TCDD determined from the Nosek et al. (1992a,
1992b, and 1993) studies is used in calculating the avian wildlife value. The data generated from this study show a clear dose-response with a meaningful endpoint and are based on exposures lasting 70 days. This study is based on i.p. injection rather than oral administration. However, it generally is acknowledged that i.p. and oral routes of exposure are similar because in both instances the chemical is absorbed by the liver, thereby permitting first-pass metabolism. Use of the i.p. dose levels assumes

3-11
that 2,3,7,8-TCDD bioavailability and absorption from the gastrointestinal tract and the abdominal cavity are not significantly different (U.S. EPA, 1993). To the extent that an i.p. exposure results in higher or lower 2,3,7,8-TCDD absorption than that associated with an oral exposure, the hazards to avian wildlife may be over- or under-estimated.
iii. Avian Wildlife Value Calculation As indicated in the previous paragraph, a NOAEL of 0.014 Φg/kg-day, from the pheasant study
by Nosek et al. (1992b), is used to establish the avian wildlife value (WV). There are five values for the three uncertainty factors that need to be considered for use with this NOAEL: interspecies uncertainty factors for extrapolating the NOAEL from the pheasant to the kingfisher, herring gull, and bald eagle (i.e., a UFA for each of the three representative species), a subchronic-to-chronic uncertainty factor (UFS), and a LOAEL-to-NOAEL uncertainty factor (UFL).
In addition to the acute and chronic data summarized above, the results of in ovo (egg injection)
studies were also considered in determining the appropriate values for UFA. It was the consensus of the U.S. EPA (1993) study that gallinaceous birds are among the most sensitive of avian species to 2,3,7,8-TCDD intoxication, and the chicken is sensitive among the gallinaceous birds. Therefore, extrapolation of toxicity data derived from these species to piscivorous wildlife would reasonably not require an uncertainty factor. The UFA for each of the three representative species the UFA was set equal to 1.
In determining the UFS, the results of Nosek et al. (1992a) were consulted. Using tritiated
2,3,7,8-TCDD, Nosek et al. (1992a) found a half-life for whole-body elimination of TCDD in pheasant hens that were not producing eggs of nearly one year. Given that the NOAEL of 0.014 Φg/kg-day resulted from a 10-week exposure, which would have achieved only 13 percent of steady-state accumulation, a truly chronic exposure at an order of magnitude lower concentration in the food could still have elicited the same tissue levels and effects (U.S. EPA, 1993). Therefore, the UFS was set equal to 10.
The UFL is set equal to 1 because the Nosek et al. (1992a) study provided a NOAEL rather than
a LOAEL.
The avian input parameters for the wildlife equation are presented in Table 3-7. The BAFs relate the concentration of 2,3,7,8-TCDD in fish tissue to the concentration of 2,3,7,8-TCDD in the water column. The Biomagnification Factor (BMF) relates the likely concentration of 2,3,7,8-TCDD in herring gulls, which are consumed by bald eagles, to the concentration of 2,3,7,8-TCDD in trophic level 3 fish. Braune and Norstrom (1989) have reported that 2,3,7,8-TCDD bioaccumulates in Lake Ontario herring gulls at a level approximately 30 times higher than that observed in alewife. Values for body weights (Wt), food ingestion rates (F), and drinking rates (W) for kingfisher, herring gull and bald eagle are presented in Table D-2 of the methodology document and shown in Table 3-8.
Table 3-7. Input Parameters for Calculating the Avian Wildlife Value for 2,3,7,8-TCDD
Parameter Category
Notation
Value
Test Dose
TD(avian)
0.014 Φg/kg-day
Interspecies Uncertainty Factor
UFA(kingfisher)
1

3-12
UFA(gull) UFA(eagle)
1 1
Subchronic-to-Chronic Uncertainty Factor
UFS
10
LOAEL-to-NOAEL Uncertainty Factor
UFL
1
Bioaccumulation Factors
BAF3 (trophic level 3) BAF4 (trophic level 4) BAFother (terrestrial)
172,100 Ρ/kg body weight 264,100 Ρ/kg body weight
0 Biomagnification Factor
BMF(TL3 to gulls)
30
Table 3-8. Exposure Parameters for Representative Avian Wildlife Species
Species
Adult Body Weight (Wt)
(kg)
Water (W)
Ingestion Rate (Ρ/day)
Food (F) Ingestion Rate of Prey in
Each Trophic Level (kg/day)a
Belted Kingfisher
0.15
0.017
TL3: 0.0672
Herring Gull
1.1
0.063
TL3: 0.192 TL4: 0.0480 Other: 0.0267
Bald Eagle
4.6
0.16
TL3: 0.371 TL4: 0.0928 PB: 0.0283 Other: 0.0121
a Only two digits are significant, but three digits are used for intermediate calculations. TL3 = trophic level three fish; TL4 = trophic level 4 fish; PB = piscivorous birds (e.g., herring gulls); other = non-aquatic birds and mammals.
Calculations of avian wildlife values are summarized below.
WV(kingfisher) = TD x [1/(UFA(kingfisher) x UFS x UFL)] x Wt(kingfisher)
W(kingfisher) + (F(kingfisher,TL3) x BAF3)
WV(kingfisher)
=
0.014 mg/kg-d x [1/(1 x 10 x 1)] x 0.15 kg
0.017 Ρ/d + (0.0672 kg/d x 172,100 Ρ/kg) WV(kingfisher)
=
0.0182 pg/Ρ
WV(gull) = TD x [1/(UFA(gull) x UFS x UFL)] x Wt(gull)
W(gull) + [(F(gull,TL3) x BAF3) + (F(gull,TL4) x BAF4) + (F(gull,other) x BAFother]

3-13
WV(gull)
=
0.014 mg/kg-d x [1/(1 x 10 x 1)] x 1.1 kg 0.063 Ρ/d + [(0.192 kg/d x 172,100 Ρ/kg) + (0.0480 kg/d x 264,100 Ρ/kg) + (0.0267 kg/d x 0 Ρ/kg)]
WV(gull)
=
0.0337 pg/Ρ
WV(eagle) = TD x [1/(UFA(eagle) x UFS x UFL)] x Wt(eagle) W(eagle) + [(F(eagle,TL3) x BAF3) + (F(eagle,TL4) x BAF4) + (F(eagle, gulls) x BAF3 x FCM(TL3 to gulls)) + (F(eagle,other) x BAFother)]
WV(eagle)
=
0.014 mg/kg-d x [1/(1 x 10 x 1)] x 4.6 kg 0.16 Ρ/d + [(0.371 kg/d x 172,100 Ρ/kg) + (0.0928 kg/d x 264,100 Ρ/kg) + (0.0283 kg/d x 172,100 Ρ/kg x 30) + (0.0121 kg/d x 0 Ρ/kg)]
WV(eagle)
=
0.0275 pg/Ρ
The geometric mean of these three avian wildlife values results in
WV (avian)
=
e([ln WV(kingfisher) + ln WV(gull) + ln WV(eagle)]/3)
WV (avian)
=
e([ln 0.0182 pg/Ρ + ln 0.0337 pg/Ρ + ln 0.0275 pg/Ρ]/3)
WV (avian)
=
0.026 pg/Ρ (two significant digits).
iv. Sensitivity Analysis for Avian Wildlife Value
The values of the various parameters used to derive the avian wildlife value presented above represent the most reasonable assumptions. The purpose of this section is to illustrate the significance of these assumptions and the variability in the avian wildlife value if other assumptions are made for the values of the various parameters from which the avian wildlife value is derived. The intent of this section to let the risk manager know, to the extent possible, the influence on the magnitude of the avian wildlife value of the assumptions made in its derivation.
The lack of chronic toxicity data for avian species other than pheasants results in some
uncertainty associated with the development of the avian wildlife value. Given the limited testing of non-gallinaceous birds, it may not be true that the pheasant and chicken are among the most sensitive avian species to 2,3,7,8-TCDD. Thus, it may be appropriate to use a UFA of 3, instead of 1, for each of the representative species. Using a UFA of 3 for the kingfisher, gull, and bald eagle results in an avian WV of 0.0093 pg/Ρ instead of 0.026 pg/Ρ.

3-14
The diet of the bald eagle is variable; the birds take advantage of whatever prey are easiest to obtain at any given time and location. For purposes of calculating the avian WV, the diet of the bald eagle was assumed to consist of 5.8 percent herring gulls based on the average value for eight pairs studied on Lake Superior (Kozie, 1986). The diets of individual pairs or populations in other areas of the Great Lakes may include a greater or lesser proportion of herring gulls. The proportion of herring gulls in the diet of a pair of bald eagles nesting next to a gull colony was estimated to be 12.5 percent (GLWQI TSD for Wildlife Criteria). A sensitivity analysis was conducted using the dietary composition estimated for this pair of eagles, which was 338 g trophic level 3 fish, 84.5 g trophic level 4 fish, 61.3 g herring gulls, and 6.0 g of non-aquatic birds (see GLWQI TSD for Wildlife Criteria). Keeping all other input parameters the same as indicated in Tables 3-7 and 3-8, the bald eagle WV for 2,3,7,8-TCDD would be 0.0162 pg/Ρ, instead of 0.0275 pg/Ρ, and the avian WV would be equal to 0.023 pg/Ρ instead of 0.026 pg/Ρ. On the other hand, if bald eagles ate only fish, they would require 527 grams daily (GLWQI TSD for Wildlife Criteria), of which about 422 grams would be trophic level 3 fish and 105 grams would be trophic level 4 fish. This dietary composition would result in a bald eagle WV of 0.0642 pg/Ρ, and the avian WV would be 0.034 pg/Ρ instead of 0.026 pg/Ρ.
IV. Great Lakes Wildlife Criterion The Great Lakes Wildlife Criterion for 2,3,7,8-TCDD is determined by the lower of the
mammalian wildlife value (0.0031 pg/Ρ) and the avian wildlife value (0.026 pg/Ρ). The mammalian wildlife value was determined to be approximately one order of magnitude smaller than the avian wildlife value. Therefore, the Great Lakes Wildlife Criterion for 2,3,7,8-TCDD is 0.0031 pg/Ρ.
i. Discussion of Uncertainties Wildlife populations inhabiting the Great Lakes Basin would not be impacted from the intake of
drinking water or aquatic prey taken from surface water containing 2,3,7,8-TCDD in concentrations of 0.0031 pg/Ρ, based on the uncertainty factors used to account for data gaps and the variability in the toxicity and exposure parameters inherent in the 2,3,7,8-TCDD risk assessment. Criteria for other ecoregions may require an analysis of different wildlife species with different diets and body masses. In addition, the bioaccumulation factors in this analysis were based on an analysis for the Great Lakes, and different bioaccumulation factors may be more appropriate for other waterbodies.
Finally, generic assumptions were made in assessing the hazards of 2,3,7,8-TCDD to wildlife
populations through the use of LOAELs and NOAELs for reproduction and development. The use of these levels assumes no hazards to wildlife populations would result from the direct exposure of individuals to 2,3,7,8-TCDD. However, it could be argued that some increase in density independent mortality, or decrease in density independent reproductive success, which could be attributable to 2,3,7,8-TCDD exposure could be incurred without impacting the population dynamics of a species. In general, well-validated population models do not yet exist for the species analyzed, and it is difficult to estimate the extent of mortality or reproductive failure that could be incurred. In addition, the interaction of additional chemical as well as non-chemical stressors on wildlife population responses is also poorly resolved at this time.
V. References

3-15
Allen, J.R., D.A. Barsotti, L.K. Lambrecht, and J.P. Van Miller. 1979. Reproductive effects of halogenated aromatic hydrocarbons on nonhuman primates. Ann. NY Acad. Sci. 320:419-425.
Allred, P.M. and J.R. Strange. 1977. The effects of 2,4,5-trichlorophenoxyacetic acid and 2,3,7,8-tetrachlorodibenzo-p-dioxin on developing chick embryos. Arch. Environ. Contam. Toxicol. 5:483-489.
Aulerich, R.J., S.J. Bursian, and A.C. Napolitano. 1988. Biological effects of epidermal growth factor and 2,3,7,8-tetrachlorodibenzo-p-dioxin on developmental parameters of neonatal mink. Arch. Environ. Contam. Toxicol. 17:27-31.
Bowman, R.E., S.L. Schantz, M.L. Gross, and S. Ferguson. 1989a. Behavioral effects in monkeys exposed to 2,3,7,8-tetrachlorodibenzo-p-dioxin transmitted maternally during gestation and for four months of nursing. Chemosphere 18:235-242.
Bowman, R.E., S.L. Schantz, N.C.A. Weerasinghe, M.L. Gross, and D.A. Barsotti. 1989b. Chronic dietary intake of 2,3,7,8-tetrachlorodibenzo-p-dioxin (TCDD) at 5 and 25 parts per trillion in the monkey: TCDD kinetics and dose-effect estimate of reproductive toxicity. Chemosphere 18:243-252.
Braune, B. M. and R. J. Norstrom. 1989. Dynamics of organochlorine compounds in herring gulls: III. Tissue distribution and bioaccumulation in Lake Ontario gulls. Environ. Toxicol. Chem. 8:957-968.
Chapman, D.E. and C.M. Schiller. 1985. Dose-related effects of 2,3,7,8-tetrachlorodibenzo-p-dioxin (TCDD) in C57BL/6J and DBA/2J mice. Toxicol. Appl. Pharmacol. 78:147-157.
Cheung, M.O., E.F. Gilbert, and R.E. Peterson. 1981. Cardiovascular teratogenicity of 2,3,7,8-tetrachlorodibenzo-p-dioxin in the chick embryo. Toxicol. Appl. Pharmacol. 61:197-204.
Eisler, R. 1986. Dioxin Hazards to Fish, Wildlife and Invertebrates: A Synoptic Review. U.S. Fish Wild. Serv. Biol. Rep. No. 85(1.8); 37 pp.
Gilbertson, M., T. Kubiak, J. Ludwig, and G. Fox. 1991. Great Lakes embryo mortality, edema, and deformaties syndrome (GLEMEDS) in colonial fish-eating birds: similarity to chick edema disease. J. Toxicol. Environ. Health 33:455-520.
Greig, J.B., G. Jones, W. H. Butler, and J.M. Barnes. 1973. Toxic effects of 2,3,7,8-tetrachlorodibenzo-p-dioxin. Fd. Cosmet. Toxicol. 11:585-595.
Henshel, D.S., B.M. Hehn, H.T. Vo, and J.D. Steeves. 1993. A short-term test for dioxin teratogenicity using chicken embryos. In: J.W. Gorsuch, F.J. Dwyer, C.G. Ingersoll, and T.W. La Point, eds., Environmental Toxicology and Risk Assessment. American Society for Testing and Materials, Philadelphia, PA.
Hochstein, J.R., R.J. Aulerich, and S.J. Bursian. 1988. Acute toxicity of 2,3,7,8-tetrachlorodibenzo-p-dioxin in mink. Arch. Environ. Contam. Toxicol. 17:33-37.
Hudson, R.H., R.K. Tucker, and M.A. Haegele. 1984. Handbook of Toxicity of Pesticides to Wildlife. U.S. Fish Wildl. Serv. Resour. Publ. No, 153; 90 pp.
Khera, K.S. and J.A. Ruddick. 1973. Polychlorodibenzo-p-dioxins: Perinatal effects and the dominant lethal test in Wistar rats. In: E.H. Blair, ed., Chlorodioxins - Origin and Fate. Advances in Chemistry Series 120. Amer. Chem. Soc., Washington, DC.
Kimmel, G. L. 1988. Appendix C: Reproductive and developmental toxicity of 2,3,7,8-TCDD. In: A Cancer Risk-Specific Dose Estimate for 2,3,7,8-TCDD. Review draft. EPA/600/6-88/007Aa.

3-16
Kociba, R.J., D.G. Keyes, J.E. Beyer, R.M. Carreon, C.E. Wade, D.A. Dittenber, R.P. Kalnins, L.E. Frauson, C.N. Park, S.D. Barnard, R.A. Hummel, and C.G. Humiston. 1978. Results of a two-year chronic toxicity and oncogenicity study of 2,3,7,8-tetrachlorodibenzo-p-dioxin in rats. Toxicol. Appl. Pharmacol. 46:279-303.
Kociba R.J. and B.A. Schwetz. 1982. Toxicity of 2,3,7,8-tetrachlorobenzo-p-dioxin (TCDD). Drug Metab. Rev. 13:387-406.8
Martin, S., J. Duncan, D. Thiel, R. Peterson, and M. Lemke. 1989. Evaluation of the effects of dioxin-contaminated sludges on eastern bluebirds and tree swallows. Report prepared for Nekoosa Papers, Inc., Port Edwards, WI.
Murray, F.J., F.A. Smith, K.D. Nitschke, C.G. Huniston, R.J. Kociba and B.A. Schwetz. 1979. Three-generation reproduction study of rats given 2,3,7,8-tetrachlorodobenzo-p-dioxin (TCDD) in the diet. Toxicol. Appl. Pharmacol. 50:241-252.
Nisbet, I.C.T. and M.B. Paxton. 1982. Statistical aspects of three-generation studies of the reproductive toxicity of TCDD and 2,4,5-7. Am. Statistic. 36(3):290-298.
Nosek, J.A., J.R. Sullivan, S.S. Hurley, J.R. Olson, S.R. Craven, and R.E. Peterson. 1992a. Metabolism and disposition of 2,3,7,8-tetrachlorodibenzo-p-dioxin in ring-necked pheasant hens, chicks, and eggs. J. Toxicol. Environ. Health 35:153-164.
Nosek, J.A., J.R. Sullivan, S.S. Hurley, S.R. Craven, and R.E. Peterson. 1992b. Toxicity and reproductive effects of 2,3,7,8-tetrachlorodibenzo-p-dioxin toxicity in ring-necked pheasant hens. J. Toxicol. Environ. Health 35:187-198.
Nosek, J.A., J.R. Sullivan, T.E. Amundson, S.R. Craven, L.M. Miller, A.G. Fitzpatrick, M.E. Cook, and R.E. Peterson. 1993. Embryotoxicity of 2,3,7,8-tetrachlorodibenzo-p-dioxin in the ring-necked pheasants. Environ. Toxicol. Chem. 12:1215-1222.
Schwetz, B.A., J.M. Norris, G.L. Sparschu, V.K. Rowe, P.J. Gehring, J.L. Emerson, and C.G. Gerbig. 1973. Toxicology of chlorinated dobenzo-p-dioxins. Environ. Health Perspect. 5:87-99.
Seefeld, M.D., S.W. Corbett, R.E. Keesey and R.E. Peterson. 1984. Characterization of the wasting syndrome in rats treated with 2,3,7,8-tetrachlorodibenzo-p-dioxin. Toxicol. Appl. Pharmacol. 73:311-322.
Seefeld, M.D. and R.E. Peterson. 1983. 2,3,7,8-Tetrachlorodibenzo-p-dioxin-induced weight loss, pp 405-413 in Tucker, R.E. et al., eds. Human and Environmental Risks of Chlorinated Dioxins and Related Compounds. Plenum, New York.
U.S. Environmental Protection Agency. 1988. Recommendations for, and Documentation of Biological Values for Use in Risk Assessment. Office of Research and Development, Cincinnati, OH. NTIS-PB88-179874.
U.S. Environmental Protection Agency. 1993. Interim report on data and methods for assessment of 2,3,7,8-tetrachlorodibenzo-p-dioxin risks to aquatic life and associated wildlife. Office of Research and Development, Washington, DC. EPA/600/R-93/055.
U.S. Environmental Protection Agency (EPA). 1995. Trophic Level and Exposure Analyses for Selected Piscivorous Birds and Mammals. Volumes I and III. Office of Water, Washington, DC.


CHAPTER 3 Tier I Wildlife Criteria for 2,3,7,8-Tetrachlorodibenzo-p-dioxin (2,3,7,8-TCDD) Contents I. Literature Review.............................................................................................................................. 3-1
I. Calculation of Mammalian Wildlife Value ....................................................................................... 3-1
i. Acute and Short-term Toxicity .................................................................................................. 3-1
ii. Subchronic and Chronic Toxicity .............................................................................................. 3-2
iii. Mammalian Wildlife Value Calculation .................................................................................... 3-5
iv. Sensitivity Analysis for Mammalian Wildlife Value................................................................. 3-7
III. Calculation of Avian Wildlife Value ................................................................................................ 3-8
i. Acute and Short-term Toxicity .................................................................................................. 3-8
ii. Subchronic and Chronic Toxicity .............................................................................................. 3-9
iii. Avian Wildlife Value Calculation............................................................................................ 3-11
iv. Sensitivity Analysis for Avian Wildlife Value ........................................................................ 3-13
IV. Great Lakes Wildlife Criterion........................................................................................................ 3-14
i. Discussion of Uncertainties ..................................................................................................... 3-14
V. References ....................................................................................................................................... 3-15

4-1
Tier I Wildlife Criteria for Polychlorinated Biphenyls (PCBs) I. Literature Review
A review of mammalian and avian toxicity data for polychlorinated biphenyls was based on literature received through computer-based (CAS and BIOSIS) as well as manual searches. A total of 41 references were screened; those references which were reviewed in detail are cited in Section V and primarily include those that contain dose-response data.
II. Calculation of Mammalian Wildlife Value i. Acute and Short-term Toxicity
Three primary effects of PCB exposure on mammals are mortality, decreased reproductive success, and behavioral modifications. Mink appear to be among the more sensitive of the mammalian species to the toxic effects of PCBs (Gillette et al., 1987). Single oral doses of PCBs administered to mink have produced LD50 values of 750 mg/kg body weight for Aroclor 1221 and 4,000 mg/kg body weight for Aroclor 1254 (Aulerich and Ringer, 1977; Ringer, 1983). Diets containing PCBs at 6.7 ppm (Aroclor 1254) to 8.6 ppm (Aroclor 1242) have caused 50 percent mortality among mink over a 9-month period (Ringer, 1983). The reasons for mink sensitivity to PCBs are unknown, but interspecific variability in sensitivity to PCBs is common, even among closely-related species. For example, Aroclor 1242 has been demonstrated to be less acutely toxic to European ferrets (LC50> 20 ppm) than to mink (LC50 = 8.6 ppm) (Eisler, 1986). Age, dietary composition, season, and year have had little effect on the outcome of the acute toxicity tests. The LC50 values for mink fed Aroclor 1254 mixed directly with their food were 79 ppm Aroclor 1254 for a 28-day exposure and 49 ppm Aroclor 1254 for a 35-day exposure (Aulerich et al., 1986). When the Aroclor 1254 was instead fed to rabbits, and the rabbits containing the metabolized PCBs fed to mink, the LC50 values were lower, 47 ppm total PCBs for the 28-day exposure and 32 ppm total PCBs for the 35-day exposure. In a longer-term study, high daily intake of PCBs (Clophen A-60, equivalent to Aroclor 1060) fed to female mink for 51 days caused 100 percent mortality at 6.1 mg/day and 40 percent mortality at 2.0 mg/day (den Boer, 1984). Assuming a female body weight of 1 kg (Hornshaw et al., 1983), these doses are 6.1 mg/kg-day and 2.0 mg/kg-day, respectively. Table 4-1 provides a summary of values of acute mammalian toxicity to specific PCB mixtures.

4-2
Table 4-1. Mammalian Acute and Short-term Toxicity Values for PCB Mixtures
Mixture
Route
Species
Exposure Duration
LD50 or LC50a
Reference
oral
rat
single dose
1,000 - 4,000 mg/kg
U.S. EPA, 1980a; NAS, 1979
oral
mink (Mustela vison)
single dose
750 - 1,000 mg/kg
Aulerich and Ringer, 1977;
Ringer 1983
dermal
rabbit
single dose
4,000 mg/kg
U.S. EPA, 1980a
1221
i.p.
mink (M. vison)
single dose
500 - 750 mg/kg
Aulerich and Ringer, 1977
oral
rat
single dose
800 - 1,300 mg/kg
U.S. EPA, 1980a;
NAS, 1979
oral
mink (M. vison)
single dose
3,000 mg/kg Aulerich and Ringer, 1977;
Ringer 1983
dermal
rabbit
single dose
8,700 mg/kg
U.S. EPA, 1980a
1242
i.p.
mink (M. vison)
single dose
1,000 mg/kg
Aulerich and Ringer, 1977
metabolized PCBs in diet
mink (M. vison)
28 days 35 days
47 ppm 32 ppm
Aulerich et al., 1986
Aroclor 1254
in diet
mink (M. vison)
28 days 35 days
79 ppm 49 ppm
Aulerich et al., 1986
diet
mouse (Peromyscus
leucopus)
3 weeks
> 100 ppm
Sanders and Kirkpatrick,
1977
oral
raccoon (Procyon lotor)
8 days
> 50 mg/kg-d
Montz et al., 1982
diet
rabbit (Sylvilagus floridanus)
12 weeks
> 10 ppm
Zepp and Kirkpatrick, 1976
oral
rat
single dose
841 mg/kg
Hudson et al., 1984
oral
mink (M. vison)
single dose
4,000 mg/kg
Aulerich and Ringer, 1977;
Ringer 1983
1254
i.p.
mink (M. vison)
single dose
1,250 - 2,250 mg/kg
Aulerich and Ringer, 1977
oral
rat
single dose
1,300 - 10,000 mg/kg
U.S. EPA, 1980a;
NAS, 1979
1260
dermal
rabbit
single dose
10,000 mg/kg
U.S. EPA, 1980a
1060
diet
mink (M. vison)
51 days
>2, <6 mg/kg-day
den Boer, 1984
aUnits for oral, dermal, and i.p. (intraperitoneal) routes of exposure expressed as dose in mg/kg body weight (single dose). Units for most dietary exposures expressed in ppm, i.e., mg/kg of diet.

4-3
ii. Subchronic and Chronic Toxicity
Linzey (1988) evaluated reproductive success and growth among white-footed mice (Peromyscus leucopus) chronically exposed to Aroclor 1254 in the diet at a level of 10 ppm. PCB-treated second generation mice exhibited reduced reproductive success compared with second generation controls and compared with the parental generation. This was evidenced by reduced number of litters and reduced survival among the young of the second generation treated group. Poor growth among the second generation PCB-treated litter also was observed, with increasing differences in body weights becoming apparent over time when compared to controls. Using a mouse food ingestion rate of 0.17 kg food/kg body weight per day (U.S. EPA, 1988; see GLWQI TSD for Wildlife Criteria), the dietary PCB exposure associated with reproductive effects in white-footed mice was calculated to be 1.7 mg/kg-day.
Numerous studies (Ringer et al., 1972; Platonow and Karstad, 1973; Jensen et al. 1977;
Aulerich and Ringer, 1977; U.S. EPA, 1980b; Bleavins et al. 1980) have demonstrated that mink are among the most sensitive of the tested mammalian species to the toxic effects of PCBs, with some PCB mixtures being more toxic than others. The primary chronic effect that has been documented as a result of dietary exposure to PCBs has been decreased reproductive success, as evidenced by reduced whelping rates, fetal death, and reduced growth among the young.
Bleavins et al. (1980) investigated the effects of dietary exposure for up to 247 days to Aroclors
1016 and 1242 on mink and ferrets. Mink were fed a diet supplemented with either 0, 5, 10, 20, or 40 ppm Aroclor 1242 or 20 ppm Aroclor 1016. The ferrets were fed a diet supplemented with either 0, or 20 ppm Aroclor 1242 or 20 ppm Aroclor 1016. Aroclor 1242 produced 100 percent mortality in all adult mink fed diets at the 20 ppm and 40 ppm levels and 66 percent mortality in all adult mink at the 10 ppm exposure level. Mortality of adult mink exposed to 5 ppm Aroclor 1242 in the diet was no different from control-level mortality. No mortality was noted among mink fed diets containing 20 ppm Aroclor 1016. Mink fed Aroclor 1242 at 5 ppm and higher levels failed to reproduce, while Aroclor 1016 reduced but did not completely eliminate reproduction. In contrast to these results, no mortality attributed to the PCBs was observed among the ferrets. Ferrets fed the Aroclor 1242 at 20 ppm in the diet did not whelp, but reproductive performance (i.e., number of kits born per female, growth rate of kits) among the female ferrets fed Aroclor 1016 was not significantly different from that of the control females. Using a captive ranch mink body weight of 1 kg and food consumption rate of 0.15 kg/day, provided in the Great Lakes Water Quality Initiative (GLWQI) Technical Support Document (TSD) for Wildlife Criteria, the results from this study suggest a mink reproductive LOAEL of 0.75 mg/kg-day (5 ppm in the diet) for Aroclor 1242 and 3.0 mg/kg-day (20 ppm) for Aroclor 1016. The body weights and food consumption rates of ferrets are virtually identical to mink (Ringer et al., 1981). Using a ferret body weight of 1 kg and a food consumption rate of 0.15 kg/day, the LOAEL for reproductive effects for Aroclor 1242 and the NOAEL for reproductive effects for Aroclor 1016 are 3.0 mg/kg-day.
According to Platonow and Karstad (1973) and Hornshaw et al. (1983), reproductive
impairment occurs in mink at even lower concentrations when the PCBs fed to the mink have first been metabolized by another species. Platonow and Karstad (1973) orally dosed Aroclor 1254 to Jersey cows, and fed the resulting contaminated beef to mink over 160 days at 0.64 and 3.57 ppm total PCBs in the beef. At a dietary concentration of 3.57 ppm total PCBs, no live kits were produced and all adult mink died before the end of the experiment. At 0.64 ppm total PCBs in the diet, 2 of 14 adult mink died before the end of the experiment and only 1 of 12 female mink produced kits. All 3 of the kits died during the first day after birth. Based on these findings the LOAEL for successful reproduction was 0.64 ppm. Based on the mink body weight and food consumption rate presented above, the LOAEL was calculated as 0.096 mg/kg-day for reproductive effects of total PCBs.
Hornshaw et al. (1983) fed Great Lakes fish or fish products to mink for up to 290 days. The
experiments began when the mink were young (about 75 percent of adult body weight) and continued

4-4
through the first reproductive cycle and attainment of adult body weight. Dietary concentrations of PCB residues were determined to range from 0.21 to 1.50 ppm as Aroclor 1254. Only mink fed PCBs at concentrations of 0.21 ppm had reproduction and kit survival similar to the controls. Mink fed a diet containing 0.48 ppm of PCB residues had inferior reproductive performance and/or kit survival when compared to controls. These findings suggest a NOAEL of 0.21 ppm and a LOAEL of 0.48 ppm. Using a female mink body weight of 0.85 kg (average female body weight over the course of the experiment from data reported by Hornshaw et al., 1983) and a food ingestion rate of 0.15 kg/kg-day (equivalent to the food ingestion rate of 0.15 kg for a 1 kg mink presented above), the NOAEL was calculated to be 0.032 mg/kg-day, and the LOAEL was 0.072 mg/kg-day for reproductive performance and kit survival. Hornshaw et al. (1983) observed that the toxicity of PCBs was greater when derived from Great Lakes fish than in previous studies using comparable levels of technical grade PCBs. However, concentrations of other toxicants potentially present in the Great Lakes fish were not measured.
Fetotoxicity and reproductive failure also have been reported for mink following direct dietary
exposure to low levels of certain PCB mixtures. Wren et al. (1987) fed adult ranch-bred mink diets containing either 0 or 1.0 ppm Aroclor 1254, 1.0 ppm methylmercury, a combination of 1.0 ppm Aroclor 1254 and 1.0 ppm methylmercury, or a combination of 0.5 ppm Aroclor 1254 and 0.5 ppm methylmercury for 186 days. Fertility of adult male mink, percentage of females whelped, or number of kits born per female were not affected by the treatments, but the growth rate of the kits nursed by the mothers exposed to 1.0 ppm Aroclor 1254 (0.15 mg/kg-day) was significantly reduced.
In a subchronic study Jensen et al. (1977) dosed mink with PCBs (Aroclor mixtures not
reported) in the feed at concentrations of 0.05, 3.3, and 11 ppm for 66 days. For comparison with another study, the diet of the 3.3 ppm group also included 3.3 ppm DDT. Complete reproductive failure was observed among the 11 ppm (PCB only) group, with reduced number of implantation sites and no kits born. The frequencies of mated and pregnant females did not differ significantly between the 0.05 ppm group (control) and the 3.3 ppm PCB/DDT group. At 3.3 ppm PCB/DDT, however, the frequency of delivering females was reduced, the number of kits born per female smaller, the number of stillbirths greater, and the average body weight of the young smaller than in the control group. The 3.3 ppm PCB/DDT cannot be used to evaluate PCB toxicity, however, because of the possible contribution of the 3.3 ppm DDT to the observed effects at this level. Thus, this study identifies a LOAEL of 11 ppm PCBs for reproductive effects in mink. Using the mink body weight and ingestion rates presented previously, the LOAEL for reproductive effects in mink exposed to PCBs alone is calculated as 1.7 mg/kg-day.
Aulerich and Ringer (1977) exposed mink to dietary Aroclor 1254 at 0, 5, and 10 ppm over a 9-
month period. All of the mink fed PCB-supplemented diets failed to produce offspring. In a subsequent experiment, mink were provided diets containing 2 ppm Aroclor 1016, 1221, 1242, or 1254, and monitored over 297 days. Aroclor 1254 was the only PCB mixture that had an adverse effect on reproduction. Two of the seven females whelped and one live, underweight kit was produced. Based on these studies, a LOAEL for reproductive success of 2 ppm Aroclor 1254 can be inferred. Using the mink body weight and food consumption rates presented above, a LOAEL was calculated to be 0.3 mg/kg-day for reproductive effects of Aroclor 1254.
Aulerich and Ringer (U.S. EPA, 1980b) investigated the effects of Aroclor 1016 on
reproduction, growth, and survival of mink. In two series of experiments, mink were fed diets that contained 0, 2, 10, and 25 ppm Aroclor 1016 for up to 18 months. Reproduction was not adversely affected, but reduced 4-week weights were observed among kits nursed by females fed the 25 ppm PCB supplemented diet, and excessive kit mortality between birth and 4 weeks was noted among most of the groups provided with PCB supplemented diets, starting at the exposure level of 2 ppm. (Kits from one of the two groups of females exposed to 10 ppm Aroclor 1016 exhibited control-level mortality, so a reasonable dose-response curve for kit mortality occurred in only one of the two experimental series.) The authors attributed these adverse effects to quantitative or qualitative impacts

4-5
of PCBs on lactation. From these results, a LOAEL of 2 ppm for kit survival can be inferred. Using the mink body weight and feeding rate presented above, this LOAEL is equivalent to 0.3 mg/kg-day.
Aulerich et al. (1985) fed Aroclor 1254 and three hexachlorobiphenyl mixtures (2,4,5,2',4',5'-
[245 HCB]; 2,3,6,2',3',6'- [236 HCB]; and 3,4,5,3',4',5'- [345 HCB]) to adult female mink for 14.5 weeks at concentrations ranging from 0.1 ppm to 5.0 ppm in the diet (each mixture was not given at each dose level). Concentrations of 5 and 2.5 ppm of 245 HCB or 236 HCB had no significant effect on the number of females that whelped or the litter size per female whelped. Only 1 out of 10 females whelped and no live kits were produced at 2.5 ppm Aroclor 1254 in the diet. At 0.5 ppm 345 HCB in the diet, all animals died after 29 to 72 days exposure. At 0.1 ppm 345 HCB in the diet, 50 percent mortality was observed before the end of the experiment and none of the 8 females whelped. Based on the results of Aulerich et al. (1985), a LOAEL for survival and for reproductive effects of 0.1 ppm 345 HCB can be inferred. Using the body weight and food ingestion rate provided above, this LOAEL is equivalent to 0.015 mg/kg-day for survival and reproductive effects of 345 HCB. The LOAEL from this study for reproductive effects of Aroclor 1254 is 2.5 ppm, equivalent to 0.38 mg/kg-day.
Den Boer (1984) investigated reproductive effects of dietary exposure of mink to PCBs
originating from fish livers and Clophen A-60 (equivalent to Aroclor 1260) during 400 days. The mink were maintained on feed contaminated with total PCBs at levels equivalent to 0.025 mg/kg-day. No mortality was observed among the dosed groups; however, a significant reduction in females whelping was observed among the exposed mink.
The various toxicity values derived from the studies discussed above are summarized in Table
4-2. An evaluation of these studies suggests that the LOAEL of 0.3 mg/kg-day for reproductive effects of Aroclor 1254, from the study of Aulerich and Ringer (1977), is the most appropriate daily dose rate to use in calculating a mammalian wildlife value for total PCBs. The LOAEL values for mink developed for HCBs in the Aulerich et al. (1985) study are lower than the LOAEL for Aroclor 1254; however, they cannot be used for criteria development because of a lack of dose-response data. Furthermore, use of the LOAEL for 3,4,5-HCB would be based on the unreasonable assumption that all PCBs discharged into the environment are equivalent to this congener, or that all the discharged PCBs would be totally converted to 3,4,5-HCB. The LOAELs derived using metabolized PCBs (Platonow and
Table 4-2. Summary of Subchronic and Chronic Mammalian Studies of PCB Toxicity
Species
Exposure Duration
LOAEL
(mg/kg-day)
NOAEL
(mg/kg-day) PCB Mixture
Toxic Effect
Observed
Reference
Mouse
2 generations
1.7 Aroclor-1254 Reproductive
Linzey, 1988
247 days
0.75 Aroclor-1242
Mink
247 days
3.0 Aroclor-1016
Reproductive
Bleavins et al., 1980
247 days
3.0 Aroclor-1242
Ferret
247 days
3.0 Aroclor-1016
Reproductive
Bleavins et al., 1980
Mink
160 days
0.096
Metabolizeda Aroclor-1254
Reproductive
Platonow and Karstad, 1973
Mink
290 days
0.072
0.032
Metabolizedb total PCBs
Reproductive/ Kit survival
Hornshaw et al., 1983
Mink
66 days
< 1.7
Unreported PCBs
Reproductive
Jensen et al., 1977
Mink
186 days
0.15
Aroclor-1254
Kit growth
Wren et al., 1987

4-6
297 days
0.3 Aroclor 1254
297 days
0.3 Aroclor-1016
297 days
0.3 Aroclor-1021
Mink
297 days
0.3 Aroclor-1242
Reproductive
Aulerich and Ringer, 1977
Mink
18 months
0.3 Aroclor-1016 Kit growth
US EPA, 1980b
14.5 weeks
0.38 Aroclor-1254
14.5 weeks
0.38 245 HCB
14.5 weeks
0.38 236 HCB
Mink
14.5 weeks
0.015 345 HCB
Reproductive
Aulerich et al., 1985
Mink
400 days
0.025 Clophen A-60 Reproductive
den Boer, 1984
aAroclor 1254 was fed to cattle, and the resulting PCB-contaminated beef was fed to the mink. bFish taken from PCB-contaminated waters were fed to the mink.
Karstad, 1973; Hornshaw et al., 1983) are not appropriate for criteria development, in part because possible contamination of feed by other contaminants was not investigated.
The LOAEL of 0.025 mg/kg-day for reproductive effects identified in the study of den Boer
(1984) appears unusually low, which may be a result of the highly chlorinated PCB mixture or greater sensitivity of European compared to North American mink. Moreover, Hornshaw et al. (1983) identified a NOAEL of 0.032 mg/kg-day for mink exposed to fish that might be contaminated with other toxic substances, indicating that the NOAEL for PCBs alone must be at least 0.032 mg/kg-day, possibly higher. Therefore, overall the results of Aulerich and Ringer (1977) were considered to provide a more solid basis for causality.
iii. Mammalian Wildlife Value Calculation
As indicated in the previous paragraph, a LOAEL of 0.3 mg/kg-day, from the 297-day mink study by Aulerich and Ringer (1977), is used to establish the mammalian wildlife value (WV). There are three uncertainty factors that need to be considered for use with this LOAEL, an interspecies uncertainty factor for extrapolating the LOAEL from mink to otter (UFA(otter)), a subchronic-to-chronic uncertainty factor (UFS), and a LOAEL-to-NOAEL uncertainty factor (UFL).
Numerous studies (Ringer et al., 1972; Platonow and Karstad, 1973; Jensen et al. 1977;
Aulerich and Ringer, 1977; U.S. EPA, 1980b; Bleavins et al., 1980) have demonstrated that mink are among the most sensitive mammalian species to the toxic effects of PCBs. In calculating a WV for mink and river otter, the UFA(mink) equals 1 because mink were tested. Otter are closely related to mink (in the same family, Mustelidae), and there is no evidence to indicate they differ in sensitivity to PCBs. Thus, the UFA(otter) also equals 1.
The LOAEL derived from Aulerich and Ringer (1977) of 0.3 mg/kg-day was based on a 297-
day feeding study. The UFS was set to 1, however, because 297 days is of sufficient duration to elicit reproductive effects in mink.
A UFL greater than 1 is needed because the study of Aulerich and Ringer (1977) established a
LOAEL, but not a NOAEL, for reproduction in mink exposed to PCBs. Because the LOAEL was associated with a high response level (i.e., only 2 of 7 females whelped and only 1 live underweight kit was produced), the full value of 10 is used for the UFL. Selection of a UFL of 10 implies a NOAEL for the Aulerich and Ringer (1977) study of 0.03 mg/kg-day, which is essentially the same NOAEL identified by Hornshaw et al. (1983).

4-7
Input parameters for the wildlife equation are presented in Table 4-3. Body weights (Wt), ingestion rates (F), and drinking rates (W) for free-living mink and river otter are presented in Table D-2 of the method document (Appendix D to 40 CFR 132) and shown in Table 4-4. The bioaccumulation factors (BAFs) relate the concentration of PCBs in fish tissue to the concentration of PCBs in the water column. The BAFs for trophic levels 3 and 4 are derived based on the procedure specified in Appendix B to 40 CFR 132, Great Lakes Water Quality Initiative Methodology for Deriving Bioaccumulation Factors.
Table 4-3. Input Parameters for Calculating the Mammalian Wildlife Value for PCBs
Parameter Category
Notation
Value
Test Dose
TD(mammalian)
0.30 mg/kg-day
Interspecies Uncertainty Factor
UFA(mink) UFA(otter)
1 1
Subchronic-to-Chronic Uncertainty Factor
UFS
1
LOAEL-to-NOAEL Uncertainty Factor
UFL
10
Bioaccumulation Factors
BAF3 (trophic level 3) BAF4 (trophic level 4) BAF(other) (terrestrial)
1,850,000 Ρ/kg body weight 6,224,000 Ρ/kg body weight
0 Table 4-4. Exposure Parameters for Representative Mammalian Wildlife Species
Species
Adult Body Weight (Wt)
(kg)
Water (W)
Ingestion Rate (Ρ/day)
Food (F) Ingestion Rate of Prey in
Each Trophic Level (kg/day)a
Mink
0.80
0.081
TL3: 0.159 Other: 0.0177
Otter
7.4
0.60
TL3: 0.976 TL4: 0.244
a Only two digits are significant, but three digits are used for intermediate calculations.
The equations and calculations of mammalian wildlife values are presented below. WV(mink) = TD x [1/(UFA(mink) x UFS x UFL)] x Wt(mink)
W(mink) + [(F(mink,TL3) x BAF3) + (F(mink,other) x BAF(other))]
WV(mink)
=
0.30 mg/kg-d x [1/(1 x 1 x 10)] x 0.80 kg 0.081 Ρ/d + [(0.159 kg/d x 1,850,000 Ρ/kg) + (0.0177 kg/d x 0 Ρ/kg)]
WV(mink)
=
81.6 pg/Ρ
WV(otter) = TD x [1/(UFA(otter) x UFS x UFL)] x Wt(otter)
W(otter) + ((F(otter,TL3) x BAF3) + (FA(otter, TL4) x BAF4)]

4-8
WV(otter)
=
0.30 mg/kg-d x [1/(1 x 1 x 10)] x 7.4 kg 0.60 Ρ/d + [(0.976 kg/d x 1,850,000 Ρ/kg) + (0.244 kg/d x 6,224,000Ρ/kg)]
WV(otter)
=
66.7 pg/Ρ
The geometric mean of these two mammalian wildlife values results in
WV (mammalian)
=
e([ln WV(mink) + ln WV(otter)]/2)
WV (mammalian)
=
e([ln 81.6 pg/Ρ + ln 66.7 pg/Ρ]/2)
WV (mammalian)
=
74 pg/Ρ (two significant digits)
iv. Sensitivity Analysis for Mammalian Wildlife Value
The values of the various parameters used to derive the mammalian WV presented above represent the most reasonable assumptions. The purpose of this section is to illustrate the significance of these assumptions and the variability in the mammalian WV if other assumptions are made for the values of the various parameters from which the mammalian wildlife value is derived. The intent of this section is to let the risk manager know, to the extent possible, the influence on the magnitude of the mammalian WV of the assumptions made in its derivation.
In deriving the PCB mammalian WV, it was assumed that 90 percent of the mink diet was
comprised of fish and ten percent of the diet came from strictly terrestrial food chains. This assumption may lead to an overestimate of PCB exposure for mink that are not primarily foraging for fish and aquatic invertebrates. As indicated in the GLWQI TSD for Wildlife Criteria, the proportion of a mink diet that comes from strictly terrestrial sources can vary from almost none to one third of their diet. Furthermore, not all of the prey that mink take from aquatic sources are fish; mink may consume large quantities of crayfish where they are available, and depending on the location and season, up to 50 percent of the diet of mink can be comprised of waterfowl, muskrat, amphibians, and other air-breathing animals that feed from aquatic food chains. In 21 dietary studies of mink summarized in Volumes I and III of Trophic Level and Exposure Analyses for Selected Piscivorous Birds and Mammals (U.S. EPA, 1995), the proportion of a mink diet comprised of fish varies from less than 10 percent to the 90 percent assumed in the mink WV derivation presented above. If it were assumed only 50 percent of a mink's diet was from fish and the remaining 50 percent of the diet was uncontaminated, the estimated PCB exposure for the mink would be reduced by a factor of 1.8. The resulting WV for the mink would be 147 pg/Ρ, and the mammalian WV would be 99 pg/Ρ, rather than the mammalian WV of 74 pg/Ρ.
III. Calculation of Avian Wildlife Value i. Acute and Short-term Toxicity
Birds have been shown to be more resistant than mammalian species to the acute toxic effects of PCBs. Exposure to PCBs has caused some mortality among all the avian species tested, with lethal concentrations depending on the length of exposure and the particular PCB mixture (Aulerich et al., 1973). For various avian species provided with dietary concentrations of PCBs, LC50 values have ranged from 604 ppm for the northern bobwhite to more than 12,000 ppm for the Japanese quail (Hill et al., 1975). Acute toxicity values for avian species are summarized in Table 4-5.

4-9
For all avian species, PCB residue concentrations of at least 310 mg/kg fresh weight in the brain
were associated with an increased likelihood of death from PCB poisoning (Eisler, 1986). Residues in brains of starlings, red-winged blackbirds, common grackles (Quiscalus quiscula), and brown-headed cowbirds that died after ingesting diets containing 1,500 ppm of Aroclor 1254 for several days ranged from 349 to 763 mg/kg fresh brain weight. Brains of birds surviving at the 50 percent mortality exposure level contained 54 to 301 mg PCBs/kg fresh brain weight (Stickel et al. 1984).
Table 4-5. Summary of Short-term Dietary Avian Toxicity Values for PCB Mixtures
PCB
Mixture
Species
Exposure Durationa
LC50
Reference Northern bobwhite (Colinus virginianus)
5 days
> 6,000 ppm
Hill et al., 1975
Ring-necked pheasant (Phasianus colchicus)
5 days
> 5,000 ppm
Hill et al., 1975
1221
Japanese quail (Coturnix japonica)
5 days
> 12,000 ppm
Hill et al., 1975
Northern bobwhite (C. virginianus)
5 days
2,098 ppm
Hill et al., 1975
Mallard (Anas platyrhynchos)
5 days
3,182 ppm
Hill et al., 1975
Ring-necked pheasant (P. colchicus)
5 days
2,078 ppm
Hill et al., 1975
1242
Japanese quail (C. japonica)
5 days
> 6,000 ppm
Hill et al., 1975
Northern bobwhite (C. virginianus)
5 days
604 ppm
Hill et al., 1975
Mallard (A. platyrhynchos)
5 days
2,699 ppm
Hill et al., 1975
1254
Ring-necked pheasant (P. colchicus)
5 days
1,091 ppm
Hill et al., 1975
Japanese quail (C. japonica)
5 days
2,898 ppm
Hill et al., 1975
European starling (Sturnus vulgaris)
4 days
1,500 ppm
Stickel et al., 1984
Red-winged blackbird (Agelaius phoeniceus)
6 days
1,500 ppm
Stickel et al., 1984
Brown-headed cowbird (Molothrus ater)
7 days
1,500 ppm
Stickel et al., 1984
Northern bobwhite (C. virginianus)
5 days
747 ppm
Hill et al., 1975
Mallard (A. platyrhynchos)
5 days
1,975 ppm
Hill et al., 1975
Ring-necked pheasant (P. colchicus)
5 days
1,260 ppm
Hill et al., 1975
1260
Japanese quail (C. japonica)
5 days
2,186 ppm
Hill et al., 1975
aFive-day test was followed by three-day observation period.
ii. Subchronic and Chronic Toxicity
Chronic toxicity studies have been conducted on mallards, Japanese quail, pheasants, and domestic leghorn chickens (Gallus). Of the avian species tested, chickens have been shown to be more sensitive to the effects of chronic exposure to PCBs than have the other species.

4-10
Custer and Heinz (1980) fed 9-month-old mallards with a dietary dosage of 25 ppm Aroclor
1254 for at least one month before egg-laying. Treatment did not affect reproductive success or nest attentiveness during incubation. The number of hens laying, date of the first egg laid, clutch size, hatching of fertile eggs, survival of ducklings to three weeks of age, the number of times off the nest per day, and total time off the nest per day did not differ between the exposed group and the controls. Fertility of eggs was greater among the treated birds than among controls, a phenomenon that the authors attributed to males coming into reproductive condition sooner as a result of the PCBs. Using a mallard body weight of 1 kg (Delnicki and Reinecke, 1986), a food ingestion rate of 0.054 kg of dried feed/kg body weight per day is derived from Nagy's (1987) allometric equation for non-passerine birds (see the GLWQI TSD for Wildlife Criteria). Assuming that the laboratory feed for mallards consists of 10 percent water (Altman and Dittmer, 1972), the food ingestion rate would be equivalent to 0.060 kg of fresh feed/kg body weight per day. From this estimate, the NOAEL for reproductive effects in the mallard can be calculated to be equivalent to a dose of 1.5 mg/kg-day.
In contrast to the results of the mallard study, dietary exposure to PCBs had marked effects
among chickens at the same or lower concentrations. Britton and Huston (1973) exposed white leghorn hens to Aroclor 1242 at 0, 5, 10, 20, 40, and 80 ppm in a commercial feed over a 6-week period. Following treatment, the hens were held for an additional 6 weeks on a PCB-free diet and effects on reproduction were assessed. Dietary PCBs did not alter egg production, egg weight, shell thickness, or shell weight over the 12-week experiment. PCBs in the diet did have an effect on the hatchability of eggs. None of the eggs laid during the second week by hens fed 80 ppm PCBs hatched. Hatchability improved as the concentration of PCBs in the diet decreased. A significant reduction in hatchability of the eggs laid by hens fed 10 ppm Aroclor 1242 was observed at the sixth week of the experiment, but no effect on hatchability was noted for the eggs laid by hens fed a 5 ppm diet. Using a white leghorn hen weight of 2.0 kg (Medway and Kare, 1959) and a food ingestion rate of 0.067 kg feed/kg body weight per day (from Medway and Kare, 1959, for a 2.0 kg white leghorn hen), the NOAEL for Aroclor 1242 for hatchability of chicken eggs determined from this study was calculated to be 0.34 mg/kg-day (5 ppm).
Aroclor 1254 was also found to cause reduced egg production and hatchability in chickens. In a
chronic study, Platonow and Reinhart (1973) fed chickens rations containing 0, 5, or 50 ppm Aroclor 1254 for up to 39 weeks. A drastic decline in production and hatchability of fertile eggs was observed among hens maintained at the 50 ppm level. At 5 ppm, egg production was reduced, but not the hatchability of the fertile eggs. Fertility for the 5 ppm group was similar to the control during the first 14 weeks, but declined significantly in the last 14 weeks. These results indicate a LOAEL of 5 ppm for egg production and fertility. Using the chicken body weight and feed ingestion rate presented above, the LOAEL for egg production and fertility was calculated to be 0.34 mg/kg-day.
Lillie et al. (1975) assessed the reproductive effects of various PCBs (i.e., Aroclors 1232, 1242,
1248, 1254, and 1016) on white leghorn chickens maintained on a commercial feed treated at 0, 5, 10, and 20 ppm of a PCB mixture for 8 weeks. The data presented by Lillie et al. (1975) were pooled, both across Aroclors and across dose rates, making their interpretation noncomparable to the other studies described in this section (therefore, this study is not included in Table 4-4, which summarizes these studies). However, the data indicate no effect on egg production from dietary exposure at any concentration of PCB tested. Furthermore, the data indicate that a PCB level of 5 ppm in feed, averaged across mixtures, has no effect on hatchability, while Aroclors 1232, 1242 and 1248, regardless of concentration, but probably at 10 and 20 ppm, caused reduced hatchability. None of the Aroclors or dose levels had any effect on egg weight, eggshell thickness, adult body weight changes, feed consumption, livability, or fertility.
In another paper, Lillie et al. (1974) evaluated the effects of several PCB mixtures on mortality,
growth, and reproduction in chickens: Aroclors 1211, 1232, 1242, 1248, 1254, 1268, and 5442, and BP-6. All mixtures were administered in commercial feed at a concentration of 20 ppm for 9 weeks. Aroclors 1242, 1248, and 1254 also were administered in feed at 2 ppm for 9 weeks. The study

4-11
indicated that dietary exposure of white leghorn chickens to any of the PCB mixtures for 9 weeks had no effect on adult body weight, adult mortality, fertility, egg weight, or eggshell thickness. Reduced egg production was observed among the different groups of chickens maintained on 20 ppm Aroclor 1232, 1242, 1248, 1254, 1268, and BP-6. Reduced hatchability of fertile eggs was observed for chickens maintained on 20 ppm Aroclor 1232, 1242, 1248, and 1254. These effects were not observed at a dietary concentration of 2 ppm. Lillie et al. (1974) also monitored the growth and survival of chicks produced from hens maintained on Aroclor-treated feed. A significant reduction in growth was observed among chicks produced from hens maintained on feed treated with either Aroclor 1248 or Aroclor 1254 at 2.0 and 20 ppm. Exhibit 4-1 summarizes these results.
Exhibit 4-1. Effects of PCB Mixtures on Chicken Reproduction (Lillie et al., 1974)
Reduced Egg Production
Reduced Hatchability
Reduced Chick Growth
Aroclor
LOAEL (ppm)
NOAEL (ppm)
LOAEL (ppm)
NOAEL (ppm)
LOAEL (ppm)
NOAEL (ppm)
1221
--
20
--
20
--
20
1232
20
--
20
--
20
--
1242
20
2
20
2
20
2
1248
20
2
20a
2
2
--
1254
20
2
20
2
2
--
1268
20
--
--
20
--
20
5442
--
20
--
20
--
20
BP-6
20
--
--
20
20
--
aHatching of fertile eggs was reduced to 1.8 percent by the 9th week of exposure; hatchability of fertile control eggs was 95 percent.
Only Aroclor 1248 at a concentration of 20 ppm in the maternal diet was associated with significant chick mortality. The results of this study indicate a 2.0 ppm NOAEL and a 20 ppm LOAEL for egg production and hatchability with Aroclors 1242, 1248, or 1254. In addition, a 2.0 ppm LOAEL for chick growth effects for Aroclor 1248 and 1254, and a 2.0 ppm NOAEL for Aroclor 1242 can be inferred. Using the white leghorn hen food ingestion rates presented previously (0.067 kg/kg-day), the LOAEL for egg production and hatchability can be calculated to be 1.3 mg/kg-day (20 ppm) and the NOAEL to be 0.13 mg/kg-day (2 ppm) for Aroclors 1242, 1248, and 1254. For chick growth effects, the LOAEL for Aroclors 1248 and 1254, and the NOAEL for Aroclor 1242 is 0.13 mg/kg-day (2 ppm).
Scott (1977) measured the effect of Aroclor 1248 on reproductive parameters of white leghorn
hens maintained at dietary concentrations of 0.5, 1.0, 10, and 20 ppm over an 8-week period. A significant reduction in egg production at the 20 ppm concentration after eight weeks and a decrease in hatchability of fertile eggs at the 10 ppm dose after four weeks were noted. No significant effects on these reproductive endpoints were observed at 1 ppm Aroclor 1248 in the diet. Using the white leghorn hen food ingestion rate of 0.067 kg/kg-day presented above, the LOAEL for hatchability of fertile eggs is 0.67 mg/kg-day (10 ppm), and the corresponding NOAEL is 0.067 mg/kg-day (1 ppm).
Dahlgren et al. (1972) assessed the effects of orally-administered Aroclor 1254 on reproduction
in the ring-necked pheasant. Pheasants were individually dosed once per week, for 16 weeks, via gelatin capsule at rates of 0, 12.5, and 50 mg/week for females and 0 and 25 mg/week for males. Egg production, egg fertility, egg hatchability, survivability, and growth of chicks through 6 weeks post-

4-12
hatch were monitored. Significant reductions in hatchability were reported among eggs from the females treated with 12.5 or 50 mg Aroclor 1254 per week. Egg production and chick survivability were significantly reduced among hens administered 50 mg Aroclor 1254 per week, but not among hens administered 12.5 mg per week. No effect of Aroclor 1254 administration on egg fertility or on chick growth was observed. Using a female ring-necked pheasant body weight of 1 kg (Nelson and Martin, 1953), a value of 1.8 mg/kg-day (12.5 mg/week) can be inferred from this study for the NOAEL for egg production and chick survivability, and for the LOAEL for egg hatchability.
The various toxicity values derived from the studies discussed above are summarized in Table
4-6. An evaluation of these studies suggest that the lowest LOAEL values are those for chick growth from chickens dosed with Aroclors 1248 and 1254 (Lillie et al., 1974), for egg production and hatchability for chickens dosed with Aroclor 1248 (Scott, 1977), and for egg hatchability among pheasants exposed to Aroclor 1254 (Dahlgren et al., 1972). The lowest NOAELs were for egg production and hatchability among chickens using Aroclors 1232, 1242, 1248, or 1254 (Lillie et al., 1974; Scott, 1977).
The results of the pheasant study by Dahlgren et al. (1972) are used to derive the avian wildlife
value. According to the methods document (Appendix D to 40 CFR 132), preference is given to laboratory studies with wildlife species. The toxic endpoint of egg hatchability is a meaningful reproductive effect that is associated with avian dietary exposure to PCBs. In addition, the study by Dahlgren et al. (1972) involved exposures to both male and female adults. Calculation of the avian WV for PCBs is based on the study of Dahlgren et al. (1972), where a LOAEL of 1.8 mg/kg-day for egg hatchability was determined for Aroclor 1254.
Table 4-6. Summary of Subchronic and Chronic Avian Toxicity Values for PCBs
Species
Duration
LOAEL
(mg/kg-day)
NOAEL
(mg/kg-day)
PCB
Mixture
Toxic Effect
Observed
Reference
Mallard
1 month
1.5
1254
Reproduction
Custer and Heinz, 1980
Chicken
6 weeks
3.4
1242
Egg hatchability
Britton and Huston, 1973
Chicken
39 weeks
0.34
1254
Egg production and Fertility
Platonow and Reinhart, 1973
1.3
0.13
1242
Egg production and Hatchability
Lillie et al., 1974
1.3
0.13
1248
1.3 0.13
1254
0.13
1242
0.13
1248
9 weeks
0.13
1254
Chick growth
Chicken
8 weeks
0.67
0.067
1248
Egg production and Hatchability
Scott, 1977
Pheasant
16 weeks
1.8
0.18
1254
Egg hatchability
Dahlgren et al., 1972

4-13
iii. Avian Wildlife Value Calculation
As indicated in the previous paragraph, a LOAEL of 1.8 mg/kg-day, from the pheasant study by Dahlgren et al. (1972), is used to establish the avian wildlife value (WV). There are three types of uncertainty factors that need to be considered, interspecies uncertainty factors for extrapolating the LOAEL from pheasant to the kingfisher, herring gull, and bald eagle (i.e., a UFA for each of the three representative species), a subchronic-to-chronic uncertainty factor (UFS), and a LOAEL-to-NOAEL uncertainty factor (UFL).
Results of egg injection studies indicate that Gallinaceous birds are more sensitive than several
other orders of birds, including Charadriiformes (gulls), and that chickens are among the most sensitive of the Gallinaceous birds (Brunström and Reutergårdh, 1986; Brunström, 1988). In that the kingfisher (Order Coraciiformes) and bald eagle (Order Falconiformes) may be more sensitive to PCB toxicity than Gallinaceous birds, a UFA of greater than 1 is needed for these two representative species. The greater sensitivity of Gallinaceous birds compared to several other orders to PCB toxicity indicates that a UFA as great as 10 would be overly conservative. Therefore, a UFA of 3, intermediate to 1 and 10, is selected for both the kingfisher and the bald eagle. Given that the herring gull may be more sensitive than other Charadriiform birds, as the chicken is more sensitive than the pheasant (see Table 4-4 and Brunström and Reutergårdh, 1986), a UFA of 3 also is selected for the herring gull.
The UFS was set to 1 because the LOAEL derived from Dahlgren et al. (1972) of 1.8 mg/kg-
day was based on a reproductive and sensitive life stage study using a 112-day exposure period. The LOAEL therefore needs no adjustment to cover longer exposure periods.
A UFL of greater than 1 is needed because the study of Dalgren et al. (1972) established a
LOAEL, but not a NOAEL, for egg hatchability in pheasants exposed to PCBs. The investigators conducted essentially the same experiment in two different years. In one year, there were no significant differences in egg production, chick survivability, or egg hatchability between the group exposed to 12.5 ppm PCBs in the diet and the controls (both egg production and chick survivability were significantly reduced in the group exposed to 50 ppm PCBs). In the other year, egg hatchability was significantly lower in both exposed groups, egg production was reduced in the group exposed to 50 ppm only, and chick survivability in the exposed groups did not differ from controls. Pooling the data on egg hatchability for both years, the LOAEL of 12.5 ppm represents about a 15 percent effect level. Thus, the LOAEL appears to be relatively close to a threshold for effects, and the full factor of 10 is not needed to extrapolate to a NOAEL. A value of 3 therefore is used for the UFL as a value intermediate between 1 and 10.
The derivation of an avian wildlife value requires a special analysis for the bald eagle, which
consumes herring gulls in the Great Lakes. Braune and Norstrom (1989) have reported that total PCBs bioaccummulate in Lake Ontario herring gulls at a level approximately 90 times higher than that observed in alewife (a trophic level 3 fish). Therefore, to estimate PCB levels in herring gulls, the BAF3 (which represents the prey of the herring gull) is multiplied by a biomagnification factor (BMF) of 90.
The wildlife equation and input parameters are presented in Table 4-7. The BAFs relate
concentration of PCBs in fish tissue to the concentration of PCBs in the water column. The BMF relates the measured concentration of PCBs in herring gulls in the Great Lakes to the concentration of PCBs in alewife, their primary trophic level 3 prey (Braune and Norstrom, 1989). Values for body weights (Wt), food ingestion rates (F), and drinking rates (W) for kingfisher, herring gull, and eagle are presented in Table D-2 of the methods document (Appendix D to 40 CFR 132 and in the GLWQI TSD for Wildlife Criteria) and are shown in Table 4-8.
Calculations of avian wildlife values are summarized below.

4-14
WV(kingfisher) = TD x [1/(UFA(kingfisher) x UFS x UFL)] x Wt(kingfisher)
W(kingfisher) + (F(kingfisher,TL3) x BAF3)
WV(kingfisher)
=
1.8 mg/kg-d x [1/(3 x 1 x 3)] x 0.15 kg 0.017 Ρ/d + (0.0672 kg/d x 1,850,000 Ρ/kg)
WV(kingfisher)
=
241 pg/Ρ
Table 4-7. Input Parameters for Calculating the Avian Wildlife Value for PCBs
Parameter Category
Notation
Value
Test Dose
TD(avian)
1.80 mg/kg-day
Interspecies Uncertainty Factor (UF)
UFA(kingfisher)
UFA(gull) UFA(eagle)
3 3 3
Subchronic-to-Chronic UF
UFS
1
LOAEL-to-NOAEL UF
UFL
3
Bioaccumulation Factors
BAF3 (trophic level 3) BAF4 (trophic level 4) BAF(other) (terrestrial)
1,850,000 Ρ/kg body weight 6,224,000 Ρ/kg body weight
0 Biomagnification Factor
BMF(TL3 to gulls)
90
Table 4-8. Exposure Parameters for Representative Avian Wildlife Species
Species
Adult Body Weight (Wt) (kg)
Water (W)
Ingestion Rate (Ρ/day)
Food (F) Ingestion Rate of Prey in
Each Trophic Level (kg/day)a
Belted Kingfisher
0.15
0.017
TL3: 0.0672
Herring Gull
1.1
0.063
TL3: 0.192 TL4: 0.0480 other: 0.0267
Bald Eagle
4.6
0.16
TL3: 0.371 TL4: 0.0928 PB: 0.0283 other: 0.0121
a Only two digits are significant, but three digits are used for intermediate calculations. TL3 = trophic level three fish; TL4 = trophic level 4 fish; PB = piscivorous birds (e.g., herring gulls); other = non-aquatic birds and mammals.
WV(gull) = TD x [1/(UFA(gull) x UFS x UFL)] x Wt(gull)
W(gull) + [(F(gull,TL3) x BAF3) + (F(gull,TL4) x BAF4) + (F(gull,other) x BAF(other)]
1.8 mg/kg-d x [1/(3 x 1 x 3)] x 1.1 kg

4-15
WV(gull)
=
0.063 Ρ/d + [(0.192 kg/d x 1,850,000 Ρ/kg) + (0.0480 kg/d x 6,224,000 Ρ/kg) + (0.0267 kg/d x 0 Ρ/kg)]
WV(gull)
=
336 pg/Ρ
WV(eagle) = TD x [1/(UFA(eagle) x UFS x UFL)] x Wt(eagle)
W(eagle) + [(F(eagle,TL3) x BAF3) + (F(eagle,TL4) x BAF4) + (F(eagle, gulls) x BAF3 x BMF(TL3 to gulls)) + (F(eagle,other) x BAFother)]
WV(eagle)
= 1.8 mg/kg-d x [1/(3 x 1 x 3)] x 4.6 kg
0.16 Ρ/d + [(0.371 kg/d x 1,850,000 Ρ/kg) + (0.0928 kg/d x 6,224,000 Ρ/kg) + (0.0283 kg/d x 1,850,000 Ρ/kg x 90)+(0.0121 kg/d x 0 Ρ/kg)]
WV(eagle)
=
154 pg/Ρ
The geometric mean of these three avian wildlife values results in
WV (avian)
=
e([ln WV(kingfisher) + ln WV(gull) + ln WV(eagle)]/3)
WV (avian)
=
e([ln 241 pg/Ρ + ln 336 pg/Ρ + ln 154 pg/Ρ]/3)
WV (avian)
=
230 pg/Ρ (two significant digits).
iv. Sensitivity Analysis for Avian Wildlife Value
The values of the various parameters used to derive the avian wildlife value presented above represent the most reasonable assumptions. The purpose of this section is to illustrate the significance of these assumptions and the variability in the avian wildlife value if other assumptions are made for the values of the various parameters from which the avian wildlife value is derived. The intent of this section is to let the risk manager know, to the extent possible, the influence on the magnitude of the avian wildlife value of the assumptions made in its derivation.
No chronic PCB toxicity studies using piscivorous avian species were identified; however, it
could be assumed that such species are more sensitive to the effects of PCBs than the UFA of 3 would suggest. Use of a UFA of 10 for each of the representative species would result in an avian wildlife value of 70 pg/Ρ instead of 230 pg/Ρ. However, if these piscivorous birds are as sensitive as the pheasant, a UFA of 1 would be appropriate for each, and the avian WV would be 460 pg/Ρ instead of 230 pg/Ρ.
Chickens have been shown to be among the most sensitive species to PCB toxicity. Chronic
toxicity studies with chickens suggest effects on reproductive success could be expected at 0.54 mg/kg-day (Scott, 1977). Using the corresponding NOAEL value of 0.054 mg/kg-day (Scott, 1977) as the TD in calculating avian WVs, and using an UFA of 1 for each of the representative species yields an avian WV of 21 pg/Ρ. If in addition to using the 0.054 mg/kg-day values as the TD, the UFA for each of the representative species of bird were set to 3, the resulting avian WV would be 7.0 pg/Ρ instead of 230 pg/Ρ.

4-16
Mallard studies are also available to calculate wildlife values, and these may be considered more representative of sensitive wildlife species than those from chicken or pheasant. Mallard studies yield a NOAEL for reproduction of 1.6 mg/kg-day (Custer and Heinz, 1980). If the results of the mallard study were used with UFAs of 3 for each of the representative species, the avian wildlife value would be approximately 620 pg/Ρ. If the mallard NOAEL were used with UFAs of 10 for each of the representative species, the avian WV would be approximately 190 pg/Ρ, instead of the avian WV of 230 pg/Ρ.
The BMF for PCBs from trophic level 3 fish to herring gulls is high, a factor of 90. The diet of
the bald eagle was assumed to consist of 5.8 percent herring gulls, based on the average value for eight pairs studied on Lake Superior (Kozie, 1986). The diets of individual pairs or populations in other areas of the Great Lakes may include a greater or lesser proportion of herring gulls. The proportion of herring gulls in the diet of a pair of bald eagles nesting next to a gull colony was estimated to be 12.5 percent on a wet-weight basis (GLWQI TSD for Wildlife Criteria). A sensitivity analysis was conducted using the dietary composition estimated for this pair of eagles, which was 338 g trophic level 3 fish, 84.5 g trophic level 4 fish, 61.3 g herring gulls, and 6.0 g of non-aquatic birds (see GLWQI TSD for Wildlife Criteria). Keeping all other input parameters the same as indicated in Tables 4-7 and 4-8, the bald eagle WV would be 81 pg/Ρ, instead of 154 pg/Ρ, and the avian WV would be equal to 190 pg/Ρ instead of 230 pg/Ρ. On the other hand, if bald eagles ate only fish, they would require 527 grams daily (GLWQI TSD for Wildlife Criteria), of which about 422 grams would be trophic level 3 fish and 105 grams would be trophic level 4 fish. This dietary composition would result in a bald eagle WV of 641 pg/Ρ, and the avian WV would be 370 pg/Ρ instead of 230 pg/Ρ.
IV. Great Lakes Wildlife Criterion
The Great Lake Wildlife Criterion for polychlorinated biphenyls (PCBs) is determined by the lower of the mammalian wildlife value (74 pg/Ρ) and the avian wildlife value (230 pg/Ρ). The avian WV is approximately 3 times greater than the mammalian WV. Therefore, the Great Lake Wildlife Criterion for polychlorinated biphenyls (PCBs) is based on the mammalian WV and is equal to 74 pg/Ρ.
i. Discussion of Uncertainties
Wildlife populations inhabiting the Great Lakes basin are not expected to be impacted from the intake of drinking water and aquatic prey taken from surface water containing PCBs in concentrations of 74 pg/Ρ, based on the uncertainty factors used to account for data gaps and the variability in the toxicity and exposure parameters inherent in the PCB risk assessment. Criteria for other ecoregions may require an analysis of different wildlife species with different diets and body masses. In addition, the bioaccumulation factors in this analysis were based on an analysis for the Great Lakes, and different bioaccumulation factors may be more appropriate for other waterbodies.
Finally, generic assumptions were made in assessing the hazards of PCBs to wildlife
populations through the use of LOAELs and NOAELs for reproduction and development. The use of these levels assumes no hazards to wildlife populations would result from the exposure of individuals to PCBs. However, it could be argued that some increase in density independent mortality, or decrease in density independent reproductive success, which could be attributable to exposure to PCBs, could be incurred without impacting the population dynamics of a species. In general, well-validated population models do not yet exist for the species analyzed, and it is difficult to estimate the extent of mortality or reproductive failure that could be incurred without population-level effects. In addition, the interaction of additional chemical as well as non-chemical stressors on wildlife population responses is also poorly resolved at this time.

4-17
V. References Altman, P.L. and D.S. Dittmer, eds. 1972. Biology Data Book, Second Edition, Volumes I - III.
Federation of American Societies for Experimental Biology, Bethesda, MD; pp. 195-215, 1450-1457.
Aulerich, R.J., R.K. Ringer, and J. Safronoff. 1986. Assessment of primary vs. secondary toxicity of Aroclor7 1254 to mink. Arch. Environ. Contam. Toxicol. 15:393-399.
Aulerich, R.J., S.J. Bursian, W.J. Breslin, B.A. Olson, and R.K. Ringer. 1985. Toxicological manifestations of 2,4,5,2',4',5'-; 2,3,6,2',3',6'-; 3,4,5,3',4',5'-hexachlorobiphenyl and Aroclor 1254 in mink. J. Toxicol. Environ. Health 15:63-79.
Aulerich, R.J. and R.K. Ringer. 1977. Current status of PCB toxicity to mink, and effect on their reproduction. Arch. Environ. Contam. Toxicol. 6:279-292.
Aulerich, R.J., R.K. Ringer, and S. Iwamoto. 1973. Reproductive failure and mortality in mink fed on great lakes fish. J. Reprod. Fert. Suppl. 19:365-376.
Bleavins, M.R., R.J. Aulerich, and R.K. Ringer. 1980. Polychlorinated biphenyls (Aroclor 1016 and 1242): Effects on survival and reproduction in mink and ferrets. Arch. Environ. Contam. Toxicol. 9:627-635.
Braune, B.M. and R.J. Norstrom. 1989. Dynamics of organochlorine compounds in herring gulls: III. Tissue distribution and bioaccumulation in Lake Ontario gulls. Environ. Toxicol. Chem. 8:957-968.
Britton, W.M. and T.M. Huston. 1973. Influence of polychlorinated biphenyls in the laying hen. Poultry Sci. 52:1620-1624.
Brunström, B. and L. Reutergårdh. 1986. Differences in sensitivity of some avian species to the embryotoxicity of a PCB, 3,3',4,4'-tetrachlorobiphenyl, injected into the eggs. Environ. Pollut. (Series A) 42:37-45.
Brunström, B. 1988. Sensitivity of embryos from duck, goose, herring gull to 3,3',4,4'-tetrachlorobiphenyl. Poultry Sci. 67:52-57.
Custer T.W. and G.H. Heinz. 1980. Reproductive success and nest attentiveness of mallard ducks fed Aroclor 1254. Environ. Poll. (Series A) 21:313-318.
Dahlgren, R.B., R.L. Linder, and C.W. Carlson. 1972. Polychlorinated biphenyls: their effects on penned pheasants. Environ. Health Perspectives 1:89-101.
Delnicki, D. and K.J. Reinecke. 1986. Mid-winter food use and body weights of mallards and wood ducks in Mississippi. J. Wildl. Manage. 50:43-51.
den Boer, M.H. 1984. Reproduction decline of harbour seals: PCBs in the food and their effect on mink. 1983 Annual Report. Research Institute for Nature Management, The Netherlands; pp. 77-86.
Eisler, R. 1986. Polychlorinated Biphenyl Hazards to Fish, Wildlife, and Invertebrates: A Synoptic Review. U.S. Fish Wildl. Serv. Biol. Rep. 85; 72 pp.
Gillette, D.M., R.D. Corey, W.G. Helferich, J.M. McFarland, L.J. Lowenstine, D.E. Moody, B.D. Hammock, and L.R. Shull. 1987. Comparative toxicology of tetrachlorobiphenyls in mink and rats, I. Changes in hepatic enzyme activity and smooth endoplasmic reticulum volume. Fund. Appl. Toxicol. 8:5-14.
Hill, E.F., R.G. Heath, J.W. Spann, and J.D. Williams. 1975. Lethal Dietary Toxicities of Environmental Pollutants to Birds. U.S. Fish Wildlife Service, Washington, DC. Spec. Sci. Rep. ! Wildl. No. 152; 57 pp.
Hornshaw, T.C., R.J. Aulerich, and H.E. Johnson. 1983. Feeding great lakes fish to mink: effects on mink and accumulation and elimination of PCBs by mink. J. Toxicol. Environ. Health. 11:933-946.

4-18
Hornshaw, T.C., J. Safronoff, R.K. Ringer, and F.J. Aulerich. 1986. LD50 test results in polychlorinated biphenyl-fed mink: Age, season, and diet comparisons. Arch. Environ. Contam. Toxicol. 15:717-723.
Hudson, R.H., R.K. Tucker, and M.A. Haegele. 1984. Handbook of Toxicity of Pesticides to Wildlife. Second edition. U.S. Fish Wildl. Serv. Resour. Publ. No. 153; 90 pp.
Jensen, S., J.E. Kihlstrom, M. Olson, C. Lundberg, and J. Orberg. 1977. Effects of PCB and DDT on mink (Mustela vison) during the reproductive season. Ambio 6:239.
Lillie, R.J., H.C. Cecil, J. Bitman, and G.F. Fries. 1974. Differences in response of caged white leghorn layers to various polychlorinated biphenyls (PCBs) in the diet. Poultry Sci. 53:726-732.
Lillie, R.J., H.C. Cecil, J. Bitman, and G.F. Fries. 1975. Toxicity of certain polychlorinated and polybrominated biphenyls on reproductive efficiency of caged chickens. Poultry Sci. 54:1500-1555.
Linzey, A.V. 1988. Effects of chronic polychlorinated biphenyls exposure on growth and reproduction of second generation white-footed mice (Peromyscus leucopus). Arch. Environ. Contam. Toxicol. 17:39-45.
Medway, W. and Kare, M.R. 1959. Water metabolism of the growing domestic fowl with special reference to water balance. Poultry Sci. 38:631-637.
Nagy, K.A. 1987. Field metabolic rate and food requirement scaling in mammals and birds. Ecol. Monogr. 57:111-128.
National Academy of Science. 1979. Polychlorinated Biphenyls. Rep. Comm. Assess. PCBs in Environ., Environ. Stud. Bd., Comm. Nat. Resour., Nat. Res. Coun., Nat. Acad. Sci., Washington, DC; 182 pp.
Nelson, N.L. and A.C. Martin. 1953. Gamebird weights. J. Wildl. Manage. 17:36-42. Montz, W.E., W.C. Card, and R.L. Kirkpatrick. 1982. Effects of polychlorinated biphenyls and
nutritional restriction on barbituate-induced sleeping times and selected blood characteristics in raccoons (Procyon lotor). Bull. Environ. Contam. Toxicol. 28:578-583.
Platonow, N.S. and L.H. Karstad. 1973. Dietary effects of polychlorinated biphenyls on mink. Canad. J. Comp. Med. 37:391-400.
Platonow, N.S. and B.L. Reinhart. 1973. The effects of polychlorinated biphenyls Aroclor 1254 on chicken egg production fertility and hatchability. Can. J. Comp. Med. 37:341-346.
Ringer, R.K. 1983. Toxicology of PCBs in mink and ferrets. In: F.M. D'Itri and M.A. Kamrin, eds., PCBs: Human and Environmental Hazards. Butterworth Publ., Woburn, MA; pp. 227-240.
Ringer, R.K., R.J. Aulerich, and M. Zabik. 1972. Effects of dietary polychlorinated biphenyls on growth and reproduction in mink. Proc. 164th Natl. Meeting, American Chemical Society 12:149-154.
Ringer, R.K., R.J. Aulerich, and M.R. Blevins. 1981. Biological effects of PCBs and PBBs on mink and ferrets: a review. In: M.A.Q. Khan and R.H. Stanton, eds., Toxicology of Halogenated Hydrocarbons, Health and Ecological Effects. Pergamon Press, New York, NY; pp. 329-342.
Sanders, O.T. and R.L. Kirkpatrick. 1977. Reproductive characteristics and corticoid levels of female white-footed mice fed ad libitum and restricted diets containing a polychlorinated biphenyl. Environ. Res. 13:358-363.
Scott, M.L., M.C. Nesheim, and R.J. Young. 1976. Nutrition of the Chicken. Second Edition. Department of Poultry Science and Division of Nutritional Sciences, Cornell University. M.L. Scott and Associates, Ithaca, NY.
Scott, M.L. 1977. Effects of PCBs, DDT, and mercury compounds in chickens and Japanese quail. Federation Proceedings 36:1888-1893.

4-19
Stickel, W.H., L.F. Stickel, R.A. Dyrland, and D.L. Hughes. 1984. Aroclor 12547 residues in birds: lethal levels and loss rates. Arch. Environ. Contam. Toxicol. 13:7-13.
U.S. Environmental Protection Agency. 1980a. Ambient Water Quality Criteria for Polychlorinated Biphenyls. Office of Water, Washington, DC. EPA/440/5-80/068.
U.S. Environmental Protection Agency. 1980b. Toxicity of the Polychlorinated Biphenyl Aroclor 1016 to Mink. Office of Research and Development, Environmental Research Laboratory, Duluth, MN. EPA/600/3-80/033.
U.S. Environmental Protection Agency. 1988. Recommendations for, and Documentation of Biological Values for Use in Risk Assessment. Office of Research and Development, Cincinnati, OH. NTIS-PB88-179874.
U.S. Environmental Protection Agency. 1992. Draft report: a cross-species scaling factor for carcinogen risk assessment based on equivalence of mg/kg3/4/day: notice. Federal Register 57:24152-73.
U.S. Environmental Protection Agency. 1995. Trophic Level and Exposure Analyses for Selected Piscivorous Birds and Mammals. Volumes I and III. Office of Water, Office of Science and Technology, Washington, DC.
Wren C.D., D.B. Hunter, J.F. Leatherland, and P.M. Stokes. 1987. The effects of polychlorinated biphenyls and methylmercury, singly and in combination on mink. II: Reproduction and kit development. Arch. Environ. Contam. Toxicol. 16:449-454.
Zepp, R.L., Jr. and R.L. Kirkpatrick. 1976. Reproduction in cottontails fed diets containing a PCB. J. Wildl. Manage. 40:491-495.


CHAPTER 4 Tier I Wildlife Criteria for Polychlorinated Biphenyls (PCBs) Contents I. Literature Review............................................................................................................................. 4-1
II. Calculation of Mammalian Wildlife Value ...................................................................................... 4-1
i. Acute and Short-term Toxicity ................................................................................................. 4-1
ii. Subchronic and Chronic Toxicity ............................................................................................. 4-3
iii. Mammalian Wildlife Value Calculation ................................................................................... 4-7
iv. Sensitivity Analysis for Mammalian Wildlife Value................................................................ 4-9
III. Calculation of Avian Wildlife Value ............................................................................................... 4-9
i. Acute and Short-term Toxicity ................................................................................................. 4-9
ii. Subchronic and Chronic Toxicity ........................................................................................... 4-11
iii. Avian Wildlife Value Calculation........................................................................................... 4-14
iv. Sensitivity Analysis for Avian Wildlife Value ....................................................................... 4-17
IV. Great Lakes Wildlife Criterion....................................................................................................... 4-18
i. Discussion of Uncertainties .................................................................................................... 4-18
V. References ...................................................................................................................................... 4-19