Embed Size (px)
Citation preview

arX
iv:1
503.
0296
3v1
[as
tro-
ph.G
A]
10
Mar
201
5
A SEARCH FOR INTERGALACTIC GLOBULAR CLUSTERS
IN THE LOCAL GROUP
Graziella di Tullio Zinn and Robert Zinn
Department of Astronomy, Yale University, P.O. Box 208101, New Haven, CT
Received ; accepted
Accepted by the Astronomical Journal

– 2 –
ABSTRACT
The whole Sloan Digital Sky Survey (SDSS, 14, 555 deg2) has been searched
for intergalactic globular clusters (IGCs) in the Local Group (LG). Using optical,
infrared, and ultraviolet photometric selection criteria and photometric redshifts,
the 2.1x10⁸ of objects in the SDSS Galaxy Catalogue were reduced to only 183,791
brighter than r0 = 19 that might be GCs. Visual examination of their SDSS
images recovered 84% of the confirmed GCs in M31 and M33 and yielded 17 new
GC candidates, 5 of them of high confidence, which we could confirm as GCs in
MegaPrime images from the Canada, France, Hawaii Telescope. These 5 GCs
are within M31’s halo, but the other 12 candidates are not close to LG galaxies
or galaxies within 3 Mpc of the LG. Even though this search covers only one-
third of the sky and some GCs could have been missed, it suggests that the LG
does not contain a large population of IGCs more luminous than MV ∼ −6. In
the direction of the M81 Group, the search yielded five candidate GCs, probable
members of that group.
Subject headings: galaxies: groups (Local Group, M81) - galaxies: individual (M31)
- globular clusters: general

– 3 –
1. Introduction
This paper reports a search for globular clusters (GCs) over the whole footprint of the
Sloan Digital Sky Survey (SDSS),14, 555 deg2 of the sky, out to the edge of the Local Group
(LG) and beyond in the direction of the M81 Group of galaxies . It encompasses a large
volume of the LG, beyond the virial radii of the Milky Way (MW) and M31 (∼ 300 kpc,
Garrison-Kimmel et al. 2014). There are two reasons to suspect that GCs may be found far
from the MW or M31 or any other LG group galaxy. These intergalactic globular clusters
(IGCs) may have originated in galaxies, and through galaxy-galaxy interaction have become
unbound from their hosts and put on large orbits in the gravitational potential of the LG
(Bekki & Yahagi 2006). IGCs may have also formed independently of galaxies in their own
dark matter (DM) halos (Peebles 1984). While this second hypothesis has no compelling
observational support at present, it has not been ruled out as a source of GCs in addition
to the better supported hypotheses that GCs formed during the early evolution of galaxies
(e.g., Harris & Pudritz 1994; Kravtsov & Gnedin 2005; Elmegreen et al. 2012) or from gas
that was compressed when galaxies collided (e.g., Schweizer 1987; Ashman & Zepf 1992;
Whitmore & Schweizer 1995).
IGCs have been discovered in several nearby galaxy clusters such as Fornax (Gregg et al.
2009), Virgo (Lee et al. 2010), Abell 1185 (West et al. 2011), Coma (Peng et al. 2011),
Abell 1689 (Alamo-Martınez et al. 2013), and in some of them the IGCs number in the
thousands. The majority of the IGCs of these clusters have blue colors that are similar
to the colors of many of the GCs found in dwarf galaxies and in the blue sequence of the
typically bimodal color distribution of the GCs in massive early-type galaxies. The colors
of these clusters are consistent with very old ages and low metal abundances. In the Coma
cluster, however, a significant fraction (∼ 20%) of the IGCs have been found to have red
colors, suggesting that they are more metal-rich than the blue clusters (Peng et al. 2011).

– 4 –
The common interpretation of the presence of IGCs in galaxy clusters is that they formed
in galaxies that were later either tidally disrupted or stripped of their outermost stars
and GCs by galaxy-galaxy interaction. The galaxy merger Arp 105 in the cluster Abell
1185, which is liberating both stars and GCs from their galaxy of origin (West & Gregg
2014), is an interaction that is producing IGCs at the present time. The “hypervelocity
cluster ”, which appears to have been ejected from the Virgo Cluster (Caldwell et al. 2014),
may be further evidence of IGC producton by galaxy-galaxy interaction (Samsing 2015).
Similar interactions may have also occurred in galaxy groups according to the models of
Bekki & Yahagi (2006), and the cluster GC-2 in the M81 group, which lies ∼ 400 kpc from
M81, may be an example of an IGC in a galaxy group (Jang et al. 2012).
Galaxy interactions have occurred in the LG, because the halos of both the MW
and M31 show telltale signs of galaxy accretion. The ongoing disruption of the Sgr
dwarf spheroidal (dSph) galaxy by the MW, and the substructures found in the halos of
the MW and M31 provide the most direct evidence. Other evidence that the Galactic
halo was formed by satellite accretion has accumulated for more than 30 years (see
Bland-Hawthorn & Freeman 2014, for a review). The simulations of the hierarchical picture
of galaxy formation (e.g., Abadi et al. 2003; Bullock & Johnston 2005; Zolotov et al. 2009)
show that the accretions of sub-halos of DM onto a large DM halo (i.e., a large galaxy)
frequently lead to the capture of the sub-halo into a satellite orbit and eventually its tidal
disruption. If the sub-halo is a dwarf galaxy containing stars and star clusters, then they
become part of the stellar halo of the large galaxy. A few of the sub-halos that pass through
the viral radius of the large halo are not captured but remain on orbits that are several times
the viral radius in extent. Some of these so-called “back-splash galaxies” (e.g., Gill et al.
2005) may have had their gas removed by ram-pressure stripping and tidal stirring (e.g.,
Mayer et al. 2001; Kazantzidis et al. 2013) while passing close to the large halo. This may
explain the existence of the Tucana and Cetus dSph galaxies in the LG that are currently

– 5 –
far beyond the virial radii of M31 and the MW, and yet appear to have been stripped of
their gas (Teyssier et al. 2012). The recent simulations by Garrison-Kimmel et al. (2014) of
galaxy groups containing two large halos that are similar to M31 and the MW indicate that
more back-splash galaxies on large orbits are produced when two massive halos are present
rather than just one. The case of the accretion of a binary pair of sub-halos of unequal
masses onto a large halo has been simulated by Sales et al. (2007), who found that often the
lower mass sub-halo was ejected at high velocity while the higher mass one merged with the
large halo. It seems plausible then that during the accretion of a GC-bearing dwarf galaxy
by a large galaxy, one or more of its GCs may become unbound from the dwarf and placed
on large orbits, reminiscent of the orbits of the back-splash galaxies. Some dwarf galaxies,
for example the LG galaxies Fornax (e.g., Cole et al. 2012) and NGC 6822 (Huxor et al.
2013), contain GCs that are far from their centers and therefore may be easily stripped in a
galaxy-galaxy interaction. The large stellar substructures in the halo of M31 (Fardal et al.
2013; Bate et al. 2014, and refs. therein) and its large number of halo GCs, some of
which appear associated with the substructures (Veljanoski et al. 2014) suggest that it has
accreted GC-bearing galaxies. The same is true of the MW, as indicated by the properties
of its halo GC system (e.g., Zinn 1993; Mackey & Gilmore 2004; Keller et al. 2012) and
rather directly by the accretion of GCs from the Sgr dSph galaxy (e.g., Law & Majewski
2010). It remains to be seen if the accretion events involving the MW and M31, which
theoretical simulations predict were very numerous (e.g., Bullock & Johnston 2005), placed
any GCs on such large orbits that they are now IGCs in the LG.
The hypothesis that some GCs formed in their own DM halos is now three decades old
(Peebles 1984), but it has not been confirmed or ruled out observationally. The discoveries
of multiple stellar populations and variations in the abundances of He and other elements
in GCs, has renewed the interest in this hypothesis as a way of explaining how some GCs
can retain gas and have more than one episode of star formation (see Conroy & Spergel

– 6 –
2011, and refs. therein). Because the DM halo of a GC may be stripped as it is accreted by
a large galaxy (e.g., Mashchenko & Sills 2005), the most isolated and massive GCs should
be the best candidates to prove this hypothesis. The recent investigations by Conroy et al.
(2011) and by Ibata et al. (2013) of the structures of the GCs NGC 2419 and MGC1 in
the remote outer halos of the MW and M31 respectively, failed to find firm evidence for
the presence of DM. The 14 dwarf galaxies that are not members of the MW or the M31
satellite systems (see McConnachie 2012) suggest the presence of isolated DM halos in the
LG. In addition there might be DM haloes in the LG that formed single GCs. This idea
and the possibility that some galaxy interactions may have flung GCs into larger orbits
have motivated this search for IGCs in the LG, which greatly expands our earlier one of
∼ 900 deg2 of the sky near M31 (di Tullio Zinn & Zinn 2014, hereafter Paper II).
To our knowledge, there has not been a previous survey of a large volume of the LG
with the specific goal of finding IGCs. Many of the most remote GCs in the MW halo,
including Pal 4 (Abell 1955) and AM-1 (Madore & Arp 1979), both at distances from the
Sun (d⊙) > 100 kpc, were discovered by visual examination of the photographic plates
taken with the Schmidt telescopes of the Palomar (POSS-I & -II), the European Southern
(ESO), and the Siding Spring (U.K. Science Research Council, SRC) Observatories. It is
hard to judge to what distance these large surveys could have detected GCs because this
depends on the properties of the clusters, the plate material, and the survey techniques.
Our examination of the images of several of the brightest M31 GCs on film copies of the
POSS-II plates and on images of the digital sky survey (DSS), suggests that these plates
do not have the depth and resolution necessary to identify many GCs at the distance of
M31 (d⊙ = 783 ± 25 kpc; all distances to LG galaxies in this paper are from McConnachie
(2012). A good example is provided by the luminous cluster M31 MGC1 (MV = −9.2,
Mackey et al. (2010), which was discovered on MegaCam images from the Canada France
Hawaii Telescope (CFHT) 3.6m telescope (Martin et al. 2006). On the film copies of the

– 7 –
POSS-II, MGC1 appears stellar. On the SDSS images, which are the main source of our
survey technique, there is no question that MGC1 is a GC. Our survey can then identify
similar clusters within the boundaries of the LG. Our survey is also sensitive to GCs,
whose central regions are not resolved in the SDSS images, and are therefore catalogued as
galaxies. On the other hand, it excludes GCs that are so resolved into stars that they are
not classified as galaxies by the SDSS, and therefore do not enter our initial selection of
objects from its Galaxy Catalogue, such as the MW GCs Koposov 1 and 2 (Koposov et al.
2007). Our survey misses also ultra-faint galaxies and dSph galaxies. Below we discuss the
survey, its application, limitations, and results.
2. Search Area
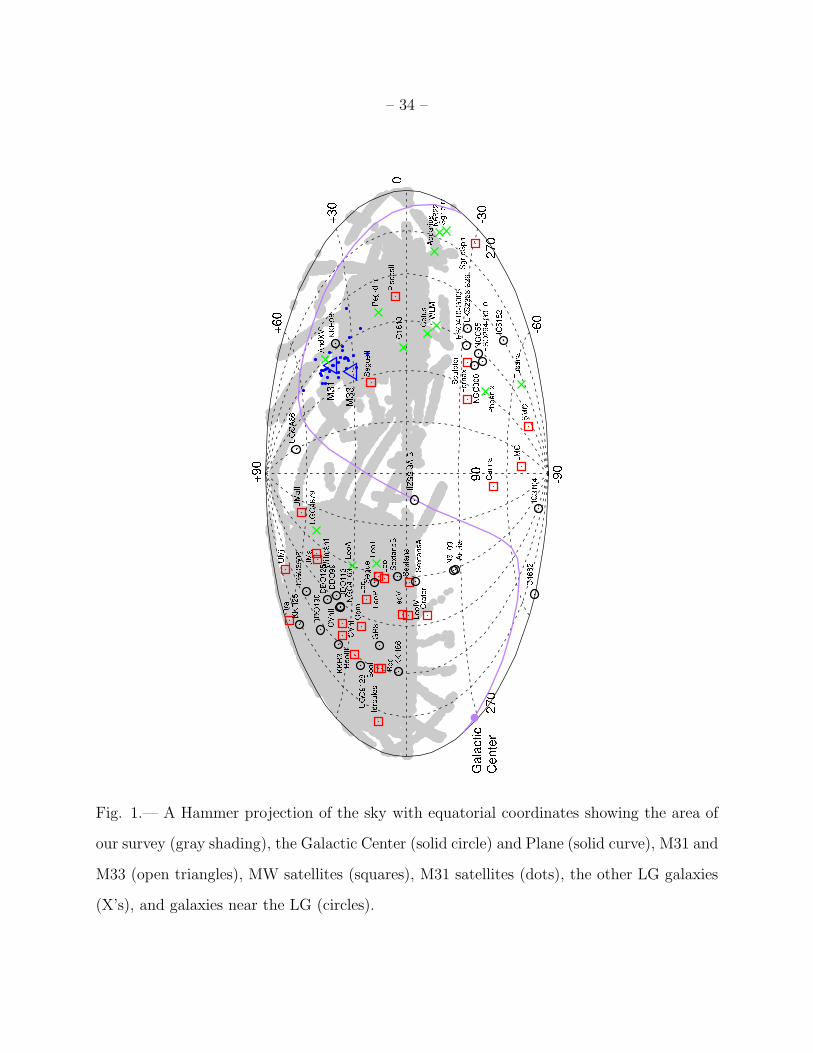
Figure 1, which is a Hammer projection of the sky with equatorial coordinates, shows
our search area (gray shading), the positions of the Galactic plane, the Galactic center,
M31, M33, the other satellite galaxies of M31, the satellite galaxies of the MW, other
LG galaxies, and galaxies within 3 Mpc of the LG. Most of these galaxies were selected
from the recent compilation of McConnachie (2012), which we augmented with the more
recent discoveries of the probable M31 satellites, Lac I, Cas III, and Per I (Martin et al.
2013b,a) and the MW satellite, Crt I (Belokurov et al. 2014), which might be instead a
low-luminosity GC in the outer halo of the MW (Laevens et al. 2014).
In our first survey for IGCs in the LG, we surveyed ∼ 900 deg2 of the SDSS in an area
around M31 up to 500 kpc in projected distance from its center (Rgc) (see Fig. 1 in Paper
II), which included most of its satellite galaxies. This area was selected because of the
possibility that some of the accretion events that produced the large substructures and the
rich population of GCs in M31’s halo, could have also produced IGCs. Our current survey
(see Figure 1) encompasses larger expanses of the sky to the south and southwest of M31,

– 8 –
and it also expands in the opposite directions, with a large gap near the galactic plane.
Note that the relatively low galactic latitude of M31 (−21.◦6) places it almost on the edge
of the SDSS. Since the candidate backsplash galaxies Tucana and Cetus dSph galaxies lie
far from both M31 and the MW, IGCs may be similarly scattered throughout the LG. A
wide distribution is also possible if IGCs formed in their own DM halos. For both reasons it
is important to search as much of the LG as possible, and our current search covers about
one-third of the sky.
3. Survey Techniques
The steps in this survey were modeled after our previous surveys for GCs in the
remote halo of M31 (di Tullio Zinn & Zinn 2013, Paper I) and for IGCs in the vicinity of
M31 (Paper II). The first step in those two surveys was to select objects from the SDSS
Galaxy Catalogue, (a catalogue of non-point sources), with (g − i)0 colors of old GCs:
0.3 ≤ (g − i)0 ≤ 1.5. The second step was to examine by eye the SDSS cutout images of
these selected objects as provided by the SDSS website. The vast majority of the objects
that passed the (g − i)0 color cut could be immediately rejected as galaxies. Objects that
were not easily rejected were then examined more closely in the r pass-band images, which
we downloaded from the SDSS website in fits file format. In the case of the IGC survey of
Paper II, which covered a larger area than the survey in Paper I (∼ 900 vs ∼ 250 deg2),
too many ambiguous objects still remained after this closer visual scrutiny. Consequently,
additional steps were added in Paper II, which used combinations of optical, ultraviolet,
and infrared colors to distinguish GCs from most galaxies on the basis of the shapes of
their spectral energy distributions (SEDs). Although the survey in Paper II found several
GCs, they are, however, more likely to be additional members of M31’s halo than IGCs
because their Rgc values are < 140 kpc. The most time consuming part of these earlier

– 9 –
searches was the part that involved the initial visual inspection of the images (283,871
images in the case of Paper II). Because the present search area is more than 15 times larger
than the one in Paper II, it was impractical to employ the same initial technique of visual
inspection. Instead, we were able to reject beforehand from the SDSS Galaxy Catalogue
many thousands of galaxies by using some of the photometric selection techniques already
experimented with in Paper II, based on their SED differences with GCs. The final step in
the present survey was still a visual inspection of the SDSS cutout images, but of a greatly
reduced number of objects.
Since the halos of the MW and M31 are probably in part the debris from galaxy-galaxy
interactions, the GCs in their halos may be representative of IGCs. The MW and M31
GCs have similar colors and spectra (Schiavon et al. 2012), and the halo GCs in both M31
and the MW appear to be older than 1 Gyr and metal-poor ([Fe/H]. −1). Consequently,
for our search we chose color ranges that isolated similar objects. It is not clear that these
broad ranges will necessarily include all IGCs that formed in their own DM halos because
Peebles’ (1984) theory does not make specific age and metallicity predictions beyond
estimating that the formation process begins at a redshift ∼ 50. We use the M31 GCs to
serve as prototypes of IGCs, because their optical, infrared, and ultra violet colors can be
measured with the same techniques that we will adopt for our survey. We will also examine
how well our methodology identifies the confirmed GCs in the other LG galaxies with GC
systems.
As we did in our two previous searches for GCs, the candidates were drawn from
the SDSS Galaxy catalogue, which contains non-stellar objects according to the following
criterion. The SDSS frames pipeline (see Stoughton et al. 2002) measures the point-spread-
function (psf) of each CCD frame and uses it to compute a “psf magnitude” for each
photometric band, to which is applied an aperture correction to remove the effects of
– 10 –
variable seeing. The pipeline also measures the light-profile of each object, which it fits with
both exponential and de Vaucouleur r1/4 profiles after they are convolved with the psf. The
total magnitude of an object in each band is measured by the “composite model magnitude”
(e.g., cmodelMag r), which is based on a linear combination of the best fitting exponential
and de Vaucouleur profiles. The test for an extended source is made by summing over all
bands the fluxes captured by the psf magnitudes and separately the cmodel magnitudes,
which are converted back to magnitudes. If the difference between these flux-summed
magnitudes, psfMag−cmodelMag, is ≤ 0.145, then the object is classified as a star1.
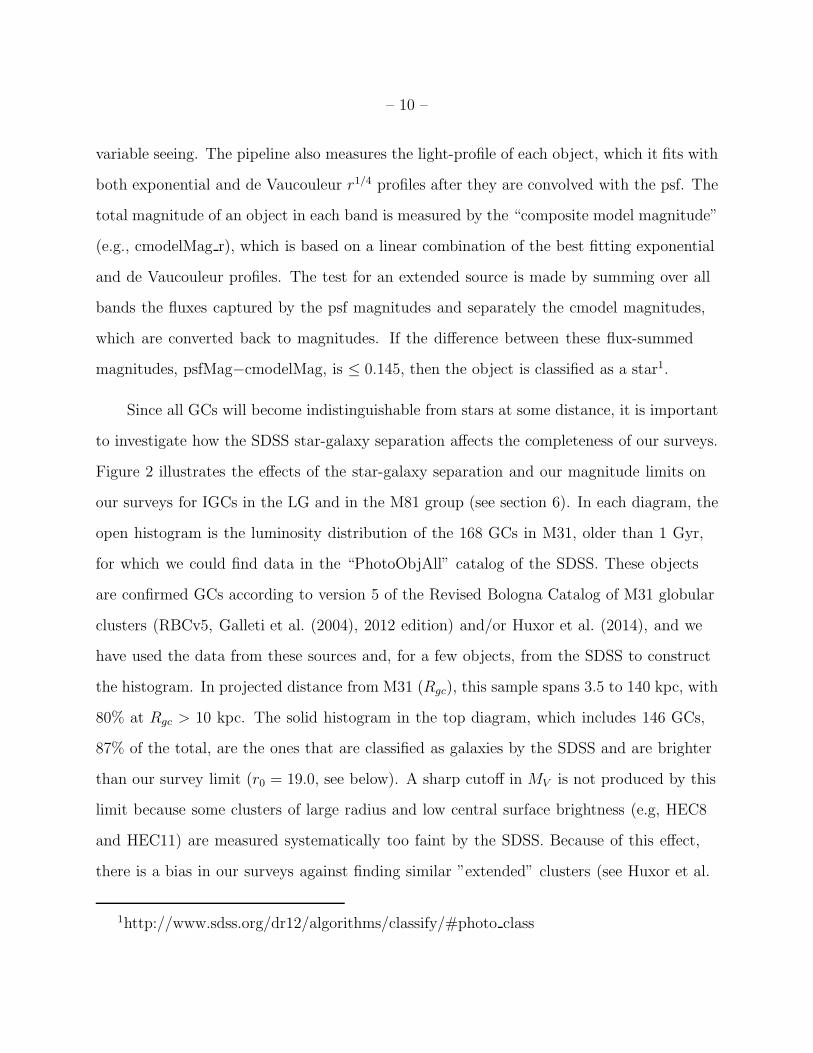
Since all GCs will become indistinguishable from stars at some distance, it is important
to investigate how the SDSS star-galaxy separation affects the completeness of our surveys.
Figure 2 illustrates the effects of the star-galaxy separation and our magnitude limits on
our surveys for IGCs in the LG and in the M81 group (see section 6). In each diagram, the
open histogram is the luminosity distribution of the 168 GCs in M31, older than 1 Gyr,
for which we could find data in the “PhotoObjAll” catalog of the SDSS. These objects
are confirmed GCs according to version 5 of the Revised Bologna Catalog of M31 globular
clusters (RBCv5, Galleti et al. (2004), 2012 edition) and/or Huxor et al. (2014), and we
have used the data from these sources and, for a few objects, from the SDSS to construct
the histogram. In projected distance from M31 (Rgc), this sample spans 3.5 to 140 kpc, with
80% at Rgc > 10 kpc. The solid histogram in the top diagram, which includes 146 GCs,
87% of the total, are the ones that are classified as galaxies by the SDSS and are brighter
than our survey limit (r0 = 19.0, see below). A sharp cutoff in MV is not produced by this
limit because some clusters of large radius and low central surface brightness (e.g, HEC8
and HEC11) are measured systematically too faint by the SDSS. Because of this effect,
there is a bias in our surveys against finding similar ”extended” clusters (see Huxor et al.
1http://www.sdss.org/dr12/algorithms/classify/#photo class
– 11 –
2008), which however appear to be rare objects (only 4% of the sample of 168 and 2% of
the confirmed GCs in the RBCv5 are classified as extended). The ragged cutoff of the solid
histogram is also caused by our r0 limit depending only on the foreground MW extinctions
of the objects, while the extinctions used to compute MV include contributions from M31.
In addition, 3 of the 168 clusters in the sample fail the star-galaxy separation and were
listed as stars in the PhotoObjAll catalog.
The solid histogram in the middle diagram, which contains 131 clusters or 78% of the
total number, includes the effects of the r0 limit and star-galaxy separation at 1100 kpc
from the Sun. This may be approximately the limit of the LG in most directions of our
survey because McConnachie (2012) estimated that the zero velocity surface of the LG
lies 1060 ± 70 kpc from the mid point between the MW and M31. To model the SDSS
star-galaxy separation, we used the composite profile fit in each band to find the radius of
the aperture that enclosed the same flux as the psfMag. This radius was typically 80%
of the full-width-half-maximum (FWHM) of the psf as listed in PhotoObjAll. We then
scaled the effective radii of the exponential and de Vaucouleurs profiles that are listed in
the PhotoObjAll catalog from the M31 distance to 1100 kpc and computed new composite
profiles for each band. Using these profiles and the effective apertures of the psfs, we
computed the difference psfMag−cmodelMag, which, if ≤ 0.145, indicated a stellar source.
According to this procedure, 10 of the 168 clusters would be considered as stars at a
distance of 1100 kpc, but only 2 of them are brighter than the r0 cutoff.
The solid histogram in the bottom diagram of Figure 2 shows the effects of the r0
cutoff, now increased to 20.0 (see section 6), and the star-galaxy separation at the distance
of the M81 Group, 3.6 Mpc (Karachentsev et al. 2013). Only 35 clusters or 21% of the
original 168 are included in this histogram. Nonetheless, it suggests that ∼ 50% of the most
luminous GCs (MV ≤ −7.8) are non-stellar at M81’s distance. This result is in qualitative
– 12 –
agreement with the presence of some M81 GCs in the SDSS galaxy catalogue (e.g., the two
studied by Jang et al. (2012)).
For the optical data, we downloaded from the Galaxy catalog the SDSS ”model
magnitudes”, which are based on the better one of the exponential or the de Vaucouleur
fits to the r-band light profile. While the model magnitudes provide the best measurements
of the colors of galaxies, they are less good than the cmodel magnitudes for measuring
the total light2. Over the magnitude ranges of interest here the differences between these
magnitudes are so small that they can be safely ignored (e.g., for the 147 M31 clusters with
r0 ≤ 19.0 in Fig. 2, the difference, modelMag−cmodelMag, have means of 0.031 ± 0.010,
0.016 ± 0.005, and 0.008 ± 0.009 in the g, r, and i bands). We only selected objects with
reddening corrected r magnitudes 12.0 ≤ r0 ≤ 19.0, because our experience with the M31
GCs suggested that fainter ones might fail our color selection criteria, and with very few
exceptions, cannot be confirmed as star clusters by visual inspection of the SDSS images.
For an optical color we chose g − i because it is well measured for these relatively bright
objects and has a long wavelength baseline. In addition this time we selected for our sample
objects with reddening corrected colors in a more restricted range, 0.3 ≤ (g − i)0 ≤ 1.1,
which still encompasses the range in color of the outer halo GCs in M31 and most of the
GCs belonging to the dwarf galaxies of the LG (see section 4). Because of the age-metallicity
degeneracy effect, this range in color encompasses wide enough ranges in both metallicity
and age,−2.25 . [Fe/H] . −0.33 if age > 1 Gyr, according to the models of Maraston
(1998, 2005). Moreover the selection criteria for GCs that we developed in Paper II, using
color combinations from the SDSS, the Wide-field Infrared Survey Explorer (WISE), and
the Galaxy Evolution Explorer (GALEX) satellites, work well within this range of (g − i)0,
but not outside it, as shown in Figure 3. These criteria were presented and discussed at
2www.sdss.org/dr12/algorithms/magnitudes/

– 13 –
greater length in Paper II. Because the recent Data Release 10 (DR10) of the SDSS Galaxy
Catalogue is linked to the WISE All-Sky Catalogue, much of our present survey could now
be done automatically via Casjob on the SDSS website.
Our previous experience in searching for GCs in the halo of M31 has shown that the
largest contamination in our sample comes from galaxies resembling GCs in appearance in
the SDSS images because they look compact and nearly round. When the spectroscopically
measured redshifts (z) of these galaxies were available, they indicated that the galaxies lie
far beyond the LG. In most cases, the SEDs of these galaxies do not closely resemble those
of GCs. Unlike GCs, many of them are still forming stars. Ones that have little or no star
formation have stellar populations that are more metal-rich, and hence redder than the
GCs found in the halos of the MW and M31 or in dwarf galaxies. Therefore these groups of
galaxies can be separated from GCs by means of photometric criteria. To illustrate how our
selection criteria can distinguish between these galaxies and GCs, we have selected a sample
of 122 GCs in M31 with Rgc ≥ 10 kpc and 12 ≤ r0 ≤ 19, that do not lie in close proximity
to bright stars or in the very dense star fields of M31. These confirmed clusters were
selected from the catalogues of Kang et al. (2012); Huxor et al. (2008, 2014), and Papers
I and II. Because we are searching for IGCs, in the construction of the selection criteria
we selected a more remote sample (Rgc ≥ 10 kpc) than the one used in Paper II (Rgc ≥ 3
kpc). The clusters in the inner regions are more likely to have formed within M31 rather
than in dwarf galaxies or in their own dark matter halos. In the diagrams of Figures 3 and
4, this sample of GCs is compared to the objects in a small area of our survey covering
4 deg2, and centered at RA, Dec = 161.0, +1.0 (l = +249.1, b = +50.1). This region is
representative of all but the lower galactic latitude regions of our survey, where the SDSS
Galaxy Catalogue contains fewer galaxies per square degree and many more tight groups of
stars. In this comparison region, the SDSS Galaxy Catalogue contains 2146 objects with
12.0 ≤ r0 ≤ 19.0. The SDSS cutout image of each of these objects was visually examined

– 14 –
and none of them was a candidate GC according to the criteria that we discussed in Paper
I. We used these objects to illustrate how the majority of similar objects can be separated
from GCs without resorting to a preliminary visual inspection, which would have been very
time consuming for the area of 14, 555 deg2 surveyed in this search.
The top diagram of Figure 3 shows that many galaxies (X’s) are redder in the (g − i)0
and (i−W1)0 colors than GCs (circles). The color (i−W1)0 is formed from the magnitudes
in the SDSS i-band, transformed to the Vega system, and the WISE W1 band, which is
centered at 3.4µm, while the W2 and W3 bands are centered at 4.6 and 12µm. We used
the profile fitted magnitudes for all WISE measurements because they are presented as the
most reliable measurement for unresolved sources in the description of the WISE catalogue
(Cutri et al. 2011). Nearly all of the M31 GCs are unresolved by WISE in the W1, W2, and
W3 wavelength bands, which have psfs with full-width-half-maxima (FWHM) of 6.′′1, 6.′′8,
and 7.′′4, respectively. Later we will discuss the effects on our survey of forming colors with
the SDSS model magnitudes, which include nearly all of the light of the objects, and the
WISE and GALEX measurements, which do not. The top diagram in Figure 3 shows,
in the (g − i)0 − (i − W1)0 plane, the locations of the objects of the comparison region
(X’s), which extend beyond the limits of this plot, and of the selected sample of M31
GCs (circles). The dashed contour in this diagram encloses 90% of the density of the 2-D
kernel density estimate of the GCs. The rectangular area, which encloses 120 (98%) of the
GCs, marks some of the cuts that we will impose to isolate GCs, 0.3 ≤ (g − i)0 ≤ 1.1 and
(i−W1)0 ≤ 2.03. Only 389 (18%) of the objects in the comparison region pass these cuts.
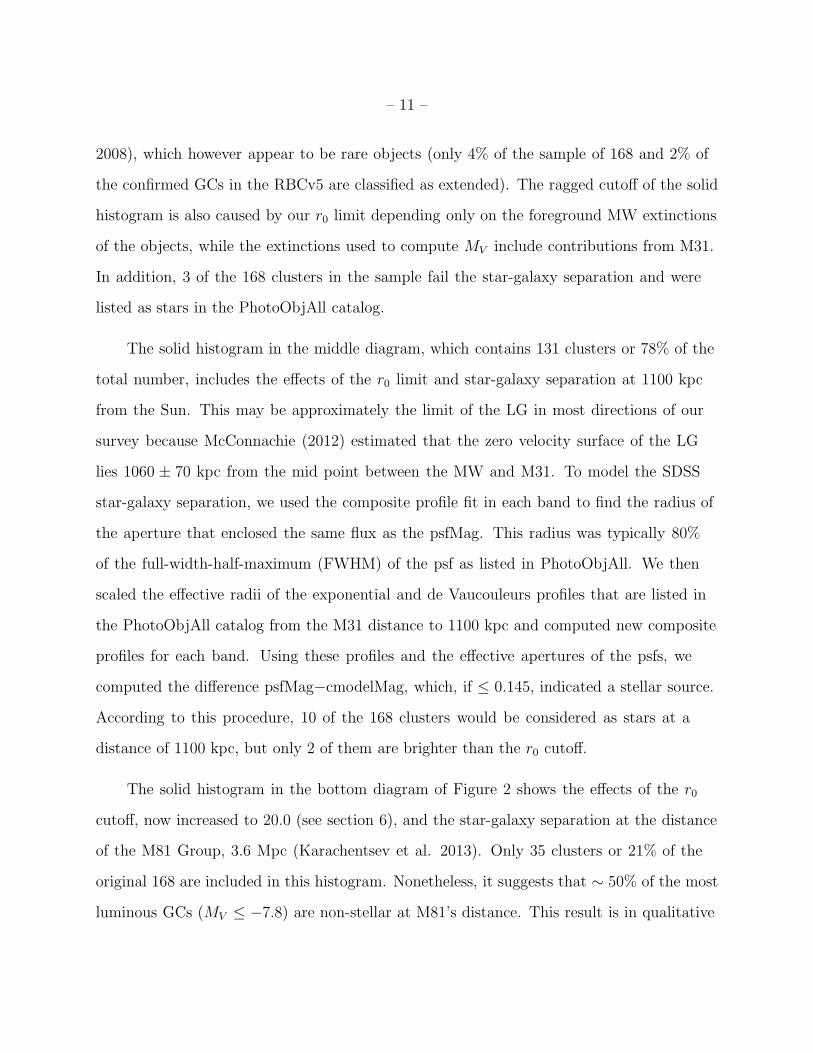
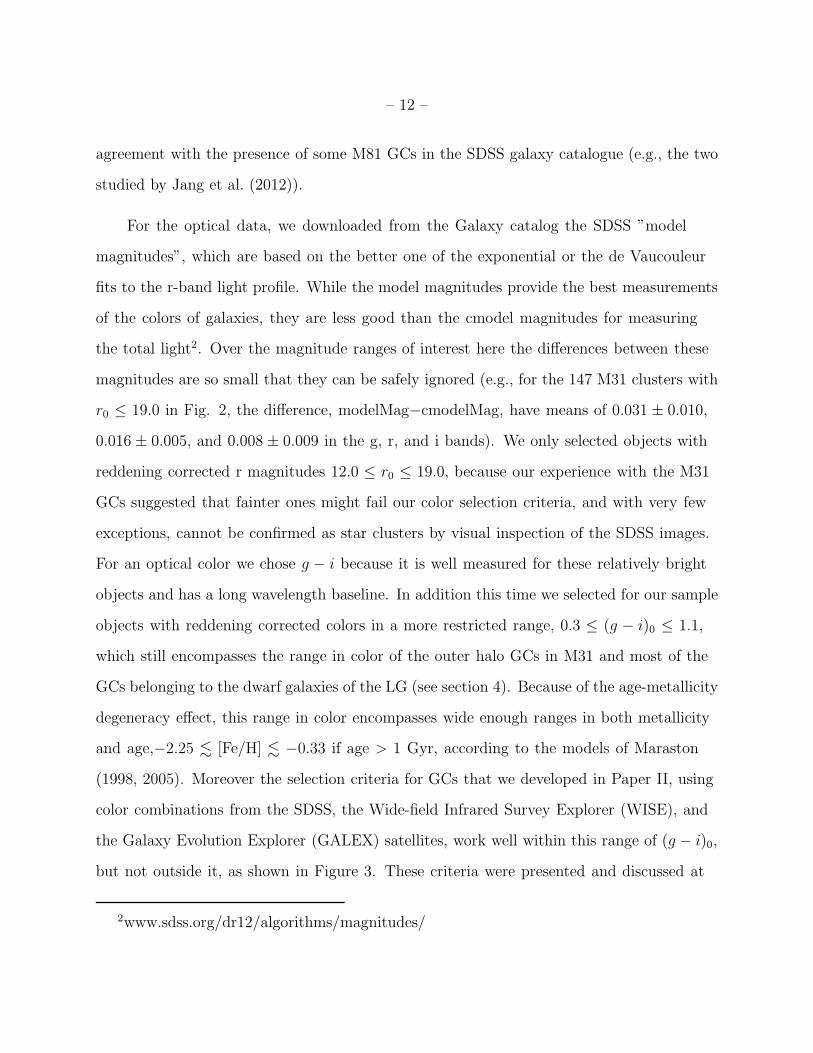
The middle diagram in Figure 3 shows the usefulness of adding a second cut with the
photometric redshift, Photoz, which is derived from the 5 SDSS photometric bands by
the K-D tree method and listed in DR10. In Paper II, we showed that Photoz is a useful
discriminant between M31 GCs and galaxies because it systematically assigns low values
– 15 –
of z to the GCs (see Fig. 4 in Paper II). Although these Photoz values are much larger
than the real z’s of the GCs, they are smaller than the ones of many galaxies of similar
color and magnitude. For this study, we chose for Photoz a wider limit (≤ 0.13) than in
Paper II to reduce a bias against fainter GCs, like B407 which would not pass otherwise
our selection. The original sample of 122 M31 GCs had to be reduced to 89 in the middle
diagram of Figure 3, because values of Photoz were available for only the ones within the
SDSS footprint. One of these clusters, B517, has an exceptionally large value of Photoz,
0.177, and it was excluded when calculating the 2-D kernel density and its 90% contour.
The (u − g)0 color of B517 is approximately 0.2 mag smaller than the ones of other M31
GCs of similar (g − i)0, which may be responsible for its anomalously large Photoz. The
rectangle in this diagram indicates the region delineated by the cuts in Photoz and (g − i)0
that we will use to isolate GCs, and it encloses every GC (circles) except B517. The 389
objects in the comparison region that passed the cuts in the upper diagram are the ones
plotted in this middle diagram; 338 of them passed the Photoz cut.
The bottom diagram in Figure 3 is a plot of the color W2-W3, versus (g − i)0. W2-W3
is sensitive to the amount of star formation because the W3 band includes the emission
from polycyclic aromatic hydrocarbon molecules. While all 122 M31 GCs are plotted in
this diagram, W3 was measured for only 31 (solid circles). For the other 91 GCs, W3 is
an upper limit (open circles), and therefore W2-W3 is also an upper limit. Using only the
GCs with measured values, we calculated the 2-D kernel density, and the dashed contour
in the diagram encloses 90% of the density of these GCs. The faintest GCs are the ones
lying above the contour. In order not to exclude faint GCs with only upper limit values,
we will impose two different cuts by W2-W3. If W2-W3 was a measured value, like for
solid circle objects, the cut will be at 3.1. If W2-W3 was an upper limit, it is raised to 4.0.
The majority of M31 GCs (∼ 96%) passed all of these three criteria. Also plotted (crosses:
upper limit; X’s: measured value of W2-W3) are the 338 comparison objects that passed
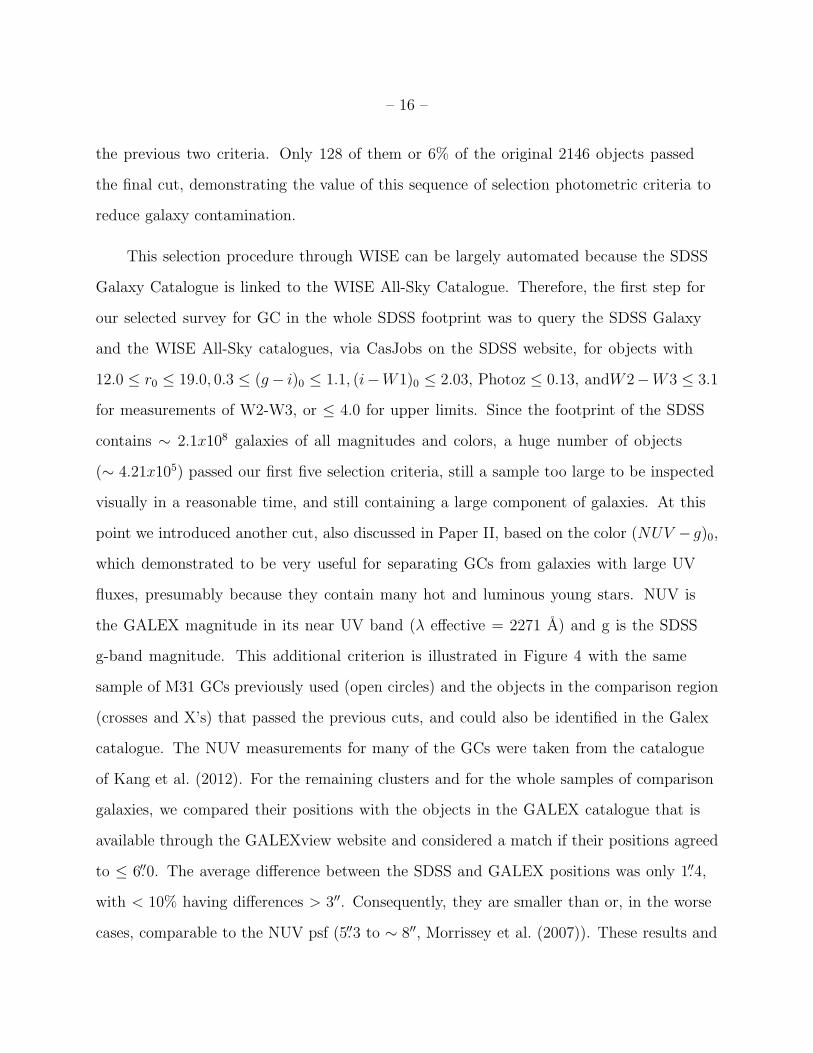
– 16 –
the previous two criteria. Only 128 of them or 6% of the original 2146 objects passed
the final cut, demonstrating the value of this sequence of selection photometric criteria to
reduce galaxy contamination.
This selection procedure through WISE can be largely automated because the SDSS
Galaxy Catalogue is linked to the WISE All-Sky Catalogue. Therefore, the first step for
our selected survey for GC in the whole SDSS footprint was to query the SDSS Galaxy
and the WISE All-Sky catalogues, via CasJobs on the SDSS website, for objects with
12.0 ≤ r0 ≤ 19.0, 0.3 ≤ (g− i)0 ≤ 1.1, (i−W1)0 ≤ 2.03, Photoz ≤ 0.13, andW2−W3 ≤ 3.1
for measurements of W2-W3, or ≤ 4.0 for upper limits. Since the footprint of the SDSS
contains ∼ 2.1x10⁸ galaxies of all magnitudes and colors, a huge number of objects
(∼ 4.21x10⁵) passed our first five selection criteria, still a sample too large to be inspected
visually in a reasonable time, and still containing a large component of galaxies. At this
point we introduced another cut, also discussed in Paper II, based on the color (NUV − g)0,
which demonstrated to be very useful for separating GCs from galaxies with large UV
fluxes, presumably because they contain many hot and luminous young stars. NUV is
the GALEX magnitude in its near UV band (λ effective = 2271 A) and g is the SDSS
g-band magnitude. This additional criterion is illustrated in Figure 4 with the same
sample of M31 GCs previously used (open circles) and the objects in the comparison region
(crosses and X’s) that passed the previous cuts, and could also be identified in the Galex
catalogue. The NUV measurements for many of the GCs were taken from the catalogue
of Kang et al. (2012). For the remaining clusters and for the whole samples of comparison
galaxies, we compared their positions with the objects in the GALEX catalogue that is
available through the GALEXview website and considered a match if their positions agreed
to ≤ 6.′′0. The average difference between the SDSS and GALEX positions was only 1.′′4,
with < 10% having differences > 3′′. Consequently, they are smaller than or, in the worse
cases, comparable to the NUV psf (5.′′3 to ∼ 8′′, Morrissey et al. (2007)). These results and

– 17 –
the relatively low density of GALEX sources on the sky (e.g., Bianchi et al. 2014), suggest
that very few of the objects drawn from the SDSS catalog were matched with the wrong
GALEX source. If more than one GALEX measurement was available for an object, we
computed the weighted average, using as weights one over the square of the error listed for
NUV. Using the sample of 122 GCs, we computed the 2-D kernel density and the dashed
contour in Figure 4 encompasses 90% of the density. The curve that separates most of the
comparison objects from the GCs is identical to the one plotted in Figure 2 of Paper II,
which had a larger sample of galaxies. While all 122 GCs lie below this curve and therefore
pass this last criterion, only 16 of the remaining comparison objects lie below, and none
of them could be classified as candidate GCs by visual inspection. After these tests, we
concluded that the combination of the selection criteria illustrated in Figures 3 and 4 could
reduce the number of objects to be visually examined to a small percentage of the initial
sample (∼ 1%), while retaining most of the GCs (96%), making feasible our planned survey
of the whole SDSS footprint. Therefore the second step, based on the color (NUV − g)0 of
our procedure was to query the GALEXview website for GALEX sources that matched the
positions of the objects (∼ 4.21x10⁵) that passed the WISE and Photoz cuts introduced in
the first step of the survey. We found approximately 3.17x10⁵ coincidences, and to these
objects we applied the cut based on the (NUV − g)0 color (Fig. 4). The objects that passed
this last cut, added to the ones that we could not find in GALEX, formed our final sample
of 183,791 objects to be visually inspected.
4. Application to the Globular Clusters in other Local Group Galaxies
The above criteria appear to be well tuned for separating the halo GCs of M31 from
galaxies, but do they also work for the GCs in the smaller galaxies of the LG, which may
be better analogues of the IGCs? To examine this question, we compiled similar data
– 18 –
on the GCs in the Fornax dSph galaxy, a satellite of the MW, in four satellites of M31
(M33, NGC 205, 147, 185), and in two dwarf irregular galaxies of the LG, NGC 6822 and
Wolf-Lundmark-Melotte (WLM). Because most of these galaxies do not lie in the SDSS
footprint, we could not include measurements of Photoz in this discussion. Moreover we did
not consider the GCs in the MW, the Magellanic Clouds, and the Sagittarius dSph galaxy
because they subtend such large angles on the sky that their measurement would require
substantially different techniques than we employ in our survey of the LG.
In the case of the Fornax dSph galaxy (d⊙ = 147±12 kpc), its GCs subtend moderately
large angles on the sky, with Rh values of 4.′′7, 6.′′4, 7.′′0, 10.′′9, and 18.′′7 for GCs F4, F3, F5,
F2, and F1, respectively (McLaughlin & van der Marel 2005). They provide a good test
of the effects of using magnitudes, such as the WISE and GALEX ones, which do not
capture all the light of an object. We computed the (i −W1)0 and W2-W3 colors using
both the profile-fitting WISE magnitudes, which we adopted for our survey, and the largest
WISE aperture, which is 24.′′75 in diameter. For the Fornax GCs, we could not find in
the literature measurements in the g or i pass-bands. Consequently, we made estimates
that are based on the V and B-V measurements of F2, F3, F4, and F5 by Gordon & Kron
(1983), on the values compiled for F1 by Harris & Racine (1979) and the reddening from
Mackey & Gilmore (2003). We then constructed a transformation between (B − V )0 and
(g − i)0 from measurements of M31 GCs in both colors.
In the diagrams of Figure 5 are plotted the Fornax GCs and the GCs in the other LG
galaxies of our sample. The contours are the ones calculated for Figures 3 and 4. For each
Fornax cluster, the colors formed by the profile-fitted WISE mag (filled circles) and the
largest WISE aperture (X’s) are plotted and joined by dashed lines. Given the large Rh of
F1, it is not surprising that with the profile-fitted W1 magnitude, (i−W1)0 lies far outside
the 90% contours that are defined by the sample of M31 GCs. F1 nonetheless passes our

– 19 –
(i−W1)0 criterion. Despite the fact that the Rh of F1 is significantly larger than the psfs of
W2 and W3, its W2-W3 color passes the cut when the profile fitting magnitudes are used.
The results obtained for other Fornax GCs with profile-fitting magnitudes are less deviant
than the ones for F1, and with the largest WISE apertures all 5 Fornax clusters lie within
or very close to 90% contours of the M31 sample. In the plot of (NUV − g)0 vs. (g − i)0,
all 5 Fornax clusters lie within the 90% contour despite their relatively large angular sizes.
Because Fornax is well within the boundary of the MW’s halo as defined by its satellite
galaxies (see McConnachie 2012), F1 may be larger in angular size than any IGC in the
LG, unless they are atypical GCs. None of the GCs in the more distant LG galaxies have
Rh > 10′′ (see refs. below). The test provided by the Fornax clusters in Figure 5 suggests
that the mismatches in the amounts of light included in the SDSS model magnitudes and
the WISE and GALEX magnitudes are unlikely to cause GCs to be missed by our selection
criteria.
Recent surveys of the dwarf irregular galaxy NGC 6822 (d⊙ = 459 ± 17 kpc) by
Hwang et al. (2011) and Huxor et al. (2013) have added 7 new GCs, bringing the total
known to 9. We could reliably place 6 of these clusters (HVII, C2, C3, C4, SC6, SC7) in
the diagrams that use WISE measurements and 4 of them (C2, C3, C4, SC7) in the one
that uses GALEX (solid triangles in Fig. 5). The other clusters are too contaminated by a
rich star field (HVIII), a nearby bright star (C1), or simply too faint (SC5) to be measured
by WISE and GALEX. The identification of HVII and SC6 in the GALEX catalog was
problematic because of other nearby sources. The above references provided the g and
i-band photometry and the reddening values that we used. For HVII, we estimated (g − i)0
from the (V − I)0 color that was listed by Hwang et al. (2011). The reddening is variable in
the direction of NGC 6822. Hwang et al. (2011) quote values of E(g − i) from 0.16 to 0.36
for the clusters in their study. The (g − i)0 color of C3 (Hwang et al. 2011) is exceptionally
red (1.35) for its metal-poor composition([Fe/H] = -1.61), which Hwang et al. (2014)

– 20 –
measured from its spectrum. C3 failed every one of our GC criteria because of its red color.
Our survey technique would have discovered 5 of the 9 clusters in NGC 6822, (or 56%).
This limited success should not be indicative of our search for IGCs in the LG because some
of the failures and omissions of the NGC 6822 clusters were caused by contamination from
other sources in this galaxy, and presumably IGCs are in less dense fields.
The other LG dwarf irregular galaxy with GCs is WLM (d⊙ = 933 ± 34 kpc), which
contains one luminous GC (MV ∼ −8.9). We estimated its (g − i)0 from the (V − I)0 color
measured by Billett et al. (2002). It is identified unambiguously in the WISE catalog, and
passed our criteria based on WISE measurements (open circle in Fig. 5). It was not found
by GALEX, presumably because of its proximity to other UV sources.
M33 (d⊙ = 809 ± 22 kpc), the spiral galaxy companion of M31, lies within the SDSS
footprint, although few of its GCs are in the SDSS Galaxy catalog because they are projected
on the dense star fields of this face-on galaxy. Using the lists of Sarajedini & Mancone
(2007); Huxor et al. (2009); Cockcroft et al. (2011), we identified 10 GCs in the SDSS
Galaxy catalog with reliable photometry, 7 of which are brighter than the r0 cutoff of our
survey and passed also our Photoz criterion. All 7(crosses in Fig. 5) passed the (i−W1)0,
and all but one (S in Cockcroft et al. 2011), passed the W2-W3 one. Five of the seven
clusters were identified in the GALEX catalogue, and all of them passed the (NUV − g)0
criterion.
Veljanoski et al. (2013) recently discovered new GCs in the M31 satellites NGC 147
(d⊙ = 676 ± 28 kpc) and NGC 185 (d⊙ = 617 ± 26 kpc) and provided g- and i-band
photometry, which we used for both the new and the previously known GCs. Of the 10
GCs now known in NGC 147, one (SD-GC10) is fainter than our r0 limit and another
(PA-N147-3) had to be excluded from our analysis because the g and i measurements for
it are only lower limits (see Veljanosky et al. 2013). Five were identified unambiguously in

– 21 –
the WISE catalog (Hodge I & III, SD-GC7, PA-N147-1 & 2) Two of the remaining GCs
(Hodge II & SD-GC5) appear to be confused with other sources, and the faint cluster
Hodge IV was not recognized by WISE, perhaps because of the high stellar density in its
field (see Veljanosky et al. 2013) . All 5 measured clusters (solid squares in Fig. 5) passed
the (i −W1)0 and W2-W3 criteria. Four of them were identified in the GALEX catalog,
and they all passed the (NUV − g)0 criterion.
In NGC 185 there are now 8 known GCs (Veljanoski et al. 2013), and 6 (FJJ-I, III, IV,
V, VII, PA-N185) were found in the WISE catalogue. FJJ-II lies in a dense stellar field,
and FJJ-V III appears to be blended with a nearby source. All of the 6 clusters with WISE
measurements (open triangles in Fig. 5) passed the (i−W1)0 criterion, but only 5 passed
the W2-W3 one. Two of them were identified in the GALEX catalog, FJJ-III and FJJ-V,
and one, FJJ-III, which lies close to the center of NGC 185, failed the (NUV −g)0 criterion.
The final dwarf galaxy, NGC 205 (d⊙ = 824 ± 27 kpc), is projected so close to M31
that there is some uncertainty whether a GC belongs to it or to the M31 halo. The GCs
near the center of NGC 205, which are among the most likely candidates for membership,
are of little use here because they lie in extremely dense star fields. We therefore selected
4 of the more remote clusters, which are also among the brightest: B009 (Hubble (H)-I),
B011 (H-II), B020 (H-III), and B317 (H-VIII). The B numbers are from the RBCv5, which
provided the optical photometry. All 4 passed the criteria based on (i−W1)0, W2-W3, and
(NUV − g)0 (asterisks in Fig. 5).
In summary, of the 42 GCs in the dwarf Local Group galaxies discussed above, 5 (12%)
are fainter than our r0 cutoff. We could not apply our survey techniques to another 8
clusters because of the crowding of images or the lack of g and i photometry. Twenty-nine
GCs had adequate data and 25 (86%) passed the survey criteria. If the GCs in these dwarf
galaxies are representative of the IGCs in the LG, then the majority of these IGCs should

– 22 –
pass our selection criteria prior to the final step of visual inspection.
5. Results of the Local Group Survey
As described in section 3, the color selections that are based on the SDSS, WISE, and
GALEX measurements reduced to 183,791 objects the initial sample of millions of objects
from the SDSS Galaxy Catalogue. This sample is expected to contain a large fraction of the
IGCs in the LG that are brighter than the r0 limit of 19.0, if the M31 GCs are good proxies
for them. The diagrams in Figure 2 suggest that ∼ 2% of the IGCs brighter than the cutoff
are missed by the star-galaxy separation at d⊙ ∼ 1100 kpc and that this decreases to ∼ 1%
at M31’s distance (783 kpc). Consequently, the r0 cutoff appears to be the more important
of these two limitations. It sets a lower limit on the luminosities of the IGCs that can be
detected, which scales, of course, with their distances, and it is MV ≤ −6 at the outer
boundary of the LG (see Fig. 2). The tests with the GCs in M31 (Figs. 3 & 4) and in the
LG dwarf galaxies (Fig. 5) suggest that a large fraction (≥ 86%) that are brighter than
the r0 cutoff pass the color selection techniques. It is harder to quantify the success our
visual inspections of the objects that pass these other criteria, particularly as a function of
distance. The resolution of the SDSS images, typically 1.′′4 seeing with 0.′′40 per pixel can
make uncertain the distinction between compact GCs and some galaxies at the distance of
M31 and beyond, even with the improvement of the image quality of the cutouts provided
by SDSS in its DR10 (see Ahn et al. 2014) over previous releases. This later improvement
would have reduced the larger misclassifications of candidate GCs that we made in our first
survey, which was based on DR8. Our present survey retrieved 84% of the known GCs
in M31 and M33 in the search area, which is our best estimate of the success rate of our
methods, including the visual inspection, at ∼ 70% of the radius of the LG.
The visual examination of the SDSS cutout images of the objects that passed all

– 23 –
other criteria yielded a surprisingly small list of 17 potential new GC candidates. Five of
them appeared enough resolved in the SDSS images that we could classify them as high
confidence candidates. Because they are near M31, we were able to locate them in g, r,
or i band images taken with the MegaPrime camera of the CFHT and publicly available
through the Canadian Astronomy Data Centre (CADC). These images are deeper and of
higher resolution, typically 0.′′8 seeing with 0.′′19 per pixel. With these new images, we were
able to confirm as GCs all 5 of our high confidence objects. Table 1 provides the positions
of these new GCs and the data by which they were selected. The SDSS r-band thumbnail
images of these GCs are shown in Figure 6. These faint GCs may have escaped detection
until now because they are not within the areas covered by Hubble Space Telescope (HST)
images and because they lie at smaller Rgc than the inner boundary (∼ 25 kpc) of the
PAandAS survey, which employed MegaPrime imaging.
To take advantage of the better resolution of the DR10 cutout images and also of the
photometric selection criteria that are presented in this paper, we revisited the lists of high
and lower confidence GCs provided in our first two surveys (Paper I & II). Most of the high
confidence objects (tables 1 of Paper I & II) passed the new selection criteria, but only three
of the lower confidence objects in table 2 of Paper I passed. We then visually inspected
this reduced sample through the new cutouts of SDSS DR10. The ones that we reclassified
as higher confidence candidates could be confirmed as GCs by our visual inspection of the
MegaPrime images from the CADC archive. Some of them were later confirmed also by the
PAndAS search (Huxor et al. 2014). Table 2 is the updated list of our newly discovered
and confirmed GCs from the SDSS Galaxy Catalogue. This list is comprehensive of our
3 surveys and counts 22 GCs, including several with Rgc > 100 kpc. It lists the positions
of the clusters, their reddening corrected values of r and g-i (from the model magnitudes
and extinctions listed in the SDSS), their absolute r magnitudes (Mr), their half-light radii
(Rh), and their projected distances from M31 (Rgc). The values of Rh were estimated from

– 24 –
the r-band light profiles provided by the SDSS, and they give rough estimates of the sizes
of the clusters (see Paper I).
The 12 remaining candidates that we could not confirm as GCs are listed in Table
3, with their positions, photometric data, and angular sizes of Rh. Their SDSS r-band
thumbnail images are shown in Figure 7. The distribution on the sky of these 12 candidate
GCs is shown in the Hammer projection of Figure 8. There is no evidence for a concentration
in a particular region of the sky. None of them is in close proximity to the galaxies in or
near the LG. Two of them, C1 and C9, appear in Figure 8 to be close to the dwarf galaxies
IC1613 and KKR-25, respectively, but in each case, the angular separation is > 3 deg and
many times the Rh of the galaxy given by McConnachie (2012).
6. Application to the M81 Group of Galaxies
Our survey area covers many of the galaxies of the M81 group of galaxies, including
M81, M82, and NGC3077, which have interacted with each other recently and are enclosed
in a common envelop of HI gas (Chynoweth et al. 2008). At distance of ∼ 3.6 Mpc
Karachentsev et al. (2013), the M81 group is far from the LG, but nonetheless our survey
techniques can identify the most luminous GCs as GC candidates. The two clusters that
Jang et al. (2012) identified in the images of the HST Advanced Camera for Surveys
(ACS), pass all our photometric criteria (filled triangles in Fig. 9). Since the M81 GCs are
resolved into stars only on deep images with the HST (see Nantais et al. 2011), our visual
examination of the SDSS images could simply reveal if an object was obviously a galaxy
or if its image resembled those of the two clusters in Jang et al. (2012). Over the area of
the sky around the M81 group defined by 143.◦0 ≤ RA ≤ 159.◦0 and 64.◦0 ≤ DEC ≤ 71.◦0,
we lowered the r0 limit of our survey to 20.0. The SDSS footprint covers about 80% the
region enclosed by the above coordinates and has an odd shape with the peculiar galaxy

– 25 –
M82 near its northern boundary. Many GCs at the distance of the M81 group are likely to
be indistinguishable from stars in the SDSS images (see Perelmuter & Racine 1995), and
these clusters will not be listed in the SDSS Galaxy Catalogue. However, if the GCs in the
M81 group resemble the M31 GCs, ∼ 50% of the most luminous ones (MV ≤ −7.8) will
be non-stellar according to the SDSS criterion (see Fig. 2). The presence in the Galaxy
Catalogue of the two luminous GCs identified by Jang et al. (2012) is consistent with this
expectation. The objects that we identify as GC candidates in the M81 group are plotted
in Figure 9 (open circles) and listed in table 4, where we have also listed their photometry
and projected distances from M81. M81-C3, M81-C4, and M81-C5 are closer to the galaxies
M82, NGC3077, and BK6N, respectively, than to M81, and may be physically related to
them. Two of our candidate GCs, M81-C1 and M81-C2, are listed as 90262 and 50016 in
Perelmuter & Racine (1995) catalogue of 3774 objects within 25 arcmin of M81. Neither
one appears to have been investigated since then. The brighter of the two, M81-C2, which
is also closest to M81, lies within the fields of 2000s and 800s exposures in the F300W
pass-band with the HST’s wide-field and planetary camera 2 (WFPC2). Our inspection of
these images did not reveal any signs that M81-C2 is a galaxy. The GC 1029 (Nantais et al.
2011), which is the most luminous one known in M81 (see Mayya et al. 2013), is very
resolved into stars on F814W images with the HST ACS, but not obviously in a 6300s
exposure with the WFPC2 in the F300W filter. Consequently, the fact that M81-C2 is not
clearly a GC in the F300W WFPC2 images does not rule it out as a candidate.
7. Conclusions
This survey for GCs in the LG has identified 5 new GCs in the halo of M31 (see Table
1). Their properties do not appear to be exceptional, and their discovery suggests that the
census of GCs in M31 may be still incomplete. The searches of the SDSS Galaxy Catalogue
– 26 –
for GCs described here and in Papers I & II have yielded a total of 22 new GCs near M31
(see Table 2). These clusters span a wide range of Rgc (10-137 kpc), but even the most
remote ones are likely to be members of M31’s halo. It is possible that measurements of
their radial velocities and 3-D distances from M31 could reveal that some are not bound to
it and are IGCs.
Of all the objects that passed our 5 selection criteria for GCs and our visual inspection,
only 12 are so far from M31 that they may be IGCs in the LG (see Table 3). While they
resemble GCs in the SDSS imaging (see Fig. 7), there is still the possibility that they
are galaxies, and we consider them to be only GC candidates. These objects need to be
investigated in more detail to see if they are truly GCs.
This sample of candidate IGCs in the LG is clearly incomplete because our survey has
covered only about one-third of the sky (see Fig. 8), and we intend to expand the search in
the southern sky. Moreover, some IGCs could have escaped our detection because they are
hidden by obscuration near the Galactic Plane, blended with other objects, or fainter than
our magnitude limit, which at the outer reaches of the LG excludes GCs with MV ≥ −6
(see Fig. 2). Also, as mentioned previously, about 15% of the known GCs fail our selection
criteria. Even with these caveats, our survey suggests that the LG does not appear to have
a large population of IGCs, independently of their possible origin.
We gratefully acknowledge the technical support provided by Gabriele Zinn throughout
this project, which greatly facilitated its completion. This research has been supported by
NSF grant AST-1108948 to Yale University. This project would not have been possible
without the public release of the data from the Sloan Digital Sky Survey III and the very
useful tools that the SDSS has provided for accessing and examining the publically released
data. Funding for SDSS-III has been provided by the Alfred P. Sloan Foundation, the
Participating Institutions, the National Science Foundation, and the U.S. Department of

– 27 –
Energy Office of Science. The SDSS-III web site is http://www.sdss3.org/.
SDSS-III is managed by the Astrophysical Research Consortium for the Participating
Institutions of the SDSS-III Collaboration including the University of Arizona, the
Brazilian Participation Group, Brookhaven National Laboratory, University of Cambridge,
Carnegie Mellon University, University of Florida, the French Participation Group, the
German Participation Group, Harvard University, the Instituto de Astrofisica de Canarias,
the Michigan State/Notre Dame/JINA Participation Group, Johns Hopkins University,
Lawrence Berkeley National Laboratory, Max Planck Institute for Astrophysics, Max
Planck Institute for Extraterrestrial Physics, New Mexico State University, New York
University, Ohio State University, Pennsylvania State University, University of Portsmouth,
Princeton University, the Spanish Participation Group, University of Tokyo, University of
Utah, Vanderbilt University, University of Virginia, University of Washington, and Yale
University.
This publication makes use of data products from the Wide-field Infrared Survey
Explorer, which is a joint project of the University of California, Los Angeles, and the
Jet Propulsion Laboratory/California Institute of Technology, funded by the National
Aeronautics and Space Administration. It also used observations made by the Galaxy
Evolution Explorer satellite, which were obtained through the GALEXview website.
This research used the facilities of the Canadian Astronomy Data Centre operated by
the National Research Council of Canada with the support of the Canadian Space Agency.
– 28 –
REFERENCES
Abadi, M. G., Navarro, J. F., Steinmetz, M., & Eke, V. R. 2003, ApJ, 591, 499
Abell, G. O. 1955, PASP, 67, 258
Ahn, C. P. et al. 2014, ApJS, 211, 17
Alamo-Martınez, K. A. et al. 2013, ApJ, 775, 20
Ashman, K. M., & Zepf, S. E. 1992, ApJ, 384, 50
Bate, N. F. et al. 2014, MNRAS, 437, 3362
Bekki, K., & Yahagi, H. 2006, MNRAS, 372, 1019
Belokurov, V., Irwin, M. J., Koposov, S. E., Evans, N. W., Gonzalez-Solares, E., Metcalfe,
N., & Shanks, T. 2014, MNRAS, 441, 2124
Bianchi, L., Conti, A., & Shiao, B. 2014, Advances in Space Research, 53, 900
Billett, O. H., Hunter, D. A., & Elmegreen, B. G. 2002, AJ, 123, 1454
Bland-Hawthorn, J., & Freeman, K. 2014, The Origin of the Galaxy and Local Group,
Saas-Fee Advanced Course, Volume 37. ISBN 978-3-642-41719-1. Springer-Verlag
Berlin Heidelberg, 2014, p. 1, 37, 1
Bullock, J. S., & Johnston, K. V. 2005, ApJ, 635, 931
Caldwell, N., Strader, J., Romanowsky, A. J., Brodie, J. P., Moore, B., Diemand, J., &
Martizzi, D. 2014, ApJ, 787, L11
Chynoweth, K. M., Langston, G. I., Yun, M. S., Lockman, F. J., Rubin, K. H. R., & Scoles,
S. A. 2008, AJ, 135, 1983

– 29 –
Cockcroft, R. et al. 2011, ApJ, 730, 112
Cole, D. R., Dehnen, W., Read, J. I., & Wilkinson, M. I. 2012, MNRAS, 426, 601
Conroy, C., Loeb, A., & Spergel, D. N. 2011, ApJ, 741, 72
Conroy, C., & Spergel, D. N. 2011, ApJ, 726, 36
Cutri, R. M. et al. 2011, Explanatory Supplement to the WISE Preliminary Data Release
Products, Tech. rep.
di Tullio Zinn, G., & Zinn, R. 2013, AJ, 145, 50
—. 2014, AJ, 147, 90
Elmegreen, B. G., Malhotra, S., & Rhoads, J. 2012, ApJ, 757, 9
Fardal, M. A. et al. 2013, MNRAS, 434, 2779
Galleti, S., Federici, L., Bellazzini, M., Fusi Pecci, F., & Macrina, S. 2004, A&A, 416, 917
Garrison-Kimmel, S., Boylan-Kolchin, M., Bullock, J. S., & Lee, K. 2014, MNRAS, 438,
2578
Gill, S. P. D., Knebe, A., & Gibson, B. K. 2005, MNRAS, 356, 1327
Gordon, K. C., & Kron, G. E. 1983, PASP, 95, 461
Gregg, M. D. et al. 2009, AJ, 137, 498
Harris, W. E., & Pudritz, R. E. 1994, ApJ, 429, 177
Harris, W. E., & Racine, R. 1979, ARA&A, 17, 241
Huxor, A., Ferguson, A. M. N., Barker, M. K., Tanvir, N. R., Irwin, M. J., Chapman, S. C.,
Ibata, R., & Lewis, G. 2009, ApJ, 698, L77

– 30 –
Huxor, A. P., Ferguson, A. M. N., Veljanoski, J., Mackey, A. D., & Tanvir, N. R. 2013,
MNRAS, 429, 1039
Huxor, A. P. et al. 2014, MNRAS, 442, 2165
Huxor, A. P., Tanvir, N. R., Ferguson, A. M. N., Irwin, M. J., Ibata, R., Bridges, T., &
Lewis, G. F. 2008, MNRAS, 385, 1989
Hwang, N., Lee, M. G., Lee, J. C., Park, W.-K., Park, H. S., Kim, S. C., & Park, J.-H.
2011, ApJ, 738, 58
Hwang, N., Park, H. S., Lee, M. G., Lim, S., Hodge, P. W., Kim, S. C., Miller, B., & Weisz,
D. 2014, ApJ, 783, 49
Ibata, R., Nipoti, C., Sollima, A., Bellazzini, M., Chapman, S. C., & Dalessandro, E. 2013,
MNRAS, 428, 3648
Jang, I. S., Lim, S., Park, H. S., & Lee, M. G. 2012, ApJ, 751, L19
Kang, Y., Rey, S.-C., Bianchi, L., Lee, K., Kim, Y., & Sohn, S. T. 2012, ApJS, 199, 37
Karachentsev, I. D., Makarov, D. I., & Kaisina, E. I. 2013, AJ, 145, 101
Kazantzidis, S., Lokas, E. L., & Mayer, L. 2013, ApJ, 764, L29
Keller, S. C., Mackey, D., & Da Costa, G. S. 2012, ApJ, 744, 57
Koposov, S. et al. 2007, ApJ, 669, 337
Kravtsov, A. V., & Gnedin, O. Y. 2005, ApJ, 623, 650
Laevens, B. P. M. et al. 2014, ApJ, 786, L3
Law, D. R., & Majewski, S. R. 2010, ApJ, 718, 1128

– 31 –
Lee, M. G., Park, H. S., & Hwang, H. S. 2010, Science, 328, 334
Mackey, A. D. et al. 2010, MNRAS, 401, 533
Mackey, A. D., & Gilmore, G. F. 2003, MNRAS, 340, 175
—. 2004, MNRAS, 355, 504
Madore, B. F., & Arp, H. C. 1979, ApJ, 227, L103
Maraston, C. 1998, MNRAS, 300, 872
—. 2005, MNRAS, 362, 799
Martin, N. F., Ibata, R. A., Irwin, M. J., Chapman, S., Lewis, G. F., Ferguson, A. M. N.,
Tanvir, N., & McConnachie, A. W. 2006, MNRAS, 371, 1983
Martin, N. F. et al. 2013a, ApJ, 779, L10
—. 2013b, ApJ, 772, 15
Mashchenko, S., & Sills, A. 2005, ApJ, 619, 258
Mayer, L., Governato, F., Colpi, M., Moore, B., Quinn, T., Wadsley, J., Stadel, J., & Lake,
G. 2001, ApJ, 559, 754
Mayya, Y. D., Rosa-Gonzalez, D., Santiago-Cortes, M., Rodrıguez-Merino, L. H., Vega, O.,
Torres-Papaqui, J. P., Bressan, A., & Carrasco, L. 2013, MNRAS, 436, 2763
McConnachie, A. W. 2012, AJ, 144, 4
McLaughlin, D. E., & van der Marel, R. P. 2005, ApJS, 161, 304
Morrissey, P. et al. 2007, ApJS, 173, 682
Nantais, J. B., Huchra, J. P., Zezas, A., Gazeas, K., & Strader, J. 2011, AJ, 142, 183
– 32 –
Peebles, P. J. E. 1984, ApJ, 277, 470
Peng, E. W. et al. 2011, ApJ, 730, 23
Perelmuter, J.-M., & Racine, R. 1995, AJ, 109, 1055
Sales, L. V., Navarro, J. F., Abadi, M. G., & Steinmetz, M. 2007, MNRAS, 379, 1475
Samsing, J. 2015, ApJ, 799, 145
Sarajedini, A., & Mancone, C. L. 2007, AJ, 134, 447
Schiavon, R. P., Caldwell, N., Morrison, H., Harding, P., Courteau, S., MacArthur, L. A.,
& Graves, G. J. 2012, AJ, 143, 14
Schweizer, F. 1987, in Nearly Normal Galaxies. From the Planck Time to the Present, ed.
S. M. Faber, 18–25
Stoughton, C. et al. 2002, AJ, 123, 485
Teyssier, M., Johnston, K. V., & Kuhlen, M. 2012, MNRAS, 426, 1808
Veljanoski, J. et al. 2013, MNRAS, 435, 3654
—. 2014, MNRAS, 442, 2929
West, M., & Gregg, M. 2014, in American Astronomical Society Meeting Abstracts, Vol.
223, American Astronomical Society Meeting Abstracts, #106.03
West, M. J., Jordan, A., Blakeslee, J. P., Cote, P., Gregg, M. D., Takamiya, M., & Marzke,
R. O. 2011, A&A, 528, A115
Whitmore, B. C., & Schweizer, F. 1995, AJ, 109, 960

– 33 –
Zinn, R. 1993, in Astronomical Society of the Pacific Conference Series, Vol. 48, The
Globular Cluster-Galaxy Connection, ed. G. H. Smith & J. P. Brodie, 38
Zolotov, A., Willman, B., Brooks, A. M., Governato, F., Brook, C. B., Hogg, D. W., Quinn,
T., & Stinson, G. 2009, ApJ, 702, 1058
This manuscript was prepared with the AAS LATEX macros v5.2.
– 34 –
Fig. 1.— A Hammer projection of the sky with equatorial coordinates showing the area of
our survey (gray shading), the Galactic Center (solid circle) and Plane (solid curve), M31 and
M33 (open triangles), MW satellites (squares), M31 satellites (dots), the other LG galaxies
(X’s), and galaxies near the LG (circles).

– 35 –
Fig. 2.— The effects of the star-galaxy separation and the magnitude limit on the surveys
is illustrated using a sample on 168 GCs in M31. The open histogram in each diagram is
the luminosity distribution of the whole sample. The solid histograms are the GCs that are
non-stellar according to the criterion used by the SDSS (see text) and are brighter than the
listed r0 limit, at the assumed mean distance (<d>). Top: M31’s distance, middle: the
outer boundary of the LG, and bottom: the distance of the M81 group.

– 36 –
Fig. 3.— The selection criteria that were used in the automated part of our survey are
illustrated using 122 GCs in the halo of M31 (circles) and the galaxies (X’s) in a 4 deg2
test region of our LG survey. The dashed contours in each diagram enclose 90% of the 2-D
density of the GCs (see text). The whole sample of GC’s is plotted in each diagram. The
whole sample of galaxies is plotted in the top diagram, but only the ones within the rectangle
in the top diagram are plotted in the middle diagram. Likewise, only the galaxies within the
rectangle in the middle diagram are plotted in the bottom diagram. In the bottom diagram,
the solid circles and the X’s represent GCs and galaxies, respectively, that have measured
W2-W3, while the open circles and crosses are the upper limits on W2-W3 for other GCs
and galaxies, respectively. The lines at W2-W3 = 3.1 (solid) and 4.0 (dashed) are the cuts
for measured and upper limit values, respectively. Note that Photoz is used as a color index
and not a measure of redshift for the GCs.

– 37 –
Fig. 4.— The sample of 122 M31 GCs (open circles) are used to illustrate the criterion that
is based on the color formed by the GALEX NUV and the SDSS g magnitudes. The dashed
contour encloses 90% of the density of GCs. The X’s and crosses are the galaxies that passed
the cuts for measured and upper limit values of W2-W3 in Figure 3. The area enclosed by
the curve and the vertical lines define the criterion used to select GC candidates.

– 38 –
Fig. 5.— The GCs in LG dwarf galaxies are plotted in the diagrams used to select GC
candidates. The GCs in the Fornax dSph galaxy, which are labeled, are plotted with the
WISE profile fitted magnitudes (solid circles) and the magnitude in the largest WISE aper-
ture (X’s), with a dashed line connecting the two. WISE profile fitted magnitudes are used
for GCs in NGC 6822 (solid triangles), WLM (open circle), M33 (crosses), NGC 147 (solid
squares), NGC 185 (open triangles), and NGC 205 (asterisks). The dashed contours are the
same as the ones plotted in Figures 3 and 4, and they enclose 90% of the density of M31
GCs.

– 39 –
Fig. 6.— The r-band SDSS images of the newly discovered GCs in M31 (see Table 1). North
is at the top, and East is to the left. Each image is approximately 25” by 30”.
Fig. 7.— The r-band SDSS images of the candidate IGCs in the Local Group (see Table 3).
North is at the top, and East is to the left. Each image is approximately 35” by 30”.

– 40 –
Fig. 8.— A Hammer projection of the sky with equatorial coordinates. The candidate IGCs
in the LG are plotted as asterisks. The rest of the symbols are the same as Figure 1.

– 41 –
Fig. 9.— The candidate GCs in the M81 Group (open circles) and the two GCs identified by
Jang et al (2012) (solid triangles) are plotted in the 4 diagrams that are used to distinguish
GC candidates from galaxies (see Figures 3 & 4). The dashed contours are they same ones
that are plotted in Figures 3, 4, & 5, and they enclose 90% of the density of M31 GCs.

–42
–
Table 1. New M31 Globular Clusters
Name R.A. Decl. r0 (NUV − g)0 (g − i)0 (i−W1)0 W2−W3a Photozb
(deg J2000) (deg J2000) (mag) (mag) (mag) (mag) (mag)
dTZZ-06 9.48287 41.30932 18.82±0.03 2.62±0.08 0.72±0.06 1.11±0.15 3.63 0.043±0.032
dTZZ-08 9.63313 39.86855 18.22±0.01 4.69±0.27 1.01±0.02 1.59±0.06 3.28 0.088±0.051
dTZZ-09 9.75310 41.23024 17.89±0.01 3.89±0.07 0.81±0.03 1.04±0.08 3.54 0.119±0.046
dTZZ-13 11.43322 42.65674 18.90±0.02 3.84±0.16 1.04±0.03 2.02±0.07 3.79 0.050±0.019
dTZZ-14 11.59881 42.60960 18.92±0.02 · · · 1.02±0.04 1.05±0.14 3.62 0.078±0.034
Note. — (i−W1)0 and W2−W3 are on the Vega system. All other magnitudes are on the AB system.
aUpper limits
bPhotoz is used as a color index, not as a measure of redshift.

– 43 –
Table 2. Updated List of Newly Discovered M31 GCs in the SDSS Catalogue
Cluster Previousa R. A. Decl. r0 (g − i)0 Mr Rh Rgc Confirmation
Name Name (deg J2000) (deg J2000) (mag) (mag) (mag) (pc) (kpc)
dTZZ-01 A 5.14119 36.65953 17.44 0.82 -7.0 8.5 86 b.c
dTZZ-02 B 6.71750 38.74947 15.99 0.69 -8.5 4.2 54 b,c
dTZZ-03 C 7.86467 39.53942 17.33 0.68 -7.1 4.1 38 b,c
dTZZ-04 SDSS1 9.00774 40.49723 17.36 1.08 -7.1 10.5 20 b,c
dTZZ-05 D 9.03580 39.29165 17.24 0.73 -7.2 4.1 32 b
dTZZ-06 · · · 9.48287 41.30932 18.82 0.72 -5.6 9.7 12 b
dTZZ-07 E 9.61483 40.65835 18.26 1.01 -6.2 5.6 14 b
dTZZ-08 · · · 9.63313 39.86855 18.22 1.01 -6.2 5.1 22 b
dTZZ-09 · · · 9.75310 41.23024 17.89 0.81 -6.6 6.3 10 b
dTZZ-10 SDSS3 9.80443 41.70220 18.25 1.08 -6.2 5.9 11 b,c
dTZZ-11 SDSS4 10.32496 42.77124 17.71 1.14 -6.8 7.2 21 b,c
dTZZ-12 SDSS6 10.61489 39.92444 18.51 0.93 -6.0 7.1 18 b,c
dTZZ-13 · · · 11.43322 42.65674 18.90 1.04 -5.6 4.7 20 b
dTZZ-14 · · · 11.59881 42.60960 18.92 1.02 -5.5 6.3 21 b
dTZZ-15 SDSS8 12.65142 42.53047 18.57 1.10 -5.9 9.1 26 b,c
dTZZ-16 SDSS9 13.41490 42.58747 17.20 0.66 -7.3 7.2 33 b,c
dTZZ-17 SDSS11 14.73495 42.46061 15.61 0.70 -8.9 4.0 44 b,c
dTZZ-18 SDSS12 18.19590 42.42356 16.88 0.74 -7.6 5.0 78 b,c
dTZZ-19 SDSS15 20.76470 41.91971 16.77 0.70 -7.7 4.0 103 b,c
dTZZ-20 C62 21.94838 40.67996 18.71 0.76 -5.8 11.3 116 b,c
dTZZ-21 G 22.20478 47.07277 16.98 0.81 -7.5 6.1 137 b,d
dTZZ-22 SDSS16 22.25898 40.78570 18.25 0.83 -6.2 6.6 119 b,c
aName used in Paper I or II.
Note. — Confirmation key: b = our visual inspection of MegaPrime images, c = Huxor et al. (2014), d = Huxor, A. (private
communication).

–44
–
Table 3. Candidate Intergalactic Globular Clusters in the Local Group
Name R.A. Decl. r0 (NUV − g)0 (g − i)0 (i −W1)0 (W2−W3 Photoz Rh
(deg J2000) (deg J2000) (mag) (mag) (mag) (mag) (mag) (arcsec)
dTZZ-C01 13.61358 4.18373 18.72±0.08 1.68±0.06 0.31±0.12 1.46±0.17 2.78a 0.041±0.025 2.7
dTZZ-C02 17.34474 -5.91597 18.08±0.04 · · · 0.73±0.04 1.67±0.06 2.82a 0.072±0.075 3.4
dTZZ-C03 31.37672 6.77809 17.84±0.01 1.98±0.14± 0.46±0.02 1.31±0.06 3.30a 0.034±0.010 2.1
dTZZ-C04 37.649609 46.31996 17.25±0.01 2.29±0.20 0.85±0.02 1.22±0.05 3.02±0.33 0.071±0.041 3.2
dTZZ-C05 102.15198 -18.38880 17.71±0.04 · · · 0.69±0.07 1.19±0.10 3.84a 0.100±0.057 2.7:
dTZZ-C06 120.87215 13.07730 18.20±0.01 · · · 0.85±0.03 1.70±0.07 3.95a 0.067±0.029 2.2
dTZZ-C07 152.40421 61.26622 18.53±0.03 2.01±0.07 0.60±0.05 0.19±0.20 3.57a 0.047±0.037 2.1
dTZZ-C08 238.65523 12.92038 18.00±0.01 1.47±0.10 0.37±0.03 0.91±0.11 3.94a 0.035±0.019 2.1
dTZZ-C09 250.07475 54.96822 17.66±0.01 3.78±0.45 0.93±0.01 1.41±0.03 2.30a 0.074±0.036 2.4
dTZZ-C10 255.93616 38.79727 18.02±0.01 2.89±0.08 0.93±0.02 1.90±0.04 2.58±0.39 0.068±0.028 1.2
dTZZ-C11 313.82498 54.71283 15.51±0.01 · · · 0.85±0.02 1.56±0.03 1.14a 0.079±0.051 1.3
dTZZ-C12 343.69748 17.43929 18.08±0.02 · · · 0.63±0.03 1.36±0.08 3.90a 0.067±0.016 2.8
aUpper limit
Note. — Photoz is used as a color index and not a measure of redshift.

–45
–
Table 4. Candidates and Globular Clusters in the M81 Group
Name R.A. Decl. r0 (NUV − g)0 (g − i)0 (i−W1)0 W2−W3a Photoz Rgcb
(deg J2000) (deg J2000) (mag) (mag) (mag) (mag) (mag) (kpc)
M81-C1 148.10805 68.80711 19.22±0.02 1.84±0.03 0.54±0.03 1.89±0.10 3.99 0.049±0.014 24
M81-C2 148.57085 68.92275 17.37±0.02 3.24±0.03 0.76±0.01 1.46±0.04 2.24 0.046±0.024 12
M81-C3 149.52321 69.57946 18.46±0.01 3.20±0.04 0.68±0.02 1.57±0.08 3.96 0.041±0.026 36
M81-C4 151.32164 68.77572 18.51±0.01 3.82±0.32 0.84±0.02 1.08±0.11 3.61 0.073±0.031 58
M81-C5 158.17458 65.70965 17.99±0.01 2.92±0.10 0.79±0.01 1.74±0.04 3.11 0.060±0.020 309
GC-1c 148.35931 69.52164 18.26±0.01 3.36±0.05 0.76±0.02 1.14±0.09 3.75 0.037±0.021 31
GC-2c 148.33411 69.65462 17.31±0.01 3.29±0.03 0.81±0.01 1.23±0.05 2.45 0.067±0.030 39
aUpper limit
bProjected distance from M81.
cKnown globular cluster (Jang et al. 2012)
Note. — Photoz is used as a color index and not a measure of redshift.


![Sobre La Guerra [Zinn]](https://img.dokumen.tips/doc/110x75/577cc4101a28aba71198015c/sobre-la-guerra-zinn.jpg)