Embed Size (px)
Citation preview

8/2/2019 Gravity Load Collapse of Building Frames During Earthquakes
http://slidepdf.com/reader/full/gravity-load-collapse-of-building-frames-during-earthquakes 1/22
Gravity Load Collapse of Building Frames during Earthquakes
J. P. Moehle, K. J. Elwood, H. Sezen
Pacific Earthquake Engineering Research Center, UC Berkeley
Synopsis:
Earthquake reconnaissance has identified failure of reinforced concrete columns as a primary
cause of collapse of older existing reinforced concrete building frames during earthquakes.
Apparent column failure, however, does not always result in building collapse. A study of
columns tested in the laboratory examines loss of lateral and vertical load capacities.
Correlations with geometric, materials, and loading characteristics are identified.
Keywords:
Reinforced concrete; Buildings; Columns; Shear; Axial Load; Collapse; Design; Earthquakes;
Experimentation
8/2/2019 Gravity Load Collapse of Building Frames During Earthquakes
http://slidepdf.com/reader/full/gravity-load-collapse-of-building-frames-during-earthquakes 2/22
INTRODUCTION
Before the introduction of special requirements in the 1970s, reinforced concrete building
frames constructed in zones of high seismicity in the US had details and proportions similar to
frames designed primarily for gravity loads. Columns generally were not designed to havestrengths exceeding beam strengths, so column failure mechanisms often prevail. Relatively
wide spacing of transverse reinforcement was common, such that column failures may involve
some form of shear or flexure-shear failure. As shear failure proceeds, degradation of the
concrete core may lead to loss of axial load carrying capacity of the column. As the axial
capacity diminishes, the gravity loads carried by the column must be transferred to neighboring
elements. A rapid loss of axial capacity will result in the dynamic redistribution of internal
actions within the building frame and may progressively lead to collapse. This sequence is the
focus of the ongoing study reported here.
Particular incentive for this research has been provided by the experience of engineers
involved in the seismic retrofit of buildings in California. Many have found, using prevailing
rehabilitation methodologies, that it is not economically feasible to limit the building design
displacements such that the columns are protected from shear failure. Thus, there is a need to
improve understanding of column shear strength, as well as to understand how the gravity
loads will be supported after a column fails in shear.
Reconnaissance of recent earthquakes provides evidence of the importance of column shear
failure on collapse, as well as the possibility that shear failure of individual columns need not
lead to collapse of the building. Laboratory experiments provide corroborating evidence, and
suggest improvements to methods for estimating shear strength and deformation at loss of
gravity load capacity. This paper summarizes the findings and the status of ongoing studies.
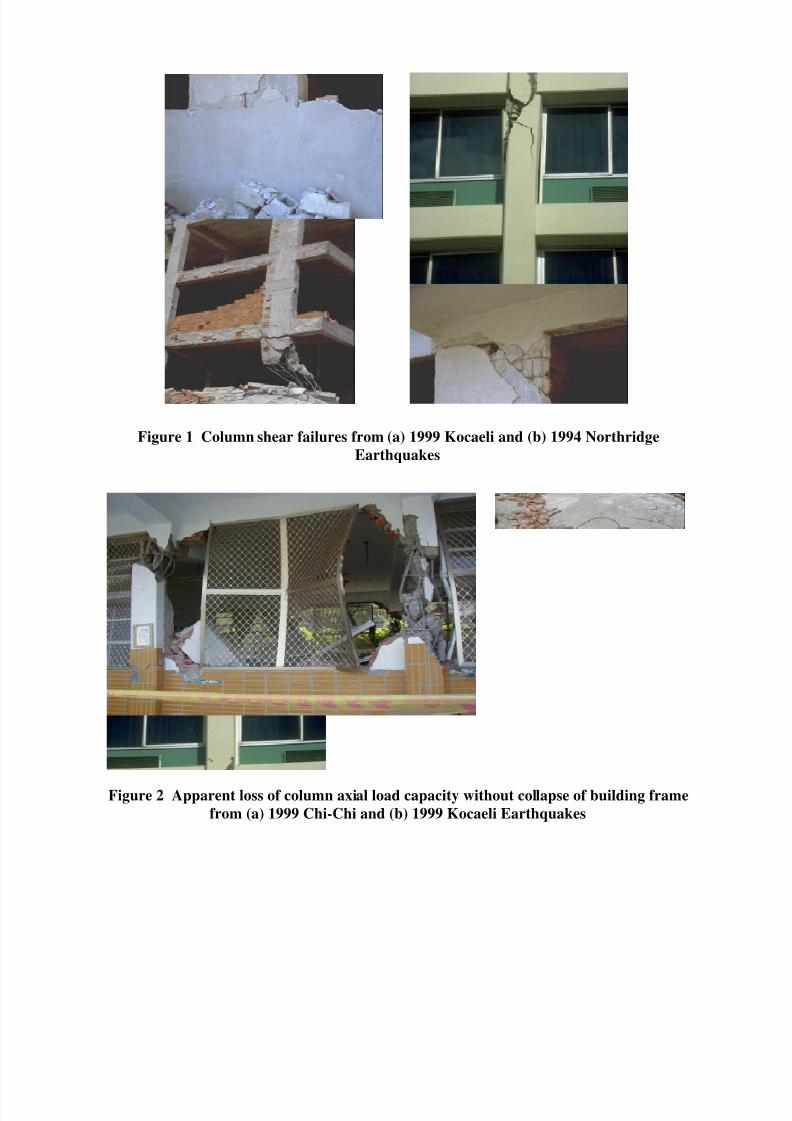
OBERSERVATIONS FROM EARTHQUAKES
Earthquakes [Northridge, 1994; Kobe, 1995; Kocaeli, 1999; Chi-Chi, 1999; and others]
have demonstrated that columns in older reinforced concrete building frames may be
vulnerable to shear failures (Figure 1). While several experimental programs have illustrated
that the lateral resistance of these columns is limited after shear failure, the residual axial
8/2/2019 Gravity Load Collapse of Building Frames During Earthquakes
http://slidepdf.com/reader/full/gravity-load-collapse-of-building-frames-during-earthquakes 3/22
capacity and stiffness have not been adequately investigated. Methods for reliably assessing
the conditions under which axial load capacity is exhausted have not been identified.
In many cases, column damage in recent earthquakes has all but eliminated their axial
capacity, yet the building has not collapsed (Figure 2). These examples illustrate the need to
consider the whole system when evaluating a building for the collapse limit state. Mechanisms
that may contribute to the capacity of a system to resist collapse include:
• catenary action of slabs and beams allowing gravity loads to span to adjacent elements,
• vierendeel truss action from the moment frame above a damaged column, and
• gravity load support provided by shear walls or non-structural elements such as
partitions and infills.
Some gravity load collapses during earthquakes can be attributed to shear failure, and the
subsequent loss of axial load carrying capacity, of multiple columns in a single story (Figure
3). The story-wide failures may be the result of massive internal redistribution of internal
forces, possibly amplified by dynamic effects; however, the specific mechanisms leading to
gravity load collapse of reinforced concrete frames are not well understood.
TEST ON LIGHTLY-CONFINED BUILDING COLUMNS
The literature of earthquake engineering documents a large number of simulated earthquake
tests of columns representative of older existing building frames. In almost all cases, though,
the reports provide unconvincing or incomplete results. Whereas tests of nearly full-scale
columns under realistic loading and boundary conditions were sought, almost all tests were on
smaller-scale columns tested as cantilevers. Furthermore, tests characteristically were
discontinued after lateral load failures were observed, regardless of whether axial load
capacity had been exhausted.
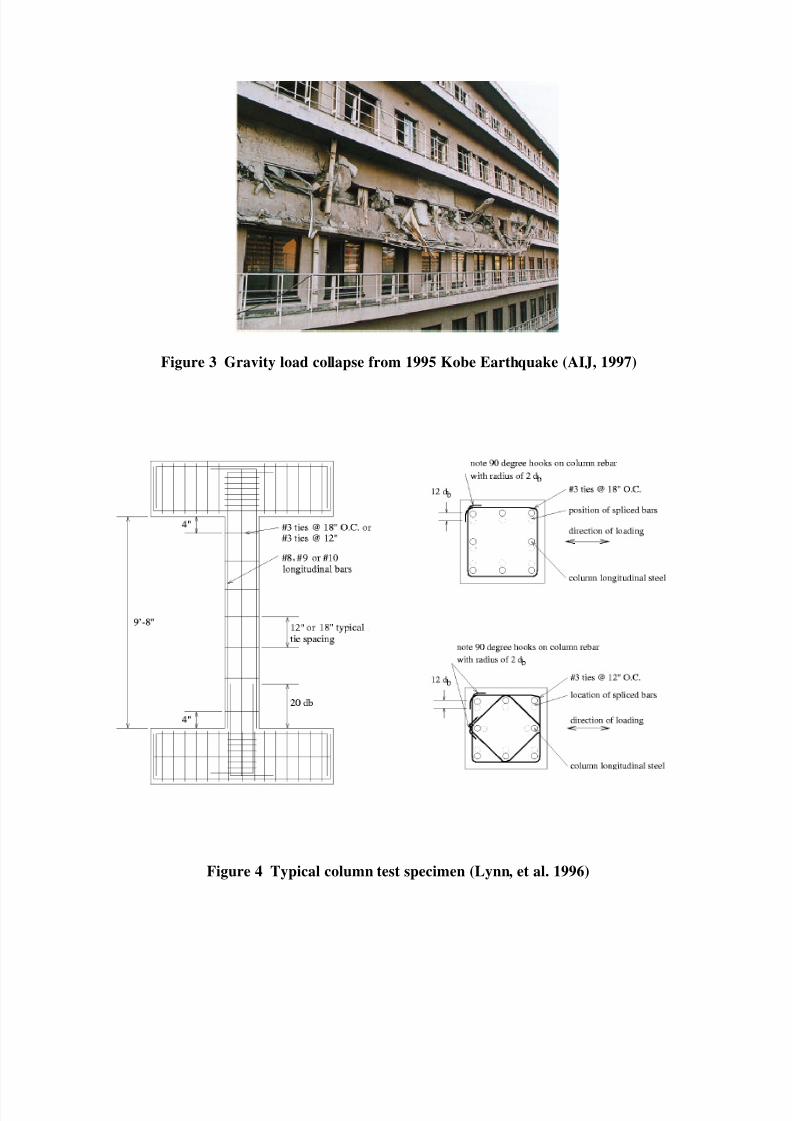
To better understand shear and axial load failure of columns, additional tests were done
[Lynn, 1996; Sezen, 2000]. Figure 4 illustrates a typical test column configuration. The
columns were constructed at full scale. Because the focus of this project was to study only the
behavior of the column, the end beams were made relatively stiff and strong. The loading
routine subjected the column to nominally constant axial compression and maintained

8/2/2019 Gravity Load Collapse of Building Frames During Earthquakes
http://slidepdf.com/reader/full/gravity-load-collapse-of-building-frames-during-earthquakes 4/22
nominally zero rotation between column ends while the column was subjected to series of
lateral displacements at increasing amplitude, with three cycles at each amplitude. The two
exceptions were Column 2CVD12, which had variable axial load ranging from 56 kips tension
to 600 kips compression, and Column 2CLD12M, which was subjected to essentially
monotonic loading to failure. For all columns, loading continued until axial load capacity was
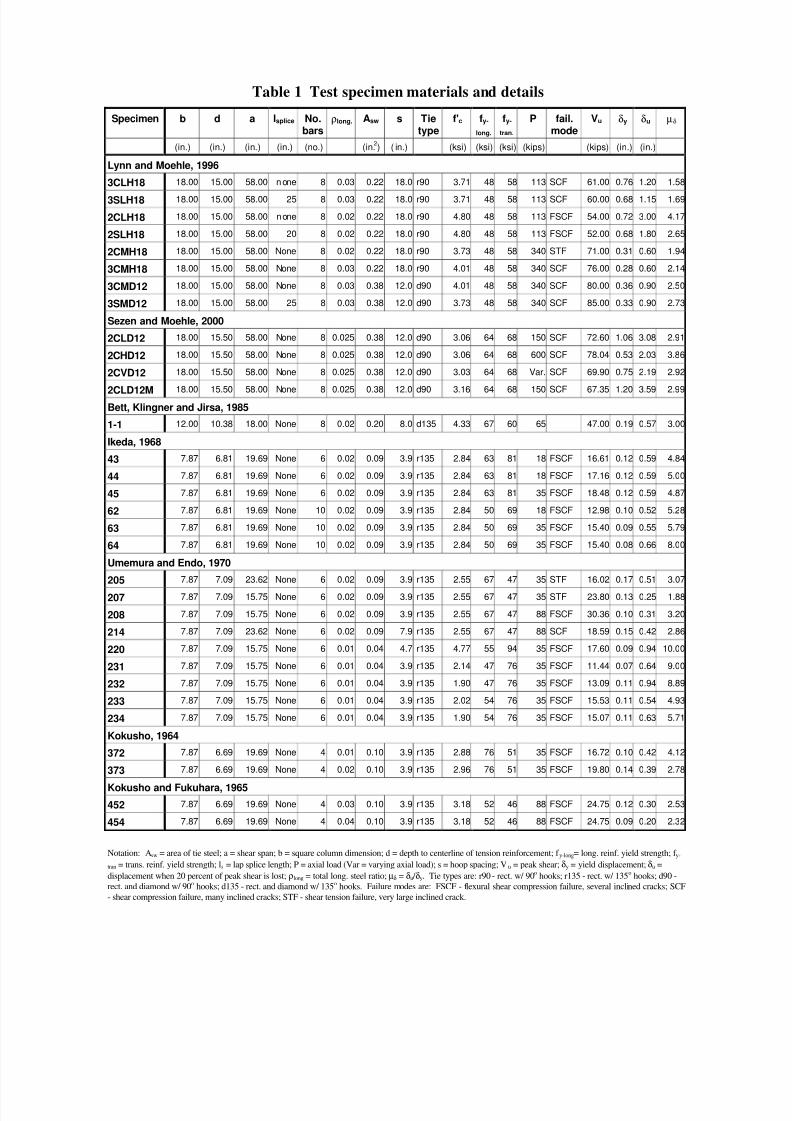
lost. The first twelve entries of Table 1 summarize specific column characteristics, material
properties, applied loads, and measured responses.
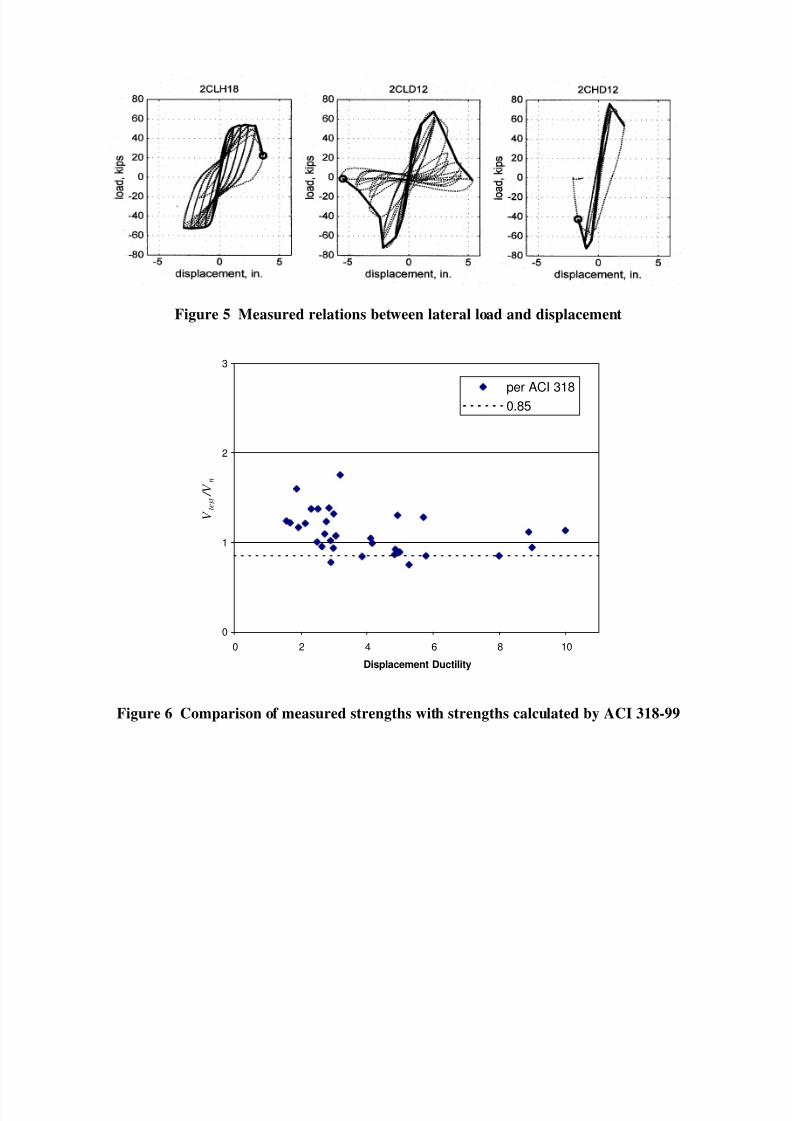
Figure 5 plots measured relations between lateral force and lateral displacements for test
columns 2CLH18, 2CLD12, and 2CHD12, illustrating three different failure modes. The data
for 2CLH18 show moderate flexural ductility, followed by loss of lateral resistance due to
apparent shear failure, followed at somewhat larger displacements by axial load failure.
Column 2CLD12 had low flexural ductility interrupted by loss of lateral resistance due to
shear failure, but sustained vertical load capacity to relatively large displacements. Column
2CHD12 had low flexural ductility interrupted by sudden shear and gravity load failure.
Additional data were gathered to supplement the test results of Lynn and Sezen. In
selecting data, the following criteria were applied: cross sections were rectangular, with one
side not less than 2/3 the dimension of the other side and minimum dimension around 8 in.;
shear span ratio 2 ≤ a / d ≤ 4; concrete compressive strength range 2500 psi ≤ f
’
c ≤ 6000 psi;
reinforcement nominal yield stress 40 ksi ≤ f y ≤ 80 ksi; longitudinal reinforcement ratio 0.01 ≤
ρl ≤ 0.08; hoop spacing s ≥ d/2; lateral load reversed and cyclic in application; failure
apparently attributable to shear distress. Although tests with contraflexure were desired,
among those tests satisfying the other criteria only cantilever tests were identified. Tests
reported by Bett, Klingner, and Jirsa (1985), Ikeda (1968), Umemura and Endo (1970),
Kokusho (1964), Kokusho and Fukuhara (1965) were added (Table 1). None of the cited
works systematically reported response beyond lateral load failure to the point of axial load
failure.
In Table 1, all quantities were obtained from the references with the exception of the yield
displacement, ultimate displacement, and resulting calculation for displacement ductility. Each
of the references used a different definition of these terms. To provide uniformity among the

8/2/2019 Gravity Load Collapse of Building Frames During Earthquakes
http://slidepdf.com/reader/full/gravity-load-collapse-of-building-frames-during-earthquakes 5/22
data, the following procedure was used. A secant was defined by the origin (zero load and
zero displacement) and the point where a horizontal line at 70 percent of the maximum applied
shear intersected the envelope curve. The yield displacement was then defined by where that
secant intersected a horizontal line passing through the envelope curve at the maximum
applied shear. The ultimate displacement was defined as the displacement corresponding to
termination of the test or where there was a loss of more than 20 percent of the maximum
applied shear.
DEVELOPMENT OF A SHEAR STRENGTH MODEL
There is considerable uncertainty in calculating the shear strength of lightly-confined
reinforced concrete columns. Data from the tests discussed above are used to evaluate shear
strength models from ACI 318-99 and FEMA 273. A new model is proposed that provides
better correlation with the test results.
ACI 318-99
The ACI 318-99 Building Code provides requirements for design of new buildings. In the
absence of specific guidelines for existing buildings, engineers have used some of the ACI
318-99 specifications to evaluate existing buildings. For columns with an axial load greater
than Ag f c’ /20, ACI 318-99 calculates the shear strength as follows:
scnV V V += Equation 1
d b f' A
PV wc
g
c )
2000(12 += Equation 2
s
d f AV
ysw
s = Equation 3
where V n = nominal shear strength, V c = contribution from concrete, V s = contribution from
ties, P = axial load, Ag = gross concrete area, f c’
= concrete compressive strength (psi), bw =
width of section, d = effective depth, Asw = area of the tie steel, f y = yield strength of the tie
steel, and s = tie spacing.
Figure 6 plots ratios of experimental shear strength to V n (calculated by Equation 1) as a
function of displacement ductility achieved in the test. Values exceeding unity are cases where
8/2/2019 Gravity Load Collapse of Building Frames During Earthquakes
http://slidepdf.com/reader/full/gravity-load-collapse-of-building-frames-during-earthquakes 6/22
the column developed strength exceeding the strength calculated by ACI 318-99. Previous
studies on columns with higher quantities of transverse reinforcement have indicated that the
ACI 318 equations can be excessively conservative, particularly when ductility demands are
low (Priestley et al., 1994; Aschheim and Moehle, 1992). This same conclusion apparently
does not to apply for these lightly reinforced columns. The mean ratio of test to calculated
strength is 1.11; the mean minus one standard deviation is 0.87.
FEMA 273
In 1997 the US Federal Emergency Management Agency published the NEHRP Guidelines
for the Seismic Rehabilitation of Buildings, commonly referred to as FEMA 273 (1997).
Those guidelines contain a column shear strength evaluation method that was based mainly on
tests of columns with relatively high amounts of transverse reinforcement. According to the
guidelines, the concrete contribution is dependent on the ductility demand, as defined in
equation 4.
bd f A
Pk V
c
g
c
'
20005.3
+= Equation 4
where k = 1 for displacement ductility less than 2, otherwise k = 0.
The transverse steel contribution is calculated using Equation 3, except in yielding regions of
columns where the transverse reinforcement is considered effective only if s ≤ d /2 and hoops
have hooks embedded in the core.
Figure 7 includes ratios of measured shear strength to the shear strength calculated
according to the FEMA 273 procedure, as well as similar ratios for ACI 318-99. FEMA 273
tends to be excessively conservative, especially for cases where displacement ductility demand
exceeds 2, because it sets a portion of V c
equal to zero. The mean ratio of test to calculated
strength is 4.73; the standard deviation of that ratio is 2.77.
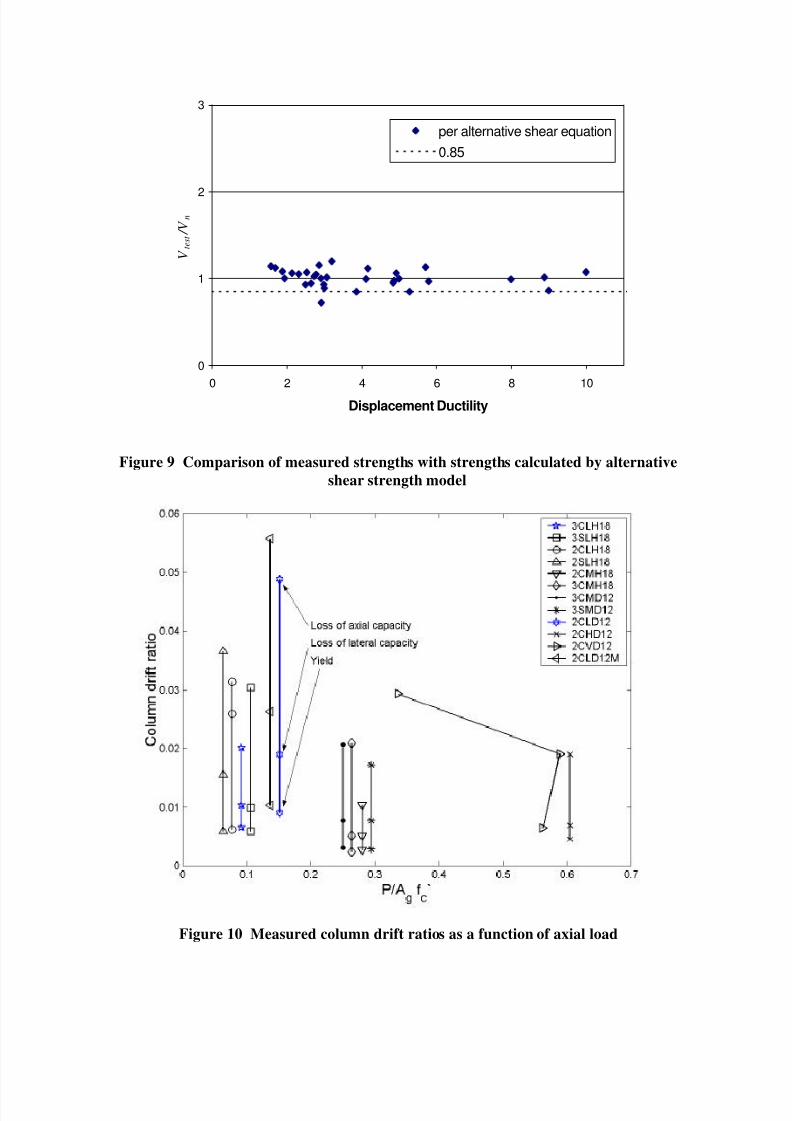
Alternative Shear Strength Model
An alternative shear strength model was developed. As with FEMA 273, the model assumes
Equation 1 can represent the strength. The concrete contribution is assumed to be related to

8/2/2019 Gravity Load Collapse of Building Frames During Earthquakes
http://slidepdf.com/reader/full/gravity-load-collapse-of-building-frames-during-earthquakes 7/22

8/2/2019 Gravity Load Collapse of Building Frames During Earthquakes
http://slidepdf.com/reader/full/gravity-load-collapse-of-building-frames-during-earthquakes 8/22
concrete is likely to degrade in much the same way as does the concrete mechanism, especially
(perhaps) for small quantities of transverse reinforcement.
s
d f Ak V
ysw
s = Equation 7
Work is currently being conducted by others to justify the choice of values for k applied in
the V s term based on Baysian updating of the shear strength equation using a large database of
experimental data (Gardoni et al., 2000).
Figure 9 plots ratios of measured to calculated strengths using the alternative procedure.
The correlation is relatively uniform for the range of ductilities shown. The mean ratio of test
to calculated strength is 1.01; the mean minus one standard deviation is 0.90.
AXIAL CAPACITY OF CONCRETE COLUMNS AFTER SHEAR FAILURE
Experimental Evidence
Most tests of columns have been terminated shortly after loss of lateral load capacity. The
resulting data are useful for columns considered as part of the lateral-force-resisting system.
Considering traditional notions of safety (that is, once shear failure begins, axial load collapse
cannot be far behind), the data also probably define a practical upper-bound displacement
capacity even for columns not considered part of the lateral-force-resisting system in new
building designs. For existing buildings, whether being evaluated for seismic resistance or for
seismic rehabilitation, a less conservative approach is required by economic and functionality
considerations. If a column can reliably carry gravity load after its lateral strength degradation
begins, it may be possible to achieve considerable savings by considering the column as a
secondary component. It was mainly for this reason that the tests by Lynn (1996) and Sezen
(2000) were conducted.
Figure 10 plots drift ratios corresponding to significant events for the twelve columns
reported by Lynn and Sezen. For columns having lower axial loads, the tendency is for axial
load failure to occur at relatively large drifts, regardless of whether shear failure had just
occurred or whether shear failure had occurred at much smaller drift ratios. For columns with

8/2/2019 Gravity Load Collapse of Building Frames During Earthquakes
http://slidepdf.com/reader/full/gravity-load-collapse-of-building-frames-during-earthquakes 9/22
larger axial loads, axial load failure tended to occur at smaller drift ratios, and might occur
almost immediately after loss of lateral load capacity.
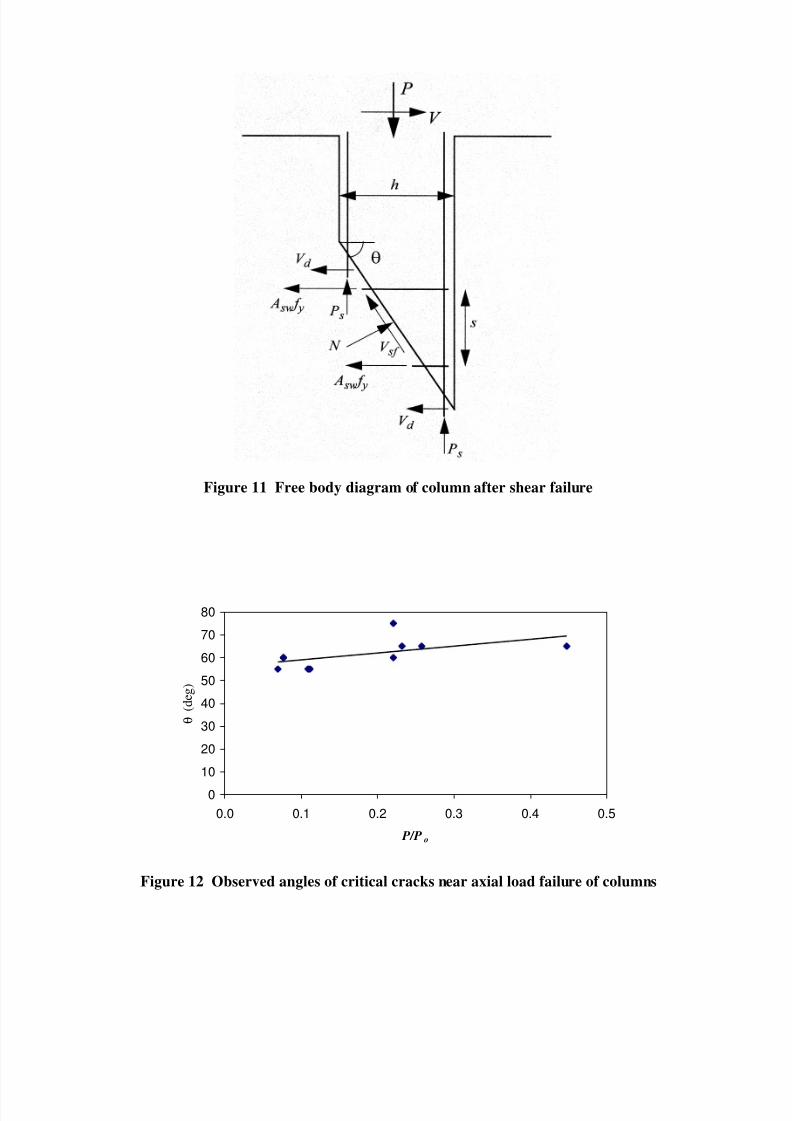
A Shear-Friction Model
A shear-friction model can be used to represent the general observation from Figure 10 thatthe drift at axial load failure is inversely related to the magnitude of axial load. Figure 11
shows a free-body diagram for the upper portion of a column under shear and axial load. The
external moment vector at the top of the column is not shown and will not enter the
equilibrium equations written here. The external shear force V will be assumed equal to zero,
under the assumption that the column has lost most of its lateral load resistance. The inclined
free surface at the bottom of the free-body diagram is assumed to follow a critical inclined
crack associated with shear damage. In this presentation, the “critical” crack is one that,
according to the idealized model, results in axial load failure as shear-friction demand exceeds
the shear-friction resistance along the crack.
Dowel forces from the transverse reinforcement crossing the inclined crack are not shown;
instead, the dowel forces are assumed to be included implicitly in the shear-friction force along
the inclined plane. Shear resistance due to dowel action of the longitudinal bars depends on
the spacing of the transverse reinforcement, and reasonably can be ignored for the columns
considered in this study.
Relative movement across the shear failure plane tends to compress the longitudinal
reinforcement. Given the tendency for buckling, especially in the limit, the axial force capacity
of the longitudinal reinforcement will be assumed equal to zero.
In light of the above discussion, equilibrium of the forces shown in Figure 11 results in the
following equations:
∑ +=→ θθ sincos sf y V N PF Equation 8
∑ +=→s
h f AV N F
ysw
sf x
θθθ
tancossin Equation 9

8/2/2019 Gravity Load Collapse of Building Frames During Earthquakes
http://slidepdf.com/reader/full/gravity-load-collapse-of-building-frames-during-earthquakes 10/22
The literature documents shear-friction models that relate V sf and N (Mattock and Hawkins,
1972; Mau and Hsu, 1988). The classic shear friction model, included in ACI 318 since 1977,
idealizes the crack, across which shear must be transferred, as a flat plane with a coefficient of
friction, µ, and computes the shear capacity as:
µ N V sf = Equation 10
Substitution of equation 10 into equations 8 and 9, and eliminating the case where µ = tanθ,
gives the following expression for the axial capacity of the column:
−+
=θµθ
θµθθ
cossin
sincostan
s
h f AP
yswEquation 11
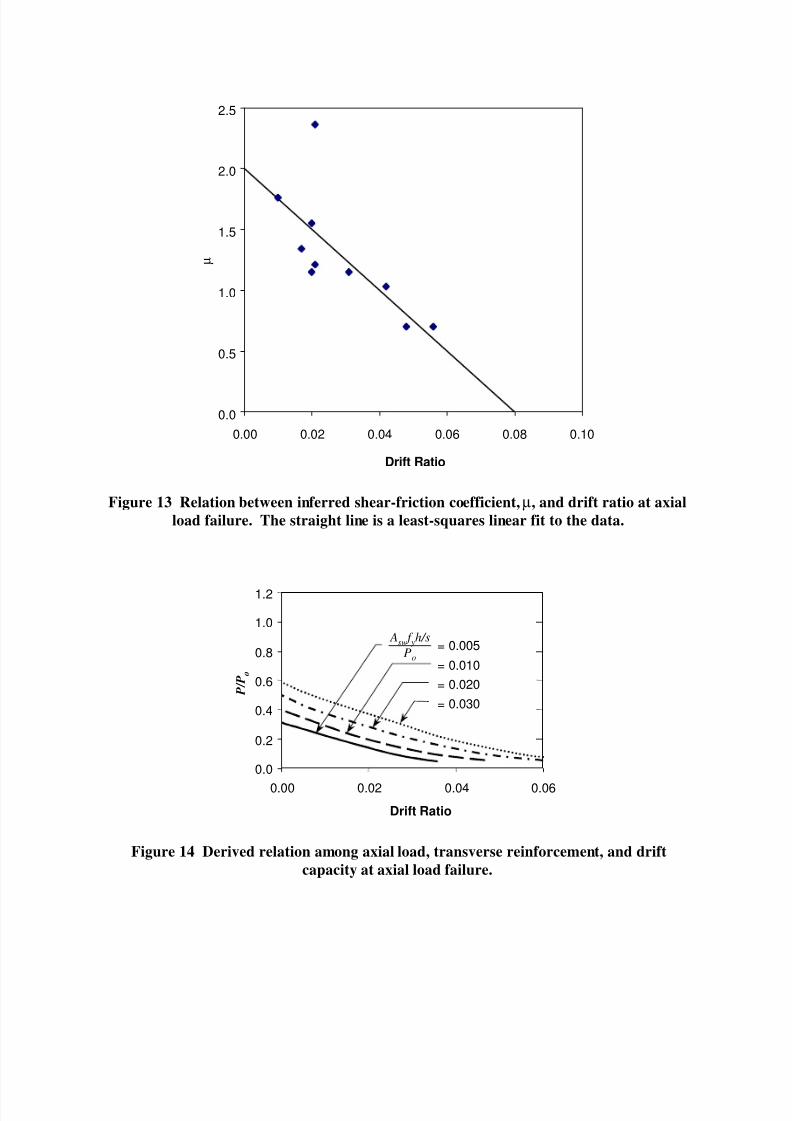
The inclination θ of the shear failure plane can be estimated by considering the magnitude of
the axial load in the column at the time of shear failure. A simplistic approach is to define θ as
the angle of the nominal principal tension stress at the instant when it reaches the tensile
capacity of concrete under combined shear and axial load, using the same model used to
establish Equation 5. This approach, however, invariably results in an angle steeper than that
observed in tests. An empirical approach is suggested instead. Figure 12 plots observed
average angle of critical shear cracks observed in the tests by Lynn (1996) and Sezen (2000).
(The authors estimated the angles subjectively from photographs.) The angle could be
approximated as 60 degrees relative to horizontal, or could have the linear variation suggested
by the unbroken line in the figure. The straight line has an intercept at 55° for zero axial load
and passes through the angle 90° for P / Po = 1. In Figure 12, Po is the pure axial capacity of
the column given by s ysgco A f A A f P +−= )(85.0 ' where As = area of longitudinal steel and
the other variables are defined previously. (The outlying datum at P / Po ≈ 0.21 was for Column
3CMH18. That column had a critical crack that was somewhat less steep over most of its
length, with a vertical segment near column mid-depth, resulting in the relatively large
reported critical crack angle.) All of the columns tested by Lynn and Sezen had a height to
width ratio greater than 6.0. For columns with low height to width ratio, it is expected that
the maximum crack angle will be limited by the aspect ratio of the column (that is, θmax =
arctan(height/width) ).
8/2/2019 Gravity Load Collapse of Building Frames During Earthquakes
http://slidepdf.com/reader/full/gravity-load-collapse-of-building-frames-during-earthquakes 11/22
An empirical approach was used to define the shear-friction coefficient in Equation 11, as
follows. The critical crack angle θ for each column was assessed visually (Figure 12).
Knowing this angle and all the other quantities in Equation 11, the value of the shear-friction
coefficient was calculated. Figure 13 plots the calculated values as a function of the lateral
drift ratio at which column collapse occurred. The data apparently follow a trend that can be
approximated by a line.
The data of Figure 13 suggest that the apparent shear-friction coefficient is a function of the
drift angle at failure. This relation is plausible considering that increased deformation (and
increased sliding along the critical shear plane) degrades the roughness of the shear plane and
reduces the effective friction. It is worth recalling that the increased deformation capacities
are associated with reduced axial loads (Figure 10).
The relation between axial load and crack angle (Figure 12), the relation between drift and
friction coefficient (Figure 13), and the relation among axial load, transverse reinforcement,
crack angle, and friction coefficient (Equation 11) can be combined to produce relations
among column axial load, column transverse reinforcement, and drift ratio at loss of axial load
capacity. The relations are plotted in Figure 14. The plotted relations suggest the intuitive
result that drift capacity increases with increasing transverse reinforcement and decreasing
axial load.
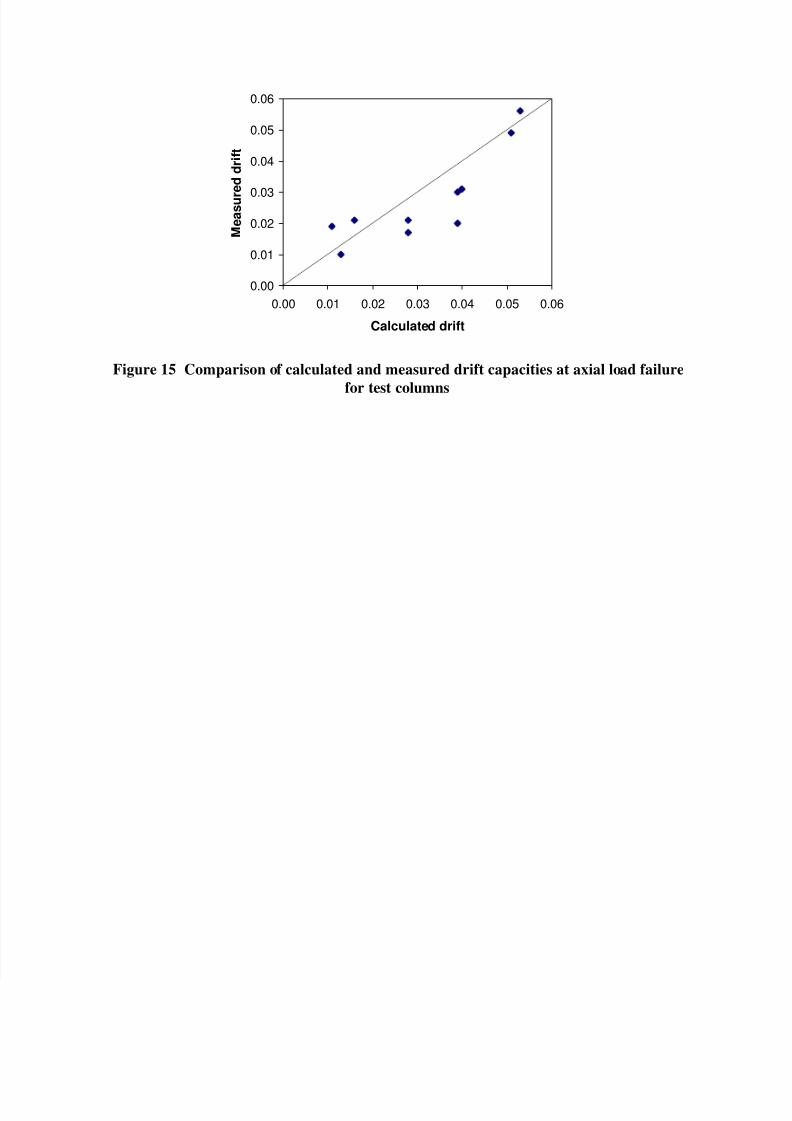
To convey a sense of the accuracy implicit in the relations of Figure 14, those relations were
used to estimate the drift capacity of ten of the twelve columns reported by Lynn and Sezen.
Of the remaining two columns, Column 2CVD12 was subjected to varying axial load and
Column 2SLH18 sustained lap-splice failure, so they were not included in the comparison.
The results are plotted in Figure 15. The mean ratio of calculated to measured drift at
collapse is 0.92; the standard deviation is 0.36. The results of Figure 15, if applied, should be
used only with full understanding that a significant number of columns are likely to fail at drifts
below the calculated quantities. The relatively large scatter may be a product of inherent
randomness associated with the complicated failure mechanism. Additional data and analyses
may well improve our ability to predict the onset of gravity load failure of columns.

8/2/2019 Gravity Load Collapse of Building Frames During Earthquakes
http://slidepdf.com/reader/full/gravity-load-collapse-of-building-frames-during-earthquakes 12/22
CONCLUSIONS
Shear failure of columns is identified as a primary cause of collapse of older reinforced
concrete building frames in earthquakes. Test data were gathered to understand the effects of
materials, geometry, and loading on failure mechanisms. Measured shear strengths are
compared with calculations using the 1999 ACI Building Code and the FEMA 273 Guidelines
for Seismic Rehabilitation of Buildings. An alternative procedure for calculating shear
strengths is found to produce more accurate estimates. Subsequent collapse of columns is
examined using a shear-friction model. The model identifies some variables controlling
column collapse. Results of the model are compared with test results. Significant scatter
between calculated and measured results suggests that additional study may be fruitful.
ACKNOWLEDGMENT
The authors gratefully acknowledge the significant contribution of Professor Abe Lynn,
California Polytechnic State University, in the development of the experimental database and
the alternative shear strength equation.
This work was supported in part by the Pacific Earthquake Engineering Research Center
through the Earthquake Engineering Research Centers Program of the National Science
Foundation under Award number EEC-9701568 and by the National Science Foundation
under Grant No. BCS-9120214. The experimental studies by Lynn and Sezen were conducted
in the research laboratories of PEER at the University of California, Berkeley. Photographs in
Figures 1 and 2 are used courtesy of the National Information Service for Earthquake
Engineering.
REFERENCES
ACI Committee 318 (1999) Building Code Requirements for Structural Concrete (318-99)
and Commentary (318R-99), American Concrete Institute, Farmington Hills, Michigan.
Architectural Institute of Japan (1997) Report on Hanshin-Awaji Earthquake Disaster:
Building Series Volume 1, Structural Damage to Reinforced Concrete Building.
Aschheim, M. A., Moehle, J. P. and Werner, S. D. (1993) Deformability of Concrete
Columns, Dames and Moore Technical Report to the California Department of
Transportation, Contract 59Q122, June 1993.
8/2/2019 Gravity Load Collapse of Building Frames During Earthquakes
http://slidepdf.com/reader/full/gravity-load-collapse-of-building-frames-during-earthquakes 13/22
Bett, B. J., Klingner, R. E., and Jirsa, J. O.; Behavior of Strengthened and Repaired
Reinforced Concrete Columns Under Cyclic Deformations, Phil M. Ferguson Structural
Engineering Laboratory (PMFSEL), PMFSEL Report No. 85-3, December 1985, 75 pages.
FEMA 273 (1997) NEHRP Guidelines for the Seismic Rehabilitation of Buildings, Federal
Emergency Management Agency, Washington DC, October 1997.
Gardoni, P., A. Der Kiureghian, and K. M. Mosalam, (2000), Seismic Fragility of ReinforcedConcrete Columns Subjected to Shear, 8th ASCE Specialty Conference on Probabilistic
Mechanics and Structural Reliability PMC2000-285, Notre Dame, Indiana.
Ikeda, A. (1968) Report of the Training Institute for Engineering Teachers, Yokohama
National University, Japan, March, 1968.
Kokusho, S. (1964) Report by Building Research Institute, Building Research Institute,
Tsukuba, Japan, March, 1964.
Kokusho, S., and Fukuhara, M. (1965) Report by Kokusho Lab., Tokyo Industrial University,
March, 1965.
Lynn, A. C., Moehle, J. P., Mahin, S. A., and Holmes, W. T. (1996) Seismic Evaluation of Existing Reinforced Concrete Columns, Earthquake Spectra, Earthquake Engineering
Research Institute, Vol. 12, No. 4, November 1996, pp. 715-739.
Mattock, A.H., and Hawkins, N., (1972) Shear Transfer in Reinforced Concrete - Recent
Research, Journal of Prestressed Concrete Institute, V. 17, No. 2.
Mau, S.T., and Hsu, T.T.C., (1988) Discussion, PCI Journal, V. 33, No. 1.
Preistley, M. J. N., Verma, R., and Xiao, Yan (1994) Seismic Shear Strength of Reinforced
Concrete Columns, Journal of the Structural Division, ASCE, Vol. 120, No. ST8, August
1994.
Sezen, H. (2000) Evaluation and Testing of Existing Reinforced Concrete Columns, CE 299
Report , Dept. of Civil and Environmental Engineering, UC Berkeley.
Umemura, H. and Endo, T. (1970) Report by Umemura Lab, Tokyo University, December,
1970.
8/2/2019 Gravity Load Collapse of Building Frames During Earthquakes
http://slidepdf.com/reader/full/gravity-load-collapse-of-building-frames-during-earthquakes 14/22
Table 1 Test specimen materials and details
Specimen b d a lsplice No.bars
ρlong. Asw s Tietype
f'c fy-
long.
fy-
tran.
P fail.mode
Vu δy δu µδ
(in.) (in.) (in.) (in.) (no.) (in.2) ( in.) (ksi) (ksi) (ksi) (kips) (kips) (in.) (in.)
Lynn and Moehle, 1996
3CLH18 18.00 15.00 58.00 none 8 0.03 0.22 18.0 r90 3.71 48 58 113 SCF 61.00 0.76 1.20 1.58
3SLH18 18.00 15.00 58.00 25 8 0.03 0.22 18.0 r90 3.71 48 58 113 SCF 60.00 0.68 1.15 1.69
2CLH18 18.00 15.00 58.00 none 8 0.02 0.22 18.0 r90 4.80 48 58 113 FSCF 54.00 0.72 3.00 4.17
2SLH18 18.00 15.00 58.00 20 8 0.02 0.22 18.0 r90 4.80 48 58 113 FSCF 52.00 0.68 1.80 2.65
2CMH18 18.00 15.00 58.00 None 8 0.02 0.22 18.0 r90 3.73 48 58 340 STF 71.00 0.31 0.60 1.94
3CMH18 18.00 15.00 58.00 None 8 0.03 0.22 18.0 r90 4.01 48 58 340 SCF 76.00 0.28 0.60 2.14
3CMD12 18.00 15.00 58.00 None 8 0.03 0.38 12.0 d90 4.01 48 58 340 SCF 80.00 0.36 0.90 2.50
3SMD12 18.00 15.00 58.00 25 8 0.03 0.38 12.0 d90 3.73 48 58 340 SCF 85.00 0.33 0.90 2.73
Sezen and Moehle, 2000
2CLD12 18.00 15.50 58.00 None 8 0.025 0.38 12.0 d90 3.06 64 68 150 SCF 72.60 1.06 3.08 2.91
2CHD12 18.00 15.50 58.00 None 8 0.025 0.38 12.0 d90 3.06 64 68 600 SCF 78.04 0.53 2.03 3.86
2CVD12 18.00 15.50 58.00 None 8 0.025 0.38 12.0 d90 3.03 64 68 Var. SCF 69.90 0.75 2.19 2.92
2CLD12M 18.00 15.50 58.00 None 8 0.025 0.38 12.0 d90 3.16 64 68 150 SCF 67.35 1.20 3.59 2.99
Bett, Klingner and Jirsa, 1985
1-1 12.00 10.38 18.00 None 8 0.02 0.20 8.0 d135 4.33 67 60 65 47.00 0.19 0.57 3.00
Ikeda, 1968
43 7.87 6.81 19.69 None 6 0.02 0.09 3.9 r135 2.84 63 81 18 FSCF 16.61 0.12 0.59 4.84
44 7.87 6.81 19.69 None 6 0.02 0.09 3.9 r135 2.84 63 81 18 FSCF 17.16 0.12 0.59 5.00
45 7.87 6.81 19.69 None 6 0.02 0.09 3.9 r135 2.84 63 81 35 FSCF 18.48 0.12 0.59 4.87
62 7.87 6.81 19.69 None 10 0.02 0.09 3.9 r135 2.84 50 69 18 FSCF 12.98 0.10 0.52 5.28
63 7.87 6.81 19.69 None 10 0.02 0.09 3.9 r135 2.84 50 69 35 FSCF 15.40 0.09 0.55 5.79
64 7.87 6.81 19.69 None 10 0.02 0.09 3.9 r135 2.84 50 69 35 FSCF 15.40 0.08 0.66 8.00
Umemura and Endo, 1970
205 7.87 7.09 23.62 None 6 0.02 0.09 3.9 r135 2.55 67 47 35 STF 16.02 0.17 0.51 3.07
207 7.87 7.09 15.75 None 6 0.02 0.09 3.9 r135 2.55 67 47 35 STF 23.80 0.13 0.25 1.88
208 7.87 7.09 15.75 None 6 0.02 0.09 3.9 r135 2.55 67 47 88 FSCF 30.36 0.10 0.31 3.20
214 7.87 7.09 23.62 None 6 0.02 0.09 7.9 r135 2.55 67 47 88 SCF 18.59 0.15 0.42 2.86
220 7.87 7.09 15.75 None 6 0.01 0.04 4.7 r135 4.77 55 94 35 FSCF 17.60 0.09 0.94 10.00
231 7.87 7.09 15.75 None 6 0.01 0.04 3.9 r135 2.14 47 76 35 FSCF 11.44 0.07 0.64 9.00
232 7.87 7.09 15.75 None 6 0.01 0.04 3.9 r135 1.90 47 76 35 FSCF 13.09 0.11 0.94 8.89
233 7.87 7.09 15.75 None 6 0.01 0.04 3.9 r135 2.02 54 76 35 FSCF 15.53 0.11 0.54 4.93
234 7.87 7.09 15.75 None 6 0.01 0.04 3.9 r135 1.90 54 76 35 FSCF 15.07 0.11 0.63 5.71
Kokusho, 1964
372 7.87 6.69 19.69 None 4 0.01 0.10 3.9 r135 2.88 76 51 35 FSCF 16.72 0.10 0.42 4.12
373 7.87 6.69 19.69 None 4 0.02 0.10 3.9 r135 2.96 76 51 35 FSCF 19.80 0.14 0.39 2.78
Kokusho and Fukuhara, 1965
452 7.87 6.69 19.69 None 4 0.03 0.10 3.9 r135 3.18 52 46 88 FSCF 24.75 0.12 0.30 2.53
454 7.87 6.69 19.69 None 4 0.04 0.10 3.9 r135 3.18 52 46 88 FSCF 24.75 0.09 0.20 2.32
Notation: Asw = area of tie steel; a = shear span; b = square column dimension; d = depth to centerline of tension reinforcement; f y-long= long. reinf. yield strength; f y-
tran = trans. reinf. yield strength; ls = lap splice length; P = axial load (Var = varying axial load); s = hoop spacing; V u = peak shear; δy = yield displacement; δu =
displacement when 20 percent of peak shear is lost; ρlong = total long. steel ratio; µδ = δu / δy. Tie types are: r90 - rect. w/ 90o hooks; r135 - rect. w/ 135o hooks; d90 -
rect. and diamond w/ 90o hooks; d135 - rect. and diamond w/ 135o hooks. Failure modes are: FSCF - flexural shear compression failure, several inclined cracks; SCF
- shear compression failure, many inclined cracks; STF - shear tension failure, very large inclined crack.
8/2/2019 Gravity Load Collapse of Building Frames During Earthquakes
http://slidepdf.com/reader/full/gravity-load-collapse-of-building-frames-during-earthquakes 15/22
Figure 1 Column shear failures from (a) 1999 Kocaeli and (b) 1994 Northridge
Earthquakes
Figure 2 Apparent loss of column axial load capacity without collapse of building frame
from (a) 1999 Chi-Chi and (b) 1999 Kocaeli Earthquakes
8/2/2019 Gravity Load Collapse of Building Frames During Earthquakes
http://slidepdf.com/reader/full/gravity-load-collapse-of-building-frames-during-earthquakes 16/22
Figure 3 Gravity load collapse from 1995 Kobe Earthquake (AIJ, 1997)
Figure 4 Typical column test specimen (Lynn, et al. 1996)
8/2/2019 Gravity Load Collapse of Building Frames During Earthquakes
http://slidepdf.com/reader/full/gravity-load-collapse-of-building-frames-during-earthquakes 17/22
Figure 5 Measured relations between lateral load and displacement
0
1
2
3
0 2 4 6 8 10
Displacement Ductility
V t e s t
/ V n
per ACI 3180.85
Figure 6 Comparison of measured strengths with strengths calculated by ACI 318-99

8/2/2019 Gravity Load Collapse of Building Frames During Earthquakes
http://slidepdf.com/reader/full/gravity-load-collapse-of-building-frames-during-earthquakes 18/22
0
1
2
3
4
5
6
7
8
9
10
11
12
0 2 4 6 8 10
Displacement Ductility
V t e s t
/ V n
per ACI 318
per FEMA 273
0.85
Figure 7 Comparison of measured strengths with strengths
calculated by FEMA 273 and ACI 318-99
0.0
0.2
0.4
0.6
0.8
1.0
1.2
0 1 2 3 4 5 6 7 8
Displacement Ductility
k
Figure 8 Parameter k
8/2/2019 Gravity Load Collapse of Building Frames During Earthquakes
http://slidepdf.com/reader/full/gravity-load-collapse-of-building-frames-during-earthquakes 19/22
0
1
2
3
0 2 4 6 8 10
Displacement Ductility
V t e s t
/ V n
per alternative shear equation
0.85
Figure 9 Comparison of measured strengths with strengths calculated by alternative
shear strength model
Figure 10 Measured column drift ratios as a function of axial load
8/2/2019 Gravity Load Collapse of Building Frames During Earthquakes
http://slidepdf.com/reader/full/gravity-load-collapse-of-building-frames-during-earthquakes 20/22
Figure 11 Free body diagram of column after shear failure
0
10
20
30
40
50
60
70
80
0.0 0.1 0.2 0.3 0.4 0.5
P/P o
θ
( d e g )
Figure 12 Observed angles of critical cracks near axial load failure of columns
8/2/2019 Gravity Load Collapse of Building Frames During Earthquakes
http://slidepdf.com/reader/full/gravity-load-collapse-of-building-frames-during-earthquakes 21/22
0.0
0.5
1.0
1.5
2.0
2.5
0.00 0.02 0.04 0.06 0.08 0.10
Drift Ratio
µ
Figure 13 Relation between inferred shear-friction coefficient, µ, and drift ratio at axial
load failure. The straight line is a least-squares linear fit to the data.
0.0
0.2
0.4
0.6
0.8
1.0
1.2
0.00 0.02 0.04 0.06
Drift Ratio
Asw f yh/s
Po
= 0.005
= 0.010
= 0.020
= 0.030 P / P
o
Figure 14 Derived relation among axial load, transverse reinforcement, and drift
capacity at axial load failure.
8/2/2019 Gravity Load Collapse of Building Frames During Earthquakes
http://slidepdf.com/reader/full/gravity-load-collapse-of-building-frames-during-earthquakes 22/22
0.00
0.01
0.02
0.03
0.04
0.05
0.06
0.00 0.01 0.02 0.03 0.04 0.05 0.06
Calculated drift
M e a s u r
e d d r i f t
Figure 15 Comparison of calculated and measured drift capacities at axial load failure
for test columns