Embed Size (px)
Citation preview

155
Graphs 2The First Modern Olympics: Athens, 1896
The birth of the modern Olympic GamesBy John Gettings—“I hereby proclaim the opening of the first Inter-national Olympic Games at Athens.” With these words on April 6,1896, King George I of Greece welcomed the crowd that had gatheredin the newly reconstructed Panathenean Stadium to the modern-dayOlympic Summer Games.
The event was the idea of Baron Pierre de Coubertin of France whotraveled the world to gather support for his dream to have nationscome together and overcome national disputes, all in the name of sport.
The program for the Games included track and field, fencing,weightlifting, rifle and pistol shooting, tennis, cycling, swimming, gym-nastics, and wrestling. Although 14 nations participated, most of theathletes were Greek.
The Games reached their high point on Day 11 with the firstmodern-day marathon. The idea to hold an event to commemoratethe Ancient Olympic games was suggested by a friend of de Coubertinand was met with great anticipation. The race was run from Marathonto Athens (estimated at 22–26 miles), watched by more than 100,000people and won by a Greek runner, Spiridon Louis.Source: Fact MonsterTM Database, © 2006 Pearson Education, Inc.
—See the Chapter Project—
A Look BackIn Chapter R we reviewed algebra essentials and geometry essentials. In Chapter 1we studied equations in one variable.
A Look AheadHere we connect algebra and geometry using the rectangular coordinate systemand use it to graph equations in two variables. The idea of using a system of rectan-gular coordinates dates back to ancient times, when such a system was used for sur-veying and city planning. Apollonius of Perga, in 200 BC, used a form of rectangularcoordinates in his work on conics, although this use does not stand out as clearly asit does in modern treatments. Sporadic use of rectangular coordinates continueduntil the 1600s. By that time, algebra has developed sufficiently so that RenéDescartes (1596–1650) and Pierre de Fermat (1601–1665) could take the crucialstep, which was the use of rectangular coordinates to translate geometry problemsinto algebra problems, and vice versa. This step was important for two reasons. First,it allowed both geometers and algebraists to gain new insights into their subjects,which previously had been regarded as separate, but now were seen to be con-nected in many important ways. Second, these insights made the development ofcalculus possible, which greatly enlarged the number of areas in which mathematicscould be applied and made possible a much deeper understanding of these areas.
Outline2.1 The Distance and Midpoint Formulas2.2 Graphs of Equations in Two Variables;
Intercepts; Symmetry2.3 Lines2.4 Circles2.5 Variation
Chapter ReviewChapter TestCumulative ReviewChapter Project
Source: Adapted from John Gettings, “The First Modern Olympics:Athens, 1896,” accessed at www.infoplease.com. ©2006 PearsonEducation, Inc. Reprinted with permission.
SULLMC02_013157759X.QXD 11/29/06 2:37 AM Page 155

156 CHAPTER 2 Graphs
* Named after René Descartes (1596–1650), a French mathematician, philosopher, and theologian.
Rectangular CoordinatesWe locate a point on the real number line by assigning it a single real number, calledthe coordinate of the point. For work in a two-dimensional plane, we locate pointsby using two numbers.
We begin with two real number lines located in the same plane: one horizontaland the other vertical. We call the horizontal line the x-axis, the vertical line the y-axis, and the point of intersection the origin O. See Figure 1. We assign coordi-nates to every point on these number lines using a convenient scale. We usually usethe same scale on each axis. In applications, however, different scales appropriate tothe application may be used.
The origin O has a value of 0 on both the x-axis and y-axis. Points on the x-axisto the right of O are associated with positive real numbers, and those to the left ofO are associated with negative real numbers. Points on the y-axis above O are asso-ciated with positive real numbers, and those below O are associated with negativereal numbers. In Figure 1, the x-axis and y-axis are labeled as x and y, respectively,and we have used an arrow at the end of each axis to denote the positive direction.
The coordinate system described here is called a rectangular or Cartesian*coordinate system. The plane formed by the x-axis and y-axis is sometimes calledthe xy-plane, and the x-axis and y-axis are referred to as the coordinate axes.
Any point P in the xy-plane can be located by using an ordered pair ofreal numbers. Let x denote the signed distance of P from the y-axis (signed meansthat, if P is to the right of the y-axis, then and if P is to the left of the y-axis,then ); and let y denote the signed distance of P from the x-axis. The orderedpair also called the coordinates of P, then gives us enough information tolocate the point P in the plane.
For example, to locate the point whose coordinates are go 3 units alongthe x-axis to the left of O and then go straight up 1 unit. We plot this point by plac-ing a dot at this location. See Figure 2, in which the points with coordinates
and are plotted.The origin has coordinates Any point on the x-axis has coordinates of the
form and any point on the y-axis has coordinates of the form If are the coordinates of a point P, then x is called the x-coordinate, or
abscissa, of P and y is the y-coordinate, or ordinate, of P. We identify the point P byits coordinates by writing Usually, we will simply say “the point
” rather than “the point whose coordinates are ”The coordinate axes divide the xy-plane into four sections called quadrants, as
shown in Figure 3. In quadrant I, both the x-coordinate and the y-coordinate of allpoints are positive; in quadrant II, x is negative and y is positive; in quadrant III,both x and y are negative; and in quadrant IV, x is positive and y is negative. Pointson the coordinate axes belong to no quadrant.
Now Work P R O B L E M 1 1
1x, y2.1x, y2 P = 1x, y2.1x, y21x, y2 10, y2.1x, 02, 10, 02.13, 221-2, -32, 13, -22, 1-3, 12,
1-3, 12,1x, y2,x 6 0
x 7 0,
1x, y2
Now Work the ‘Are You Prepared?’ problems on page 160.
OBJECTIVES 1 Use the Distance Formula (p. 157)
2 Use the Midpoint Formula (p. 159)
2.1 The Distance and Midpoint FormulasPREPARING FOR THIS SECTION Before getting started, review the following:
• Algebra Essentials (Chapter R, Section R.2,pp. 17–26)
• Geometry Essentials (Chapter R, Section R.3,pp. 30–35)
x
y
–4 –2 42
2
–2
4
–4
O
Figure 1
x
y
–4 41
32
2
3
3
2
4
(3, 2)3
(–3, 1)
(–2, –3)(3, –2)
O
Figure 2
x
y
Quadrant Ix > 0, y > 0
Quadrant IVx > 0, y < 0
Quadrant IIx < 0, y > 0
Quadrant IIIx < 0, y < 0
Figure 3
SULLMC02_013157759X.QXD 11/28/06 1:19 PM Page 156
SECTION 2.1 The Distance and Midpoint Formulas 157
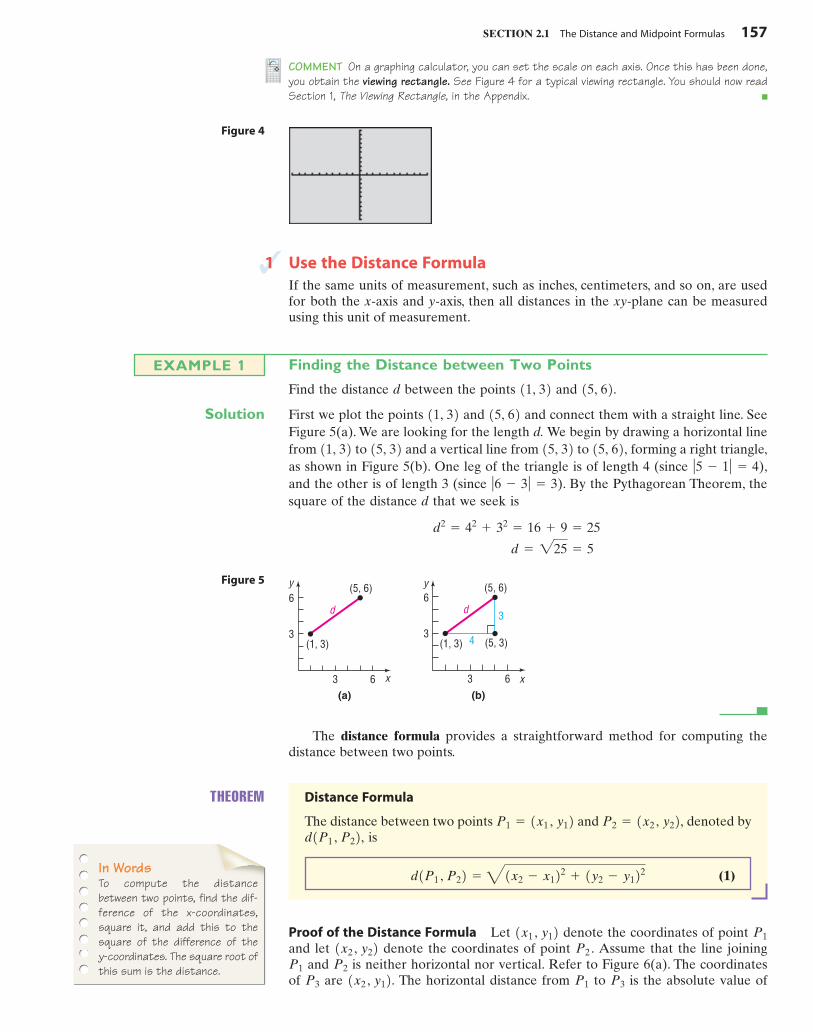
COMMENT On a graphing calculator, you can set the scale on each axis. Once this has been done,you obtain the viewing rectangle. See Figure 4 for a typical viewing rectangle. You should now readSection 1, The Viewing Rectangle, in the Appendix.
Figure 4
x
y
3
(1, 3)
(5, 6)
3
4
d
6(b)
6
3(5, 3)
x
y
3
(1, 3)
(5, 6)
d
6(a)
6
3
Figure 5
1 Use the Distance FormulaIf the same units of measurement, such as inches, centimeters, and so on, are usedfor both the x-axis and y-axis, then all distances in the xy-plane can be measuredusing this unit of measurement.
Finding the Distance between Two Points
Find the distance d between the points and
Solution First we plot the points and and connect them with a straight line. SeeFigure 5(a). We are looking for the length d. We begin by drawing a horizontal linefrom to and a vertical line from to forming a right triangle,as shown in Figure 5(b). One leg of the triangle is of length 4 (since ),and the other is of length 3 (since ). By the Pythagorean Theorem, thesquare of the distance d that we seek is
d = 225 = 5
d2= 42
+ 32= 16 + 9 = 25
ƒ6 - 3 ƒ = 3ƒ5 - 1 ƒ = 4
15, 62,15, 3215, 3211, 3215, 6211, 32
15, 62.11, 32EXAMPLE 1
The distance formula provides a straightforward method for computing thedistance between two points.
THEOREM Distance Formula
The distance between two points and denoted byis
(1)d1P1 , P22 = 41x2 - x122 + 1y2 - y122d1P1 , P22,
P2 = 1x2 , y22,P1 = 1x1 , y12
Proof of the Distance Formula Let denote the coordinates of point and let denote the coordinates of point Assume that the line joining
and is neither horizontal nor vertical. Refer to Figure 6(a). The coordinatesof are The horizontal distance from to is the absolute value ofP3P11x2 , y12.P3
P2P1
P2 .1x2 , y22P11x1 , y12
In WordsTo compute the distancebetween two points, find the dif-ference of the x-coordinates,square it, and add this to thesquare of the difference of the y-coordinates. The square root ofthis sum is the distance.
SULLMC02_013157759X.QXD 11/28/06 1:19 PM Page 157
158 CHAPTER 2 Graphs
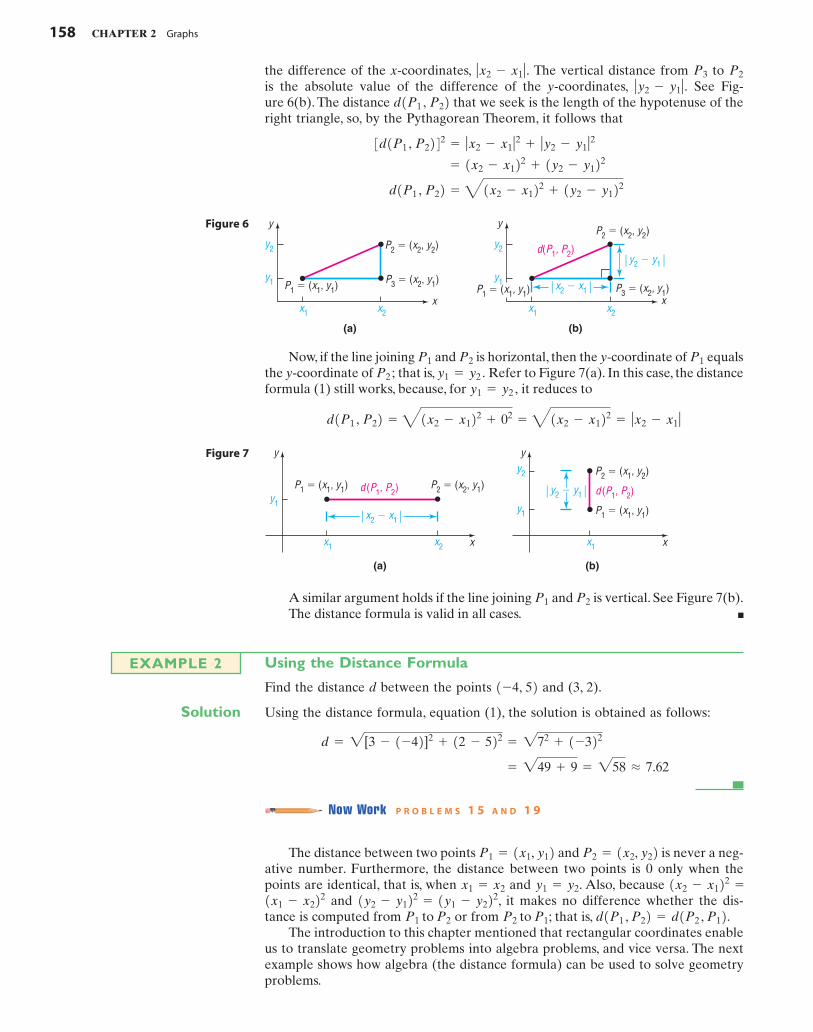
the difference of the x-coordinates, The vertical distance from to is the absolute value of the difference of the y-coordinates, See Fig-ure 6(b). The distance that we seek is the length of the hypotenuse of theright triangle, so, by the Pythagorean Theorem, it follows that
d1P1 , P22 = 41x2 - x122 + 1y2 - y122 = 1x2 - x122 + 1y2 - y122
3d1P1 , P2242 = ƒx2 - x1 ƒ2
+ ƒy2 - y1 ƒ2
d1P1 , P22ƒy2 - y1 ƒ .
P2P3ƒx2 - x1 ƒ .
P1 � (x1, y1)
x1
(a)
x2
P3 � (x2, y1)
y y
x x
P2 � (x2, y2)y2
y1
(b)
x1 x2
P2 � (x2, y2)y2
y1P1 � (x1, y1)
d(P1, P2)
P3 � (x2, y1)x2 � x1
y2 � y1
Figure 6
x2 � x1
x1 x2
y1
x
y
P2 � (x2, y1)P1 � (x1, y1) d (P1, P2)
(a)
y2 � y1
x1
y1
y2 P2 � (x1, y2)
P1 � (x1, y1)
d (P1, P2)
x
y
(b)
Figure 7
A similar argument holds if the line joining and is vertical. See Figure 7(b).The distance formula is valid in all cases.
P2P1
Using the Distance Formula
Find the distance d between the points and (3, 2).
Solution Using the distance formula, equation (1), the solution is obtained as follows:
Now Work P R O B L E M S 1 5 A N D 1 9
= 249 + 9 = 258 L 7.62
d = 2[3 - 1-42]2+ 12 - 522 = 272
+ 1-322
1-4, 52EXAMPLE 2
The distance between two points and is never a neg-ative number. Furthermore, the distance between two points is 0 only when thepoints are identical, that is, when and . Also, because
and , it makes no difference whether the dis-tance is computed from or from ; that is,
The introduction to this chapter mentioned that rectangular coordinates enableus to translate geometry problems into algebra problems, and vice versa. The nextexample shows how algebra (the distance formula) can be used to solve geometryproblems.
d1P2 , P12.d1P1 , P22 =P2 to P1P1 to P2
1y1 - y2221y2 - y122 =1x1 - x2221x2 - x122 =y1 = y2x1 = x2
P2 = 1x2, y22P1 = 1x1, y12
Now, if the line joining and is horizontal, then the y-coordinate of equalsthe y-coordinate of that is, Refer to Figure 7(a). In this case, the distanceformula (1) still works, because, for it reduces to
d1P1 , P22 = 41x2 - x122 + 02= 41x2 - x122 = ƒx2 - x1 ƒ
y1 = y2 ,y1 = y2 .P2 ;
P1P2P1
SULLMC02_013157759X.QXD 11/28/06 1:19 PM Page 158

SECTION 2.1 The Distance and Midpoint Formulas 159
Using Algebra to Solve Geometry Problems
Consider the three points and
(a) Plot each point and form the triangle ABC.(b) Find the length of each side of the triangle.(c) Verify that the triangle is a right triangle.(d) Find the area of the triangle.
Solution (a) Points A, B, C and triangle ABC are plotted in Figure 8.(b) We use the distance formula, equation (1).
(c) To show that the triangle is a right triangle, we need to show that the sum ofthe squares of the lengths of two of the sides equals the square of the lengthof the third side. (Why is this sufficient?) Looking at Figure 8, it seems rea-sonable to conjecture that the right angle is at vertex B. We shall check to seewhether
We find that
so it follows from the converse of the Pythagorean Theorem that triangle ABCis a right triangle.
(d) Because the right angle is at vertex B, the sides AB and BC form the base andheight of the triangle. Its area is
Now Work P R O B L E M 2 9
Area =
12
1Base21Height2 =
12
A225 B A25 B = 5 square units
= 20 + 5 = 25 = 3d1A, C242 3d1A, B242 + 3d1B, C242 = A225 B2 + A25 B2
3d1A, B242 + 3d1B, C242 = 3d1A, C242
d1A, C2 = 433 - 1-2242 + 11 - 122 = 225 + 0 = 5
d1B, C2 = 413 - 222 + 11 - 322 = 21 + 4 = 25
d1A, B2 = 432 - 1-2242 + 13 - 122 = 216 + 4 = 220 = 225
C = 13, 12.A = 1-2, 12, B = 12, 32,EXAMPLE 3
x
y
–3
3
3
C = (3, 1)
B = (2, 3)
A = (–2, 1)
Figure 8
2 Use the Midpoint FormulaWe now derive a formula for the coordinates of the midpoint of a line segment. Let
and be the endpoints of a line segment, and letbe the point on the line segment that is the same distance from as
it is from See Figure 9. The triangles and are congruent. Doyou see why? is given; * and
So, we have angle–side–angle. Because triangles and arecongruent, corresponding sides are equal in length. That is,
x =
x1 + x2
2 y =
y1 + y2
2
2x = x1 + x2 2y = y1 + y2
x - x1 = x2 - x and y - y1 = y2 - y
MBP2P1 AM∠MP2 B.∠P1 MA =∠AP1 M = ∠BMP2 ,d1P1 , M2 = d1M, P22
MBP2P1 AMP2 .P1M = 1x, y2 P2 = 1x2 , y22P1 = 1x1 , y12
x1 x2x
y1
x
y
A = (x, y1)
M = (x, y)
P1 = (x1, y1)
x – x1
x2 – xy2 – y
y – y1
P2 = (x2, y2)
B = (x2, y)y
y2
Figure 9
* A postulate from geometry states that the transversal forms congruent corresponding angles withthe parallel line segments and MB.P1 A
P1 P2
SULLMC02_013157759X.QXD 11/28/06 1:19 PM Page 159
160 CHAPTER 2 Graphs
x
y
5
5–5
P2 � (3, 1)
P1 � (–5, 5)
M � (–1, 3)
Figure 10
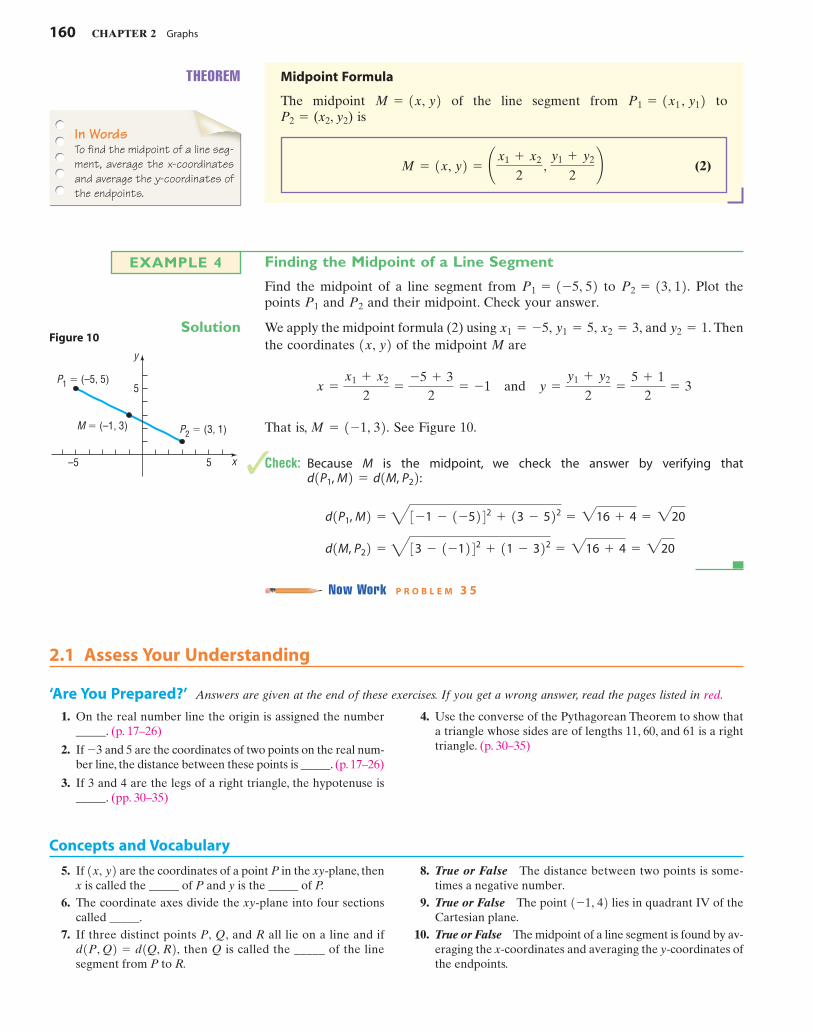
THEOREM Midpoint Formula
The midpoint of the line segment from to P2 � (x2, y2) is
(2)M = 1x, y2 = ¢x1 + x2
2,
y1 + y2
2≤
P1 = 1x1 , y12M = 1x, y2
Concepts and Vocabulary
5. If are the coordinates of a point P in the xy-plane, thenx is called the _____ of P and y is the _____ of P.
6. The coordinate axes divide the xy-plane into four sectionscalled _____.
7. If three distinct points P, Q, and R all lie on a line and ifthen Q is called the _____ of the line
segment from P to R.d1P, Q2 = d1Q, R2,
1x, y2 8. True or False The distance between two points is some-times a negative number.
9. True or False The point lies in quadrant IV of theCartesian plane.
10. True or False The midpoint of a line segment is found by av-eraging the x-coordinates and averaging the y-coordinates ofthe endpoints.
1-1, 42
In WordsTo find the midpoint of a line seg-ment, average the x-coordinatesand average the y-coordinates ofthe endpoints.
Finding the Midpoint of a Line Segment
Find the midpoint of a line segment from to Plot thepoints and and their midpoint. Check your answer.
Solution We apply the midpoint formula (2) using and Thenthe coordinates of the midpoint M are
That is, See Figure 10.
Check: Because M is the midpoint, we check the answer by verifying that
Now Work P R O B L E M 3 5
d1M, P22 = 433 - 1-1242 + 11 - 322= 216 + 4 = 220
d1P1, M2 = 43-1 - 1-5242 + 13 - 522= 216 + 4 = 220
d1P1, M2 = d1M, P22:
M = 1-1, 32.
x =
x1 + x2
2=
-5 + 32
= -1 and y =
y1 + y2
2=
5 + 12
= 3
1x, y2y2 = 1.x1 = -5, y1 = 5, x2 = 3,
P2P1
P2 = 13, 12.P1 = 1-5, 52EXAMPLE 4
1. On the real number line the origin is assigned the number_____. (p. 17–26)
2. If and 5 are the coordinates of two points on the real num-ber line, the distance between these points is _____. (p. 17–26)
3. If 3 and 4 are the legs of a right triangle, the hypotenuse is_____. (pp. 30–35)
-3
4. Use the converse of the Pythagorean Theorem to show thata triangle whose sides are of lengths 11, 60, and 61 is a righttriangle. (p. 30–35)
2.1 Assess Your Understanding
‘Are You Prepared?’ Answers are given at the end of these exercises. If you get a wrong answer, read the pages listed in red.
SULLMC02_013157759X.QXD 11/28/06 1:19 PM Page 160

SECTION 2.1 The Distance and Midpoint Formulas 161
Skill Building
In Problems 11 and 12, plot each point in the xy-plane. Tell in which quadrant or on what coordinate axis each point lies.
15. 16. 17. 18.
P1 = (0, 0)P2 = (2, 1)
x
y
–2–1
2
2P1 = (0, 0)P2 = (–2, 1)
x
y
–2–1
2
2
x
y
2
2–2
P2 � (–2, 2)P1 � (1, 1)
x
y
–2–1
2
2P1 = (–1, 1)P2 = (2, 2)
13. Plot the points and Describe the set of all points of the form where y is a real number.
14. Plot the points , and Describe the set of all points of the form where x is a real number.
In Problems 15–28, find the distance between the points and P2 .P1d1P1 , P221x, 32,1-4, 32.15, 321-2, 32,11, 32,10, 32,12, y2,12, -12.12, 12,12, 42,12, -32,12, 02,
11. (a)(b)(c) C = 1-2, -22
B = 16, 02A = 1-3, 22 (d)
(e)(f) F = 16, -32
E = 10, -32D = 16, 52 (d)
(e)(f) F = 1-3, 02
E = 10, 12D = 14, 1212. (a)
(b)(c) C = 1-3, 42
B = 1-3, -42A = 11, 42
19. P1 = 13, -42; P2 = 15, 42 20. P1 = 1-1, 02; P2 = 12, 4221. P1 = 1-3, 22; P2 = 16, 02 22. P1 = 12, -32; P2 = 14, 2223. P1 = 14, -32; P2 = 16, 42 24. P1 = 1-4, -32; P2 = 16, 2225. P1 = 1-0.2, 0.32; P2 = 12.3, 1.12 26. P1 = 11.2, 2.32; P2 = 1-0.3, 1.1227. P1 = 1a, b2; P2 = 10, 02 28. P1 = 1a, a2; P2 = 10, 02
29. A = 1-2, 52; B = 11, 32; C = 1-1, 02 30. A = 1-2, 52; B = 112, 32; C = 110, -11231. A = 1-5, 32; B = 16, 02; C = 15, 52 32. A = 1-6, 32; B = 13, -52; C = 1-1, 5233. A = 14, -32; B = 10, -32; C = 14, 22 34. A = 14, -32; B = 14, 12; C = 12, 12
35. P1 = 13, -42; P2 = 15, 42 36. P1 = 1-2, 02; P2 = 12, 4237. P1 = 1-3, 22; P2 = 16, 02 38. P1 = 12, -32; P2 = 14, 2239. P1 = 14, -32; P2 = 16, 12 40. P1 = 1-4, -32; P2 = 12, 2241. P1 = 1-0.2, 0.32; P2 = 12.3, 1.12 42. P1 = 11.2, 2.32; P2 = 1-0.3, 1.1243. P1 = 1a, b2; P2 = 10, 02 44. P1 = 1a, a2; P2 = 10, 02
In Problems 29–34, plot each point and form the triangle ABC. Verify that the triangle is a right triangle. Find its area.
In Problems 35–44, find the midpoint of the line segment joining the points and P2 .P1
Applications and Extensions
45. Find all points having an x-coordinate of 2 whose distancefrom the point is 5.
46. Find all points having a y-coordinate of whose distancefrom the point is 13.
47. Find all points on the x-axis that are 5 units from the point
48. Find all points on the y-axis that are 5 units from the point
49. The midpoint of the line segment from P1 to P2 is . If, what is P2?P1 = 1-3, 62
1-1, 4214, 42.
14, -32.
11, 22-3
1-2, -1250. The midpoint of the line segment from P1 to P2 is . If
what is P1?
51. Geometry The medians of a triangle are the line segmentsfrom each vertex to the midpoint of the opposite side (seethe figure). Find the lengths of the medians of the trianglewith vertices at and C = 14, 42.A = 10, 02, B = 16, 02,
P2 = 17, -22,15, -42
Median
A B
C
Midpoint
SULLMC02_013157759X.QXD 11/28/06 1:19 PM Page 161
162 CHAPTER 2 Graphs
Pitchingrubber
Home plate
1st base
2nd base
3rd base90 ft
90 ft
15 mph
East
100 ft
54. Geometry Verify that the points (0, 0), (a, 0), and are the vertices of an equilateral triangle. Then show that the mid-
points of the three sides are the vertices of a second equilateral triangle (refer to Problem 52).
aa
2, 23 a
2b
53. Geometry Find the midpoint of each diagonal of a squarewith side of length s. Draw the conclusion that the diagonalsof a square intersect at their midpoints.
[Hint: Use (0, 0), (0, s), (s, 0), and (s, s) as the vertices of thesquare.]
In Problems 55–58, find the length of each side of the triangle determined by the three points and State whether the triangleis an isosceles triangle, a right triangle, neither of these, or both. (An isosceles triangle is one in which at least two of the sides are ofequal length.)
P3 .P1 , P2 ,
55.
56.
57.
58.
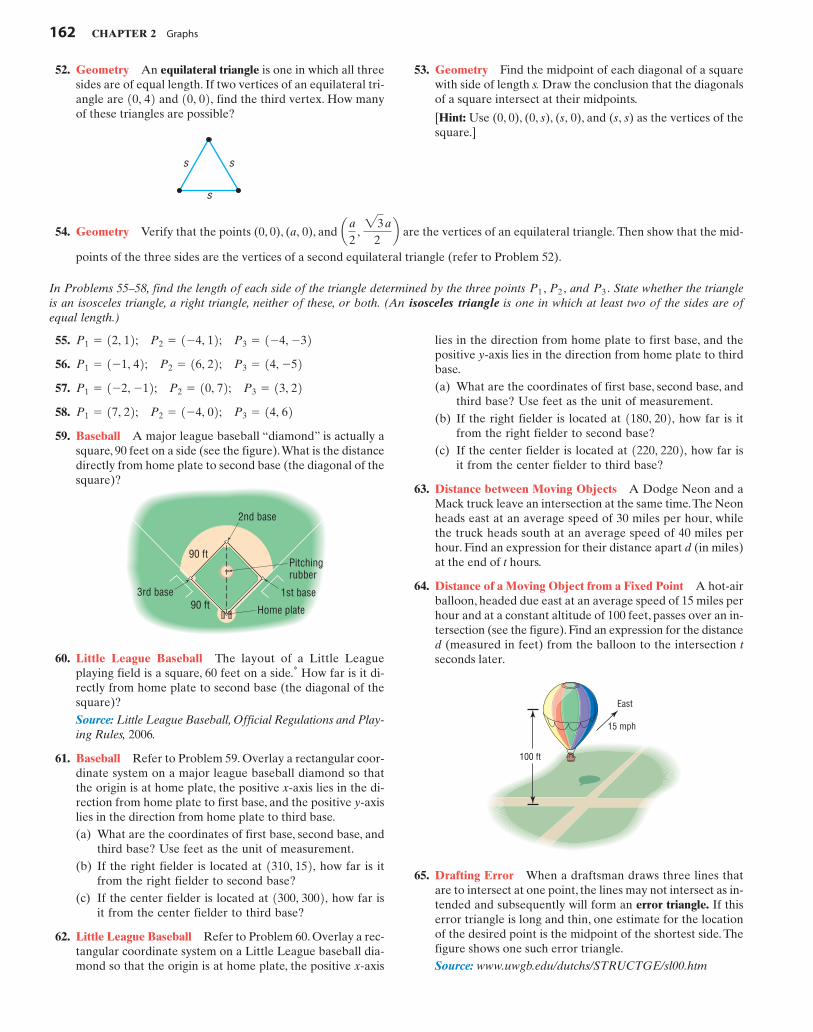
59. Baseball A major league baseball “diamond” is actually asquare, 90 feet on a side (see the figure).What is the distancedirectly from home plate to second base (the diagonal of thesquare)?
P1 = 17, 22; P2 = 1-4, 02; P3 = 14, 62P1 = 1-2, -12; P2 = 10, 72; P3 = 13, 22P1 = 1-1, 42; P2 = 16, 22; P3 = 14, -52P1 = 12, 12; P2 = 1-4, 12; P3 = 1-4, -32 lies in the direction from home plate to first base, and the
positive y-axis lies in the direction from home plate to thirdbase.(a) What are the coordinates of first base, second base, and
third base? Use feet as the unit of measurement.(b) If the right fielder is located at how far is it
from the right fielder to second base?(c) If the center fielder is located at how far is
it from the center fielder to third base?
63. Distance between Moving Objects A Dodge Neon and aMack truck leave an intersection at the same time.The Neonheads east at an average speed of 30 miles per hour, whilethe truck heads south at an average speed of 40 miles perhour. Find an expression for their distance apart d (in miles)at the end of t hours.
64. Distance of a Moving Object from a Fixed Point A hot-airballoon, headed due east at an average speed of 15 miles perhour and at a constant altitude of 100 feet, passes over an in-tersection (see the figure). Find an expression for the distanced (measured in feet) from the balloon to the intersection tseconds later.
1220, 2202,1180, 202,
60. Little League Baseball The layout of a Little Leagueplaying field is a square, 60 feet on a side.* How far is it di-rectly from home plate to second base (the diagonal of thesquare)?
Source: Little League Baseball, Official Regulations and Play-ing Rules, 2006.
61. Baseball Refer to Problem 59. Overlay a rectangular coor-dinate system on a major league baseball diamond so thatthe origin is at home plate, the positive x-axis lies in the di-rection from home plate to first base, and the positive y-axislies in the direction from home plate to third base.(a) What are the coordinates of first base, second base, and
third base? Use feet as the unit of measurement.(b) If the right fielder is located at how far is it
from the right fielder to second base?(c) If the center fielder is located at how far is
it from the center fielder to third base?
62. Little League Baseball Refer to Problem 60. Overlay a rec-tangular coordinate system on a Little League baseball dia-mond so that the origin is at home plate, the positive x-axis
1300, 3002,1310, 152,
65. Drafting Error When a draftsman draws three lines thatare to intersect at one point, the lines may not intersect as in-tended and subsequently will form an error triangle. If thiserror triangle is long and thin, one estimate for the locationof the desired point is the midpoint of the shortest side. Thefigure shows one such error triangle.Source: www.uwgb.edu/dutchs/STRUCTGE/sl00.htm
s s
s
52. Geometry An equilateral triangle is one in which all threesides are of equal length. If two vertices of an equilateral tri-angle are and find the third vertex. How manyof these triangles are possible?
10, 02,10, 42
SULLMC02_013157759X.QXD 11/28/06 1:19 PM Page 162

SECTION 2.2 Graphs of Equations in Two Variables; Intercepts; Symmetry 163
Wal-Mart Stores, Inc.Net sales (in $ billions)
2002 2004
312
204
2003Year
2005 2006
350300250200
Net s
ales
($ b
illio
ns)
150
500
100
Inc., in 2004. How does your result compare to the re-ported value of $256 billion?Source: Wal-Mart Stores, Inc., 2006 Annual Report
x
y
(1.4, 1.3)
(2.7, 1.7)
(2.6, 1.5)
1.7
1.5
1.3
2.6 2.71.4
(a) Find an estimate for the desired intersection point.(b) Find the length of the median for the midpoint found
in part (a). See Problem 51.
66. Net Sales The figure illustrates how net sales of Wal-MartStores, Inc., have grown from 2002 through 2006. Use the mid-point formula to estimate the net sales of Wal-Mart Stores,
‘Are You Prepared?’ Answers1. 0 2. 8 3. 5 4. 112
+ 602= 121 + 3600 = 3721 = 612
Now Work the ‘Are You Prepared’ problems on page 171.
OBJECTIVES 1 Graph Equations by Plotting Points (p. 163)
2 Find Intercepts from a Graph (p. 165)
3 Find Intercepts from an Equation (p. 166)
4 Test an Equation for Symmetry with Respect to the x-Axis, the y-Axis,and the Origin (p. 167)
5 Know How to Graph Key Equations (p. 169)
2.2 Graphs of Equations in Two Variables; Intercepts; SymmetryPREPARING FOR THIS SECTION Before getting started, review the following:
• Solving Equations (Section 1.1, pp. 86–93)
1 Graph Equations by Plotting PointsAn equation in two variables, say x and y, is a statement in which two expressionsinvolving x and y are equal. The expressions are called the sides of the equation.Since an equation is a statement, it may be true or false, depending on the value ofthe variables. Any values of x and y that result in a true statement are said to satisfythe equation.
For example, the following are all equations in two variables x and y:
The first of these, is satisfied for since Other choices of x and y, such as also satisfy this equa-
tion. It is not satisfied for and since The graph of an equation in two variables x and y consists of the set of points
in the xy-plane whose coordinates satisfy the equation.Graphs play an important role in helping us visualize the relationships that
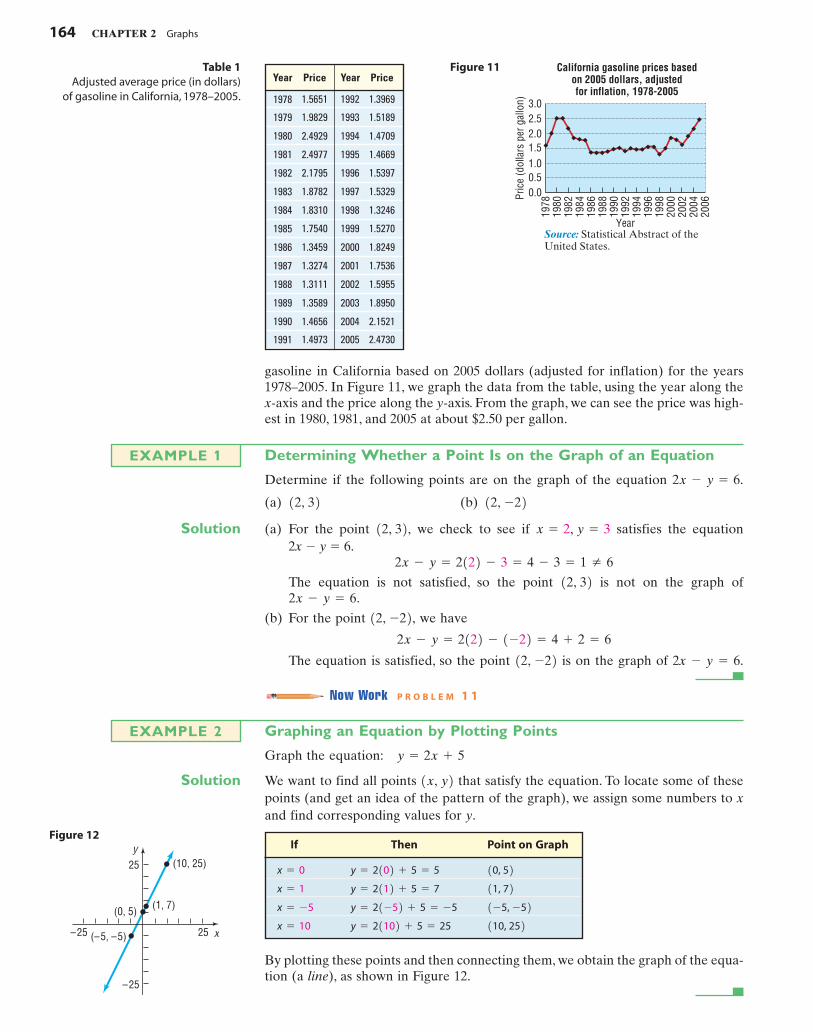
exist between two variable quantities. Table 1 shows the average price of regular
1x, y222
+ 32= 4 + 9 = 13 Z 5.y = 3,x = 2
y = -2,x = -1,1 + 4 = 5.12
+ 22=x = 1, y = 2,x2
+ y2= 5,
x2+ y2
= 5 2x - y = 6 y = 2x + 5 x2= y
SULLMC02_013157759X.QXD 11/28/06 1:19 PM Page 163
164 CHAPTER 2 Graphs
Year Price Year Price
1978 1.5651 1992 1.3969
1979 1.9829 1993 1.5189
1980 2.4929 1994 1.4709
1981 2.4977 1995 1.4669
1982 2.1795 1996 1.5397
1983 1.8782 1997 1.5329
1984 1.8310 1998 1.3246
1986 1.3459 2000 1.8249
1987 1.3274 2001 1.7536
1988 1.3111 2002 1.5955
1989 1.3589 2003 1.8950
1990 1.4656 2004 2.1521
1991 1.4973 2005 2.4730
1985 1.7540 1999 1.5270
California gasoline prices basedon 2005 dollars, adjustedfor inflation, 1978-2005
1978
1980
1982
1984
1986
1988
1990
1992
1994
1996
1998
2000
2002
2004
2006
Year
2.52.0
3.0
Pric
e (d
olla
rs p
er g
allo
n)
1.5
0.50.0
1.0
Source: Statistical Abstract of theUnited States.
Table 1Adjusted average price (in dollars)
of gasoline in California, 1978–2005.
x
y (10, 25)25
(1, 7) (0, 5)
(–5, –5) 25–25
–25
gasoline in California based on 2005 dollars (adjusted for inflation) for the years1978–2005. In Figure 11, we graph the data from the table, using the year along thex-axis and the price along the y-axis. From the graph, we can see the price was high-est in 1980, 1981, and 2005 at about $2.50 per gallon.
Determining Whether a Point Is on the Graph of an Equation
Determine if the following points are on the graph of the equation
(a) (b)
Solution (a) For the point we check to see if satisfies the equation2x � y � 6.
The equation is not satisfied, so the point is not on the graph of.
(b) For the point we have
The equation is satisfied, so the point is on the graph of 2x � y � 6.
Now Work P R O B L E M 1 1
Graphing an Equation by Plotting Points
Graph the equation:
Solution We want to find all points that satisfy the equation. To locate some of thesepoints (and get an idea of the pattern of the graph), we assign some numbers to xand find corresponding values for y.
1x, y2y = 2x + 5
EXAMPLE 2
12, -222x - y = 2122 - 1-22 = 4 + 2 = 6
12, -22,2x - y = 6
12, 322x - y = 2122 - 3 = 4 - 3 = 1 Z 6
x = 2, y = 312, 32,12, -2212, 32
2x - y = 6.
EXAMPLE 1
If Then Point on Graph
110, 252y = 21102 + 5 = 25x = 10
1-5, -52y = 21-52 + 5 = -5x = -5
11, 72y = 2112 + 5 = 7x = 1
10, 52y = 2102 + 5 = 5x = 0
By plotting these points and then connecting them, we obtain the graph of the equa-tion (a line), as shown in Figure 12.
Figure 12
Figure 11
SULLMC02_013157759X.QXD 11/28/06 1:19 PM Page 164

SECTION 2.2 Graphs of Equations in Two Variables; Intercepts; Symmetry 165
Graphing an Equation by Plotting Points
Graph the equation:
Solution Table 2 provides several points on the graph. In Figure 13 we plot these points andconnect them with a smooth curve to obtain the graph (a parabola).
y = x2
EXAMPLE 3
x
y
–4 4
(4, 16)(–4, 16)
(3, 9)(–3, 9)
(2, 4)(–2, 4)(1, 1)
(0, 0)(–1, 1)
5
10
15
20
Figure 13Table 2
The graphs of the equations shown in Figures 12 and 13 do not show all points.For example, in Figure 12, the point is a part of the graph of but it is not shown. Since the graph of could be extended out as far aswe please, we use arrows to indicate that the pattern shown continues. It is impor-tant when illustrating a graph to present enough of the graph so that any viewer ofthe illustration will “see” the rest of it as an obvious continuation of what is actual-ly there. This is referred to as a complete graph.
One way to obtain a complete graph of an equation is to plot a sufficient num-ber of points on the graph until a pattern becomes evident. Then these points areconnected with a smooth curve following the suggested pattern. But how manypoints are sufficient? Sometimes knowledge about the equation tells us. For exam-ple, we will learn in the next section that, if an equation is of the form then its graph is a line. In this case, only two points are needed to obtain the graph.
One purpose of this book is to investigate the properties of equations in orderto decide whether a graph is complete. Sometimes we shall graph equations by plot-ting points. Shortly, we shall investigate various techniques that will enable us tograph an equation without plotting so many points.
COMMENT Another way to obtain the graph of an equation is to use a graphing utility. Read Sec-tion 2, Using a Graphing Utility to Graph Equations, in the Appendix.
Two techniques that sometimes reduce the number of points required to graphan equation involve finding intercepts and checking for symmetry.
2 Find Intercepts from a GraphThe points, if any, at which a graph crosses or touches the coordinate axes are calledthe intercepts. See Figure 14. The x-coordinate of a point at which the graph cross-es or touches the x-axis is an x-intercept, and the y-coordinate of a point at whichthe graph crosses or touches the y-axis is a y-intercept. For a graph to be complete,all its intercepts must be displayed.
y = mx + b,
y = 2x + 5y = 2x + 5,120, 452
x
y
InterceptsGraphtouchesx-axis
Graphcrossesx-axis
Graphcrossesy-axis
Figure 14
Finding Intercepts from a Graph
Find the intercepts of the graph in Figure 15 shown on p. 166. What are its x-intercepts? What are its y-intercepts?
EXAMPLE 4
x y � x2 (x, y)
16
9
4
1
0 0 (0, 0)
1 1 (1, 1)
2 4 (2, 4)
3 9 (3, 9)
4 16 (4, 16)
(- 1, 1)- 1
(- 2, 4)- 2
(- 3, 9)- 3
(- 4, 16)- 4
SULLMC02_013157759X.QXD 11/28/06 1:19 PM Page 165
166 CHAPTER 2 Graphs
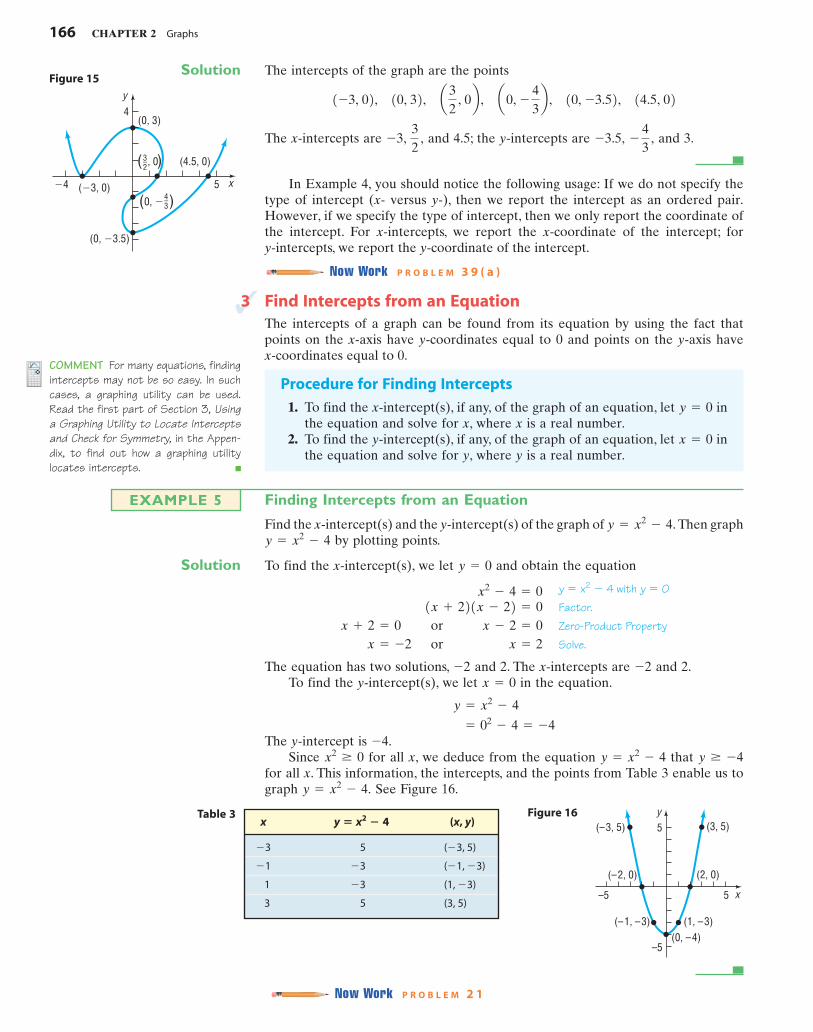
Solution The intercepts of the graph are the points
The x-intercepts are and 4.5; the y-intercepts are and 3.
In Example 4, you should notice the following usage: If we do not specify thetype of intercept (x- versus y-), then we report the intercept as an ordered pair.However, if we specify the type of intercept, then we only report the coordinate ofthe intercept. For x-intercepts, we report the x-coordinate of the intercept; for y-intercepts, we report the y-coordinate of the intercept.
Now Work P R O B L E M 3 9 ( a )
- 43
,-3.5,32
,-3,
1-3, 02, 10, 32, a32
, 0b , a0, - 43b , 10, -3.52, 14.5, 02
x
y
(0, 3)
(�3, 0)
, 0( )
(0, � )4–3
3–2 (4.5, 0)
(0, �3.5)
4
�4 5
Figure 15
Table 3
3 Find Intercepts from an EquationThe intercepts of a graph can be found from its equation by using the fact thatpoints on the x-axis have y-coordinates equal to 0 and points on the y-axis have x-coordinates equal to 0.
Procedure for Finding Intercepts
1. To find the x-intercept(s), if any, of the graph of an equation, let inthe equation and solve for x, where x is a real number.
2. To find the y-intercept(s), if any, of the graph of an equation, let inthe equation and solve for y, where y is a real number.
x = 0
y = 0
Finding Intercepts from an Equation
Find the x-intercept(s) and the y-intercept(s) of the graph of Then graphby plotting points.
Solution To find the x-intercept(s), we let and obtain the equation
y � x2 � 4 with y � 0Factor.Zero-Product PropertySolve.
The equation has two solutions, and 2. The x-intercepts are and 2.To find the y-intercept(s), we let in the equation.
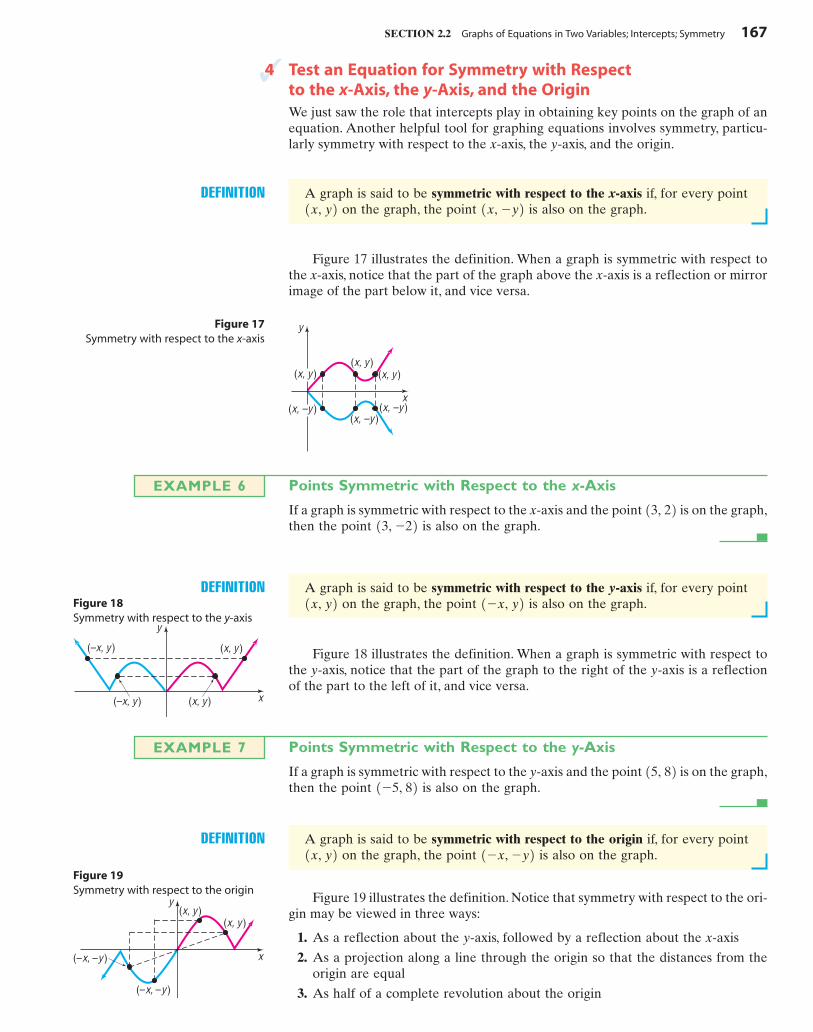
The y-intercept is Since for all x, we deduce from the equation that
for all x. This information, the intercepts, and the points from Table 3 enable us tograph See Figure 16.y = x2
- 4.
y Ú -4y = x2- 4x2
Ú 0-4.
= 02- 4 = -4
y = x2- 4
x = 0-2-2
x = -2 or x = 2x + 2 = 0 or x - 2 = 0 1x + 221x - 22 = 0
x2- 4 = 0
y = 0
y = x2- 4
y = x2- 4.
EXAMPLE 5
x y � x2 � 4 (x, y)
5
1
3 5 (3, 5)
(1, - 3)- 3
(- 1, - 3)- 3- 1
(- 3, 5)- 3
x
y (3, 5)5
(2, 0)
(–1, –3) (1, –3) (0, –4)
(–3, 5)
(–2, 0)
5–5
–5
Figure 16
Now Work P R O B L E M 2 1
COMMENT For many equations, findingintercepts may not be so easy. In suchcases, a graphing utility can be used.Read the first part of Section 3, Usinga Graphing Utility to Locate Interceptsand Check for Symmetry, in the Appen-dix, to find out how a graphing utilitylocates intercepts.
SULLMC02_013157759X.QXD 11/28/06 1:19 PM Page 166
SECTION 2.2 Graphs of Equations in Two Variables; Intercepts; Symmetry 167
4 Test an Equation for Symmetry with Respect to the x-Axis, the y-Axis, and the OriginWe just saw the role that intercepts play in obtaining key points on the graph of anequation. Another helpful tool for graphing equations involves symmetry, particu-larly symmetry with respect to the x-axis, the y-axis, and the origin.
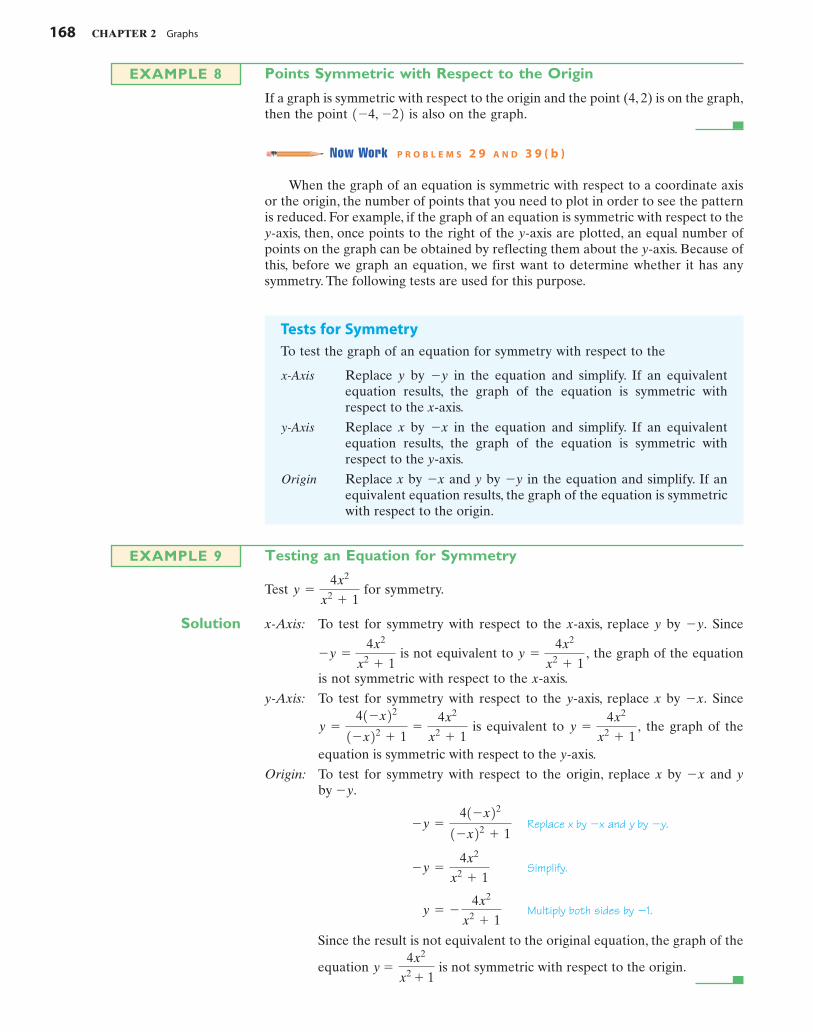
DEFINITION A graph is said to be symmetric with respect to the x-axis if, for every pointon the graph, the point is also on the graph.1x, -y21x, y2
Figure 17 illustrates the definition. When a graph is symmetric with respect tothe x-axis, notice that the part of the graph above the x-axis is a reflection or mirrorimage of the part below it, and vice versa.
(x, –y )
(x, y )
(x, –y )
(x, y )(x, y )
(x, –y )
x
yFigure 17Symmetry with respect to the x-axis
Points Symmetric with Respect to the x-Axis
If a graph is symmetric with respect to the x-axis and the point is on the graph,then the point is also on the graph.13, -22 13, 22
EXAMPLE 6
DEFINITION A graph is said to be symmetric with respect to the y-axis if, for every pointon the graph, the point is also on the graph.1-x, y21x, y2
Figure 18 illustrates the definition. When a graph is symmetric with respect tothe y-axis, notice that the part of the graph to the right of the y-axis is a reflectionof the part to the left of it, and vice versa.
(–x, y )
(–x, y ) (x, y )
(x, y )
x
y
Figure 18Symmetry with respect to the y-axis
Points Symmetric with Respect to the y-Axis
If a graph is symmetric with respect to the y-axis and the point is on the graph,then the point is also on the graph.1-5, 82 15, 82
EXAMPLE 7
DEFINITION A graph is said to be symmetric with respect to the origin if, for every pointon the graph, the point is also on the graph.1-x, -y21x, y2
Figure 19 illustrates the definition. Notice that symmetry with respect to the ori-gin may be viewed in three ways:
1. As a reflection about the y-axis, followed by a reflection about the x-axis
2. As a projection along a line through the origin so that the distances from theorigin are equal
3. As half of a complete revolution about the origin
(x, y )(x, y )
(–x, –y )
(–x, –y ) x
y
Figure 19Symmetry with respect to the origin
SULLMC02_013157759X.QXD 11/28/06 1:19 PM Page 167
168 CHAPTER 2 Graphs
Points Symmetric with Respect to the Origin
If a graph is symmetric with respect to the origin and the point (4, 2) is on the graph,then the point is also on the graph.
Now Work P R O B L E M S 2 9 A N D 3 9 ( b )
When the graph of an equation is symmetric with respect to a coordinate axisor the origin, the number of points that you need to plot in order to see the patternis reduced. For example, if the graph of an equation is symmetric with respect to they-axis, then, once points to the right of the y-axis are plotted, an equal number ofpoints on the graph can be obtained by reflecting them about the y-axis. Because ofthis, before we graph an equation, we first want to determine whether it has anysymmetry. The following tests are used for this purpose.
1-4, -22EXAMPLE 8
Tests for SymmetryTo test the graph of an equation for symmetry with respect to the
Testing an Equation for Symmetry
Test for symmetry.
Solution x-Axis: To test for symmetry with respect to the x-axis, replace y by Since
is not equivalent to the graph of the equation
is not symmetric with respect to the x-axis.
y-Axis: To test for symmetry with respect to the y-axis, replace x by Since
is equivalent to the graph of the
equation is symmetric with respect to the y-axis.
Origin: To test for symmetry with respect to the origin, replace x by and yby
Replace x by and y by
Simplify.
Multiply both sides by
Since the result is not equivalent to the original equation, the graph of the
equation is not symmetric with respect to the origin.y =
4x2
x2+ 1
-1. y = - 4x2
x2+ 1
-y =
4x2
x2+ 1
-y.-x -y =
41-x221-x22 + 1
-y.-x
y =
4x2
x2+ 1
,y =
41-x221-x22 + 1
=
4x2
x2+ 1
-x.
y =
4x2
x2+ 1
,-y =
4x2
x2+ 1
-y.
y =
4x2
x2+ 1
EXAMPLE 9
x-Axis Replace y by �y in the equation and simplify. If an equivalentequation results, the graph of the equation is symmetric withrespect to the x-axis.
y-Axis Replace x by �x in the equation and simplify. If an equivalentequation results, the graph of the equation is symmetric withrespect to the y-axis.
Origin Replace x by �x and y by �y in the equation and simplify. If anequivalent equation results, the graph of the equation is symmetricwith respect to the origin.
SULLMC02_013157759X.QXD 11/28/06 1:19 PM Page 168

SECTION 2.2 Graphs of Equations in Two Variables; Intercepts; Symmetry 169
Seeing the ConceptFigure 20 shows the graph of using a graphing utility. Do you see the symmetry with re-spect to the y-axis?
y =
4x2
x2+ 1
5
�5
�5 5
Figure 20
Now Work P R O B L E M 5 9
5 Know How to Graph Key EquationsThe next three examples use intercepts, symmetry, and point plotting to obtain thegraphs of key equations. It is important to know the graphs of these key equations because we use them later. The first of these is y = x3.
Graphing the Equation y � x3 by Finding Intercepts, Checking for Symmetry, and Plotting Points
Graph the equation by plotting points. Find any intercepts and check forsymmetry first.
Solution First, we seek the intercepts. When then and when then The origin is the only intercept. Now we test for symmetry.10, 02
x = 0.y = 0,y = 0;x = 0,
y = x3
EXAMPLE 10
x-Axis: Replace y by �y. Since �y � x3 is not equivalent to the graphis not symmetric with respect to the x-axis.
y-Axis: Replace x by �x. Since is not equivalent to the graph is not symmetric with respect to the y-axis.
Origin: Replace x by �x and y by �y. Since is equivalentto (multiply both sides by �1), the graph is symmetric withrespect to the origin.
y = x3-y = 1-x23 = -x3
y = x3,y = 1-x23 = -x3
y = x3,
To graph we use the equation to obtain several points on the graph. Be-cause of the symmetry, we only need to locate points on the graph for whichSee Table 4. Since (1, 1) is on the graph, and the graph is symmetric with respect tothe origin, the point is also on the graph. Plot the points from Table 4.Figure 21 shows the graph.
(-1, -1)
x Ú 0.y = x3,
Table 4x y � x3 (x, y)
0 0
1 1
2 8 (2, 8)
3 27 (3, 27)
(1, 1)
(0, 0)
x
y (2, 8)8
(1, 1) (0, 0)
(–1, –1) 6–6
–8 (–2, –8)
Figure 21
SULLMC02_013157759X.QXD 11/28/06 1:19 PM Page 169
170 CHAPTER 2 Graphs
Graphing the Equation x � y2
Graph the equation Find any intercepts and check for symmetry first.
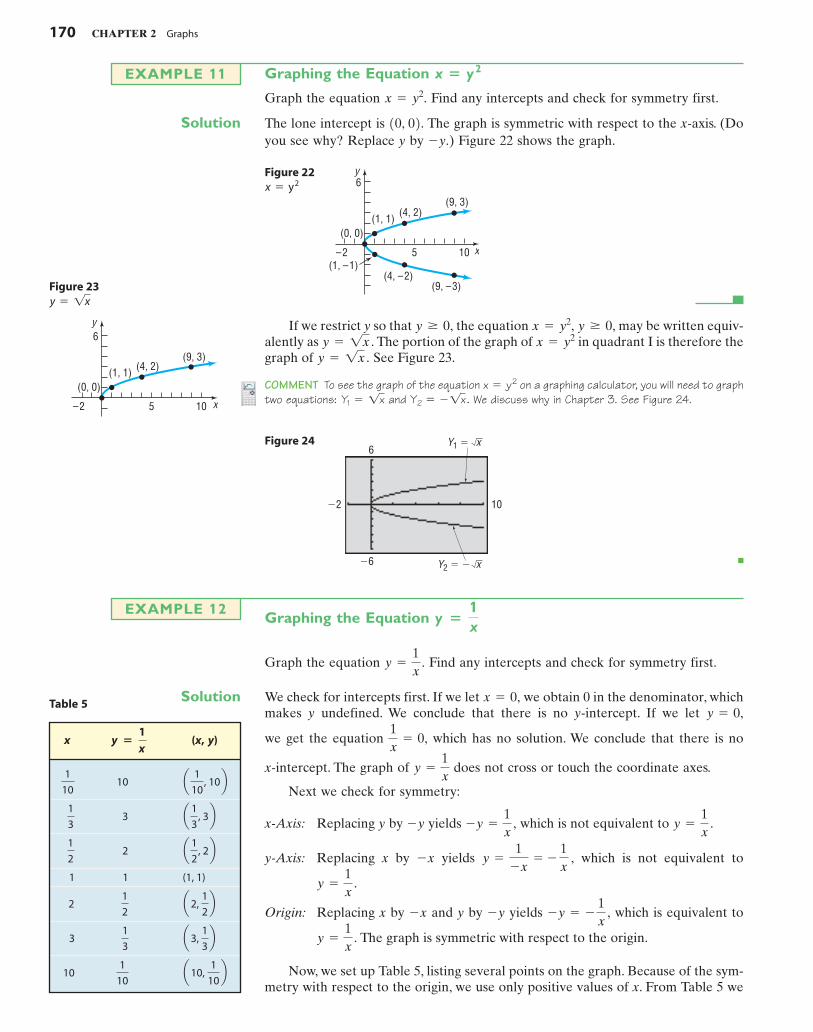
Solution The lone intercept is The graph is symmetric with respect to the x-axis. (Doyou see why? Replace y by ) Figure 22 shows the graph.-y.
10, 02.x = y2.
EXAMPLE 11
x
y
(9, 3)
6
(4, 2)
(0, 0)
(1, –1)10–2
(9, –3)
5
(1, 1)
(4, –2)
Figure 22x = y2
x
y
(9, 3)
6
(4, 2)
(0, 0)
10–2 5
(1, 1)
Figure 23y = 1x
If we restrict y so that the equation may be written equiv-alently as The portion of the graph of in quadrant I is therefore thegraph of See Figure 23.
COMMENT To see the graph of the equation on a graphing calculator, you will need to graphtwo equations: and We discuss why in Chapter 3. See Figure 24.Y2 = -1x .Y1 = 1x
x = y 2
y = 1x .x = y2y = 1x .
y Ú 0,x = y2,y Ú 0,
Y1 �6
�6
�2 10
x
Y2 � � x
Figure 24
Graphing the Equation
Graph the equation Find any intercepts and check for symmetry first.
Solution We check for intercepts first. If we let we obtain 0 in the denominator, whichmakes y undefined. We conclude that there is no y-intercept. If we let
we get the equation which has no solution. We conclude that there is no
x-intercept. The graph of does not cross or touch the coordinate axes.
Next we check for symmetry:
x-Axis: Replacing y by yields which is not equivalent to
y-Axis: Replacing x by yields which is not equivalent to
Origin: Replacing x by and y by yields which is equivalent to
The graph is symmetric with respect to the origin.
Now, we set up Table 5, listing several points on the graph. Because of the sym-metry with respect to the origin, we use only positive values of x. From Table 5 we
y =
1x
.
-y = - 1x
,-y-x
y =
1x
.
y =
1-x
= -
1x
,-x
y =
1x
.-y =
1x
,-y
y =
1x
1x
= 0,
y = 0,x = 0,
y =
1x
.
y �1x
EXAMPLE 12
Table 5
x (x, y)
10
3
2
1 1
2
3
10 a10, 1
10b1
10
a3, 1
3b1
3
a2, 1
2b1
2
(1, 1)
a 1
2 , 2b1
2
a 1
3 , 3b1
3
a 1
10 , 10b1
10
y �1
x
SULLMC02_013157759X.QXD 11/28/06 1:19 PM Page 170
SECTION 2.2 Graphs of Equations in Two Variables; Intercepts; Symmetry 171
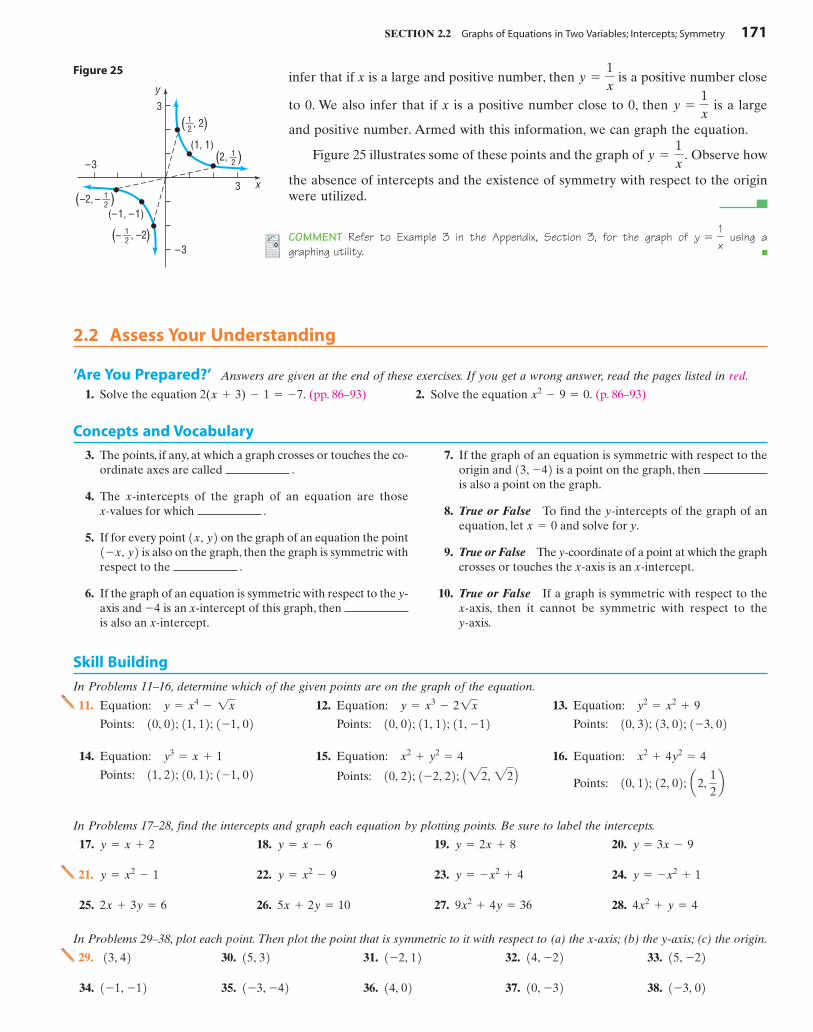
infer that if x is a large and positive number, then is a positive number close
to 0. We also infer that if x is a positive number close to 0, then is a large
and positive number. Armed with this information, we can graph the equation.
Figure 25 illustrates some of these points and the graph of Observe how
the absence of intercepts and the existence of symmetry with respect to the originwere utilized.
COMMENT Refer to Example 3 in the Appendix, Section 3, for the graph of using agraphing utility.
y =
1x
y =
1x
.
y =
1x
y =
1x
x
y
3
3
–3
–3
, 2
–
1––2
(1, 1) 2, 1––
2
–2, ( )
( )
( )
( )
1––2(–1, –1)
, –21––2–
Figure 25
2.2 Assess Your Understanding
‘Are You Prepared?’ Answers are given at the end of these exercises. If you get a wrong answer, read the pages listed in red.
Concepts and Vocabulary
3. The points, if any, at which a graph crosses or touches the co-ordinate axes are called .
4. The x-intercepts of the graph of an equation are those x-values for which .
5. If for every point on the graph of an equation the pointis also on the graph, then the graph is symmetric with
respect to the .
6. If the graph of an equation is symmetric with respect to the y-axis and is an x-intercept of this graph, then is also an x-intercept.
-4
1-x, y21x, y2
7. If the graph of an equation is symmetric with respect to theorigin and is a point on the graph, then is also a point on the graph.
8. True or False To find the y-intercepts of the graph of anequation, let and solve for y.
9. True or False The y-coordinate of a point at which the graphcrosses or touches the x-axis is an x-intercept.
10. True or False If a graph is symmetric with respect to the x-axis, then it cannot be symmetric with respect to the y-axis.
x = 0
13, -42
Skill Building
In Problems 11–16, determine which of the given points are on the graph of the equation.
11. Equation:
Points:
12. Equation:
Points:
13. Equation:
Points: 10, 32; 13, 02; 1-3, 02y2
= x2+ 9
10, 02; 11, 12; 11, -12y = x3
- 21x
10, 02; 11, 12; 1-1, 02y = x4
- 1x
14. Equation:
Points:
15. Equation:
Points:
16. Equation:
Points: 10, 12; 12, 02; a2, 12b
x2+ 4y2
= 4
10, 22; 1-2, 22; A22, 22 Bx2
+ y2= 4
11, 22; 10, 12; 1-1, 02y3
= x + 1
In Problems 17–28, find the intercepts and graph each equation by plotting points. Be sure to label the intercepts.
17. 18. 19. 20. y = 3x - 9y = 2x + 8y = x - 6y = x + 2
21. 22. 23. 24. y = -x2+ 1y = -x2
+ 4y = x2- 9y = x2
- 1
25. 26. 27. 28. 4x2+ y = 49x2
+ 4y = 365x + 2y = 102x + 3y = 6
29. 30. 31. 32. 33. 15, -2214, -221-2, 1215, 3213, 4234. 35. 36. 37. 38. 1-3, 0210, -3214, 021-3, -421-1, -12
In Problems 29–38, plot each point. Then plot the point that is symmetric to it with respect to (a) the x-axis; (b) the y-axis; (c) the origin.
1. Solve the equation (pp. 86–93) 2. Solve the equation (p. 86–93)x2- 9 = 0.2(x + 3) - 1 = -7.
SULLMC02_013157759X.QXD 11/28/06 1:19 PM Page 171

172 CHAPTER 2 Graphs
y6
�6
x3�3
40
�40
x6�6
y
In Problems 39–50, the graph of an equation is given. (a) Find the intercepts. (b) Indicate whether the graph is symmetric with respectto the x-axis, the y-axis, or the origin.
39. 40. 41. 42.3
–3 x
y
3
–3
3
�3 x
y
3
�3
x
y3
3–3
–3
x
y
3
3
–3
–3
�8
8
�2 2
�8
8
�2 2
�4
4
�4 4
x
y
�
1
�1�� �––
2� �––2 x
y
3
4
�4
�3
�3
6
�2
3
9–9
–9
9
x
y
(0, –9)
(2, –5)
x
y
–5 5
–5
5
(–4, 0)(0, 2)
(5, 3)
x
y
–4
4�––2
(�, 0)(0, 0)
( , 2)
y
–3 3
–2
4(0, 4)
(0, 0)(2, 2)
x
43. 44. 45. 46.
47. 48. 49. 50.
51. y-axis 52. x-axis 53. Origin 54. y-axis
In Problems 51–54, draw a complete graph so that it has the type of symmetry indicated.
In Problems 55–70, list the intercepts and test for symmetry.
55. 56. 57. 58. y = 15 xy = 13 xy2= x + 9y2
= x + 4
59. 60. 61. 62. 4x2+ y2
= 49x2+ 4y2
= 36x2- y - 4 = 0x2
+ y - 9 = 0
63. 64. 65. 66. y = x2+ 4y = x2
- 3x - 4y = x4- 1y = x3
- 27
67. 68. 69. 70. y =
x4+ 1
2x5y =
-x3
x2- 9
y =
x2- 4
2xy =
3x
x2+ 9
In Problems 71–74, draw a quick sketch of each equation.
71. 72. 73. 74. y =
1x
y = 1xx = y2y = x3
75. If is a point on the graph of what is b?y = 4x + 1,13, b2 76. If is a point on the graph of what is b?2x + 3y = 2,1-2, b2
77. If is a point on the graph of what is a?y = x2+ 3x,1a, 42 78. If is a point on the graph of what is a?y = x2
+ 6x,1a, -52
SULLMC02_013157759X.QXD 11/28/06 1:19 PM Page 172
SECTION 2.3 Lines 173
Discussion and Writing
In Problem 85, you may use a graphing utility, but it is not required.
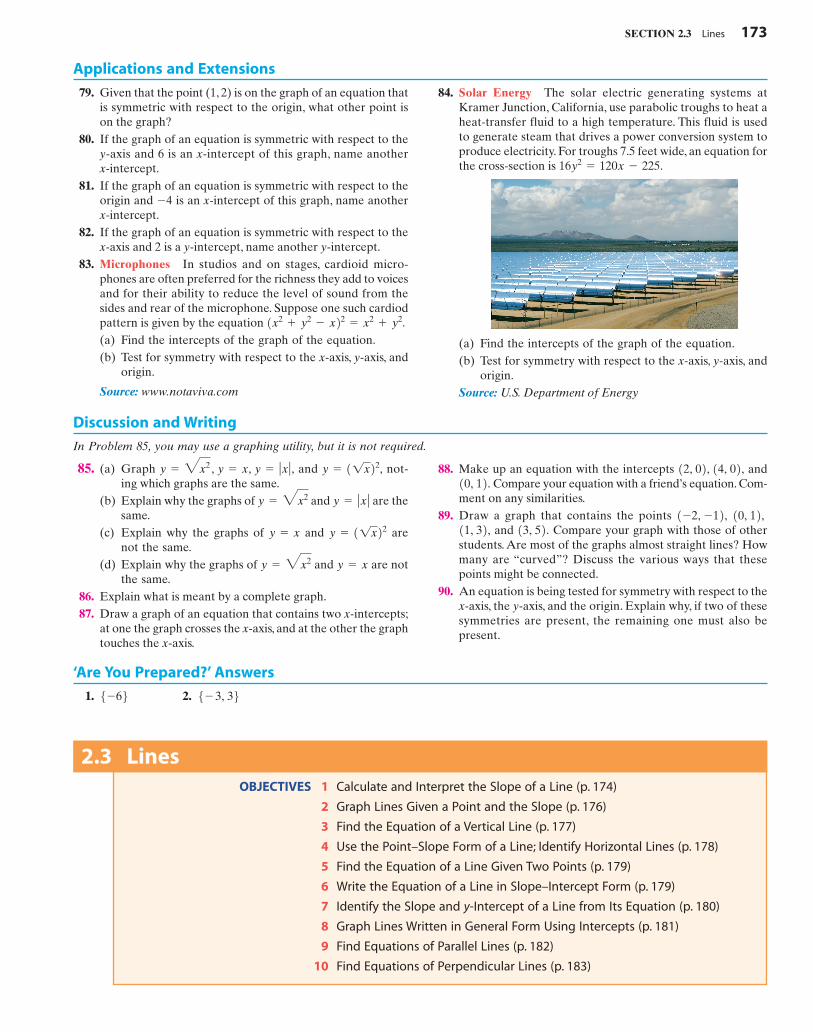
(a) Find the intercepts of the graph of the equation.(b) Test for symmetry with respect to the x-axis, y-axis, and
origin.Source: U.S. Department of Energy
Applications and Extensions
84. Solar Energy The solar electric generating systems atKramer Junction, California, use parabolic troughs to heat aheat-transfer fluid to a high temperature. This fluid is usedto generate steam that drives a power conversion system toproduce electricity. For troughs 7.5 feet wide, an equation forthe cross-section is 16y2
= 120x - 225.
79. Given that the point (1, 2) is on the graph of an equation thatis symmetric with respect to the origin, what other point ison the graph?
80. If the graph of an equation is symmetric with respect to they-axis and 6 is an x-intercept of this graph, name another x-intercept.
81. If the graph of an equation is symmetric with respect to theorigin and is an x-intercept of this graph, name another x-intercept.
82. If the graph of an equation is symmetric with respect to thex-axis and 2 is a y-intercept, name another y-intercept.
83. Microphones In studios and on stages, cardioid micro-phones are often preferred for the richness they add to voicesand for their ability to reduce the level of sound from thesides and rear of the microphone. Suppose one such cardiodpattern is given by the equation (a) Find the intercepts of the graph of the equation.(b) Test for symmetry with respect to the x-axis, y-axis, and
origin.
Source: www.notaviva.com
1x2+ y2
- x22 = x2+ y2.
-4
85. (a) Graph and not-ing which graphs are the same.
(b) Explain why the graphs of and are thesame.
(c) Explain why the graphs of and arenot the same.
(d) Explain why the graphs of and are notthe same.
86. Explain what is meant by a complete graph.87. Draw a graph of an equation that contains two x-intercepts;
at one the graph crosses the x-axis, and at the other the graphtouches the x-axis.
y = xy = 3x2
y = 11x22y = x
y = ƒx ƒy = 3x2
y = 11x22,y = 3x2 , y = x, y = ƒx ƒ , 88. Make up an equation with the intercepts andCompare your equation with a friend’s equation. Com-
ment on any similarities.89. Draw a graph that contains the points
and Compare your graph with those of otherstudents. Are most of the graphs almost straight lines? Howmany are “curved”? Discuss the various ways that thesepoints might be connected.
90. An equation is being tested for symmetry with respect to thex-axis, the y-axis, and the origin. Explain why, if two of thesesymmetries are present, the remaining one must also bepresent.
13, 52.11, 32,10, 12, 1-2, -12,
10, 12.12, 02, 14, 02,
‘Are You Prepared?’ Answers
1. 2. 5- 3, 365-66
2.3 LinesOBJECTIVES 1 Calculate and Interpret the Slope of a Line (p. 174)
2 Graph Lines Given a Point and the Slope (p. 176)
3 Find the Equation of a Vertical Line (p. 177)
4 Use the Point–Slope Form of a Line; Identify Horizontal Lines (p. 178)
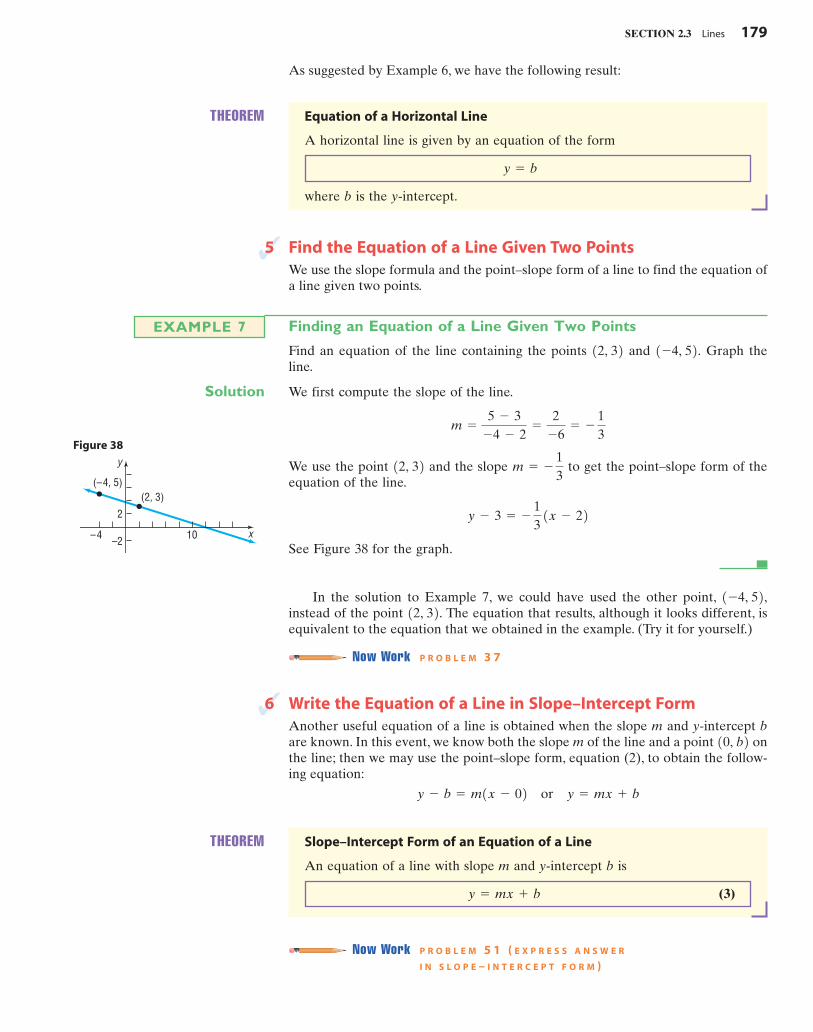
5 Find the Equation of a Line Given Two Points (p. 179)
6 Write the Equation of a Line in Slope–Intercept Form (p. 179)
7 Identify the Slope and y-Intercept of a Line from Its Equation (p. 180)
8 Graph Lines Written in General Form Using Intercepts (p. 181)
9 Find Equations of Parallel Lines (p. 182)
10 Find Equations of Perpendicular Lines (p. 183)
SULLMC02_013157759X.QXD 11/28/06 1:19 PM Page 173
174 CHAPTER 2 Graphs
x
y
R
AC
B
y2 – y1
Q = (x2, y2)
P = (x1, y1)
x2 – x1
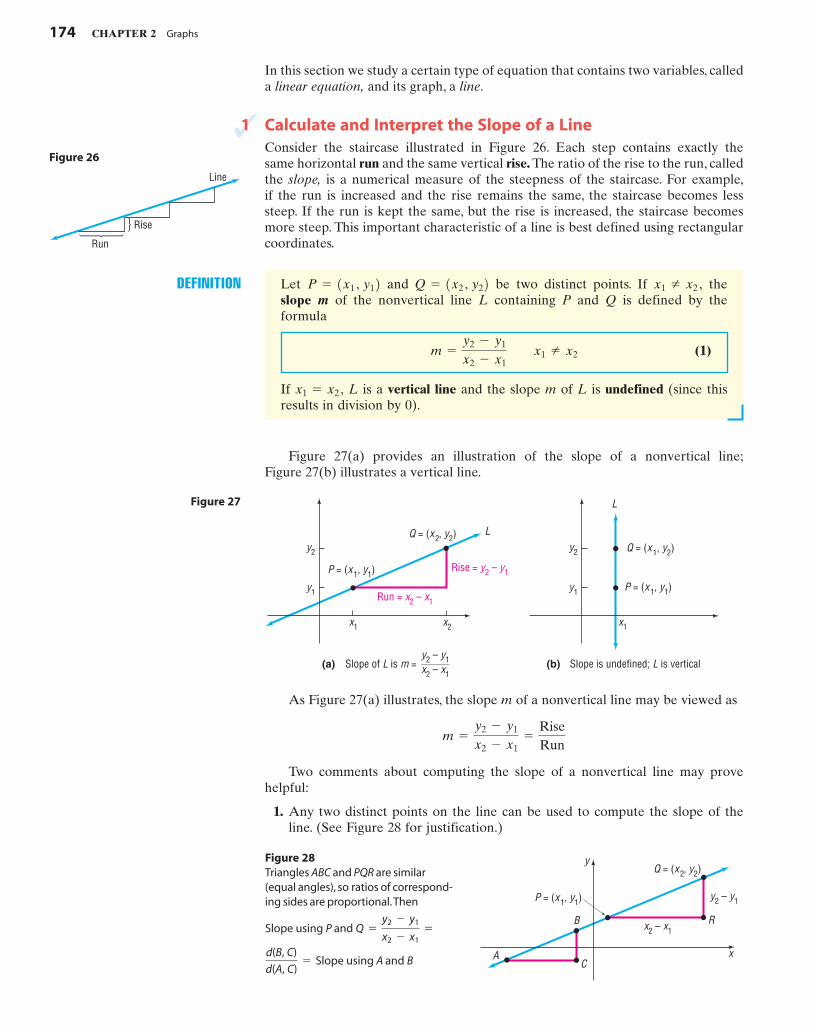
Figure 28Triangles ABC and PQR are similar(equal angles), so ratios of correspond-ing sides are proportional.Then
d(B, C)
d(A, C)= Slope using A and B
Slope using P and Q =
y2 - y1
x2 - x1=
In this section we study a certain type of equation that contains two variables, calleda linear equation, and its graph, a line.
Rise
Line
Run
Figure 26
Rise = y2 – y1
Q = (x2, y2)
P = (x1, y1)
L
Run = x2 – x1
Slope of L is m = (a)
x1 x2
y2
y1
y2 – y1_______x2 – x1
Q = (x1, y2)
P = (x1, y1)
L
Slope is undefined; L is vertical(b)
x1
y2
y1
Figure 27
As Figure 27(a) illustrates, the slope m of a nonvertical line may be viewed as
Two comments about computing the slope of a nonvertical line may provehelpful:
1. Any two distinct points on the line can be used to compute the slope of theline. (See Figure 28 for justification.)
m =
y2 - y1
x2 - x1=
RiseRun
Figure 27(a) provides an illustration of the slope of a nonvertical line;Figure 27(b) illustrates a vertical line.
DEFINITION Let and be two distinct points. If the slope m of the nonvertical line L containing P and Q is defined by the formula
(1)
If L is a vertical line and the slope m of L is undefined (since thisresults in division by 0).
x1 = x2 ,
m =
y2 - y1
x2 - x1 x1 Z x2
x1 Z x2 ,Q = 1x2 , y22P = 1x1 , y12
1 Calculate and Interpret the Slope of a LineConsider the staircase illustrated in Figure 26. Each step contains exactly thesame horizontal run and the same vertical rise. The ratio of the rise to the run, calledthe slope, is a numerical measure of the steepness of the staircase. For example,if the run is increased and the rise remains the same, the staircase becomes lesssteep. If the run is kept the same, but the rise is increased, the staircase becomesmore steep. This important characteristic of a line is best defined using rectangularcoordinates.
SULLMC02_013157759X.QXD 11/28/06 1:19 PM Page 174

SECTION 2.3 Lines 175
2. The slope of a line may be computed from to or fromQ to P because
Finally, we can also express the slope m of a nonvertical line as
That is, the slope m of a nonvertical line L measures the amount that y changes as
x changes from to The expression is called the average rate of change of y with respect to x.
Since any two distinct points can be used to compute the slope of a line, theaverage rate of change of a line is always the same number.
¢y
¢xx2 .x1
m =
y2 - y1
x2 - x1=
Change in y
Change in x=
¢y
¢x
y2 - y1
x2 - x1=
y1 - y2
x1 - x2
Q = 1x2 , y22P = 1x1 , y12
Finding and Interpreting the Slope of a Line Given Two Points
The slope m of the line containing the points and may be computed as
For every 4-unit change in x, y will change by That is, if x increases by4 units, then y will decrease by 5 units. The average rate of change of y with respect
to x is
Now Work P R O B L E M S 1 1 A N D 1 7
To get a better idea of the meaning of the slope m of a line L, consider thefollowing example.
- 54
.
-5 units.
m =
-3 - 25 - 1
=
-54
= - 54 or as m =
2 - 1-321 - 5
=
5-4
= - 54
15, -3211, 22EXAMPLE 1
Finding the Slopes of Various Lines Containing the Same Point (2, 3)
Compute the slopes of the lines and containing the following pairsof points. Graph all four lines on the same set of coordinate axes.
Solution Let and denote the slopes of the lines and respectively. Then
A rise of 5 divided by a run of 3
The graphs of these lines are given in Figure 29.
m4 is undefined because x1 = x2 = 2
m3 =
3 - 35 - 2
=
03
= 0
m2 =
-1 - 33 - 2
=
-41
= -4
m1 =
-2 - 3-1 - 2
=
-5-3
=
53
L4 ,L3 ,L2 ,L1 ,m4m1 , m2 , m3 ,
L4 : P = 12, 32 Q4 = 12, 52 L3 : P = 12, 32 Q3 = 15, 32 L2 : P = 12, 32 Q2 = 13, -12 L1 : P = 12, 32 Q1 = 1-1, -22
L4L3 ,L2 ,L1 ,
EXAMPLE 2
Figure 29
x
y
�5 5
5
�3
Q4 � (2, 5)
Q1 � (�1, �2)
m1 � m2 � �4m4 undefined
m3 � 0m3 � 0
L4
Q3 � (5, 3)
Q2 � (3, �1)
P � (2, 3)
5–3
L3L3
L2 L1
SULLMC02_013157759X.QXD 11/28/06 1:19 PM Page 175

176 CHAPTER 2 Graphs
Figure 29 illustrates the following facts:
1. When the slope of a line is positive, the line slants upward from left toright
2. When the slope of a line is negative, the line slants downward from leftto right
3. When the slope is 0, the line is horizontal 4. When the slope is undefined, the line is vertical 1L42.
1L32.1L22.
1L12.
Seeing the ConceptOn the same screen, graph the following equations:
Slope of line is 0.
Slope of line is
Slope of line is
Slope of line is 1.Slope of line is 2.Slope of line is 6.
See Figure 30. Y6 = 6x
Y5 = 2x
Y4 = x
12
. Y3 =
1
2 x
14
. Y2 =
1
4 x
Y1 = 0
Seeing the ConceptOn the same screen, graph the following equations:
Slope of line is 0.
Slope of line is
Slope of line is
Slope of line is �1.Slope of line is �2.Slope of line is �6.
See Figure 31. Y6 = - 6x
Y5 = - 2x
Y4 = - x
- 12
. Y3 = - 1
2 x
- 14
. Y2 = - 1
4 x
Y1 = 0
�2
2
14
Y6 � �6xY5 � �2xY4 � �x
Y3 � � x
Y2 � � x
Y1 � 0
�3 3
12
Figure 31
�2
2
14
Y6 � 6xY5 � 2x
Y4 � x
Y3 � x
Y2 � x
Y1 � 0
�3 3
12
Figure 30
Figures 30 and 31 illustrate that the closer the line is to the vertical position, thegreater the magnitude of the slope.
2 Graph Lines Given a Point and the SlopeThe next example illustrates how the slope of a line can be used to graph the line.
Graphing a Line Given a Point and a Slope
Draw a graph of the line that contains the point and has a slope of:
(a) (b)
Solution (a) The fact that the slope is means that for every horizontal
movement (run) of 4 units to the right there will be a vertical movement (rise)of 3 units. Look at Figure 32. If we start at the given point and move 4 unitsto the right and 3 units up, we reach the point By drawing the line throughthis point and the point we have the graph.13, 22,
17, 52.13, 22
34
Slope =
RiseRun
.
- 45
34
13, 22EXAMPLE 3
SULLMC02_013157759X.QXD 11/28/06 1:19 PM Page 176
SECTION 2.3 Lines 177
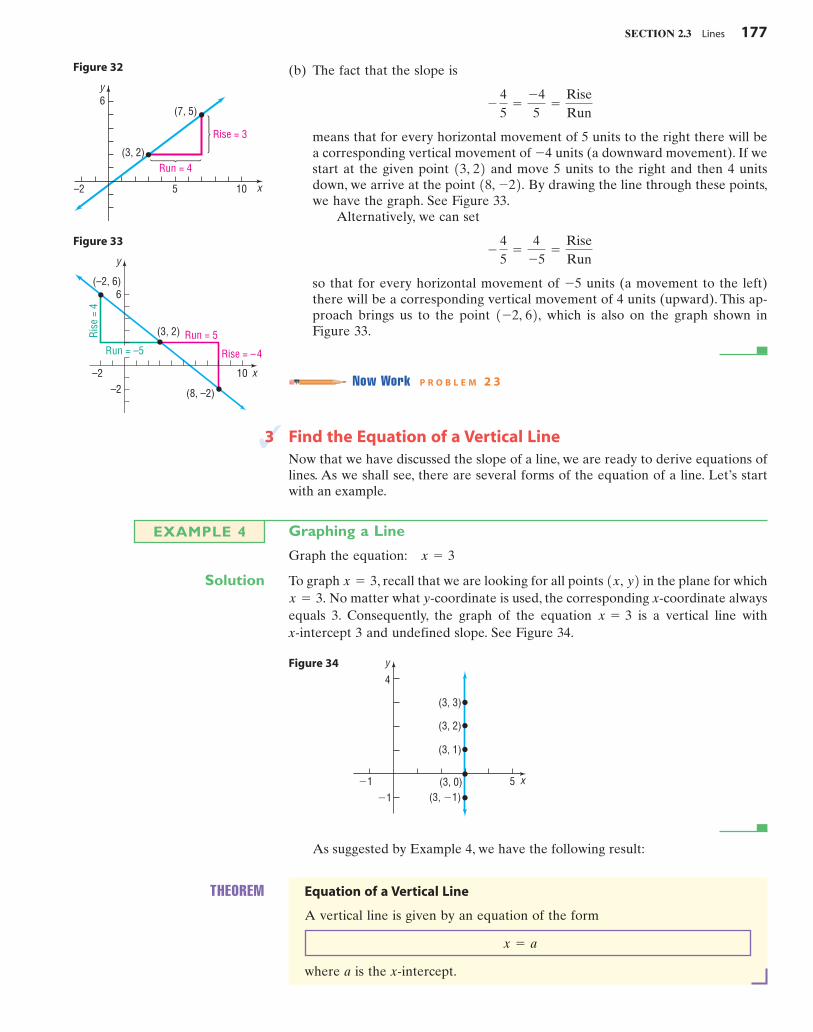
(b) The fact that the slope is
means that for every horizontal movement of 5 units to the right there will bea corresponding vertical movement of units (a downward movement). If westart at the given point and move 5 units to the right and then 4 unitsdown, we arrive at the point By drawing the line through these points,we have the graph. See Figure 33.
Alternatively, we can set
so that for every horizontal movement of units (a movement to the left)there will be a corresponding vertical movement of 4 units (upward). This ap-proach brings us to the point which is also on the graph shown inFigure 33.
Now Work P R O B L E M 2 3
1-2, 62,-5
- 45
=
4-5
=
RiseRun
18, -22.13, 22 -4
- 45
=
-45
=
RiseRun
x
y
–2 10
Rise = 3
Run = 4
(7, 5)
(3, 2)
5
6
Figure 32
x
y
–2 10
(8, –2)
(–2, 6)
(3, 2)
6
–2
Run = 5Run = –5
Rise
= 4
Rise = –4
Figure 33
3 Find the Equation of a Vertical LineNow that we have discussed the slope of a line, we are ready to derive equations oflines. As we shall see, there are several forms of the equation of a line. Let’s startwith an example.
Graphing a Line
Graph the equation:
Solution To graph , recall that we are looking for all points in the plane for whichNo matter what y-coordinate is used, the corresponding x-coordinate always
equals 3. Consequently, the graph of the equation is a vertical line with x-intercept 3 and undefined slope. See Figure 34.
x = 3x = 3.
1x, y2x = 3
x = 3
EXAMPLE 4
x
y
5�1
(3, 3)
(3, 2)
(3, 1)
(3, 0)(3, �1)
4
�1
Figure 34
As suggested by Example 4, we have the following result:
THEOREM Equation of a Vertical Line
A vertical line is given by an equation of the form
where a is the x-intercept.
x = a
SULLMC02_013157759X.QXD 11/28/06 1:19 PM Page 177

178 CHAPTER 2 Graphs
COMMENT To graph an equation using a graphing utility, we need to express the equation in theform in But cannot be put in this form. To overcome this, most graph-ing utilities have special commands for drawing vertical lines. DRAW, LINE, PLOT, and VERT areamong the more common ones. Consult your manual to determine the correct methodology for yourgraphing utility.
x = 3x6.y = 5expression
4 Use the Point–Slope Form of a Line; Identify Horizontal LinesNow let L be a nonvertical line with slope m and containing the point SeeFigure 35. For any other point on L, we have
m =
y - y1
x - x1 or y - y1 = m1x - x12
1x, y2 1x1 , y12.
THEOREM Point–Slope Form of an Equation of a Line
An equation of a nonvertical line with slope m that contains the point is
(2)y - y1 = m1x - x121x1 , y12
x
y
(x, y)L
(x1, y1)
x – x1
y – y1
Figure 35
Using the Point–Slope Form of a Line
An equation of the line with slope 4 and containing the point can be foundby using the point–slope form with and
Solve for y.
See Figure 36 for the graph.
Now Work P R O B L E M 4 5
y = 4x - 2
m = 4, x1 = 1, y1 = 2 y - 2 = 41x - 12 y - y1 = m1x - x12
y1 = 2.m = 4, x1 = 1,11, 22
EXAMPLE 5
x
y
�2 105
(1, 2)
(2, 6)6
Run � 1
Rise � 4
Figure 36
Finding the Equation of a Horizontal Line
Find an equation of the horizontal line containing the point
Solution Because all the y-values are equal on a horizontal line, the slope of a horizontalline is 0. To get an equation, we use the point–slope form with and
See Figure 37 for the graph.
y = 2
y - 2 = 0
m = 0, x1 = 3, and y1 = 2 y - 2 = 0 # 1x - 32 y - y1 = m1x - x12
y1 = 2.m = 0, x1 = 3,
13, 22.EXAMPLE 6
(3, 2)
x
y
–1 531
4
Figure 37
SULLMC02_013157759X.QXD 11/28/06 1:19 PM Page 178
SECTION 2.3 Lines 179
As suggested by Example 6, we have the following result:
THEOREM Equation of a Horizontal Line
A horizontal line is given by an equation of the form
where b is the y-intercept.
y = b
5 Find the Equation of a Line Given Two PointsWe use the slope formula and the point–slope form of a line to find the equation ofa line given two points.
Finding an Equation of a Line Given Two Points
Find an equation of the line containing the points and Graph theline.
Solution We first compute the slope of the line.
We use the point and the slope to get the point–slope form of theequation of the line.
See Figure 38 for the graph.
y - 3 = - 13
1x - 22
m = - 13
12, 32
m =
5 - 3-4 - 2
=
2-6
= - 13
1-4, 52.12, 32EXAMPLE 7
In the solution to Example 7, we could have used the other point,instead of the point The equation that results, although it looks different, isequivalent to the equation that we obtained in the example. (Try it for yourself.)
Now Work P R O B L E M 3 7
12, 32. 1-4, 52,
x
y
–4 10
(–4, 5)(2, 3)
2
–2
Figure 38
6 Write the Equation of a Line in Slope–Intercept FormAnother useful equation of a line is obtained when the slope m and y-intercept bare known. In this event, we know both the slope m of the line and a point onthe line; then we may use the point–slope form, equation (2), to obtain the follow-ing equation:
y - b = m1x - 02 or y = mx + b
10, b2
THEOREM Slope–Intercept Form of an Equation of a Line
An equation of a line with slope m and y-intercept b is
(3)y = mx + b
Now Work P R O B L E M 5 1 ( E X P R E S S A N S W E R
I N S L O P E – I N T E R C E P T F O R M )
SULLMC02_013157759X.QXD 11/28/06 1:19 PM Page 179

180 CHAPTER 2 Graphs
Seeing the ConceptTo see the role that the slope m plays, graph the following lines on the same screen.
See Figure 39. What do you conclude about the lines y = mx + 2?
Y5 = - 3x + 2
Y4 = 3x + 2
Y3 = - x + 2
Y2 = x + 2
Y1 = 2
Seeing the ConceptTo see the role of the y-intercept b, graph the following lines on the same screen.
See Figure 40. What do you conclude about the lines y = 2x + b?
Y5 = 2x - 4
Y4 = 2x + 4
Y3 = 2x - 1
Y2 = 2x + 1
Y1 = 2x
�4
4Y4 � 3x � 2Y5 � �3x � 2
Y3 � �x � 2 Y2 � x � 2
Y1 � 2
�6 6
Figure 39 y = mx + 2
�4
4
Y4 � 2x � 4
Y5 � 2x � 4Y3 � 2x � 1
Y2 � 2x � 1Y1 � 2x
�6 6
Figure 40 y = 2x + b
7 Identify the Slope and y-Intercept of a Line from Its EquationWhen the equation of a line is written in slope–intercept form, it is easy to find theslope m and y-intercept b of the line. For example, suppose that the equation of aline is
Compare it to
The slope of this line is and its y-intercept is 7.
Now Work P R O B L E M 7 1
-2
y = mx + bqq
y = -2x + 7y = mx + b.
y = -2x + 7
Finding the Slope and y-Intercept
Find the slope m and y-intercept b of the equation Graph theequation.
Solution To obtain the slope and y-intercept, we write the equation in slope–intercept formby solving for y.
The coefficient of x, is the slope, and the y-intercept is 2. We can graph the line
using the fact that the y-intercept is 2 and the slope is Then, starting at the point
go to the right 2 units and then down 1 unit to the point See Figure 41.
Now Work P R O B L E M 7 7
12, 12.10, 22,-
12
.
- 12
,
y = mx + b y = - 12
x + 2
4y = -2x + 8
2x + 4y = 8
2x + 4y = 8.
EXAMPLE 8
x
y
–3 3
(0, 2)(2, 1)
21
4
Figure 41
SULLMC02_013157759X.QXD 11/28/06 1:19 PM Page 180

SECTION 2.3 Lines 181
8 Graph Lines Written in General Form Using InterceptsRefer to Example 8. The form of the equation of the line is called thegeneral form.
2x + 4y = 8,
*Some books use the term standard form.
DEFINITION The equation of a line is in general form* when it is written as
(4)
where A, B, and C are real numbers and A and B are not both 0.
Ax + By = C
When we want to graph an equation that is written in general form, we can solvethe equation for y and write the equation in slope–intercept form as we did inExample 8. Another approach to graphing the equation would be to find its inter-cepts. Remember, the intercepts of the graph of an equation are the points wherethe graph crosses or touches a coordinate axis.
Graphing an Equation in General Form Using Its Intercepts
Graph the equation by finding its intercepts.
Solution To obtain the x-intercept, let in the equation and solve for x.
Let
Divide both sides by 2.
The x-intercept is 4 and the point is on the graph of the equation.To obtain the y-intercept, let in the equation and solve for y.
Let
Divide both sides by 4.
The y-intercept is 2 and the point is on the graph of the equation.We plot the points and on a Cartesian plane and draw a line through
the points. See Figure 42.
Now Work P R O B L E M 9 1
10, 2214, 0210, 22
y = 2
4y = 8
x = 0. 2102 + 4y = 8
2x + 4y = 8
x = 014, 02
x = 4
2x = 8
y = 0. 2x + 4102 = 8
2x + 4y = 8
y = 0
2x + 4y = 8
EXAMPLE 9
x
y
–3 3
(0, 2)
(4, 0)
4
Figure 42
Every line has an equation that is equivalent to an equation written in generalform. For example, a vertical line whose equation is
can be written in the general form
A horizontal line whose equation is
can be written in the general form
A = 0, B = 1, C = b0 # x + 1 # y = b
y = b
A = 1, B = 0, C = a1 # x + 0 # y = a
x = a
SULLMC02_013157759X.QXD 11/28/06 1:19 PM Page 181
182 CHAPTER 2 Graphs
Lines that are neither vertical nor horizontal have general equations of the form
and
Because the equation of every line can be written in general form, any equationequivalent to equation (4) is called a linear equation.
B Z 0A Z 0Ax + By = C
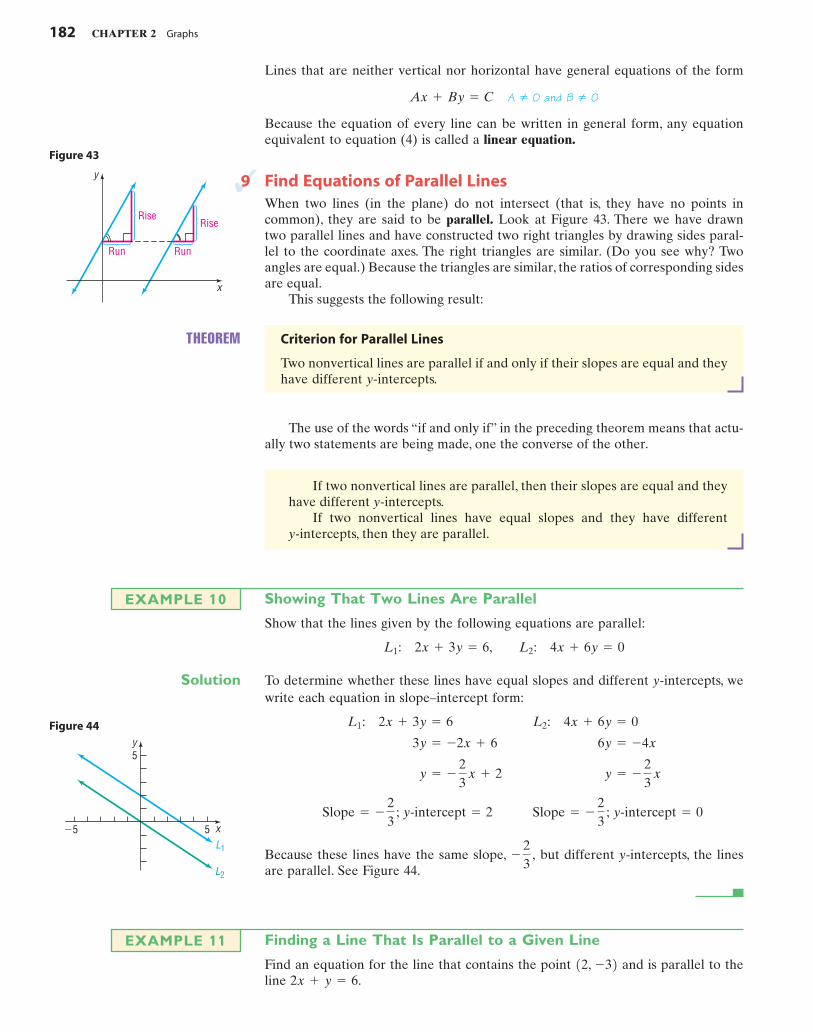
9 Find Equations of Parallel LinesWhen two lines (in the plane) do not intersect (that is, they have no points incommon), they are said to be parallel. Look at Figure 43. There we have drawntwo parallel lines and have constructed two right triangles by drawing sides paral-lel to the coordinate axes. The right triangles are similar. (Do you see why? Twoangles are equal.) Because the triangles are similar, the ratios of corresponding sidesare equal.
This suggests the following result:
y
Rise
Run Run
Rise
x
Figure 43
THEOREM Criterion for Parallel Lines
Two nonvertical lines are parallel if and only if their slopes are equal and theyhave different y-intercepts.
The use of the words “if and only if” in the preceding theorem means that actu-ally two statements are being made, one the converse of the other.
If two nonvertical lines are parallel, then their slopes are equal and theyhave different y-intercepts.
If two nonvertical lines have equal slopes and they have different y-intercepts, then they are parallel.
Showing That Two Lines Are Parallel
Show that the lines given by the following equations are parallel:
Solution To determine whether these lines have equal slopes and different y-intercepts, wewrite each equation in slope–intercept form:
Because these lines have the same slope, but different y-intercepts, the linesare parallel. See Figure 44.
- 23
,
Slope = - 23
; y-intercept = 2 Slope = - 23
; y-intercept = 0
y = - 23
x + 2 y = - 23
x
3y = -2x + 6 6y = -4x
L1 : 2x + 3y = 6 L2 : 4x + 6y = 0
L1 : 2x + 3y = 6, L2 : 4x + 6y = 0
EXAMPLE 10
Finding a Line That Is Parallel to a Given Line
Find an equation for the line that contains the point and is parallel to theline 2x + y = 6.
12, -32EXAMPLE 11
y5
5L1
L2
�5 x
Figure 44
SULLMC02_013157759X.QXD 11/28/06 1:19 PM Page 182

SECTION 2.3 Lines 183
Solution Since the two lines are to be parallel, the slope of the line that we seek equals theslope of the line We begin by writing the equation of the line
in slope–intercept form.
The slope is Since the line that we seek also has slope �2 and contains thepoint we use the point–slope form to obtain its equation.
Point–slope form
Simplify.
Slope–intercept form
General form
This line is parallel to the line and contains the point See Figure 45.
Now Work P R O B L E M 5 9
12, -32.2x + y = 6
2x + y = 1
y = -2x + 1
y + 3 = -2x + 4
m = -2, x1 = 2, y1 = -3 y - 1-32 = -21x - 22 y - y1 = m1x - x12
12, -32, -2.
y = -2x + 6
2x + y = 6
2x + y = 62x + y = 6.
y
6
�5
6�6
(2, �3)
2x � y � 1
2x � y � 6
x
Figure 45
10 Find Equations of Perpendicular LinesWhen two lines intersect at a right angle (90°), they are said to be perpendicular. SeeFigure 46.
y
90°
x
Figure 46
The following result gives a condition, in terms of their slopes, for two lines tobe perpendicular.
THEOREM Criterion for Perpendicular Lines
Two nonvertical lines are perpendicular if and only if the product of theirslopes is -1.
Here we shall prove the “only if” part of the statement:
If two nonvertical lines are perpendicular, then the product of their slopesis -1.
In Problem 128 you are asked to prove the “if” part of the theorem; that is:
If two nonvertical lines have slopes whose product is then the lines areperpendicular.
-1,
SULLMC02_013157759X.QXD 11/28/06 1:19 PM Page 183

184 CHAPTER 2 Graphs
x
y
Run = 1O Rise = m1
Rise = m2
A = (1, m2)
B = (1, m1)
Slope m2
Slope m1
1
Figure 47 Proof Let and denote the slopes of the two lines. There is no loss in gen-erality (that is, neither the angle nor the slopes are affected) if we situate the linesso that they meet at the origin. See Figure 47. The point is on the linehaving slope and the point is on the line having slope (Do yousee why this must be true?)
Suppose that the lines are perpendicular. Then triangle OAB is a right triangle.As a result of the Pythagorean Theorem, it follows that
(5)
Using the distance formula, we can write the squares of these distances as
Using these facts in equation (5), we get
which, upon simplification, can be written as
If the lines are perpendicular, the product of their slopes is -1.
m1 m2 = -1
11 + m222 + 11 + m1
22 = m22
- 2m1 m2 + m12
3d1A, B242 = 11 - 122 + 1m2 - m122 = m22
- 2m1 m2 + m12
3d1O, B242 = 11 - 022 + 1m1 - 022 = 1 + m12
3d1O, A242 = 11 - 022 + 1m2 - 022 = 1 + m22
3d1O, A242 + 3d1O, B242 = 3d1A, B242
m1 .B = 11, m12m2 ,A = 11, m22
m2m1
You may find it easier to remember the condition for two nonvertical lines tobe perpendicular by observing that the equality means that and
are negative reciprocals of each other; that is, either or m2 = - 1
m1.m1 = -
1m2
m2m1m1 m2 = -1
Finding the Slope of a Line Perpendicular to Another Line
If a line has slope any line having slope is perpendicular to it.- 23
32
,
EXAMPLE 12
Finding the Equation of a Line Perpendicular to a Given Line
Find an equation of the line that contains the point and is perpendicular tothe line Graph the two lines.
Solution We first write the equation of the given line in slope–intercept form to find its slope.
Proceed to solve for y.
Place in the form
The given line has slope Any line perpendicular to this line will have slope 3.
Because we require the point to be on this line with slope 3, we use thepoint–slope form of the equation of a line.
Point–slope form
m = 3, x1 = 1, y1 = -2 y - 1-22 = 31x - 12 y - y1 = m1x - x12
11, -22-
13
.
y = mx + b. y = - 13
x + 2
3y = -x + 6
x + 3y = 6
x + 3y = 6.11, -22
EXAMPLE 13
SULLMC02_013157759X.QXD 11/28/06 1:19 PM Page 184

SECTION 2.3 Lines 185
To obtain other forms of the equation, we proceed as follows:
Simplify.
Slope–intercept form
General form
Figure 48 shows the graphs.
Now Work P R O B L E M 6 5
3x - y = 5
y = 3x - 5
y + 2 = 3x - 3
y + 2 = 31x - 12
x
y6
642�2
�4
�2
2
4
(1, �2)
y � 3x � 5
x � 3y � 6
Figure 48
WARNING Be sure to use a square screen when you graph perpendicular lines. Otherwise, the anglebetween the two lines will appear distorted. A discussion of square screens is given in section 5 ofthe Appendix.
2.3 Assess Your Understanding
Concepts and Vocabulary
1. The slope of a vertical line is __________; the slope of a hori-zontal line is __________ .
2. For the line the x-intercept is __________ andthe y-intercept is __________ .
3. A horizontal line is given by an equation of the form__________, where b is the __________ .
4. True or False Vertical lines have an undefined slope.
5. True or False The slope of the line is 3.
6. True or False The point is on the line 2x + y = 4.11, 222y = 3x + 5
2x + 3y = 6,
7. Two nonvertical lines have slopes and respectively.The lines are parallel if __________ and the __________ areunequal; the lines are perpendicular if __________ .
8. The lines and are parallel if __________ .
9. The lines and are perpendicular if__________ .
10. True or False Perpendicular lines have slopes that are rec-iprocals of one another.
a =
y = ax + 2y = 2x - 1
a =
y = ax + 5y = 2x + 3
m2 ,m1
Skill Building
In Problems 11–14, (a) find the slope of the line and (b) interpret the slope.
11. 12. 13. 14.
x
y
–2 2(0, 0)
(2, 1)2
–1x
y
–2 2
(–2, 1)
(0, 0)
2
–1x
y
–2 2
(–2, 2) (1, 1)2
–1x
y
–2 2
(–1, 1)(2, 2)
2
–1
In Problems 15–22, plot each pair of points and determine the slope of the line containing them. Graph the line.
15. 16. 17. 18. 1-1, 12; 12, 321-2, 32; 12, 1214, 22; 13, 4212, 32; 14, 0219. 20. 21. 22. 12, 02; 12, 221-1, 22; 1-1, -2214, 22; 1-5, 221-3, -12; 12, -12
In Problems 23–30, graph the line containing the point P and having slope m.
23. P = 11, 22; m = 3 24. P = 12, 12; m = 4 25. P = 12, 42; m = - 34
26. P = 11, 32; m = - 25
27. P = 1-1, 32; m = 0 28. P = 12, -42; m = 0 29. slope undefinedP = 10, 32; 30. slope undefinedP = 1-2, 02;
In Problems 31–36, the slope and a point on a line are given. Use this information to locate three additional points on the line. Answersmay vary.
[Hint: It is not necessary to find the equation of the line. See Example 3.]
31. Slope 4; point 32. Slope 2; point 33. Slope point 12, -42- 32
;1-2, 3211, 2234. Slope point 35. Slope point 36. Slope point 14, 12-1;1-2, -32-2;1-3, 224
3;
SULLMC02_013157759X.QXD 11/28/06 1:19 PM Page 185

186 CHAPTER 2 Graphs
x
y
–2 2
(–2, 1)
(0, 0)
2
–1 L x
y
–2 2
(–1, 3)(1, 1)
3
–1
L
y = –x
(1, 2)
L
L is parallel to y = –x
x
y
3
3
–3y = 2x
L is perpendicularto y = 2x
(1, 2)
L
x
y
3
3
–3
x
y
–2 2(0, 0)
(2, 1)2
–1
L
x
y
–2 2
(–1, 1)(2, 2)
2
–1
L
y = 2x
(3, 3)
L is parallel to y = 2x
Lx
y
3
3
–3
In Problems 37–44, find an equation of the line L.
37. 38. 39. 40.
41. 42. 43. 44.
y = –x
x
y
(–1, 1)
3
3
–3L
L is perpendicularto y = –x
In Problems 45–70, find an equation for the line with the given properties. Express your answer using either the general form or theslope–intercept form of the equation of a line, whichever you prefer.
45. containing the point 46. containing the point 14, -32Slope = 2;1-2, 32Slope = 3;
47. containing the point 48. containing the point 13, 12Slope =
12
;11, -12Slope = - 23
;
49. Containing the points and 50. Containing the points and 12, 521-3, 421-1, 2211, 3251. 52. y-intercept = -2Slope = -2;y-intercept = 3Slope = -3;
53. 54. y-intercept = 4 x-intercept = -4;y-intercept = -1x-intercept = 2;
55. Slope undefined; containing the point 56. Slope undefined; containing the point 13, 8212, 4257. Horizontal; containing the point 58. Vertical; containing the point 14, -521-3, 2259. Parallel to the line containing the point 60. Parallel to the line containing the point 1-1, 22y = -3x;1-1, 22y = 2x;
61. Parallel to the line containing the point 62. Parallel to the line containing the point 10, 02x - 2y = -5;10, 022x - y = -2;
63. Parallel to the line containing the point 64. Parallel to the line containing the point 14, 22y = 5;14, 22x = 5;
65. Perpendicular to the line containing the point
66. Perpendicular to the line containing the point11, -22
y = 2x - 3;11, -22
y =
12
x + 4;
67. Perpendicular to the line containing the point
68. Perpendicular to the line containing the point10, 42
x - 2y = -5;1-3, 02
2x + y = 2;
69. Perpendicular to the line containing the point 70. Perpendicular to the line containing the point 13, 42y = 8;13, 42x = 8;
In Problems 71–90, find the slope and y-intercept of each line. Graph the line.
71. 72. 73. 74. 75. y =
12
x + 213
x + y = 212
y = x - 1y = -3x + 4y = 2x + 3
76. 77. 78. 79. 80. 3x + 2y = 62x - 3y = 6-x + 3y = 6x + 2y = 4y = 2x +
12
81. 82. 83. 84. 85. y = 5y = -1x = -4x - y = 2x + y = 1
86. 87. 88. 89. 90. 3x + 2y = 02y - 3x = 0x + y = 0y - x = 0x = 2
SULLMC02_013157759X.QXD 11/28/06 1:19 PM Page 186
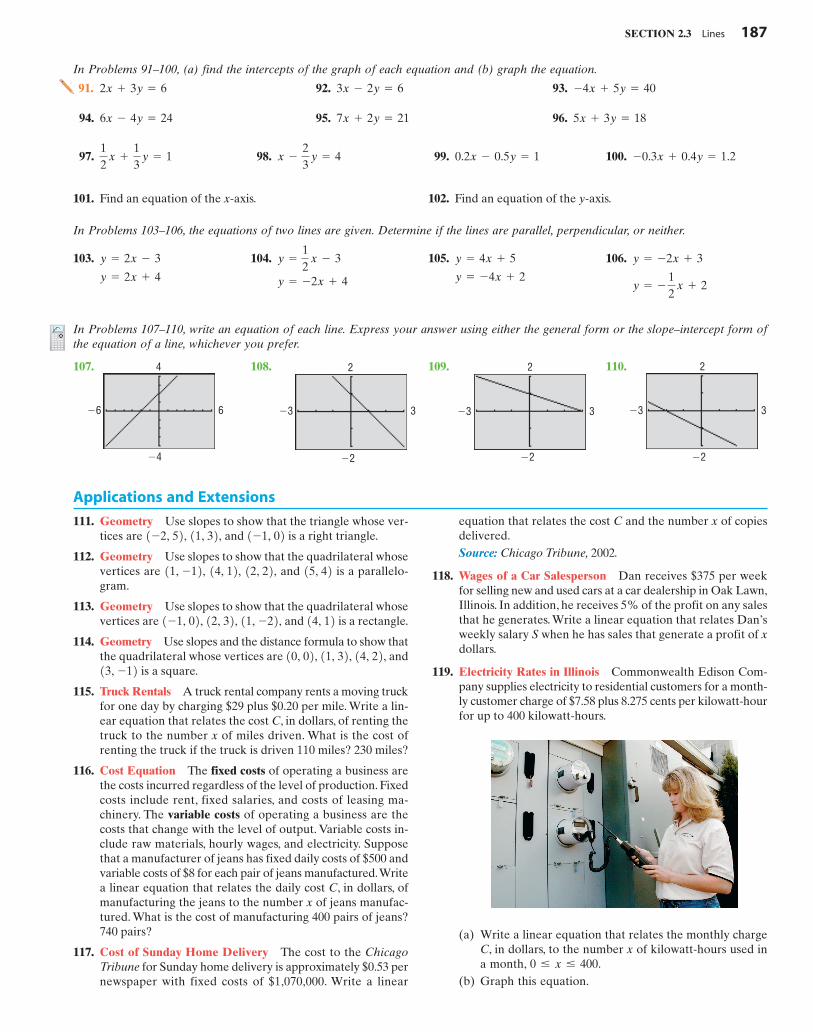
SECTION 2.3 Lines 187
91. 92. 93. -4x + 5y = 403x - 2y = 62x + 3y = 6
94. 95. 96. 5x + 3y = 187x + 2y = 216x - 4y = 24
In Problems 91–100, (a) find the intercepts of the graph of each equation and (b) graph the equation.
97. 98. 99. 100. -0.3x + 0.4y = 1.20.2x - 0.5y = 1x -
23
y = 412
x +
13
y = 1
101. Find an equation of the x-axis. 102. Find an equation of the y-axis.
In Problems 103–106, the equations of two lines are given. Determine if the lines are parallel, perpendicular, or neither.
103. 104. 105. 106.
y = - 12
x + 2
y = -2x + 3
y = -4x + 2
y = 4x + 5
y = -2x + 4
y =
12
x - 3
y = 2x + 4
y = 2x - 3
In Problems 107–110, write an equation of each line. Express your answer using either the general form or the slope–intercept form ofthe equation of a line, whichever you prefer.
107. 108. 109. 110.
�4
4
�6 6
�2
2
�3 3
�2
2
�3 3
�2
2
�3 3
Applications and Extensions
111. Geometry Use slopes to show that the triangle whose ver-tices are and is a right triangle.
112. Geometry Use slopes to show that the quadrilateral whosevertices are and is a parallelo-gram.
113. Geometry Use slopes to show that the quadrilateral whosevertices are and is a rectangle.
114. Geometry Use slopes and the distance formula to show thatthe quadrilateral whose vertices are and
is a square.
115. Truck Rentals A truck rental company rents a moving truckfor one day by charging $29 plus $0.20 per mile. Write a lin-ear equation that relates the cost C, in dollars, of renting thetruck to the number x of miles driven. What is the cost ofrenting the truck if the truck is driven 110 miles? 230 miles?
116. Cost Equation The fixed costs of operating a business arethe costs incurred regardless of the level of production. Fixedcosts include rent, fixed salaries, and costs of leasing ma-chinery. The variable costs of operating a business are thecosts that change with the level of output. Variable costs in-clude raw materials, hourly wages, and electricity. Supposethat a manufacturer of jeans has fixed daily costs of $500 andvariable costs of $8 for each pair of jeans manufactured.Writea linear equation that relates the daily cost C, in dollars, ofmanufacturing the jeans to the number x of jeans manufac-tured. What is the cost of manufacturing 400 pairs of jeans?740 pairs?
117. Cost of Sunday Home Delivery The cost to the ChicagoTribune for Sunday home delivery is approximately $0.53 pernewspaper with fixed costs of $1,070,000. Write a linear
13, -1214, 22,11, 32,10, 02,
14, 1211, -22,12, 32,1-1, 02,
15, 4212, 22,14, 12,11, -12,1-1, 0211, 32,1-2, 52,
equation that relates the cost C and the number x of copiesdelivered.Source: Chicago Tribune, 2002.
118. Wages of a Car Salesperson Dan receives $375 per weekfor selling new and used cars at a car dealership in Oak Lawn,Illinois. In addition, he receives 5% of the profit on any salesthat he generates. Write a linear equation that relates Dan’sweekly salary S when he has sales that generate a profit of xdollars.
119. Electricity Rates in Illinois Commonwealth Edison Com-pany supplies electricity to residential customers for a month-ly customer charge of $7.58 plus 8.275 cents per kilowatt-hourfor up to 400 kilowatt-hours.
(a) Write a linear equation that relates the monthly chargeC, in dollars, to the number x of kilowatt-hours used ina month,
(b) Graph this equation.0 … x … 400.
SULLMC02_013157759X.QXD 11/28/06 1:19 PM Page 187

188 CHAPTER 2 Graphs
y
RampPlatform
30"
x
(c) What is the monthly charge for using 100 kilowatt-hours?
(d) What is the monthly charge for using 300 kilowatt-hours?
(e) Interpret the slope of the line.Source: Commonwealth Edison Company, April, 2006.
120. Electricity Rates in Florida Florida Power & LightCompany supplies electricity to residential customers fora monthly customer charge of $5.17 plus 10.07 cents perkilowatt-hour for up to 1000 kilowatt-hours.(a) Write a linear equation that relates the monthly charge
C, in dollars, to the number x of kilowatt-hours used ina month,
(b) Graph this equation.(c) What is the monthly charge for using 200 kilowatt-
hours?(d) What is the monthly charge for using 500 kilowatt-
hours?(e) Interpret the slope of the line.Source: Florida Power & Light Company, April, 2006.
121. Measuring Temperature The relationship between Celsius(°C) and Fahrenheit (°F) degrees of measuring temperatureis linear. Find a linear equation relating °C and °F if 0°C cor-responds to 32°F and 100°C corresponds to 212°F. Use theequation to find the Celsius measure of 70°F.
122. Measuring Temperature The Kelvin (K) scale for measur-ing temperature is obtained by adding 273 to the Celsiustemperature.(a) Write a linear equation relating K and °C.(b) Write a linear equation relating K and °F (see Prob-
lem 121).
123. Access Ramp A wooden access ramp is being built to reacha platform that sits 30 inches above the floor.The ramp drops2 inches for every 25-inch run.
0 … x … 1000.
(c) Design requirements stipulate that the maximum runbe 30 feet and that the maximum slope be a drop of 1inch for each 12 inches of run. Will this ramp meet therequirements? Explain.
(d) What slopes could be used to obtain the 30-inch rise andstill meet design requirements?
Source: www.adaptiveaccess.com/wood_ramps.php
124. Cigarette Use A study by the Partnership for a Drug-FreeAmerica indicated that, in 1998, 42% of teens in grades 7through 12 had recently used cigarettes. A similar studyin 2005 indicated that 22% of such teens had recently usedcigarettes.(a) Write a linear equation that relates the percent of teens
y to the number of years after 1998, x.(b) Find the intercepts of the graph of your equation.(c) Do the intercepts have any meaningful interpretation?(d) Use your equation to predict the percent for the year
2019. Is this result reasonable?Source: www.drugfree.org
125. Product Promotion A cereal company finds that the num-ber of people who will buy one of its products in the firstmonth that it is introduced is linearly related to the amountof money it spends on advertising. If it spends $40,000 on ad-vertising, then 100,000 boxes of cereal will be sold, and if itspends $60,000, then 200,000 boxes will be sold.(a) Write a linear equation that relates the amount A spent
on advertising to the number x of boxes the companyaims to sell.
(b) How much advertising is needed to sell 300,000 boxesof cereal?
(c) Interpret the slope.
126. Show that the line containing the points and is perpendicular to the line Also show that the
midpoint of and lies on the line
127. The equation defines a family of lines, one linefor each value of C. On one set of coordinate axes, graph themembers of the family when and Can you draw a conclusion from the graph about each mem-ber of the family?
128. Prove that if two nonvertical lines have slopes whoseproduct is then the lines are perpendicular. [Hint:Refer to Figure 47 and use the converse of the PythagoreanTheorem.]
-1
C = 2.C = -4, C = 0,
2x - y = C
y = x.1b, a21a, b2y = x.a Z b,
1b, a2,1a, b2
(a) Write a linear equation that relates the height y abovethe floor to the horizontal distance x from the platform.
(b) Find and interpret the x-intercept of the graph of yourequation.
Discussion and Writing
129. Which of the following equations might have the graphshown? (More than one answer is possible.)(a)(b)(c)(d)(e)(f)(g)(h) y = -3x + 3
y = 2x + 3y = 3x - 5x - y = -1x - y = 13x - 4y = -12-2x + 3y = 62x + 3y = 6
130. Which of the following equations might have the graphshown? (More than one answer is possible.)(a)(b)(c)(d)(e)(f)
(g)
(h) y = x + 4
y = - 12
x + 10
y = -2x - 1x - y = -1x - y = 13x + 4y = 122x - 3y = 62x + 3y = 6 y
x
y
x
SULLMC02_013157759X.QXD 11/28/06 1:19 PM Page 188
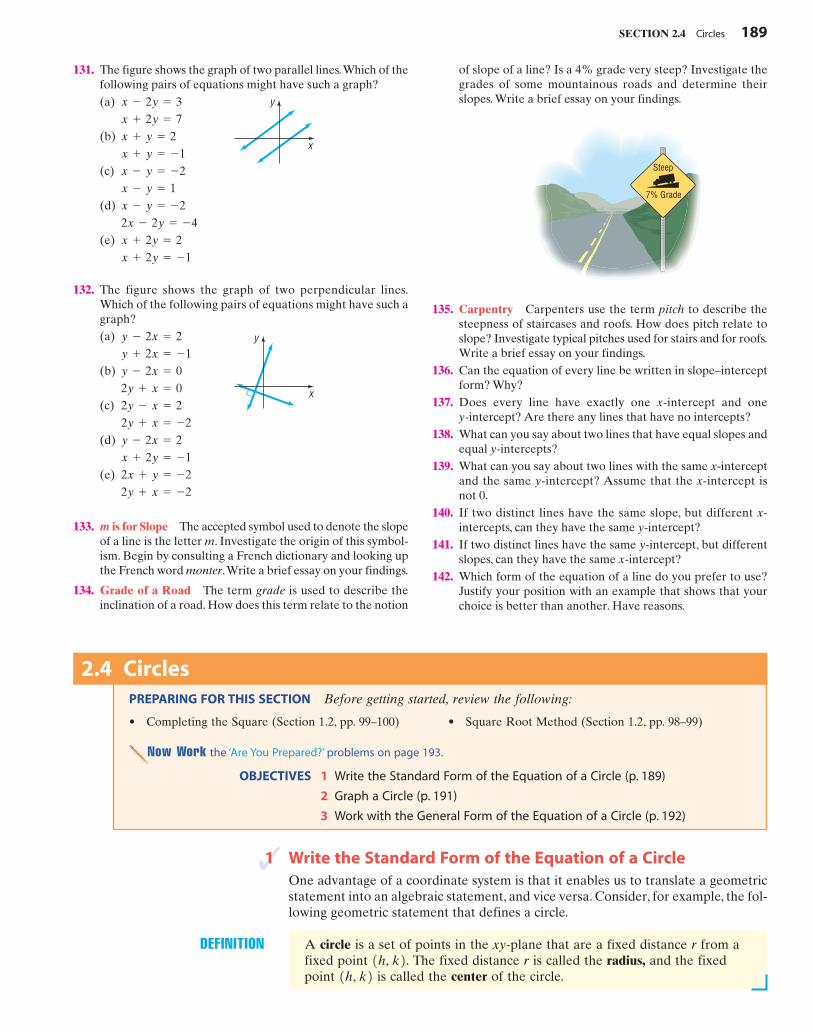
SECTION 2.4 Circles 189
131. The figure shows the graph of two parallel lines.Which of thefollowing pairs of equations might have such a graph?
132. The figure shows the graph of two perpendicular lines.Which of the following pairs of equations might have such agraph?(a)
(b)
(c)
(d)
(e)
133. m is for Slope The accepted symbol used to denote the slopeof a line is the letter m. Investigate the origin of this symbol-ism. Begin by consulting a French dictionary and looking upthe French word monter.Write a brief essay on your findings.
134. Grade of a Road The term grade is used to describe theinclination of a road. How does this term relate to the notion
2y + x = -22x + y = -2x + 2y = -1y - 2x = 22y + x = -22y - x = 22y + x = 0y - 2x = 0y + 2x = -1y - 2x = 2
(a)
(b)
(c)
(d)
(e)x + 2y = -1x + 2y = 22x - 2y = -4x - y = -2x - y = 1x - y = -2x + y = -1x + y = 2x + 2y = 7x - 2y = 3
x
y
x
y
of slope of a line? Is a 4% grade very steep? Investigate thegrades of some mountainous roads and determine theirslopes. Write a brief essay on your findings.
135. Carpentry Carpenters use the term pitch to describe thesteepness of staircases and roofs. How does pitch relate toslope? Investigate typical pitches used for stairs and for roofs.Write a brief essay on your findings.
136. Can the equation of every line be written in slope–interceptform? Why?
137. Does every line have exactly one x-intercept and one y-intercept? Are there any lines that have no intercepts?
138. What can you say about two lines that have equal slopes andequal y-intercepts?
139. What can you say about two lines with the same x-interceptand the same y-intercept? Assume that the x-intercept isnot 0.
140. If two distinct lines have the same slope, but different x-intercepts, can they have the same y-intercept?
141. If two distinct lines have the same y-intercept, but differentslopes, can they have the same x-intercept?
142. Which form of the equation of a line do you prefer to use?Justify your position with an example that shows that yourchoice is better than another. Have reasons.
Steep
7% Grade
Now Work the ‘Are You Prepared?’ problems on page 193.
OBJECTIVES 1 Write the Standard Form of the Equation of a Circle (p. 189)
2 Graph a Circle (p. 191)
3 Work with the General Form of the Equation of a Circle (p. 192)
2.4 CirclesPREPARING FOR THIS SECTION Before getting started, review the following:
• Completing the Square (Section 1.2, pp. 99–100) • Square Root Method (Section 1.2, pp. 98–99)
1 Write the Standard Form of the Equation of a CircleOne advantage of a coordinate system is that it enables us to translate a geometricstatement into an algebraic statement, and vice versa. Consider, for example, the fol-lowing geometric statement that defines a circle.
DEFINITION A circle is a set of points in the xy-plane that are a fixed distance r from afixed point The fixed distance r is called the radius, and the fixedpoint is called the center of the circle.1h, k21h, k2.
SULLMC02_013157759X.QXD 11/28/06 1:19 PM Page 189
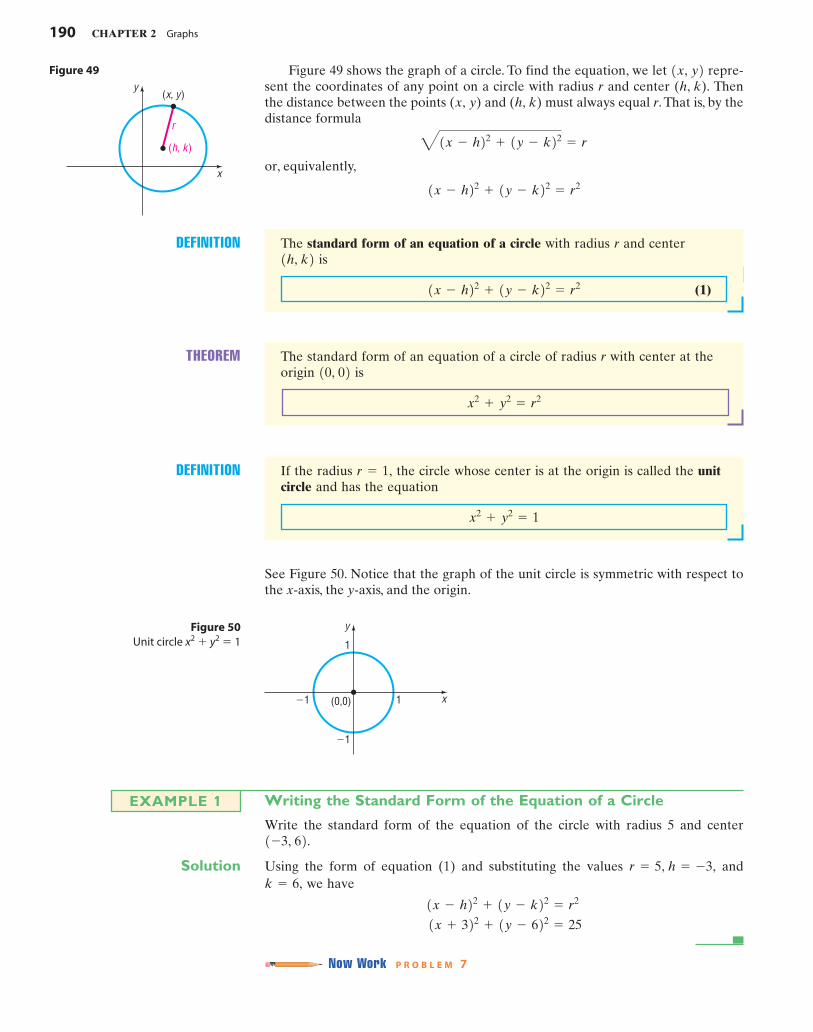
190 CHAPTER 2 Graphs
y(x, y)
(h, k )
r
x
Figure 49
1
�1
1�1
y
x(0,0)
Figure 50Unit circle x2 � y2 � 1
Figure 49 shows the graph of a circle. To find the equation, we let repre-sent the coordinates of any point on a circle with radius r and center Thenthe distance between the points and must always equal r. That is, by thedistance formula
or, equivalently,
1x - h22 + 1y - k22 = r2
41x - h22 + 1y - k22 = r
(h, k)(x, y)(h, k).1x, y2
DEFINITION The standard form of an equation of a circle with radius r and center is
(1)1x - h22 + 1y - k22 = r2
1h, k2
THEOREM The standard form of an equation of a circle of radius r with center at theorigin is
x2+ y2
= r2
10, 02
DEFINITION If the radius the circle whose center is at the origin is called the unitcircle and has the equation
x2+ y2
= 1
r = 1,
See Figure 50. Notice that the graph of the unit circle is symmetric with respect tothe x-axis, the y-axis, and the origin.
Writing the Standard Form of the Equation of a Circle
Write the standard form of the equation of the circle with radius 5 and center
Solution Using the form of equation (1) and substituting the values andwe have
Now Work P R O B L E M 7
1x + 322 + 1y - 622 = 25
1x - h22 + 1y - k22 = r2
k = 6,r = 5, h = -3,
1-3, 62.EXAMPLE 1
SULLMC02_013157759X.QXD 11/28/06 1:19 PM Page 190
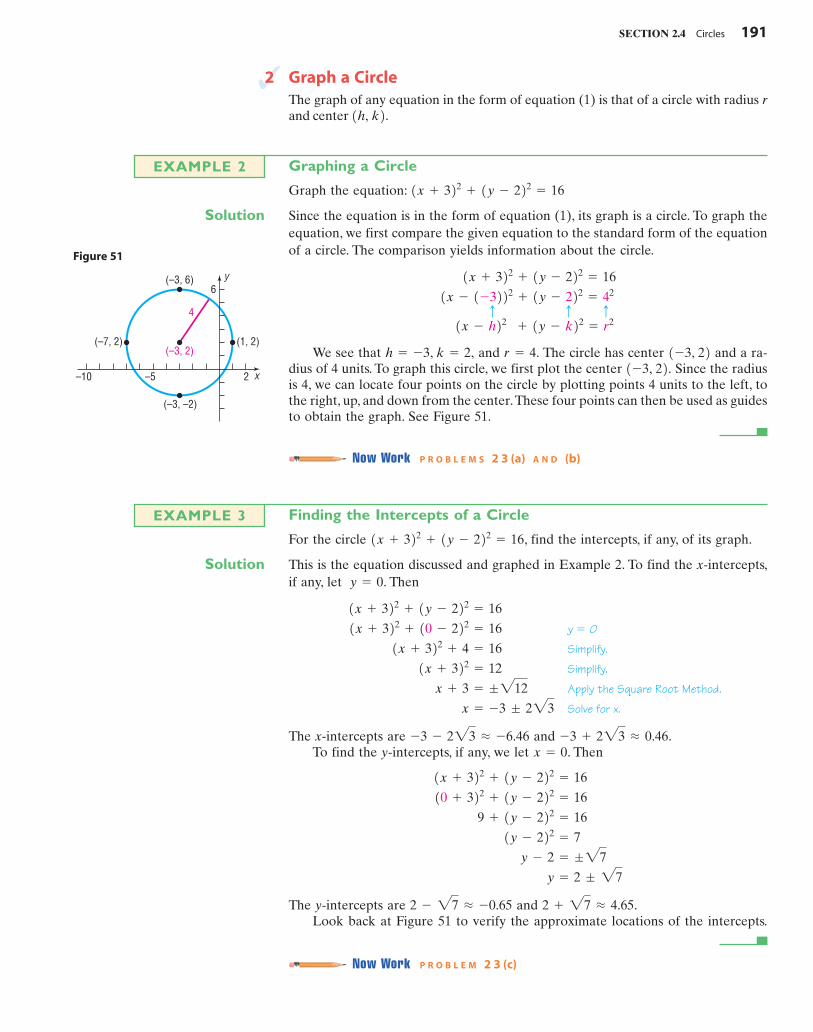
SECTION 2.4 Circles 191
2 Graph a CircleThe graph of any equation in the form of equation (1) is that of a circle with radius rand center 1h, k2.
Graphing a Circle
Graph the equation:
Solution Since the equation is in the form of equation (1), its graph is a circle. To graph theequation, we first compare the given equation to the standard form of the equationof a circle. The comparison yields information about the circle.
We see that and The circle has center and a ra-dius of 4 units. To graph this circle, we first plot the center Since the radiusis 4, we can locate four points on the circle by plotting points 4 units to the left, tothe right, up, and down from the center.These four points can then be used as guidesto obtain the graph. See Figure 51.
Now Work P R O B L E M S 2 3 (a) A N D (b)
1-3, 22.1-3, 22r = 4.h = -3, k = 2,
1x - h22 + 1y - k22 = r2
qqq 1x - 1-3222 + 1y - 222 = 42
1x + 322 + 1y - 222 = 16
1x + 322 + 1y - 222 = 16
EXAMPLE 2
(–3, 6)
(–7, 2)(–3, 2)
y6
2–5–10
4
(–3, –2)
(1, 2)
x
Figure 51
Finding the Intercepts of a Circle
For the circle , find the intercepts, if any, of its graph.
Solution This is the equation discussed and graphed in Example 2. To find the x-intercepts,if any, let . Then
y � 0
Simplify.
Simplify.
Apply the Square Root Method.
Solve for x.
The x-intercepts are and .To find the y-intercepts, if any, we let . Then
The y-intercepts are and .Look back at Figure 51 to verify the approximate locations of the intercepts.
Now Work P R O B L E M 2 3 (c)
2 + 27 L 4.652 - 27 L -0.65
y = 2 ; 27
y - 2 = ;27
1y - 222 = 7
9 + 1y - 222 = 16
10 + 322 + 1y - 222 = 16
1x + 322 + 1y - 222 = 16
x = 0-3 + 223 L 0.46-3 - 223 L -6.46
x = -3 ; 223
x + 3 = ;212
1x + 322 = 12
1x + 322 + 4 = 16
1x + 322 + 10 - 222 = 16
1x + 322 + 1y - 222 = 16
y = 0
1x + 322 + 1y - 222 = 16
EXAMPLE 3
SULLMC02_013157759X.QXD 11/28/06 1:19 PM Page 191

3 Work with the General Form of the Equation of a CircleIf we eliminate the parentheses from the standard form of the equation of the cir-cle given in Example 2, we get
which we find, upon simplifying, is equivalent to
(2)
It can be shown that any equation of the form
has a graph that is a circle, or a point, or has no graph at all. For example, the graphof the equation is the single point The equation or has no graph, because sums of squares of real numbers are nevernegative.
x2+ y2
= -5,x2
+ y2+ 5 = 0,10, 02.x2
+ y2= 0
x2+ y2
+ ax + by + c = 0
x2+ y2
+ 6x - 4y - 3 = 0
x2+ 6x + 9 + y2
- 4y + 4 = 16
1x + 322 + 1y - 222 = 16
192 CHAPTER 2 Graphs
DEFINITION When its graph is a circle, the equation
is referred to as the general form of the equation of a circle.
x2+ y2
+ ax + by + c = 0
Now Work P R O B L E M 1 3
If an equation of a circle is in the general form, we use the method of complet-ing the square to put the equation in standard form so that we can identify its cen-ter and radius.
Graphing a Circle Whose Equation Is in General Form
Graph the equation
Solution We complete the square in both x and y to put the equation in standard form. Groupthe expression involving x, group the expression involving y, and put the constanton the right side of the equation. The result is
Next, complete the square of each expression in parentheses. Remember that anynumber added on the left side of the equation must also be added on the right.
Factor.
We recognize this equation as the standard form of the equation of a circle with ra-dius 1 and center
To graph the equation use the center and the radius 1. See Figure 52.
Now Work P R O B L E M 2 7
1-2, 321-2, 32.
1x + 222 + 1y - 322 = 1
a -62b2
= 9a42b2
= 4
ts qq1x2
+ 4x + 42 + 1y2- 6y + 92 = -12 + 4 + 9
1x2+ 4x2 + 1y2
- 6y2 = -12
x2+ y2
+ 4x - 6y + 12 = 0
EXAMPLE 4
y
4
1–3
1
(–2, 3)
(–2, 2)
(–3, 3)
(–1, 3)(–2, 4)
x
Figure 52
SULLMC02_013157759X.QXD 11/28/06 1:19 PM Page 192

SECTION 2.4 Circles 193
Using a Graphing Utility to Graph a Circle
Graph the equation:
Solution This is the equation of a circle with center at the origin and radius 2. To graph thisequation, we must first solve for y.
Subtract from each side.Apply the Square RootMethod to solve for y
There are two equations to graph: first, we graph and then
on the same square screen. (Your circle will appear oval if you do not use a square screen.) See Figure 53.Y2 = -34 - x2
Y1 = 34 - x2
y = ;34 - x2
x2 y2= 4 - x2
x2+ y2
= 4
x2+ y2
= 4
EXAMPLE 5
Figure 53
2.4 Assess Your Understanding
Are You Prepared? Answers are given at the end of these exercises. If you get a wrong answer, read the pages listed in red.
1. To complete the square of you would (add/ subtract) the number _____. (pp. 99–100)
x2+ 10x, 2. Use the Square Root Method to solve the equation
. (pp. 98–99)(x - 2)2= 9
3. True or False Every equation of the form
has a circle as its graph.
4. For a circle, the _____ is the distance from the center to anypoint on the circle.
x2+ y2
+ ax + by + c = 0
5. True or False The radius of the circle is 3.
6. True or False The center of the circle
is (3, -2).
1x + 322 + 1y - 222 = 13
x2+ y2
= 9
Concepts and Vocabulary
7. 8. 9. 10.
Skill Building
In Problems 7–10, find the center and radius of each circle. Write the standard form of the equation.
11. 12. 13. 14. r = 3; 1h, k2 = 11, 02r = 2; 1h, k2 = 10, 22r = 3; 1h, k2 = 10, 02r = 2; 1h, k2 = 10, 0215. 16. 17. 18. r = 7; 1h, k2 = 1-5, -22r = 4; 1h, k2 = 1-2, 12r = 4; 1h, k2 = 12, -32r = 5; 1h, k2 = 14, -32
19. 20. r =
12
; 1h, k2 = a0, - 12br =
12
; 1h, k2 = a12
, 0b
In Problems 11–20, write the standard form of the equation and the general form of the equation of each circle of radius r and centerGraph each circle.1h, k2.
x
y
(1, 2)
(1, 0) x
y
(1, 2)
(4, 2)
x
y
(0, 1)
(2, 3)
x
y
(2, 1) (0, 1)
In Problems 21–34, (a) find the center and radius r of each circle; (b) graph each circle; (c) find the intercepts, if any.1h, k221. 22. 23. 21x - 322 + 2y2
= 8x2+ 1y - 122 = 1x2
+ y2= 4
24. 25. 26. x2+ y2
+ 4x + 2y - 20 = 0x2+ y2
- 2x - 4y - 4 = 031x + 122 + 31y - 122 = 6
–2
–3
2
3
Y2 � � 4 � x2
Y1 � 4 � x2
SULLMC02_013157759X.QXD 11/28/06 1:19 PM Page 193
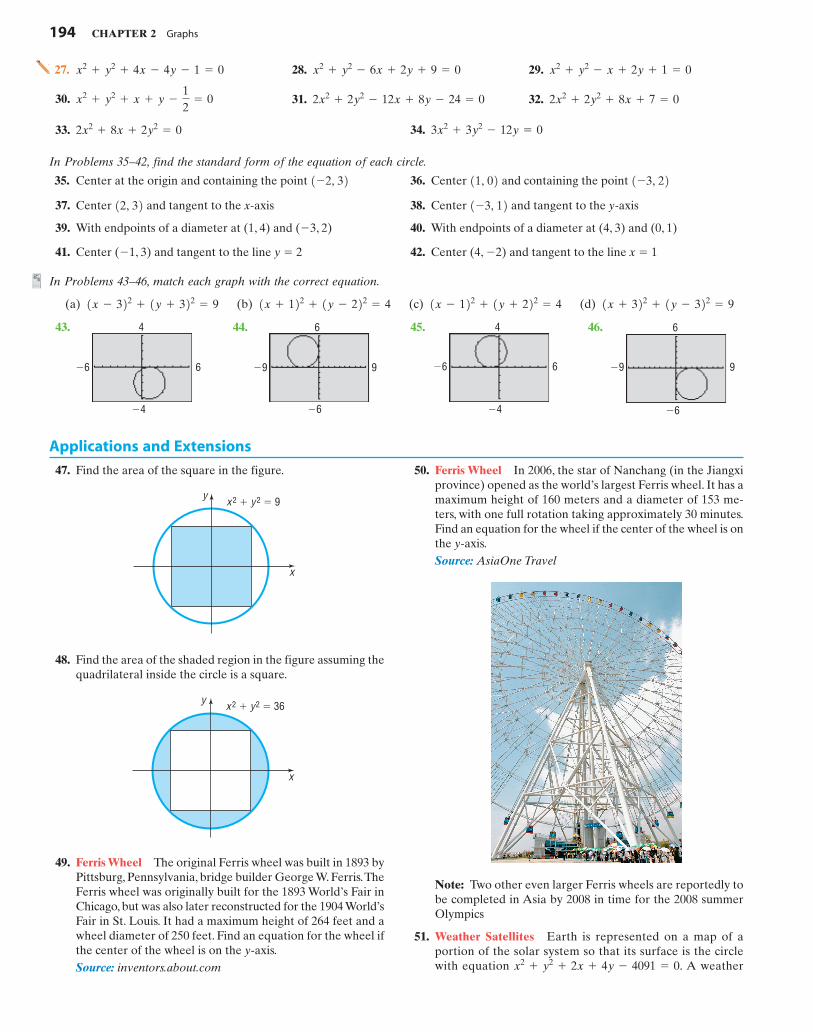
194 CHAPTER 2 Graphs
27. 28. 29. x2+ y2
- x + 2y + 1 = 0x2+ y2
- 6x + 2y + 9 = 0x2+ y2
+ 4x - 4y - 1 = 0
30. 31. 32. 2x2+ 2y2
+ 8x + 7 = 02x2+ 2y2
- 12x + 8y - 24 = 0x2+ y2
+ x + y -
12
= 0
33. 2x2+ 8x + 2y2
= 0
In Problems 35–42, find the standard form of the equation of each circle.
35. Center at the origin and containing the point 36. Center and containing the point 1-3, 2211, 021-2, 3237. Center and tangent to the x-axis 38. Center and tangent to the y-axis1-3, 1212, 3239. With endpoints of a diameter at (1, 4) and (�3, 2) 40. With endpoints of a diameter at (4, 3) and (0, 1)
41. Center (�1, 3) and tangent to the line y � 2 42. Center (4, �2) and tangent to the line x � 1
In Problems 43–46, match each graph with the correct equation.
(a) (b) (c) (d) 1x + 322 + 1y - 322 = 91x - 122 + 1y + 222 = 41x + 122 + 1y - 222 = 41x - 322 + 1y + 322 = 9
43. 44. 45. 46.
�4
4
�6 6
�6
6
�9 9
�4
4
�6 6
�6
6
�9 9
Applications and Extensions
47. Find the area of the square in the figure. 50. Ferris Wheel In 2006, the star of Nanchang (in the Jiangxiprovince) opened as the world’s largest Ferris wheel. It has amaximum height of 160 meters and a diameter of 153 me-ters, with one full rotation taking approximately 30 minutes.Find an equation for the wheel if the center of the wheel is onthe y-axis.Source: AsiaOne Travel
x 2 � y2 � 9y
x
x 2 � y2 � 36y
x
48. Find the area of the shaded region in the figure assuming thequadrilateral inside the circle is a square.
49. Ferris Wheel The original Ferris wheel was built in 1893 byPittsburg, Pennsylvania, bridge builder George W. Ferris.TheFerris wheel was originally built for the 1893 World’s Fair inChicago, but was also later reconstructed for the 1904 World’sFair in St. Louis. It had a maximum height of 264 feet and awheel diameter of 250 feet. Find an equation for the wheel ifthe center of the wheel is on the y-axis.Source: inventors.about.com
Note: Two other even larger Ferris wheels are reportedly tobe completed in Asia by 2008 in time for the 2008 summerOlympics
51. Weather Satellites Earth is represented on a map of aportion of the solar system so that its surface is the circlewith equation A weatherx2
+ y2+ 2x + 4y - 4091 = 0.
34. 3x2+ 3y2
- 12y = 0
SULLMC02_013157759X.QXD 11/28/06 1:19 PM Page 194

SECTION 2.5 Variation 195
r
satellite circles 0.6 unit above Earth with the center of its cir-cular orbit at the center of Earth. Find the equation for theorbit of the satellite on this map.
[Hint: The quadratic equation hasexactly one solution.]
(b) The point of tangency is
(c) The tangent line is perpendicular to the line containingthe center of the circle and the point of tangency.
53. The Greek Method The Greek method for finding theequation of the tangent line to a circle uses the fact that at anypoint on a circle the lines containing the center and the tan-gent line are perpendicular (see Problem 52). Use thismethod to find an equation of the tangent line to the circle
at the point
54. Use the Greek method described in Problem 53 tofind an equation of the tangent line to the circle x2 � y2 � at the point
55. Refer to Problem 52. The line is tangent toa circle at The line is tangent to the samecircle at Find the center of the circle.
56. Find an equation of the line containing the centers of the twocircles
and
57. If a circle of radius 2 is made to roll along the x-axis, what isan equation for the path of the center of the circle?
58. If the circumference of a circle is what is its radius?6p,
x2+ y2
+ 6x + 4y + 9 = 0
x2+ y2
- 4x + 6y + 4 = 0
13, -12.y = 2x - 710, 22.
x - 2y + 4 = 0
13, 212 - 32.4x + 6y + 4 = 0
11, 2122.x2+ y2
= 9
¢ -r2 m
b,
r2
b≤ .
x2+ 1mx + b22 = r2
52. The tangent line to a circle may be defined as the line that in-tersects the circle in a single point, called the point of tan-gency. See the figure.
r
y
x
If the equation of the circle is and the equationof the tangent line is show that:(a) r211 + m22 = b2
y = mx + b,x2
+ y2= r2
Discussion and Writing
59. Which of the following equations might have the graphshown? (More than one answer is possible.)(a)(b)(c)(d)(e)(f)(g)(h) x2
+ y2- 4x - 4y = 4
x2+ y2
- 9x - 4y = 0x2
+ y2+ 4x - 2y = 0
x2+ y2
- 4x - 9y = 01x + 222 + 1y - 222 = 81x - 222 + 1y - 322 = 131x - 222 + 1y - 222 = 81x - 222 + 1y + 322 = 13
60. Which of the following equations might have the graphshown? (More than one answer is possible.)(a)(b)(c)(d)(e)(f)(g)(h) x2
+ y2- 9x - 10 = 0
x2+ y2
+ 9x + 10 = 0x2
+ y2+ 10x - 2y = 1
x2+ y2
+ 10x + 16 = 01x + 222 + y2
= 4x2
+ 1y - 222 = 31x + 222 + y2
= 31x - 222 + y2
= 3
y
x
y
x
Are You Prepared? Answers
1. add; 25 2. 5-1, 56
2.5 VariationOBJECTIVES 1 Construct a Model Using Direct Variation (p. 196)
2 Construct a Model Using Inverse Variation (p. 197)
3 Construct a Model Using Joint or Combined Variation (p. 197)
61. Explain how the center and radius of a circle can be used to graph a circle.
SULLMC02_013157759X.QXD 11/28/06 1:19 PM Page 195
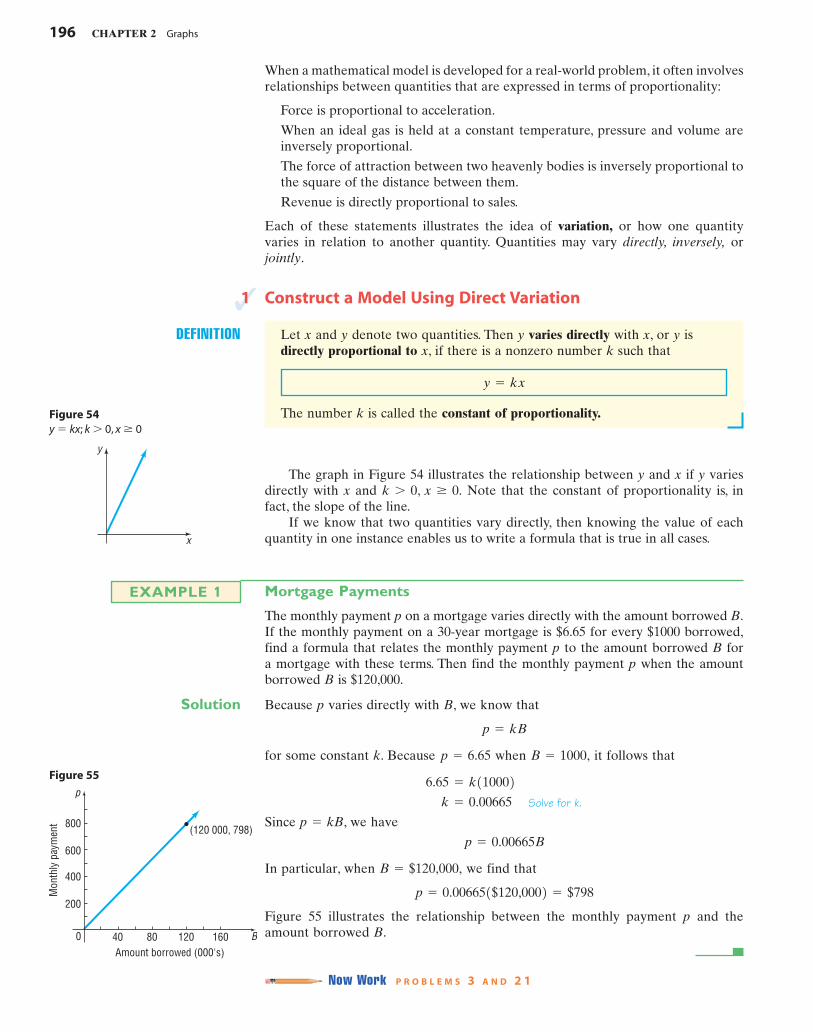
196 CHAPTER 2 Graphs
x
y
Figure 54y � kx; k � 0, x � 0
When a mathematical model is developed for a real-world problem, it often involvesrelationships between quantities that are expressed in terms of proportionality:
Force is proportional to acceleration.
When an ideal gas is held at a constant temperature, pressure and volume areinversely proportional.
The force of attraction between two heavenly bodies is inversely proportional tothe square of the distance between them.
Revenue is directly proportional to sales.
Each of these statements illustrates the idea of variation, or how one quantityvaries in relation to another quantity. Quantities may vary directly, inversely, orjointly.
1 Construct a Model Using Direct Variation
DEFINITION Let x and y denote two quantities. Then y varies directly with x, or y isdirectly proportional to x, if there is a nonzero number k such that
The number k is called the constant of proportionality.
y = kx
The graph in Figure 54 illustrates the relationship between y and x if y variesdirectly with x and Note that the constant of proportionality is, infact, the slope of the line.
If we know that two quantities vary directly, then knowing the value of eachquantity in one instance enables us to write a formula that is true in all cases.
k 7 0, x Ú 0.
Mortgage Payments
The monthly payment p on a mortgage varies directly with the amount borrowed B.If the monthly payment on a 30-year mortgage is $6.65 for every $1000 borrowed,find a formula that relates the monthly payment p to the amount borrowed B fora mortgage with these terms. Then find the monthly payment p when the amountborrowed B is $120,000.
Solution Because p varies directly with B, we know that
for some constant k. Because when it follows that
Solve for k.
Since p � kB, we have
In particular, when we find that
Figure 55 illustrates the relationship between the monthly payment p and theamount borrowed B.
Now Work P R O B L E M S 3 A N D 2 1
p = 0.006651$120,0002 = $798
B = $120,000,
p = 0.00665B
k = 0.00665
6.65 = k110002B = 1000,p = 6.65
p = kB
EXAMPLE 1
B
p
0 40 80 120Amount borrowed (000's)
Mon
thly
pay
men
t
160
200
400
600
800 (120 000, 798)
Figure 55
SULLMC02_013157759X.QXD 11/28/06 1:19 PM Page 196
SECTION 2.5 Variation 197
2 Construct a Model Using Inverse Variation
DEFINITION Let x and y denote two quantities. Then y varies inversely with x, or y isinversely proportional to x, if there is a nonzero constant k such that
y =
kx
The graph in Figure 56 illustrates the relationship between y and x if y variesinversely with x and k 7 0, x 7 0.x
y
Figure 56
y =
k
x; k 7 0, x 7 0
Maximum Weight That Can Be Supported by a Piece of Pine
See Figure 57. The maximum weight W that can be safely supported by a 2-inch by4-inch piece of pine varies inversely with its length l. Experiments indicate that themaximum weight that a 10-foot-long 2-by-4 piece of pine can support is 500 pounds.Write a general formula relating the maximum weight W (in pounds) to length l(in feet). Find the maximum weight W that can be safely supported by a length of25 feet.
Solution Because W varies inversely with l, we know that
for some constant k. Because when we have
Since , we have
In particular, the maximum weight W that can be safely supported by a piece of pine25 feet in length is
Figure 58 illustrates the relationship between the weight W and the length l.
Now Work P R O B L E M 3 1
W =
500025
= 200 pounds
W =
5000l
W =
k
l
k = 5000
500 =
k
10
l = 10,W = 500
W =
k
l
EXAMPLE 2
Figure 57
l
W
0 5 10 15 20 25
300
200
100
400
500
600
(25, 200)
(10, 500)
Figure 58
3 Construct a Model Using Joint Variation or Combined VariationWhen a variable quantity Q is proportional to the product of two or more othervariables, we say that Q varies jointly with these quantities. Finally, combinations ofdirect and/or inverse variation may occur. This is usually referred to as combinedvariation.
Let’s look at an example.
SULLMC02_013157759X.QXD 11/28/06 1:19 PM Page 197
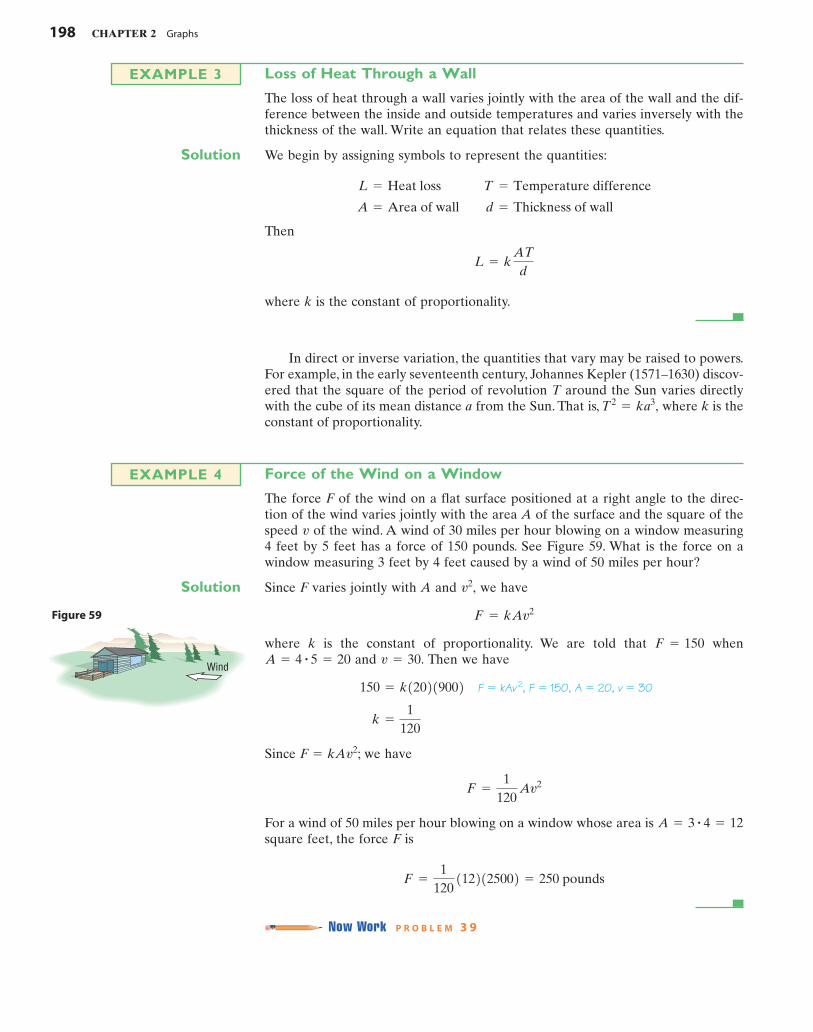
Loss of Heat Through a Wall
The loss of heat through a wall varies jointly with the area of the wall and the dif-ference between the inside and outside temperatures and varies inversely with thethickness of the wall. Write an equation that relates these quantities.
Solution We begin by assigning symbols to represent the quantities:
Then
where k is the constant of proportionality.
L = k ATd
A = Area of wall d = Thickness of wall
L = Heat loss T = Temperature difference
EXAMPLE 3
198 CHAPTER 2 Graphs
In direct or inverse variation, the quantities that vary may be raised to powers.For example, in the early seventeenth century, Johannes Kepler (1571–1630) discov-ered that the square of the period of revolution T around the Sun varies directlywith the cube of its mean distance a from the Sun. That is, where k is theconstant of proportionality.
T2= ka3,
Force of the Wind on a Window
The force F of the wind on a flat surface positioned at a right angle to the direc-tion of the wind varies jointly with the area A of the surface and the square of thespeed of the wind. A wind of 30 miles per hour blowing on a window measuring4 feet by 5 feet has a force of 150 pounds. See Figure 59. What is the force on awindow measuring 3 feet by 4 feet caused by a wind of 50 miles per hour?
Solution Since F varies jointly with A and we have
where k is the constant of proportionality. We are told that whenand Then we have
F � kAv 2, F � 150, A � 20, v � 30
Since F � kAv2; we have
For a wind of 50 miles per hour blowing on a window whose area is square feet, the force F is
Now Work P R O B L E M 3 9
F =
1120
1122125002 = 250 pounds
A = 3 # 4 = 12
F =
1120
Av2
k =
1120
150 = k120219002v = 30.A = 4 # 5 = 20
F = 150
F = kAv2
v2,
v
EXAMPLE 4
Wind
Figure 59
SULLMC02_013157759X.QXD 11/28/06 1:19 PM Page 198

SECTION 2.5 Variation 199
2.5 Assess Your Understanding
Concepts and Vocabulary
1. If x and y are two quantities, then y is directly proportionalto x if there is a nonzero number k such that __________.
2. True or False If y varies directly with x, then wherek is a constant.
y =
k
x,
Skill Building
In Problems 3–14, write a general formula to describe each variation.
3. y varies directly with x; when
4. varies directly with t; when
5. A varies directly with when
6. V varies directly with when
7. F varies inversely with when
8. y varies inversely with when
9. z varies directly with the sum of the squares of x and y; when and
10. T varies jointly with the cube root of x and the square of d; when and
11. M varies directly with the square of d and inversely with the square root of x; when and
12. z varies directly with the sum of the cube of x and the square of y; when and
13. The square of T varies directly with the cube of a and inversely with the square of d; when and
14. The cube of z varies directly with the sum of the squares of x and y; when and y = 4x = 9z = 2
d = 4a = 2T = 2
y = 3x = 2z = 1
d = 4x = 9M = 24
d = 3x = 8T = 18
y = 4x = 3z = 5
x = 91x ; y = 4
d = 5d2; F = 10
x = 3x3; V = 36p
x = 2x2; A = 4p
t = 2v = 16v
x = 10y = 2
15. Geometry The volume V of a sphere varies directly with
the cube of its radius r.The constant of proportionality is
16. Geometry The square of the length of the hypotenuse c ofa right triangle varies jointly with the sum of the squares ofthe lengths of its legs a and b. The constant of proportional-ity is 1.
17. Geometry The area A of a triangle varies jointly with thelengths of the base b and the height h. The constant of
proportionality is
18. Geometry The perimeter p of a rectangle varies jointly withthe sum of the lengths of its sides l and The constant ofproportionality is 2.
19. Physics: Newton’s Law The force F (in newtons) of attrac-tion between two bodies varies jointly with their masses mand M (in kilograms) and inversely with the square of thedistance d (in meters) between them. The constant of pro-portionality is
20. Physics: Simple Pendulum The period of a pendulum is thetime required for one oscillation; the pendulum is usually re-ferred to as simple when the angle made to the vertical is lessthan 5°. The period T of a simple pendulum (in seconds)varies directly with the square root of its length l (in feet).
The constant of proportionality is
21. Mortgage Payments The monthly payment p on a mort-gage varies directly with the amount borrowed B. If themonthly payment on a 30-year mortgage is $6.49 for every
2p232.
G = 6.67 * 10-11.
w.
12
.
4p3
.
$1000 borrowed, find a linear equation that relates themonthly payment p to the amount borrowed B for a mort-gage with the same terms. Then find the monthly payment pwhen the amount borrowed B is $145,000.
22. Mortgage Payments The monthly payment p on a mortgagevaries directly with the amount borrowed B. If the monthlypayment on a 15-year mortgage is $8.99 for every $1000 bor-rowed, find a linear equation that relates the monthly pay-ment p to the amount borrowed B for a mortgage with thesame terms. Then find the monthly payment p when theamount borrowed B is $175,000.
23. Physics: Falling Objects The distance s that an object fallsis directly proportional to the square of the time t of the fall.If an object falls 16 feet in 1 second, how far will it fall in 3 sec-onds? How long will it take an object to fall 64 feet?
24. Physics: Falling Objects The velocity of a falling object isdirectly proportional to the time t of the fall. If, after 2 sec-onds, the velocity of the object is 64 feet per second, what willits velocity be after 3 seconds?
25. Physics: Stretching a Spring The elongation E of a springbalance varies directly with the applied weight W (see thefigure). If when find E when W = 15.W = 20,E = 3
v
Applications and Extensions
In Problems 15–20, write an equation that relates the quantities.
E
W
SULLMC02_013157759X.QXD 11/28/06 1:19 PM Page 199
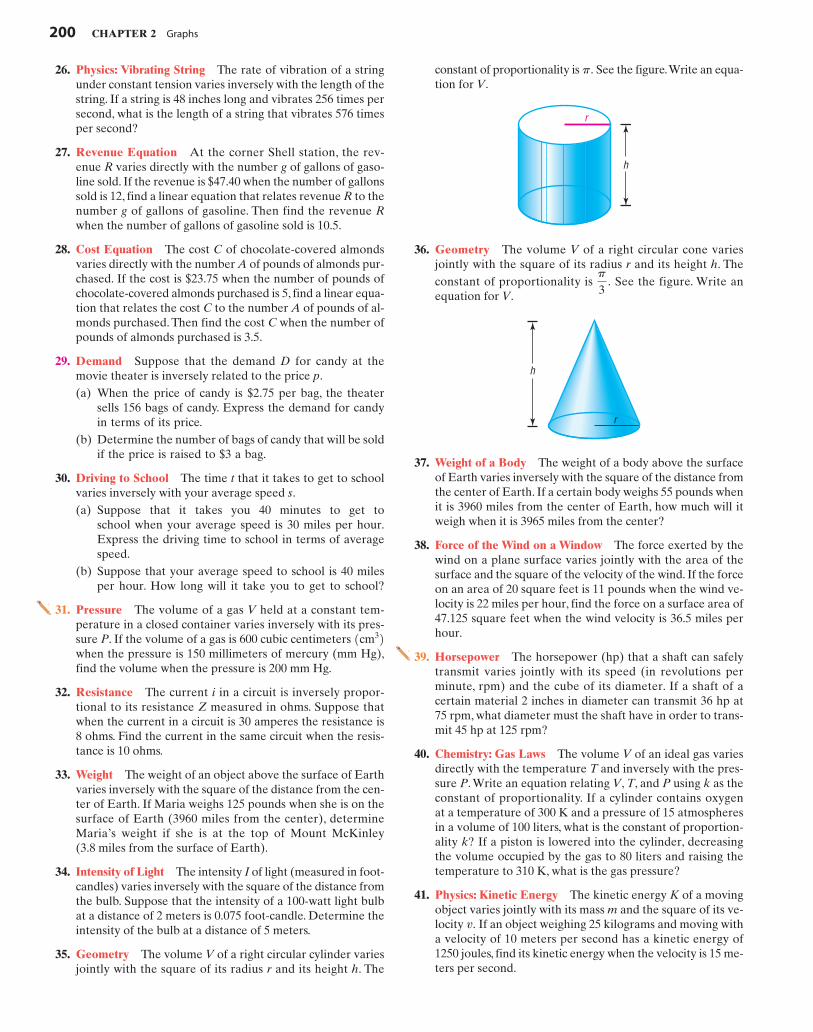
200 CHAPTER 2 Graphs
h
r
r
h
26. Physics: Vibrating String The rate of vibration of a stringunder constant tension varies inversely with the length of thestring. If a string is 48 inches long and vibrates 256 times persecond, what is the length of a string that vibrates 576 timesper second?
27. Revenue Equation At the corner Shell station, the rev-enue R varies directly with the number g of gallons of gaso-line sold. If the revenue is $47.40 when the number of gallonssold is 12, find a linear equation that relates revenue R to thenumber g of gallons of gasoline. Then find the revenue Rwhen the number of gallons of gasoline sold is 10.5.
28. Cost Equation The cost C of chocolate-covered almondsvaries directly with the number A of pounds of almonds pur-chased. If the cost is $23.75 when the number of pounds ofchocolate-covered almonds purchased is 5, find a linear equa-tion that relates the cost C to the number A of pounds of al-monds purchased. Then find the cost C when the number ofpounds of almonds purchased is 3.5.
29. Demand Suppose that the demand D for candy at themovie theater is inversely related to the price p.(a) When the price of candy is $2.75 per bag, the theater
sells 156 bags of candy. Express the demand for candyin terms of its price.
(b) Determine the number of bags of candy that will be soldif the price is raised to $3 a bag.
30. Driving to School The time t that it takes to get to schoolvaries inversely with your average speed s.(a) Suppose that it takes you 40 minutes to get to
school when your average speed is 30 miles per hour.Express the driving time to school in terms of averagespeed.
(b) Suppose that your average speed to school is 40 milesper hour. How long will it take you to get to school?
31. Pressure The volume of a gas V held at a constant tem-perature in a closed container varies inversely with its pres-sure P. If the volume of a gas is 600 cubic centimeters when the pressure is 150 millimeters of mercury (mm Hg),find the volume when the pressure is 200 mm Hg.
32. Resistance The current i in a circuit is inversely propor-tional to its resistance Z measured in ohms. Suppose thatwhen the current in a circuit is 30 amperes the resistance is8 ohms. Find the current in the same circuit when the resis-tance is 10 ohms.
33. Weight The weight of an object above the surface of Earthvaries inversely with the square of the distance from the cen-ter of Earth. If Maria weighs 125 pounds when she is on thesurface of Earth (3960 miles from the center), determineMaria’s weight if she is at the top of Mount McKinley(3.8 miles from the surface of Earth).
34. Intensity of Light The intensity I of light (measured in foot-candles) varies inversely with the square of the distance fromthe bulb. Suppose that the intensity of a 100-watt light bulbat a distance of 2 meters is 0.075 foot-candle. Determine theintensity of the bulb at a distance of 5 meters.
35. Geometry The volume V of a right circular cylinder variesjointly with the square of its radius r and its height h. The
1cm32
constant of proportionality is See the figure.Write an equa-tion for V.
p.
36. Geometry The volume V of a right circular cone variesjointly with the square of its radius r and its height h. The constant of proportionality is See the figure. Write anequation for V.
p
3.
37. Weight of a Body The weight of a body above the surfaceof Earth varies inversely with the square of the distance fromthe center of Earth. If a certain body weighs 55 pounds whenit is 3960 miles from the center of Earth, how much will itweigh when it is 3965 miles from the center?
38. Force of the Wind on a Window The force exerted by thewind on a plane surface varies jointly with the area of thesurface and the square of the velocity of the wind. If the forceon an area of 20 square feet is 11 pounds when the wind ve-locity is 22 miles per hour, find the force on a surface area of47.125 square feet when the wind velocity is 36.5 miles perhour.
39. Horsepower The horsepower (hp) that a shaft can safelytransmit varies jointly with its speed (in revolutions perminute, rpm) and the cube of its diameter. If a shaft of acertain material 2 inches in diameter can transmit 36 hp at75 rpm, what diameter must the shaft have in order to trans-mit 45 hp at 125 rpm?
40. Chemistry: Gas Laws The volume V of an ideal gas variesdirectly with the temperature T and inversely with the pres-sure P. Write an equation relating V, T, and P using k as theconstant of proportionality. If a cylinder contains oxygenat a temperature of 300 K and a pressure of 15 atmospheresin a volume of 100 liters, what is the constant of proportion-ality k? If a piston is lowered into the cylinder, decreasingthe volume occupied by the gas to 80 liters and raising thetemperature to 310 K, what is the gas pressure?
41. Physics: Kinetic Energy The kinetic energy K of a movingobject varies jointly with its mass m and the square of its ve-locity If an object weighing 25 kilograms and moving witha velocity of 10 meters per second has a kinetic energy of1250 joules, find its kinetic energy when the velocity is 15 me-ters per second.
v.
SULLMC02_013157759X.QXD 11/28/06 1:19 PM Page 200

Chapter Review 201
42. Electrical Resistance of a Wire The electrical resistance ofa wire varies directly with the length of the wire and inverselywith the square of the diameter of the wire. If a wire 432 feetlong and 4 millimeters in diameter has a resistance of1.24 ohms, find the length of a wire of the same material whoseresistance is 1.44 ohms and whose diameter is 3 millimeters.
43. Measuring the Stress of Materials The stress in the mater-ial of a pipe subject to internal pressure varies jointly withthe internal pressure and the internal diameter of the pipeand inversely with the thickness of the pipe. The stress is100 pounds per square inch when the diameter is 5 inches,
the thickness is 0.75 inch, and the internal pressure is25 pounds per square inch. Find the stress when the internalpressure is 40 pounds per square inch if the diameter is 8 inch-es and the thickness is 0.50 inch.
44. Safe Load for a Beam The maximum safe load for a hori-zontal rectangular beam varies jointly with the width of thebeam and the square of the thickness of the beam and in-versely with its length. If an 8-foot beam will support up to750 pounds when the beam is 4 inches wide and 2 inchesthick, what is the maximum safe load in a similar beam 10 feetlong, 6 inches wide, and 2 inches thick?
CHAPTER REVIEW
Things to KnowFormulas
Distance formula (p. 157)
Midpoint formula (p. 160)
Slope (p. 174) if undefined if
Parallel lines (p. 182) Equal slopes and different y-intercepts
Perpendicular lines (p. 183) Product of slopes is
Direct variation (p. 196)
Inverse variation (p. 197)
Equations of Lines and Circles
Vertical line (p. 177) ; a is the x-intercept
Horizontal line (p. 179) ; b is the y-intercept
Point–slope form of the equation of a line (p. 178) is the slope of the line, is a point on the line
Slope–intercept form of the equation of a line (p. 179) is the slope of the line, b is the y-intercept
General form of the equation of a line (p. 181) not both 0
Standard form of the equation of a circle (p. 190) is the radius of the circle, is the center of the circle
Equation of the unit circle (p. 190)
General form of the equation of a circle (p. 192) , with restrictions on , and ca, bx2+ y2
+ ax + by + c = 0
x2+ y2
= 1
1h, k21x - h22 + 1y - k22 = r2; r
Ax + By = C; A, B
y = mx + b; m
1x1 , y12y - y1 = m1x - x12; my = b
x = a
y =
k
x
y = kx
-1 1m1# m2 = -12
1b1 Z b221m1 = m22x1 = x2x1 Z x2 ;m =
y2 - y1
x2 - x1
1x, y2 = ax1 + x2
2,
y1 + y2
2b
d = 41x2 - x122 + 1y2 - y122
Objectives
Section You should be able to . . . Review Exercises
2.1 1 Use the distance formula (p. 157) 1(a)–6(a), 48, 49(a), 502 Use the midpoint formula (p. 159) 1(b)–6(b), 50
(continued)
Discussion and Writing
45. In the early 17th century, Johannes Kepler discovered thatthe square of the period T varies directly with the cube of itsmean distance a from the Sun. Go to the library and researchthis law and Kepler’s other two laws. Write a brief paperabout these laws and Kepler’s place in history.
46. Using a situation that has not been discussed in the text, writea real-world problem that you think involves two variablesthat vary directly. Exchange your problem with another stu-dent’s to solve and critique.
47. Using a situation that has not been discussed in the text, writea real-world problem that you think involves two variablesthat vary inversely. Exchange your problem with another stu-dent’s to solve and critique.
48. Using a situation that has not been discussed in the text, writea real-world problem that you think involves three variablesthat vary jointly. Exchange your problem with another stu-dent’s to solve and critique.
SULLMC02_013157759X.QXD 11/28/06 1:19 PM Page 201

202 CHAPTER 2 Graphs
Review Exercises
Section You should be able to . . . Review Exercises
2.2 1 Graph equations by plotting points (p. 163) 72 Find intercepts from a graph (p. 165) 83 Find intercepts from an equation (p. 166) 9–164 Test an equation for symmetry with respect to the x-axis, the y-axis, and the origin (p. 167) 9–165 Know how to graph key equations (p. 169) 45–46
2.3 1 Calculate and interpret the slope of a line (p. 174) 1(c)–6(c), 1(d)–6(d),49(b), 51
2 Graph lines given a point and the slope (p. 176) 473 Find the equation of a vertical line (p. 177) 294 Use the point–slope form of a line; identify horizontal lines (p. 178) 27, 285 Find the equation of a line given two points (p. 179) 30–326 Write the equation of a line in slope–intercept form (p. 179) 27, 28, 30–367 Identify the slope and y-intercept of a line from its equation (p. 180) 37–408 Graph lines written in general form using intercepts (p. 181) 41–449 Find equations of parallel lines (p. 182) 33, 34
10 Find equations of perpendicular lines (p. 183) 35, 36
2.4 1 Write the standard form of the equation of a circle (p. 189) 17–202 Graph a circle (p. 191) 21–263 Work with the general form of the equation of a circle (p. 192) 23–26
2.5 1 Construct a model using direct variation (p. 196) 52, 53, 552 Construct a model using inverse variation (p. 197) 543 Construct a model using joint or combined variation (p. 197) 55
In Problems 1–6, find the following for each pair of points:(a) The distance between the points(b) The midpoint of the line segment connecting the points(c) The slope of the line containing the points(d) Interpret the slope found in part (c)
1. 2. 10, 02; 1-4, 6210, 02; 14, 223. 4. 1-2, 22; 11, 4211, -12; 1-2, 325. 6. 1-3, 42; 12, 4214, -42; 14, 82
7. Graph by plotting points.y = x2+ 4
8. List the intercepts of the given graph.
x
y
�4 4
2
�2
9. 10. 11. 12. 9x2- y2
= 9x2+ 4y2
= 16y = 5x2x = 3y2
13. 14. 15. 16. x2+ 4x + y2
- 2y = 0x2+ x + y2
+ 2y = 0y = x3- xy = x4
+ 2x2+ 1
In Problems 9–16, list the intercepts and test for symmetry with respect to the x-axis, the y-axis, and the origin.
In Problems 17–20, find the standard form of the equation of the circle whose center and radius are given.
17. 18. 19. 20. 1hr k2 = 12, -42; r = 31h, k2 = 1-1, -22; r = 11h, k2 = 13, 42; r = 41h, k2 = 1-2, 32; r = 4
In Problems 21–26, find the center and radius of each circle. Graph each circle. Find the intercepts, if any, of each circle.
21. 22. 23. x2+ y2
- 2x + 4y - 4 = 01x + 222 + y2= 9x2
+ 1y - 122 = 4
24. 25. 26. 2x2+ 2y2
- 4x = 03x2+ 3y2
- 6x + 12y = 0x2+ y2
+ 4x - 4y - 1 = 0
SULLMC02_013157759X.QXD 11/28/06 1:20 PM Page 202
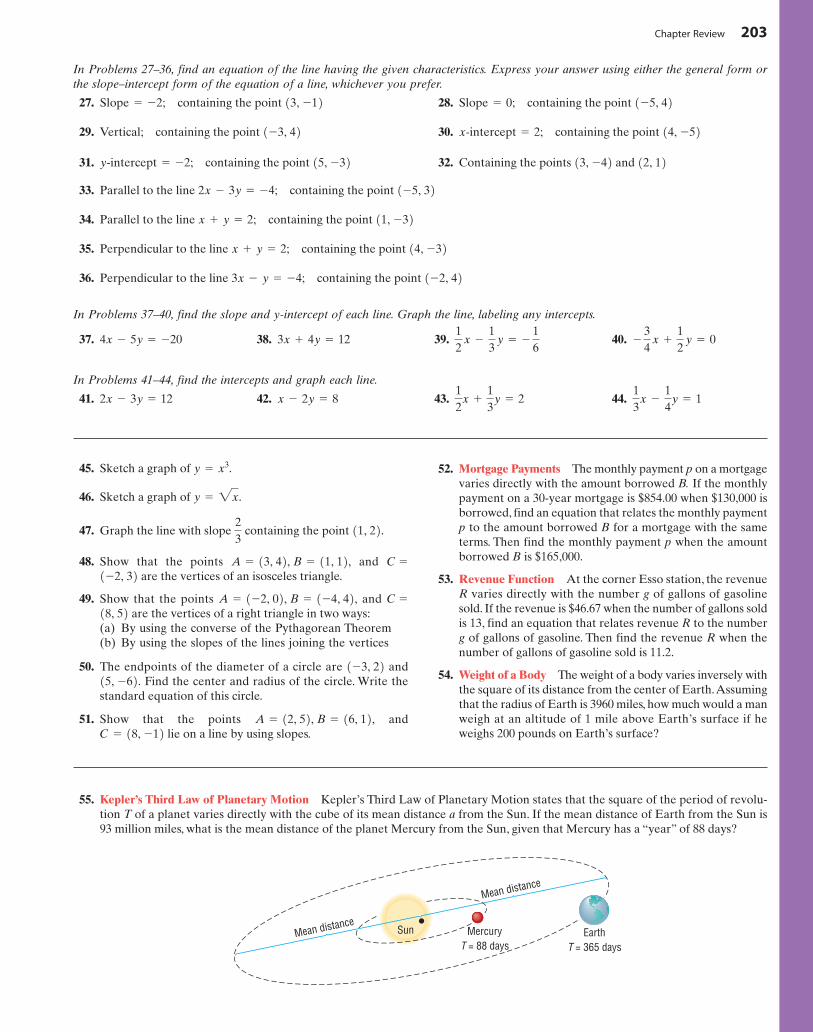
Chapter Review 203
In Problems 27–36, find an equation of the line having the given characteristics. Express your answer using either the general form orthe slope–intercept form of the equation of a line, whichever you prefer.
27. containing the point 13, -12Slope = -2; 28. containing the point 1-5, 42Slope = 0;
29. Vertical; containing the point 1-3, 42 30. containing the point 14, -52x-intercept = 2;
31. containing the point 15, -32y-intercept = -2; 32. Containing the points and 12, 1213, -4233. Parallel to the line containing the point
34. Parallel to the line containing the point
35. Perpendicular to the line containing the point
36. Perpendicular to the line containing the point 1-2, 423x - y = -4;
14, -32x + y = 2;
11, -32x + y = 2;
1-5, 322x - 3y = -4;
In Problems 37–40, find the slope and y-intercept of each line. Graph the line, labeling any intercepts.
37. 38. 39. 40. - 34
x +
12
y = 012
x -
13
y = - 16
3x + 4y = 124x - 5y = -20
45. Sketch a graph of
46. Sketch a graph of .
47. Graph the line with slope containing the point
48. Show that the points and C �are the vertices of an isosceles triangle.
49. Show that the points and C �are the vertices of a right triangle in two ways:
(a) By using the converse of the Pythagorean Theorem(b) By using the slopes of the lines joining the vertices
50. The endpoints of the diameter of a circle are andFind the center and radius of the circle. Write the
standard equation of this circle.
51. Show that the points andlie on a line by using slopes.C = 18, -12
A = 12, 52, B = 16, 12,
15, -62.1-3, 22
18, 52A = 1-2, 02, B = 1-4, 42,
1-2, 32A = 13, 42, B = 11, 12,
11, 22.23
y = 2x
y = x3. 52. Mortgage Payments The monthly payment p on a mortgagevaries directly with the amount borrowed B. If the monthlypayment on a 30-year mortgage is $854.00 when $130,000 isborrowed, find an equation that relates the monthly paymentp to the amount borrowed B for a mortgage with the sameterms. Then find the monthly payment p when the amountborrowed B is $165,000.
53. Revenue Function At the corner Esso station, the revenueR varies directly with the number g of gallons of gasolinesold. If the revenue is $46.67 when the number of gallons soldis 13, find an equation that relates revenue R to the numberg of gallons of gasoline. Then find the revenue R when thenumber of gallons of gasoline sold is 11.2.
54. Weight of a Body The weight of a body varies inversely withthe square of its distance from the center of Earth.Assumingthat the radius of Earth is 3960 miles, how much would a manweigh at an altitude of 1 mile above Earth’s surface if heweighs 200 pounds on Earth’s surface?
Mean distance
Mean distance
T = 88 daysMercury
T = 365 daysEarthSun
55. Kepler’s Third Law of Planetary Motion Kepler’s Third Law of Planetary Motion states that the square of the period of revolu-tion T of a planet varies directly with the cube of its mean distance a from the Sun. If the mean distance of Earth from the Sun is93 million miles, what is the mean distance of the planet Mercury from the Sun, given that Mercury has a “year” of 88 days?
41. 42. 43. 44.13
x -
14
y = 112
x +
13
y = 2x - 2y = 82x - 3y = 12
In Problems 41–44, find the intercepts and graph each line.
SULLMC02_013157759X.QXD 11/28/06 1:20 PM Page 203

204 CHAPTER 2 Graphs
56. Create four problems that you might be asked to do given the two points and Each problem should involve a dif-ferent concept. Be sure that your directions are clearly stated.
57. Describe each of the following graphs in the -plane. Give justification.(a) (b) (c) (d) (e)
58. Suppose that you have a rectangular field that requires watering. Your watering system consists of an arm of variable length thatrotates so that the watering pattern is a circle. Decide where to position the arm and what length it should be so that the entire fieldis watered most efficiently. When does it become desirable to use more than one arm?[Hint: Use a rectangular coordinate system positioned as shown in the figures. Write equations for the circle(s) swept out by thewatering arm(s).]
x2+ y2
= 0xy = 0x + y = 0y = 0x = 0xy
16, 12.1-3, 42
Rectangular field, two arms
y
x
Square field
y
x
Rectangular field, one arm
y
x
CHAPTER TEST
In Problems 1–3, use and .
1. Find the distance from P1 to P2.
2. Find the midpoint of the line segment joining P1 and P2.
3. (a) Find the slope of the line containing P1 and P2.(b) Interpret this slope.
4. Graph by plotting points.
5. Sketch the graph of .
6. List the intercepts and test for symmetry: .
7. Write the slope–intercept form of the line with slope �2 con-taining the point (3, �4). Graph the line.
8. Write the general form of the circle with center (4, �3) andradius 5.
x2+ y = 9
y2= x
y = x2- 9
P2 = 15, -12P1 = 1-1, 329. Find the center and radius of the circle
x2 � y2 � 4x � 2y � 4 � 0. Graph this circle.
10. For the line , find a line parallel to it containingthe point (1, �1). Also find a line perpendicular to it con-taining the point (0, 3).
11. Resistance due to a Conductor The resistance (in ohms)of a circular conductor varies directly with the length of theconductor and inversely with the square of the radius of theconductor. If 50 feet of wire with a radius of has a resistance of 10 ohms, what would be the resistanceof 100 feet of the same wire if the radius is increased to7 * 10-3 inch?
6 * 10-3 inch
2x + 3y = 6
CUMULATIVE REVIEW
In Problems 1–8, find the real solution(s) of each equation.
16. Which of the following points are on the graph of y �(a) (b) (c)
17. Sketch the graph of
18. Find the equation of the line containing the points and Express your answer in slope–intercept form.
19. Find the equation of the line perpendicular to the lineand containing the point Express your an-
swer in slope–intercept form and graph the line.
20. Graph the equation x2+ y2
- 4x + 8y - 5 = 0.
13, 52.y = 2x + 1
12, -22.1-1, 42
y = x3.
13, 1212, 321-2, -12x3
- 3x + 1?1. 2. x2
- x - 12 = 03x - 5 = 0
In Problems 9 and 10, solve each equation in the complex numbersystem.
9. 10. x2- 2x + 5 = 0x2
= -9
In Problems 11–14, solve each inequality. Graph the solution set.
11. 12. -1 6 x + 4 6 52x - 3 … 713. 14. ƒ2 + x ƒ 7 3ƒx - 2 ƒ … 1
3. 4. x2- 2x - 2 = 02x2
- 5x - 3 = 0
5. 6. 22x + 1 = 3x2+ 2x + 5 = 0
7. 8. 3x2+ 4x = 2ƒx - 2 ƒ = 1
15. Find the distance between the points and Q �(4, �2). Find the midpoint of the line segment from P to Q.
P = 1-1, 32
SULLMC02_013157759X.QXD 11/28/06 1:20 PM Page 204

Chapter Project 205
CHAPTER PROJECT
Predicting Olympic Performance Measurements of humanperformance over time sometimes follow a strong linear re-lationship for reasonably short periods. In 2004 the SummerOlympic Games returned to Greece, the home of both theancient Olympics and the first modern Olympics. The fol-lowing data represent the winning times (in hours) for menand women in the Olympic marathon.
1. Treating year as the independent variable and the winningvalue as the dependent variable, find linear equations re-lating these variables (separately for men and women) us-ing the data for the years 1992 and 1996. Compare theequations and comment on any similarities or differences.
2. Interpret the slopes in your equations from part 1. Do they-intercepts have a reasonable interpretation? Why or whynot?
3. Use your lines to predict the winning time in the 2004Olympics. Compare your predictions to the actual results(2.18 hours for men and 2.44 hours for women). How welldid your equations do in predicting the winning times?
4. Repeat parts 1 to 3 using the data for the years 1996 and2000. How do your results compare?
5. Would your equations be useful in predicting the winningmarathon times in the 2104 Summer Olympics? Why orwhy not?
6. Pick your favorite Winter Olympics event and find thewinning value (that is distance, time, or the like) in twoWinter Olympics prior to 2006. Repeat parts 1 to 3 usingyour selected event and years and compare to the actualresults of the 2006 Winter Olympics in Torino, Italy.
Source: www.hickoksports.com/history/olmtandf.shtml
Year Men Women
1984 2.16 2.41
1988 2.18 2.43
1992 2.22 2.54
1996 2.21 2.43
2000 2.17 2.39
SULLMC02_013157759X.QXD 11/28/06 1:20 PM Page 205

SULLMC02_013157759X.QXD 11/28/06 1:20 PM Page 206