Embed Size (px)
Citation preview

Graphite market report and forecast for Nouveau Monde Graphite October 2018
Prepared by Benchmark Mineral Intelligence

Introduction
• Nouveau Monde Graphite is developing the Matawinie Graphite production area in Quebec, Canada, for which it is preparing 43-101 report in order to support further financing.
• This report has been prepared for Nouveau Monde Graphite in order to assist with its financing efforts and presents Benchmarks independent forecasts for graphite demand, supply and pricing.
• The report will cover the following:
1. Introduction and Forecast Assumptions 2. Long Term Supply Forecasts for Natural Flake and Synthetic Graphite to 2040 3. Natural Flake Graphite Price Forecasts 4. Premium Graphite Markets Outlook and Prices
BENCHMARK MINERAL INTELLIGENCE – NOUVEAU MONDE GRAPHITE – OCTOBER 2018 Page 2

1. Introduction and Forecast Assumptions

1. Introduction and Forecast Assumptions
• This section will look at the current and future supply chain for graphite, with a focus on the burgeoning li-ion battery market. We will also highlight the current announcements and investments being made in the supply chain, including government policy, investment in battery manufacturing plants and announced investments from the automotive sector.
• We will also show our demand forecast methodology, flowing from government policy to EV penetration to battery demand and graphite consumption in Li-ion batteries and the outlook of other end-use markets.
• Graphite plays a critical role in the lithium-ion battery supply chain, as the main input for the anode material. At present roughly half of anode material is sourced from natural graphite, the other 50% comes from synthetic graphite, demand from this sector in 2018 is estimated at 161,000 tonnes.
• In terms of total graphite demand, our current base case shows graphite consumption increasing from 723,000 tonnes in 2018 to 1.9m tonnes in 2025, excluding inventory build, and shows a structural supply gap opening in natural flake graphite markets.
BENCHMARK MINERAL INTELLIGENCE – NOUVEAU MONDE GRAPHITE – OCTOBER 2018 Page 4

1. Introduction and Forecast Assumptions
• The chart below outlines the key drivers of demand for lithium-ion batteries over the forecast period. As can be seen the major growth area is for EVs, followed by stationary (grid) applications. In our base case scenario we expect that demand will be approximately 134,000 MWH in 2018, reaching 760,000 MWH by 2025 and 4M MWH by 2035.
1,000
3,500
2,500
5,000
4,500
0
3,000
1,500
4,000
2,000
500
2,155
2027
1,959
‘000 MWH
1,567
20162015 2017 2018 2019
949
2020 2021
1,175
72
2022 2023 2024 2025 20292026
3,135
2028 2030
760
2031
444
2032 2033 2034 2035
92 105 134 153 191 254 339
585
2,351
2,743
3,526
3,918
Upside
Electric Vehicles
Other
Downside
Stationary
Base Case MWH Compound Annual Growth Rate by sector, 2018-2035
Electric vehicles 24%
Stationary 33%
Other – includes electronics, portable batteries
4%
Total Li-ion battery demand 22%
BENCHMARK MINERAL INTELLIGENCE – NOUVEAU MONDE GRAPHITE – OCTOBER 2018 Page 5

1. Introduction and Forecast Assumptions
• The chart below outlines the development of demand for graphite over the forecast period to 2035, broken down by broad end-use sector. As can be seen batterydemand broadly reaches parity with other industrial demand by 2025-2026 given the level of growth forecast for both sectors. By the end of the forecast period we expect that graphite demand will reach 5.9 million tonnes, growing at a CAGR of 13% over the forecast period.
1,500
3,500
4,500
6,000
3,000
5,500
4,000
0
500
2,000
5,000
2,500
1,000
1,073
20272017 203420332031
‘000 tonnes
2016
2,912
1,164
161
561
2018
3,659
20232019 2020 2021
2,129
2022 2024
2,586
911
991
2030
1,361
2025 2026
635
2028
588
2029 2032
4,702
1,184
2015
664 723
4,407
775 873997
2035
1,902
2,421
3,402
3,915
4,900
5,393
5,886
1,608
+13%
Other industrial demand
Battery demand
Base Case Compound Annual Growth Rate by sector, 2018-2035
Battery demand 22%
Other industrial demand 4%
BENCHMARK MINERAL INTELLIGENCE – NOUVEAU MONDE GRAPHITE – OCTOBER 2018 Page 6
1. Introduction and Forecast Assumptions
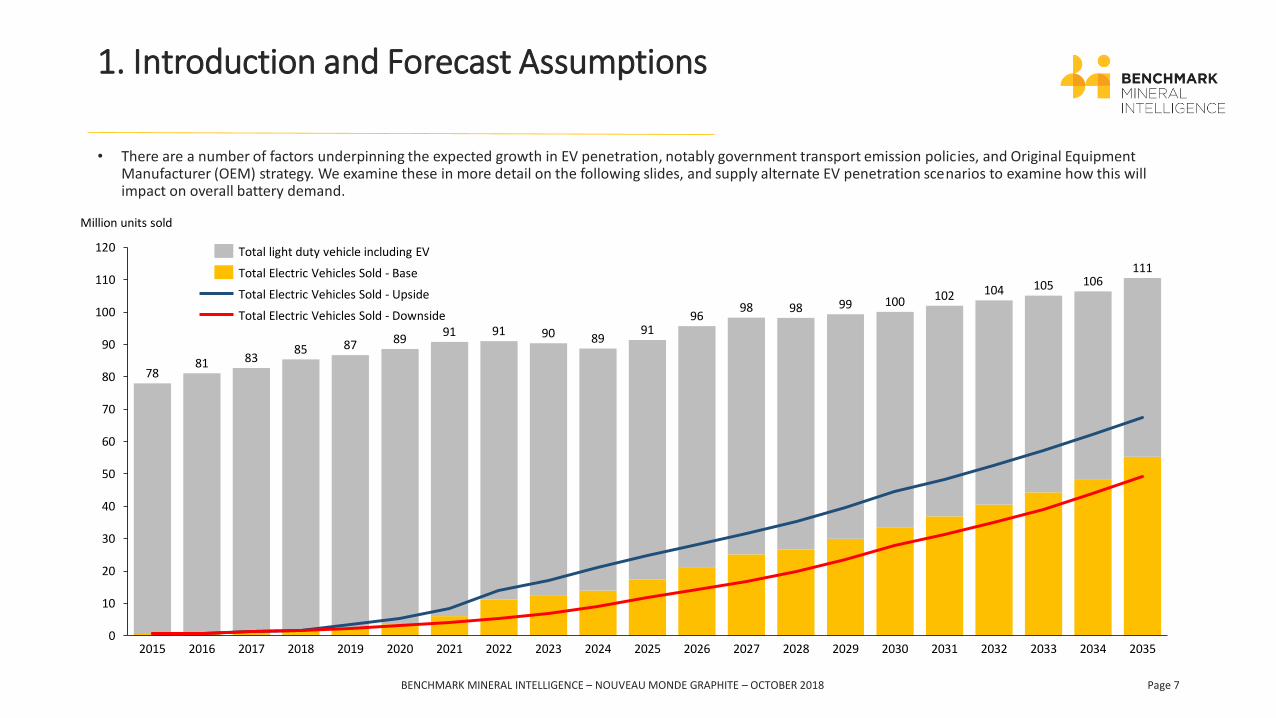
• There are a number of factors underpinning the expected growth in EV penetration, notably government transport emission policies, and Original Equipment Manufacturer (OEM) strategy. We examine these in more detail on the following slides, and supply alternate EV penetration scenarios to examine how this will impact on overall battery demand.
0
10
20
30
40
50
60
70
80
90
100
110
120
2021
Million units sold
202020162015 2017
98
20272018
98
2022 2023 2024 2025
96
89
2026
102
83
2028 2029 2030 2031 2032 2033
85
2034
111
2035
7881
87
2019
91 91 90 9189
99 100105 106
104
Total light duty vehicle including EV
Total Electric Vehicles Sold - Base
Total Electric Vehicles Sold - Downside
Total Electric Vehicles Sold - Upside
BENCHMARK MINERAL INTELLIGENCE – NOUVEAU MONDE GRAPHITE – OCTOBER 2018 Page 7

1. Introduction and Forecast Assumptions
Brazil: Target of 30% penetration of electric vehicle sales by 2030
Mexico: Target of 30% penetration of electric vehicle sales by 2030
USA: No Federal target set, California has set nominal state level targets for size of EV fleet
Canada: Target of 30% penetration of electric vehicle sales by 2030
China: Target of 5% penetration of electric vehicle sales by 2020, 20% by 2025
Japan and South Korea: Target of 30% penetration of electric vehicle sales by 2030
India: Proposal to end ICE sales by 2030
Italy: Target of 30% penetration of electric vehicle sales by 2030
Norway and Netherlands: Proposal to end ICE sales by 2025, Germany by 2030
UK and France: Proposal to end ICE sales by 2040
05
1015202530
Ch
ina
USA
Jap
an
Ger
man
y
Ind
ia UK
Fran
ce
Bra
zil
Ital
y
Can
ada
Sou
th K
ore
a
Mex
ico
Net
her
lan
ds
No
rway
Oth
er
Passenger Car and LDV sales, 2017, M units
Global policy statements by governments supporting EV adoption
BENCHMARK MINERAL INTELLIGENCE – NOUVEAU MONDE GRAPHITE – OCTOBER 2018 Page 8

1. Introduction and Forecast Assumptions
2022 2025 2030
Total annual vehicle production
10-12M
5-9m
1-4M
EV strategy timeline
VW group plans to invest more than $24bn in zero-
emission vehicles by 2030. Will develop 80 EV models by 2025, wants to offer an
electric version of each of its 300 models by 2030
Chinese OEMs expected to comply with
20% EV penetration rate
ruling by 2025
PSA aims to develop at least 40 electric vehicles by 2025
Aiming to develop 8 EV models by 2025, with 30 panned by
2030 Has set a target of two thirds of vehicle
sales EV by 2030
GM planning to introduce at least 20
EVs by 2023
Launching 12 EV models by 2022
Ford is planning to invest $11Bn in EVs by 2022, and will have 40 hybrid and full
EV models
Toyota has set a sales target of around 1m EVs
and fuel-cell vehicles (FCVs) by 2030,
investment $13 billion to develop and make
batteries
BMW plans to deliver 12 pure EVs by 2025Daimler will bring
10 pure EVs to the market by 2022
Major passenger car and light duty vehicle OEM EV strategy announcements
BENCHMARK MINERAL INTELLIGENCE – NOUVEAU MONDE GRAPHITE – OCTOBER 2018 Page 9

1. Introduction and Forecast Assumptions
For our base case scenario, in 2018 we expect battery demand, expressed in Mega Watt Hours, will be in the region of 82,000 MWH. By 2025, we expect this to grow to 405,000 MWH, by 2030 to 1.9M MWH.
4,200
2,000
1,400
3,000
0
2,800
2,200
200
600
2,400
400
1,000
800
3,600
2,600
4,000
1,200
3,200
3,800
1,600
1,800
3,400
82
2019
3,372
2029
29
2026
57
356
46
2034
‘000 MWH
20322015 2016 20282017 2018 2020
95
2021 2022
1,846
2023 2024
2,707
2025
263
2030 20332031 2035
126 185
478
2027
787
2,012
986
1,375
1,708
2,374
3,039
619
Base case
Upside
Downside
BENCHMARK MINERAL INTELLIGENCE – NOUVEAU MONDE GRAPHITE – OCTOBER 2018 Page 10

1. Introduction and Forecast Assumptions
0
50
100
150
200
250
300
350
400
450
500
550
600
650
700
750 726
Annual Cap 2016 (GWh)
GWH
Gwh by 2028Gwh by 2023
64
401
Japan
Europe
Australia
North America
South Korea
China
• In order to meet higher battery demand new Giga-factory capacity will need to be added. In this slide we summarise by country where new mega-factory supply is likely to be added, as we can see the majority of capacity will be added in China and North America.
• As can be seen, based on current mega-factory capacity expansion announcements and our outlook for battery demand we are projecting a shortage by 2028 of 649 GWH. We do expect that further capacity projects will be announced in order to fill this gap, especially given the level of pledged investment from automotive manufacturers.
Mega-factory capacity by region, 2016-2028
BENCHMARK MINERAL INTELLIGENCE – NOUVEAU MONDE GRAPHITE – OCTOBER 2018 Page 11

1. Introduction and Forecast Assumptions
LG C
hem
Mic
hig
an I
nc.
Pan
aso
nic
Him
eji
Pan
aso
nic
Su
min
oe
Lith
ium
En
ergy
Jap
an (
GS
Yuas
a te
chn
olo
gy)
AES
C Z
ama
32
Pan
aso
nic
Kas
ai
You
lion
Bat
tery
Inc
30
BYD
Ch
ina
LFP
SK In
no
vati
on
128
SK In
no
vati
on
Eu
rop
e
LG C
hem
Wro
claw
En
ergy
Sp
. z o
.o.
1
Dyn
avo
lt, F
ujia
n
BA
K
CA
LB
Nan
jing
LG C
hem
New
En
ergy
Bat
tery
Co
., Lt
d.
10
GSR
Cap
ital
, Sw
ede
n
BYD
Ch
ina
NC
M
Gu
anzh
ou
Gre
at P
ow
er E
ner
gy &
Tec
hn
olo
gy
GX
GK
BEI
/Mag
nis
, To
wn
svill
e, A
ust
ralia
4
Imp
eriu
m3
(B
EI/M
agn
is)
Sam
sun
g SD
I Xia
n
84
LG C
hem
Ko
rea
Sam
sun
g SD
I Ko
rea
AES
C, Z
hen
jian
g, J
ian
gsu
AES
C J
ian
gsu
Pan
aso
nic
Dal
ian
23
Gre
at W
all
Lish
en
No
rth
volt
Terr
a E
Ho
ldin
g
CA
TL
Tesl
a /
Pan
aso
nic
En
ergy
of
No
rth
Am
eric
a
5
25
5
1814
89 816
10 10
2015 15
20 18 20 20
3034
100
150
25
2028
2016
Mega-factory capacity by company, 2016-2028Gigawatt Hours
BENCHMARK MINERAL INTELLIGENCE – NOUVEAU MONDE GRAPHITE – OCTOBER 2018 Page 12

1. Introduction and Forecast Assumptions
BENCHMARK MINERAL INTELLIGENCE – NOUVEAU MONDE GRAPHITE – OCTOBER 2018 Page 13

1. Introduction and Forecast Assumptions
The chart below outlines our forecast for graphite material for use as an input to anodes in the lithium-ion battery supply chain, we expect that graphite by battery type will remain stable throughout the forecast period
1.5
4.5
4.0
0.0
0.5
3.5
2.0
2.5
1.0
3.0
5.0
2027 203520242021
2.4
0.2
2028
Million tonnes
2015
0.5
0.1
2016 20202017 2018
1.9
2019 2022 2023 2025 2026 20322029 2030
2.6
2031 2033
3.8
1.4
2034
0.1 0.1 0.2
0.7
0.2 0.3 0.4
0.91.1
2.8
3.3
4.2
4.7LMO
LMNO
LTO
Other
LCO
LFP
NCA
NCM
BENCHMARK MINERAL INTELLIGENCE – NOUVEAU MONDE GRAPHITE – OCTOBER 2018 Page 14

2. Long Term Supply Forecasts for Natural Flake and Synthetic Graphite to 2040

2. Long Term Supply Forecasts for Natural Flake and Synthetic Graphite to 2040
• This analysis will examine the outlook for supply, identifying key capacity changes among existing market players and new entrants. We will review existing capacity and provide an outlook for both likely mine expansion projects, as well closures over the forecast period, also provided in an Excel database format.
• Graphite is mined in several countries around the world, the main sources of flake graphite for batteries are Brazil, Mozambique and China. Nearly all of this material is currently processed to uncoated spherical (anode precursor) and coated spherical (anode) in China. Battery cell manufacture also takes place in China, as well as Japan, Korea, Poland and the US.
• At present roughly 60% of total graphite supply comes from synthetic production, based in China, India, Europe and the US, we expect this share to fall over time owing to the relatively high cost of production, and an expansion in natural graphite capacity
Imerys, Lac-des-îles, QC mine closing Q4 2018
Nouveau Monde Graphite, Matawinie, QC mine
BENCHMARK MINERAL INTELLIGENCE – NOUVEAU MONDE GRAPHITE – OCTOBER 2018 Page 16

2. Long Term Supply Forecasts for Natural Flake and Synthetic Graphite to 2040
Overview and outlook for synthetic graphite
• Synthetic graphite is produced using high temperature treatment of amorphous carbon materials, notably petroleum coke, also know as needle or green coke, a by-product of crude oil production. The production process is described in the flow diagram below.
• Synthetic graphite production has the advantage of producing consistently high quality graphite (90%+ C) suitable for battery applications, however owing to the energy intensity of production it is a very high cost source of supply. In addition the principal feedstock, needle coke, has increased in price dramatically in recent years, from a long-term average of roughly $800 per tonne to $8,000 per tonne. Further, given that needle coke is a by-product of crude oil production supply is subject to movements in oil output, affecting both price and availability.
• At present synthetic graphite is manufactured in China, India, Europe and the US. In China the main producers are Fangda Carbon New Material Technology Co Ltd, Jilin Carbon Co Ltd, Sunstone Development Co Ltd, Hongte Group and Jinzhou Petrochemical Co Ltd. Outside of China the main producers are SGL, Graftech, Imerys and Showa Denko.
• Given the higher cost of production of synthetic graphite and the relative availability of cheaper natural flake graphite, we do not expect that new synthetic graphite capacity will be added in the coming years. That, coupled with the expansion of natural graphite supply will see the market share for synthetic graphite contract markedly in the forecast period
BENCHMARK MINERAL INTELLIGENCE – NOUVEAU MONDE GRAPHITE – OCTOBER 2018 Page 17

2. Long Term Supply Forecasts for Natural Flake and Synthetic Graphite to 2040
1,606
900
706
Total Supply Mined - Existing producers
Synthetic
2,758
900
1,061
797
SyntheticTotal Supply Mined - Existing producers
Mined - New Entrants
Natural Flake and Synthetic graphite supply-balance 2018(‘000 tonnes)
Natural Flake and Synthetic graphite supply-balance 2025(‘000 tonnes)
Synthetic graphite market share -
60%
Synthetic graphite market share - 33%
• The charts below illustrate our forecasts for the breakdown of graphite supply for all end-uses in both 2018 and 2025. As can be seen, we expect that significant new capacity will come online from both incumbent natural graphite miners and new entrants
• In the following slides we detail how we expect this to happen, beginning with brownfield capacity expansions at existing operations and then looking at mining projects.
BENCHMARK MINERAL INTELLIGENCE – NOUVEAU MONDE GRAPHITE – OCTOBER 2018 Page 18

2. Long Term Supply Forecasts for Natural Flake and Synthetic Graphite to 2040
• At any time there are a number of brownfield and greenfield graphite capacity projects announced and undergoing development, however there are a number that will either never come to fruition and some that proceed at a faster or slower pace than projected.
• The factors that determine how likely a project is to come online are often related, below we group individual issues by type and show linkages between them:
Resource geography factors Resource geology factors Financial factors
Political risk – resources located in territories with an unstable political
situation are less likely to secure financing or necessary human resources to proceed
Access to key markets – transportation costs and lead times often feature heavily
in a projects ability to be competitive
Resource costs – Capex factors such as land values and opex factors such as
labour, transport and energy costs will largely be determined by resource
geography
Resource size – Resource size will determine the likely capex for the project as well as the mine life and
capacity
Resource quality – the distribution of flake sizes and quality, and suitability for processing to battery grades are crucial
for securing buyers and premium pricing
Resource costs – the resource type and quality will largely determine the capex
and operating mining costs for the project and likelihood of securing
financing
Access to financing – securing financing is a crucial stage in project development, and linked to several
factors as shown
Price forecasts – consensus price forecasts determine a projects forecast
revenue and are therefore vital in securing financing
Off-take agreements and strategic partnerships – the likelihood a project coming online is massively boosted by securing off-take agreements and/or
involvement of an end-user
Natural flake capacity expansions, 2018-2040
BENCHMARK MINERAL INTELLIGENCE – NOUVEAU MONDE GRAPHITE – OCTOBER 2018 Page 19

2. Long Term Supply Forecasts for Natural Flake and Synthetic Graphite to 2040
Brownfield natural flake capacity expansions, 2018-2040• In this slide we outline expected capacity expansions at existing graphite producers over the forecast period. Over the period to 2040 we
expect that there will be nearly 900,000 tonnes of brownfield capacity expansions by existing producers, notably in China, the Ukraine and Mozambique
90,000
20302018 20352025 2040
100,000
157,000
209,000 209,000
468,000477,500 453,600
2018 20402025 2030 2035
472,400472,400
Grafite do Brasil - Extractiva
Nacional do Grafite
2030 20352018 2040
81,500
2025
42,000
73,00081,500 81,500
2030 20352018 2025 2040
436,000
102,000
779,000871,000 871,000
40,000
20302018 2025 2035
46,000
32,000
2040
55,000 55,000
Russia - Ural Graphite
Norway - Skaland Graphite AS - LNS Group
Ukraine - Zavalivskiy GraphiteImerys, Lac-des-îles, QC mine closing Q4 2018
Heilon Jiang
Inner Mongolia, Shanxi
Other provinces Hubei, Hebei, Henan, Sichuan
Shandong
Madagascar - Bass Metals
Zimbabwe - AMG Mining - Government JV
Namibia - Imerys Graphite and Carbon/Gecko Jv
Mozambique - Syrah Resources
Jharkhand
Tamil Nadu
Odisha
BENCHMARK MINERAL INTELLIGENCE – NOUVEAU MONDE GRAPHITE – OCTOBER 2018 Page 20

2. Long Term Supply Forecasts for Natural Flake and Synthetic Graphite to 2040
Typical project development milestones
• Scoping: initial financing to undertake preliminary exploration of a deposit
• Resource estimation: scoping results used to raise further finance for sufficient drilling to publish NI 43-101 and/or JORC compliant resource estimates1
• Pre-feasibility study: preliminary engineering plans and economic viability to determine whether to proceed to a full feasibility study
• Feasibility study: presentation of plans for extraction and processing and full assessment of a project’s geological profile and economic viability
• Financing: subsequent to feasibility study financing is secured for project construction
• Construction: final development of project to completion
1. NI 43-101 is the mineral project disclosure standard for companies listed on Canadian Stock Exchanges, JORC is the equivalent for Australian-listed companies
Mineral lease
Exploration
Environmental
Infrastructure
Head Frame/Shaft Sinking
Mine development/ Ramp up
Engineering and design
Construct mill
Year
1
Year
2
Year
3
Year
4
Year
5
Year
6
Year
7
Year
8
Greenfield development timeline
Route to development for a greenfield mining project
Greenfield natural flake capacity expansions, 2018-2040• In the flow chart below we outline the main development stages for the development of a greenfield graphite mining project. • At present we are tracking numerous projects that we classify as ‘Highly probable, ‘Probable’ and ‘Possible’ based on their current stage of
development and likely progress to production. In the following slide we outline the current stage of development for a number of major greenfield projects
BENCHMARK MINERAL INTELLIGENCE – NOUVEAU MONDE GRAPHITE – OCTOBER 2018 Page 21

2. Long Term Supply Forecasts for Natural Flake and Synthetic Graphite to 2040
Development phases for key greenfield graphite mining projects
Key: DR. – Drilling, Expl. – Exploration, Feas. – Feasibility, Cons. – Construction, Prop. St. Up – Proposed started Up, Ph. – Phase
BENCHMARK MINERAL INTELLIGENCE – NOUVEAU MONDE GRAPHITE – OCTOBER 2018 Page 22

2. Long Term Supply Forecasts for Natural Flake and Synthetic Graphite to 2040
• In the chart below we outline our forecast for the development of natural flake capacity over time. As can be seen there is a significant pipeline of new capacity coming online for graphite over the next decade. There will need to be further greenfield and brownfield capacity expansions in the period beyond 2028 in order to meet rising demand, even in our downside demand scenario
2.4
0.4
1.4
0.6
1.2
2.0
0.0
1.0
0.2
1.6
0.8
1.8
2.2
1.96
2030 2032
1.44
0.59
1.43
2033
0.84
Million tonnes
2015 2016
0.65
2017
1.75
0.67
2018 203720222019 2020 2021 2023 2024 2025
2.332.27
2026
1.971.92
2027 2028 2029
0.71
0.91
2035
1.15
2036
1.77
2.072.17
2031 2034 2038 2040
2.342.32 2.33 2.34 2.34 2.34 2.34 2.34
2039
Operational supply
Highly Probable additonal tonnes
Probable additonal tonnes
Possible additonal tonnes
• Factors in a 5% supply disruption allowance from stated capacity• Does not include synthetic supply
BENCHMARK MINERAL INTELLIGENCE – NOUVEAU MONDE GRAPHITE – OCTOBER 2018 Page 23

2. Long Term Supply Forecasts for Natural Flake and Synthetic Graphite to 2040
There is a significant pipeline of new capacity coming online for graphite over the next decade. There will need to be further greenfield and brownfield capacity expansions in the period beyond 2028 in order to meet rising demand, even in our downside demand scenario
Potential supply deficit once planned capacity and projects come online
• Includes non-battery demand• Factors in a 5% supply disruption allowance from stated capacity• Does not include synthetic supply
0.6
1.4
2.4
0.0
1.6
0.2
3.8
0.8
0.4
3.6
1.2
2.6
2.8
3.0
1.0
3.4
2.2
1.8
2.0
3.2
2017
1.43
2023
0.84
20292015
Million tonnes
2016 2018
0.59
2019
1.96
2020 2021 20272022 2024 2025 2026 2028
1.77
0.65
1.15
0.67 0.71
0.91
2030
1.75
1.92 1.972.07
2.17
1.44
Demand - Base Case
Possible additonal tonnes
Probable additonal tonnes
Operational supply
Highly Probable additonal tonnes
BENCHMARK MINERAL INTELLIGENCE – NOUVEAU MONDE GRAPHITE – OCTOBER 2018 Page 24

3. Natural Flake Graphite Price Forecasts

3. Natural Flake Graphite Price Forecasts
• In this section we provide a price forecast for each grade that Matawinie project will produce, on a delivered North America basis and also a weighted basket price forecast including all grades.
• The Matawinie project has high carbon contents, 97-98%, with the following flake size distribution for natural flake graphite:
Natural flake graphite (97-98% C) flake size Product weighting
+100 mesh 17%
+50 mesh 31%
+80 mesh 12%
-100 mesh 40%
• In order to arrive at a final forecast for each grade that Matawinie project will produce, on a delivered North America basis we look first at the drivers of graphite pricing, including price differences between grades, and we use the benchmark China Fob reference price as the basis for the forecast. We then add a location premium for a delivered North America price for the grades Matawinie will produce.
BENCHMARK MINERAL INTELLIGENCE – NOUVEAU MONDE GRAPHITE – OCTOBER 2018 Page 26
3. Natural Flake Graphite Price Forecasts
0
500
1,000
1,500
2,000
2,500
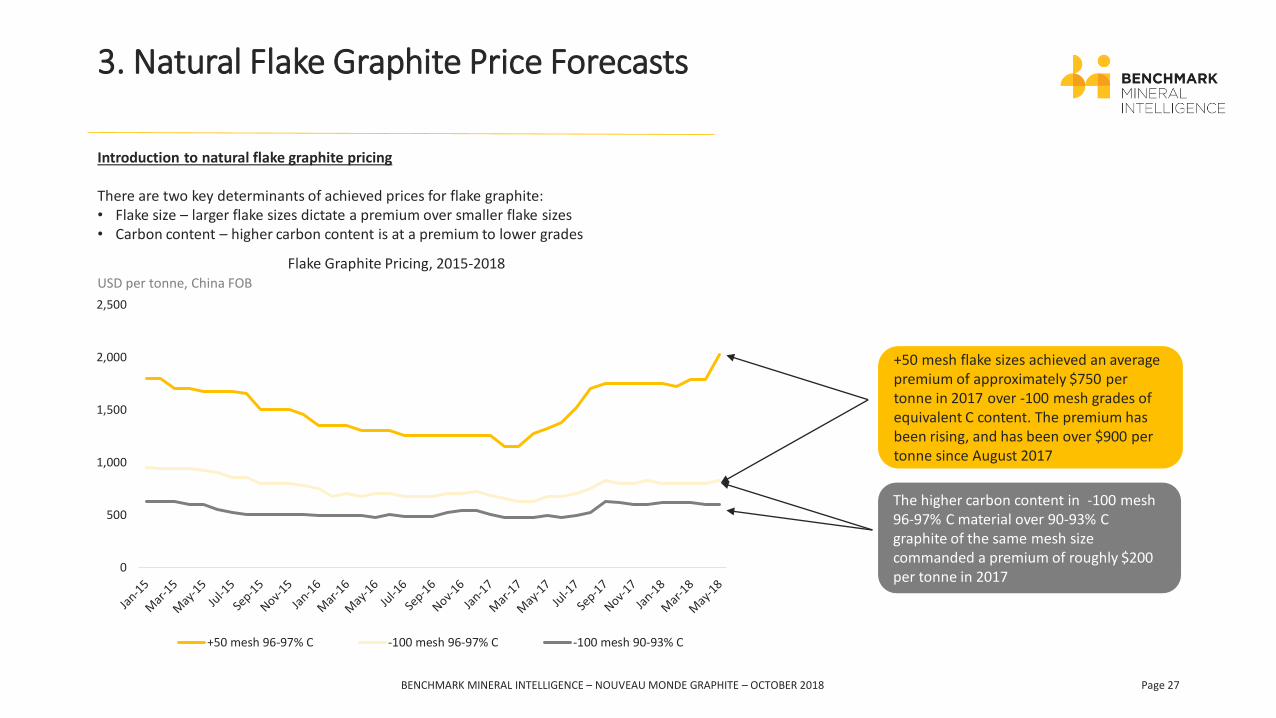
Flake Graphite Pricing, 2015-2018
+50 mesh 96-97% C -100 mesh 96-97% C -100 mesh 90-93% C
USD per tonne, China FOB
+50 mesh flake sizes achieved an average premium of approximately $750 per tonne in 2017 over -100 mesh grades of equivalent C content. The premium has been rising, and has been over $900 per tonne since August 2017
The higher carbon content in -100 mesh 96-97% C material over 90-93% C graphite of the same mesh size commanded a premium of roughly $200 per tonne in 2017
Introduction to natural flake graphite pricing
There are two key determinants of achieved prices for flake graphite:• Flake size – larger flake sizes dictate a premium over smaller flake sizes• Carbon content – higher carbon content is at a premium to lower grades
BENCHMARK MINERAL INTELLIGENCE – NOUVEAU MONDE GRAPHITE – OCTOBER 2018 Page 27

3. Natural Flake Graphite Price Forecasts
IRR assumptions for a ‘Typical’ greenfield graphite project
Output at full capacity (tonnes per annum) 40,000
Mine Life (years) 30
Capital Expenditure (USD Million) 200
Operating Cost (USD per tonne) 450
IRR at different graphite long run pricing
Graphite long run pricing long run price assumption
Indicative IRR
USD1,500 per tonne 22%
USD2,000 per tonne 27%
USD1,000 per tonne 15%
Benchmark Graphite price forecast methodology
• Our medium and long-term price forecast methodology for lithium considers the following factors:
• Balance of supply and demand – Based on our analysis of the development of demand over time, and our understanding of the pipeline of new greenfield and brownfield capacity, we are able to make an assessment of the extent of over and under supply in the market over time, and how this is likely to impact prices
• Production costs for the marginal cost producer – Long run pricing in commodity markets is often determined by the level at which the highest cost producer needed to supply the market can continue to operate; for graphite this would be at a cash cost level of around USD900 per tonne. For the forecast we expect this will be less of a factor, due to the ongoing need to incentivise new projects prices will be well above this level
• Incentive pricing for new greenfield and brownfield capacity investment – There will be an ongoing requirement for new greenfield capacity over the course of the forecast period. We have conducted an Initial Rate of Return (IRR) analysis for a ‘Typical’ greenfield natural flake graphite project, which suggests that at a price level of USD2,000 per tonne for a basket of graphite grades the IRR would be 27%. This is approximately the level that junior miners are using for their assessment of project economics, and reflects the fact that as the lower cost new supply comes online there will be a need for the development of higher capex projects over time.
BENCHMARK MINERAL INTELLIGENCE – NOUVEAU MONDE GRAPHITE – OCTOBER 2018 Page 28

3. Natural Flake Graphite Price Forecasts
900
800
700
600
500
400
300
100
200
0Heilon Jiang (Low Cost) Mahenge
Maiquinique
Shandong
Lynx, Nr KaroiHeilon Jiang (High Cost)
Montepuez
Epanko Tamil NaduOtjiwarongo
Ancuabe
Salto Da DivisaItapecerica
Inner Mongolia, ShanxiOther provinces Hubei, Hebei, Henan, Sichuan
Lac Guéret, QC
Odisha
Skaland
Molo
Coosa
Lac KnifeTaiginka
Graphmada Large Flake Graphite Mine
Lindi Jumbo Graphite
BunyuPedro Azul
Zavalivskiy
Balama
Jharkhand
Russia
China Norway
Namibia
Zimbabwe
Mozambique
Tanzania Madagascar
Canada
Brazil
Ukraine
India
United States of America
USD per tonne (Real 2018)
Graphite industry cash cost* curve 2035
*Excludes capital repayments and royalties
The marginal producer operates USD875 per tonne
BENCHMARK MINERAL INTELLIGENCE – NOUVEAU MONDE GRAPHITE – OCTOBER 2018 Page 29

3. Natural Flake Graphite Price Forecasts
300
0
500
700
200
400
600
900
800
100
Salto Da Divisa 2018
Pedro Azul 2018
Inner Mongolia, Shanxi
Bunyu
Graphmada Large Flake Graphite Mine
Itapecerica 2018
Lac Guéret, QC
MaiquiniqueHeilon Jiang (High Cost)
MoloItapecerica
Pedro AzulMontepuez
Lynx, Nr KaroiSalto Da DivisaLynx, Nr Karoi
Heilon Jiang (Low Cost) 2018 Mahenge
Otjiwarongo Tamil Nadu 2018
Maiquinique 2018
Graphmada Large Flake Graphite Mine 2018
Taiginka
Odisha 2018
Jharkhand 2018
Zavalivskiy 2018
CoosaSkaland
Jharkhand
Odisha
Shandong
Taiginka 2018
Balama
Lindi Jumbo GraphiteLac Knife
AncuabeEpanko
Heilon Jiang (Low Cost)
Otjiwarongo 2018
Tamil Nadu
Other provinces Hubei, Hebei, Henan, Sichuan
Balama 2018
Zavalivskiy
USD per tonne (Real 2018)
Graphite industry cash cost* curve 2035
*Excludes capital repayments and royalties
Possible
Operating
Highly Probable
Probable Brownfield expansion
The vast majority of new brownfield and greenfield capacity will operate at or below $450 per tonne
BENCHMARK MINERAL INTELLIGENCE – NOUVEAU MONDE GRAPHITE – OCTOBER 2018 Page 30

3. Natural Flake Graphite Price Forecasts
Natural flake graphite historical pricing 2015-2018
• In the charts below we illustrate the price history for high carbon graphite grades since 2015, and the industry supply and demand balance over the same period.
• There has been a marked increase in graphite pricing over the last two years, especially for higher flake sizes, as a response to a tightening in the market over the same period, and this trend has accelerated in 2018 as the market has moved into a supply deficit despite brownfield expansions from existing producers.
0
500
1,000
1,500
2,000
2015 2016 2017 2018
0
100
200
300
400
500
600
700
800
2015 2016 2017 2018
Graphite supply and demand balance, 2015-2018
Operational supply Demand - Base Case
‘000 tonnes
+50 mesh+100 mesh -100 mesh+80 mesh
USD per tonne, FOB China
High carbon (96-97% C) natural flake graphite pricing history, 2015-2018
BENCHMARK MINERAL INTELLIGENCE – NOUVEAU MONDE GRAPHITE – OCTOBER 2018 Page 31

3. Natural Flake Graphite Price Forecasts
0
500
1,000
1,500
2,000
2,500
2019 2020 2021 2022 2023 2024 2025 2026
Tho
usa
nd
s
Graphite supply and demand forecasts, 2019-2026
Operational supplyHighly Probable additonal tonnesProbable additonal tonnesPossible additonal tonnesDemand - Base Case
Natural flake graphite price forecast 2019-2026
• In the ‘medium term’ to 2026 we will see continued brownfield expansions, and from 2021 new capacity coming online from greenfield projects.In the middle of this period it is likely that the market will move into slight oversupply for a number of years as new capacity ramps up faster than demand growth. The market quickly moves back into deficit towards the end of the period however, as the pipeline of new capacity projects is exhausted and demand continues to grow.
• As a result there will need to be incentivise new projects to come online from 2025 onwards, which would mean they begin development in 2019 or 2020, therefore we do not anticipate a significant price reduction in this period
‘000 Tonnes
Includes non-battery demand
0
500
1,000
1,500
2,000
2,500
2019 2020 2021 2022 2023 2024 2025 2026
-100 mesh
+100 mesh
+50 mesh
+80 mesh
High carbon (96-97% C) natural flake graphite price forecast, 2019-2026
USD per tonne, Real 2018, FOB China
BENCHMARK MINERAL INTELLIGENCE – NOUVEAU MONDE GRAPHITE – OCTOBER 2018 Page 32

3. Natural Flake Graphite Price Forecasts
0
1,000
2,000
3,000
4,000
5,000
6,000
7,000
8,000
9,000
2027 2028 2029 2030 2031 2032 2033 2034 2035 2036 2037 2038 2039 2040
Graphite supply and demand forecasts, 2027-2040
Operational supply
Highly Probable additonal tonnes
Probable additonal tonnes
Possible additonal tonnes
Demand - Base Case
’000 Tonnes
Includes non-battery demand
Natural flake graphite price forecast 2027-2040
• From 2027 until the end of the forecast period at 2040 the market remains in deficit and will continue to need new supply coming online in order to meet demand. Prices will therefore need to be high enough to incentivise demand.
• As we stated the main determinant of long term prices for graphite over the forecast period will be the need to incentivise new supply to make up this deficit. Based on our IRR calculations and our consideration of the typical cost of capital for greenfield mining projects of this type, we estimate that the average price for high carbon grades (96-97% C) will be USD2,000 based on the range of pricing in the chart on the left below.
0
200
400
600
800
1,000
1,200
1,400
1,600
1,800
2,000
2,200
2,400
2,600
2028 20342030 20402032 20382036
+100 mesh +80 mesh+50 mesh -100 mesh
High carbon (96-97% C) natural flake graphite price forecast, 2027-2040
USD per tonne, Real 2018, FOB China
BENCHMARK MINERAL INTELLIGENCE – NOUVEAU MONDE GRAPHITE – OCTOBER 2018 Page 33

3. Natural Flake Graphite Price Forecasts
0
200
400
600
800
1,000
1,200
1,400
1,600
1,800
2,000
2,200
2,400
2,600
2015 2016 2017 2018 2019 2020 2021 2022 2023 2024 2025 2026 2027 2028 2029 2030 2031 2032 2033 2034 2035 2036 2037 2038 2039 2040
+80 mesh+100 mesh
+50 mesh -100 mesh
High carbon (96-97% C) natural flake price history and forecast, 2015-2040
USD per tonne, Real 2018, FOB China
Forecast
BENCHMARK MINERAL INTELLIGENCE – NOUVEAU MONDE GRAPHITE – OCTOBER 2018 Page 34

3. Natural Flake Graphite Price Forecasts
• In order to arrive at a price forecasts for the Matawinie project on a delivered North America basis we add a location premium to the benchmark China Fob prices on the previous slides, as a well as adjustments for grades based on the expected output of the operation.
• The premium varies by grade, and there is some variance over time. For the purposes of this forecast we will use the following premiums by grade:
• We also provide a weighted average of the price forecast based on Matawinie’s planned product mix.
Natural flake graphite (96-97% C) flake size Location premium, USD per tonne
+150 mesh 100
+50 mesh 150
+80 mesh 120
-100 mesh 110
Natural flake graphite (96-97% C) flake size Product weighting
+150 mesh 27.7%
+50 mesh 14.8%
+80 mesh 33.4%
-100 mesh 24.1%
BENCHMARK MINERAL INTELLIGENCE – NOUVEAU MONDE GRAPHITE – OCTOBER 2018 Page 35

3. Natural Flake Graphite Price Forecasts
0
500
1,000
1,500
2,000
2,500
3,000
3,500
2022 2023 2024 2025 2026 2027 2028 2029 2030 2031 2032 2033 2034 2035 2036 2037 2038 2039 2040 2041 2042 2043 2044 2045 2046 2047
Matawinie basket
+80 mesh
+50 mesh
+150 mesh
-150 mesh
High carbon (96-97% C) natural flake price history and forecast, 2022-2047
USD per tonne, Real 2018, North America CFR
BENCHMARK MINERAL INTELLIGENCE – NOUVEAU MONDE GRAPHITE – OCTOBER 2018 Page 36

4. Premium Graphite Markets Outlook and Prices

4. Premium Graphite Markets Outlook and Prices
• Nouveau Monde is currently developing second transformation processes in order to serve higher value-added markets. In this section we will provide an overview and market size breakdown for the following processed, premium graphite products, including:
• Spherical uncoated and coated graphite for anodes
• Expandable graphite
• Purified micronized graphite
BENCHMARK MINERAL INTELLIGENCE – NOUVEAU MONDE GRAPHITE – OCTOBER 2018 Page 38

4. Premium Graphite Markets Outlook and Prices
• Spherical graphite is formed by processing flake graphite through consecutive milling steps. This is an energy-intensive process, with a yield of 30 to 50%. In the case of Natural Graphite, the shaping must be preceded by purification, most commonly through chemical leaching.
• The current price for uncoated spherical (anode precursor) material is in the region of USD3,500 per tonne, while coated spherical (anode) currently sells for USD9,000 per tonne.
• Spherical shapes usually measure between 10 to 40 micron and generally have a carbon content of 99.95% C or above. This process increases the surface area and conductivity making it ideal for use as the anode material for battery technologies.
• As such demand growth is linked to the development of the battery market. On the following slide we detail our expectations for both coated and uncoated demand over the forecast period
Coated and uncoated spherical graphite overview Coated spherical graphite
BENCHMARK MINERAL INTELLIGENCE – NOUVEAU MONDE GRAPHITE – OCTOBER 2018 Page 39

4. Premium Graphite Markets Outlook and Prices
3.5
0.0
1.5
0.5
1.0
2.0
2.5
3.0
4.0
4.5
5.0
5.5
6.0
2020
Million tonnes
2016 2018 2022 2024 2026 2028 20382030 2032 2034 2036 2040
+19%
Coated spherical graphite (anode) demand forecast, 2015-2040
1.0
3.5
0.5
0.0
1.5
2.0
2.5
3.0
4.0
20302024 20342016 2018 2020 2022
Million tonnes
2026 2028 2032 2036 2038 2040
+19%
Uncoated spherical graphite (anode precursor) demand forecast, 2015-2040
BENCHMARK MINERAL INTELLIGENCE – NOUVEAU MONDE GRAPHITE – OCTOBER 2018 Page 40

4. Premium Graphite Markets Outlook and Prices
• Purified micronized graphite is subjected to the same chemical leaching process to achieve the required grades as is crushed and ground to achieve a size of less than 30 microns, with a carbon content of 99.9% C.
• It is used as a feedstock for spherical material and is suitable for a range of applications including traditional alkaline batteries, polymers, lubricants, powder metallurgy. As such we expect that demand for purified micronized graphite will grow at a similar pace to total graphite demand over the life of the forecast, at a compound annual growth rate (CAGR) of 12%, with the majority of this growth being driven by battery demand growth.
• Prices for Purified micronized graphite are reported at USD3,000 per tonne
Purified micronized graphite overview
BENCHMARK MINERAL INTELLIGENCE – NOUVEAU MONDE GRAPHITE – OCTOBER 2018 Page 41

4. Premium Graphite Markets Outlook and Prices
0
50,000
100,000
150,000
200,000
250,000
300,000
350,000
400,000
450,000
500,000
550,000
600,000
20282024 20302016 2018 20382020 203220262022
Tonnes
2034 2036 2040
+12%
Purified micronized graphite demand forecast, 2015-2040
BENCHMARK MINERAL INTELLIGENCE – NOUVEAU MONDE GRAPHITE – OCTOBER 2018 Page 42

4. Premium Graphite Markets Outlook and Prices
• Expandable graphite is produced by a process in which an intercalant material is inserted in between the graphene layers of flake graphite. Typically the feedstock for expandable graphite is flake graphite with particle size distribution of +80 mesh.
• A number of chemical compounds can be used to intercalate graphite materials. The most common process is the insertion of sulphate compounds to create ‘graphite bi-sulphate’
• This material is manufactured by treating highly crystalline natural flake graphite with a mixture of sulphuric acid and other oxidizing agents which aid the sulphate intercalation. The final carbon content of this material is very high at up to 99.9% C
• The resultant product is a highly intumescent form of graphite that useful in applications that include fire retardants, high performance gaskets, conductive fillers, electromagnetic pulse and radiation shielding, foundry products.
• Benchmark estimates that the market for expandable graphite at present stands at roughly 60,000 tonnes per annum, the bulk of which is for use in fire retardants.
• he markets for expanded graphite, in particular for fire retardants, are forecast to exceed industrial and GDP growth in the coming years as fire safety regulations are expected to become more stringent in all major economies. We anticipate a 6% CAGR for expandable graphite demand over the life of the forecast.
• At present the market price for expanded graphite is in the region of USD2,700-USD3,200 per tonne depending on the purity of material
Flak
e G
rap
hit
e
(un
exp
and
ed)
Exp
and
ed G
rap
hit
eBENCHMARK MINERAL INTELLIGENCE – NOUVEAU MONDE GRAPHITE – OCTOBER 2018 Page 43

4. Premium Graphite Markets Outlook and Prices
0
50,000
100,000
150,000
200,000
202220202016 2018 20382024 203020282026 2032 2034 2036 2040
Tonnes
+6%
Expandable graphite demand forecast, 2015-2040
BENCHMARK MINERAL INTELLIGENCE – NOUVEAU MONDE GRAPHITE – OCTOBER 2018 Page 44

BENCHMARK MINERAL INTELLIGENCE – NOUVEAU MONDE GRAPHITE – OCTOBER 2018 Page 45