Embed Size (px)
Citation preview

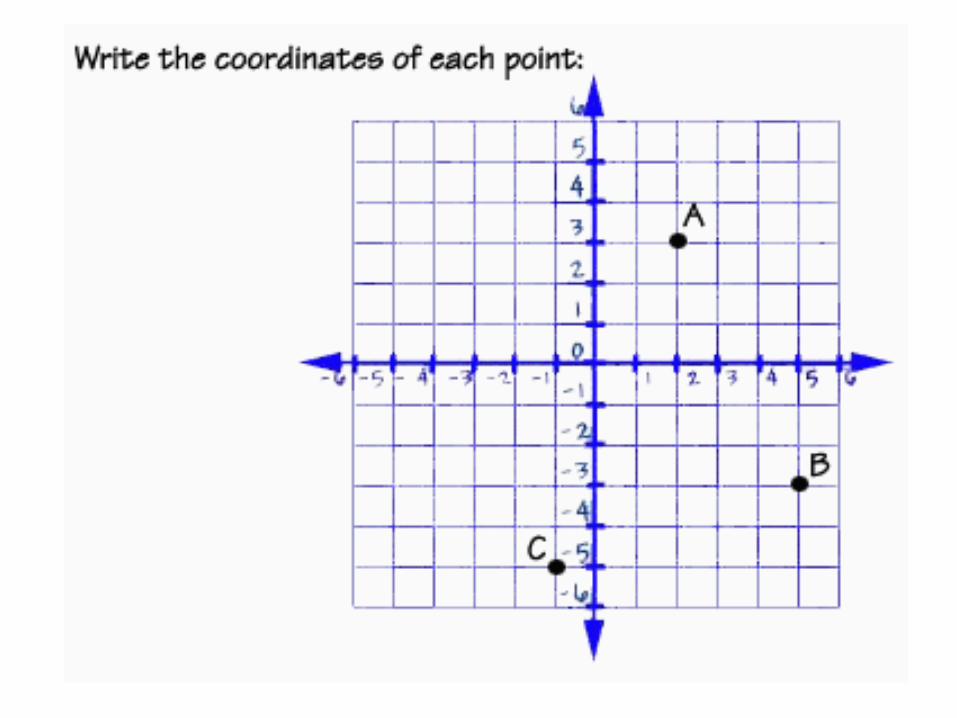
Graphing

The graph paper we traditionally use to graph is officially called Cartesian coordinates (named after French mathematician Rene Descartes).
In Cartesian coordinates, two lines divide an area into four separate regions.

The lines are called the x-axis and the y-axis

The regions are called quadrants (I, II, III, and IV)

The point where the lines intersect is called the
origin.

We write points as two numbers in parentheses:
(5,3) (2,-4)
(-7,0)

The first number is called the x-coordinate and tells
how far to go across from the origin to find the point.
The second number iscalled the y-coordinateand tells how far to go up or down from the origin to find the point.
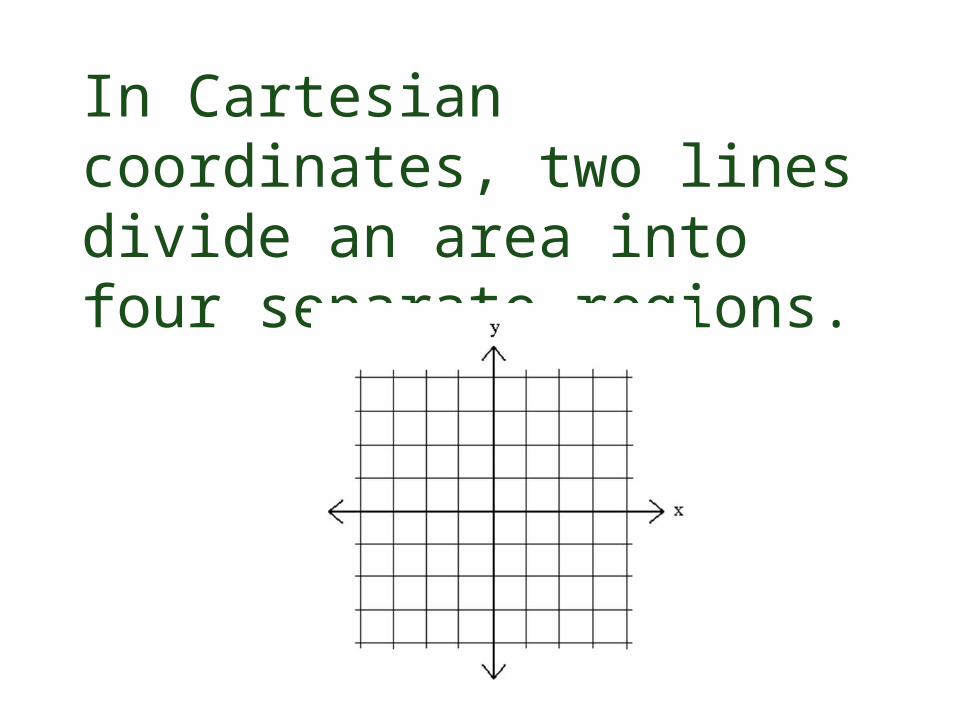
For instance …To graph (4, 5) go across (to the right) 4 and up 5.

To graph (-3,2) go left 3 and up 2
To graph (4,-3) go right 4 and down 3.
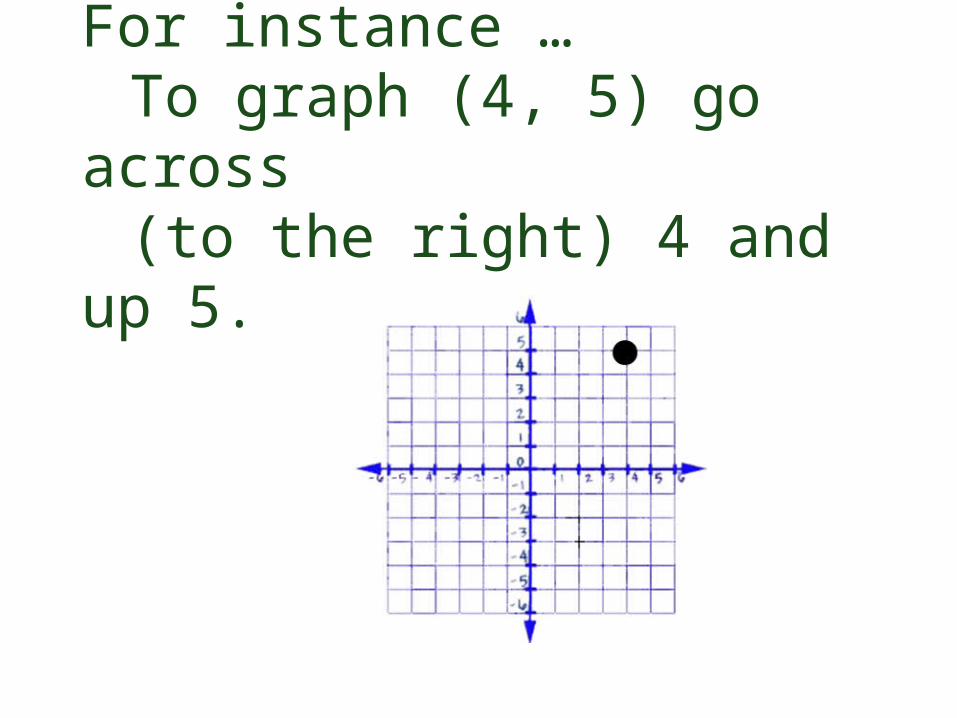
Other examples:


You can graph equations by putting in values for x and plotting the corresponding y values.
You can then connect the points to see the complete graph.

EXAMPLE: Graph y = x2

EXAMPLE: Graph y = x2