Embed Size (px)
Citation preview

Graphics in C
Rab Nawaz Jadoon
Assistant Professor
Department of Computer Science
COMSATS IIT Abbottabad

Introduction To start with graphics programming, Turbo C is a good choice. Even though DOS
has its own limitations, it is having a large number of useful functions and is easy
to program. To implement graphics algorithms, to give graphical display of
statistics, To view signals from any source, we can use C graphics. Here is a article
to start programming with Turbo C. 'Run and Learn' is our method. We have used
source codes throughout the explanations. Just execute them to understand what
is happening.
You should have!!! 1. Graphics.h Header File
2. Graphics.lib library file
3. Graphics driver (BGI file)
4. At least 640×480 VGA monitor
5. Header File : graphics.h
6. All Graphical Functions are Included in Graphics.h
7. After Including graphics.h Header File [ You can get access graphical
functions ]
8. You must Know Following Things before Learning Turbo Graphics
9. InitGraph : Initializes the graphics system.
10. In C Program execution starts with main() similarly Graphics Environment
Starts with this function.
11. initgraph() initializes the graphics system by loading a graphics driver from
disk then putting the system into graphics mode
12. As this is Our first topic Under Graphics so it is better not to go in details of
Parameters.
1. A Simple Program #include<graphics.h>
#include<conio.h>
void main()
{
int gd = DETECT, gm;

initgraph(&gd, &gm, "c:\\tc\\bgi");
///Your Code goes Here
getch();
closegraph();
}
Output of this simple program
1. Firstly let me tell you what the output of this program is.
2. This program initializes graphics mode and then closes it after a key is
pressed.
3. To begin with we have declared two variables of int type gd and gm for
graphics driver and graphics mode respectively.
4. DETECT is a macro defined in "graphics.h" header file.
5. Then we have passed three arguments to initgraph function 1st is the
address of gd, 2nd is the address of gm and 3rd is the path where your BGI
files are present ( you have to adjust this accordingly where you turbo
compiler is installed).
6. getch helps us to wait until a key is pressed, closegraph function closes the
graphics mode and finally return statement returns a value 0 to main
indicating successful execution of your program
7. After you have understood initgraph function then you can use functions to
draw shapes such as circle, line , rectangle etc, then you can learn how to
change colors and fonts using suitable functions, then you can go for
functions such as getimage, putimage etc for doing animation.

2. Program---Printing Text in Graphics Using
Outtextxy Function
#include<graphics.h>
#include<stdio.h>
int main(void)
{
int gdriver = DETECT, gmode;
initgraph(&gdriver, &gmode, "c:\\tc\\bgi");
int x = 200, y = 200;
outtextxy(x, y, "Hello World");
closegraph();
}
Explanation
outtextxy(x,y,"Hello World");
This Function is Similar to Printf Statement.
Printf Prints Text on Screen in “Text Mode” while outtextxy() function Prints Text
onto Screen in “Graphics Mode“.
This Function Accepts 3 Parameters.
Syntax:
outtextxy(x,y,"Hello World");

3. Program --- How to Draw a Cricle
#include<graphics.h>
#include<conio.h>
void main()
{
int gd=DETECT, gm;
initgraph(&gd, &gm, "c:\\turboc3\\bgi " );
circle(200,100,150);
getch();
closegraph();
}
More detail on Syntax
1. InitGraph: Initializes the graphics system.
2. Declaration: void far initgraph(int far *graphdriver, int far *graphmode,
char far *pathtodriver);
3. Remarks: To start the graphics system, you must first call initgraph.
4. initgraph initializes the graphics system by loading a graphics driver from
disk (or validating a registered driver) then putting the system into graphics
mode.
5. initgraph also resets all graphics settings (color, palette, current position,
viewport, etc.) to their defaults, then resets graphresult to 0.

4. Program --- Draw a Rectangle
#include<stdio.h>
#include<conio.h>
#include<graphics.h>
void main()
{
int gd = DETECT, gm;
initgraph(&gd, &gm, "c:\\tc\\bgi");
line(300, 100, 200, 200); // (from_x,from_y,
to_x,to_y)
line(300, 100, 400, 200);
line(200, 200, 400, 200);
getch();
closegraph();
}
5. Program --- Setting Styles and More!!!
/*Here a sample program to illustrate how to use BARS
which are used for visual statistics */
#include<graphics.h>
main() {
int gd=DETECT,gm,maxx,maxy,x,y,button;
initgraph(&gd,&gm,"");

line(80,150,200,150);
line(80,150,80,50);
settextstyle(1,HORIZ_DIR,1);
outtextxy(100,153,"<-X axis");
settextstyle(1,VERT_DIR,1);
outtextxy(60,50,"<-Y axis");
bar(100,100,120,150);
bar(130,120,150,150);
getch();
closegraph();
}
6. Program --- Draw Op-amp Using Graphics Function
#include<stdio.h>
#include<conio.h>
#include<graphics.h>
void main() {
int gd = DETECT, gm;
initgraph(&gd, &gm, "c:\\tc\\bgi");
line(50, 125, 100, 125); //Horizontal Line -VE
Terminal
line(50, 175, 100, 175); //Horizontal Line +VE
Terminal

line(100, 100, 100, 200); //Vertical Line
line(100, 100, 150, 150); //Top to Bottom Slant Line
line(150, 150, 100, 200); //Bottom to Top slant Line
line(125, 100, 125, 125); //Vertical Line +VCC
line(125, 175, 125, 200); //Vertical Line -VCC
line(150, 150, 200, 150); //Horizontal line
getch();
closegraph();
}
Important Functions
Clearing the graphics window…
cleardevice();
Delay the program, so that users can see what is happening…sending in the
number of msec
delay(milliseconds);
Wait for a keyboard hit:
getch();or,kbhit();
Important functions (Drawing lines)
1. Set Drawing Color (for lines and edges)
2. (colors typically range from 0-15; 0 is usually black and 15 is white)
3. setcolor(color);
4. Set Background Color (usually for text)

5. setbkcolor(color);
6. Set Fill Style and Color (for interiors)
7. Pattern 0-12, 0 = empty, 1 = solid
8. setfillstyle(pattern, color)
9. Set Line Style and Thickness
10. Style: 0 = solid, 1 = dotted, 3 = dashed
11. Thickness is the width in terms of pixels
12. setlinestyle(style, pattern, thickness)
Important Functions( Drawing…Areas )
1. Drawing absolute (from one coordinate to another)
2. linerel(from_x, from_y,
3. Drawing a Circle
4. lGiven center and radius as whole numbers
5. circle (center_x, center_y, radius);
6. lDrawing a filled Rectangle
7. (given upper left and lower right corners)
8. bar(ul_x, ul_y, lr_x,lr_y);
9. lDrawing an unfilled Rectangle
10. (given upper left and lower right corners)
11. rectangle(ul_x, ul_y, lr_x, lr_y); to_x, to_y);

Important Functions( How Text Look )
1. Text Formatting
2. Set the justification
3. Horizontal: (0 = left, 1 = center, 2= right)
4. Vertical: (0 = bottom, 1 = center, 2 = top)
5. settextjustify(horizontal, vertical)
6. Set the text style
7. Font: (0-11)
8. Direction: 0 = left to right direction
9. Character Size: 0 = normal, 6 is really big!
10. settextstyle(font,direction, character size)
BLACK: 0
BLUE: 1
GREEN: 2
CYAN: 3
RED: 4
MAGENTA: 5
BROWN: 6
LIGHTGRAY: 7
DARKGRAY: 8
LIGHTBLUE: 9
LIGHTGREEN: 10
LIGHTCYAN: 11
LIGHTRED: 12
LIGHTMAGENTA: 13
YELLOW: 14
WHITE: 15

Important Functions( Messages )
1. Text Output
2. Set Text color (index ranges 0-15)
3. setcolor(index);
4. Output a message on the graphics window at the current position
5. outtext(“messages on graphics window”);
6. Output a message on the graphics window at the given x,y coordinate
7. outtextxy(x,y,”message”);
Important Functions( Mouse Input )
1. Has there been a mouse click?
2. Right Click is 513
3. Left Click is 516Middle Click is 519 (the wheel…)
4. answer = ismouseclick(kind)
5. Clear the mouse click
6. (if you don’t do this you can’t get the next mouse click!)
7. clearmouseclick(kind);
8. What was the coordinate when the mouse click happens…
9. x = mousex(); y = mousey();
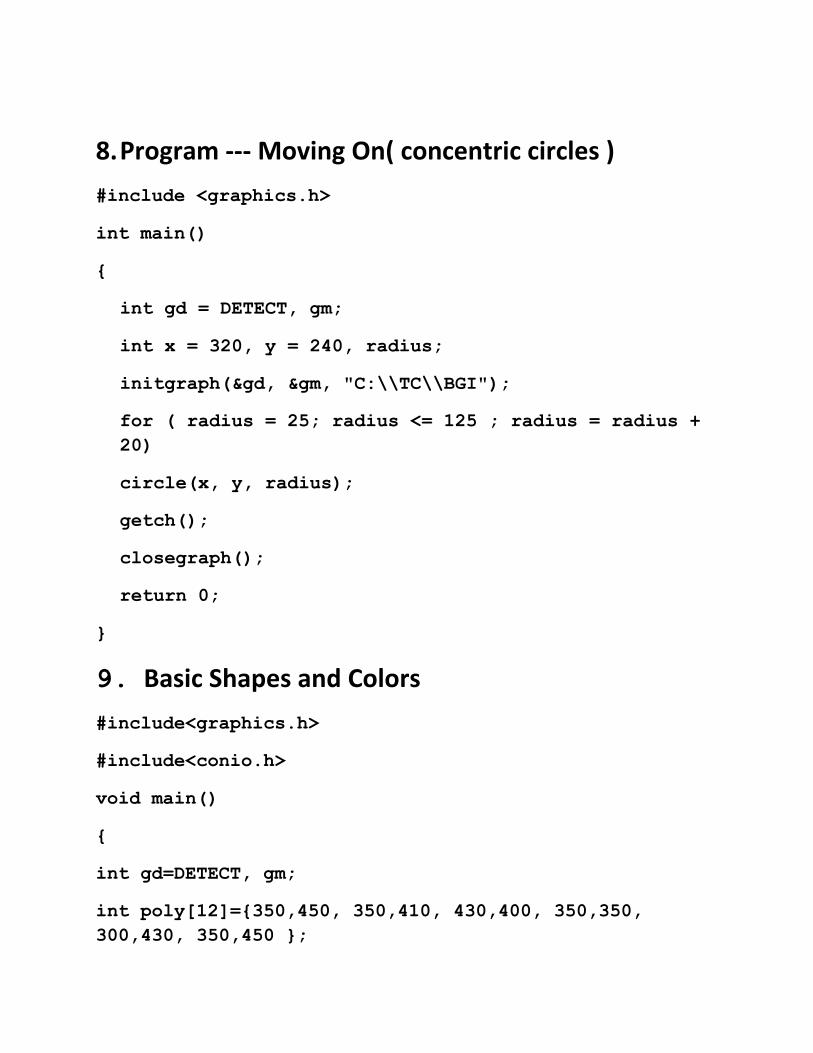
8. Program --- Moving On( concentric circles )
#include <graphics.h>
int main()
{
int gd = DETECT, gm;
int x = 320, y = 240, radius;
initgraph(&gd, &gm, "C:\\TC\\BGI");
for ( radius = 25; radius <= 125 ; radius = radius +
20)
circle(x, y, radius);
getch();
closegraph();
return 0;
}
9. Basic Shapes and Colors
#include<graphics.h>
#include<conio.h>
void main()
{
int gd=DETECT, gm;
int poly[12]={350,450, 350,410, 430,400, 350,350,
300,430, 350,450 };

initgraph(&gd, &gm, "");
circle(100,100,50);
outtextxy(75,170, "Circle");
rectangle(200,50,350,150);
outtextxy(240, 170, "Rectangle");
ellipse(500, 100,0,360, 100,50);
outtextxy(480, 170, "Ellipse");
line(100,250,540,250);
outtextxy(300,260,"Line");
sector(150, 400, 30, 300, 100,50);
outtextxy(120, 460, "Sector");
drawpoly(6, poly);
outtextxy(340, 460, "Polygon");
getch();
closegraph();
}
Output!!!

10. Program --- Moving Car
#include <graphics.h>
#include <dos.h>
int main()
{
int i, j = 0, gd = DETECT, gm;
initgraph(&gd,&gm,"C:\\TC\\BGI");
settextstyle(DEFAULT_FONT,HORIZ_DIR,2);
outtextxy(25,240,"Press any key to view the moving
car");
getch();
for( i = 0 ; i <= 420 ; i = i + 10, j++ )
{
rectangle(50+i,275,150+i,400);

rectangle(150+i,350,200+i,400);
circle(75+i,410,10);
circle(175+i,410,10);
setcolor(j);
delay(100);
if( i == 420 )
break;
if ( j == 15 )
j = 2;
cleardevice(); // clear screen
}
getch();
closegraph();
return 0;
}
11. Some Graphics Effects Using Random Numbers
#include "graphics.h"
#include "conio.h"
#include "stdlib.h"
void main()
{
int gd,gm;

gd=DETECT;
initgraph(&gd, &gm, "");
setcolor(3);
setfillstyle(SOLID_FILL,RED);
bar(50, 50, 590, 430);
setfillstyle(1, 14);
bar(100, 100, 540, 380);
while(!kbhit())
{
putpixel(random(439)+101,
random(279)+101,random(16));
setcolor(random(16));
circle(320,240,random(100));
}
getch();
closegraph();
}
***End***