Embed Size (px)
Citation preview

Proceedings of the Electroacoustic Music Studies Network Conference Electroacoustic Music Beyond Performance, Berlin, June 2014
www.ems-network.org
1
Landon Morrison Graphical Music Representations: A Comparative Study Based on the Aural Analysis of Philippe Leroux’s M.É.
Graphical Music Representations: A Comparative Study Based on the Aural Analysis of Philippe Leroux’s M.É.
Landon Morrison
McGill University / CIRMMT [email protected]
Abstract
Acousmatic music poses a perplexing problem for the analyst – not only does it lack a notated score, it also utilizes a seemingly infinite sound palette made possible through the use of modern technology. Consequently, analysts must employ new tools capable of tackling musical issues that resist traditional theoretical approaches. Toward this end, my paper assesses recent developments in the field of electroacoustic music analysis by examining two software packages – Acousmographe and EAnalysis – both of which aim to offer powerful multimedia toolkits, such as visual sonograms and the ability to create graphical music representations. In order to facilitate a side-by-side comparison, I present excerpts from my aural analysis of Philippe Leroux’s acousmatic work, M.É., using both software applications. Based on the results of this case study, I address the analytical implications of each program by bringing the two platforms into dialogue with one another and offering an analyst’s appraisal of their various strengths and weaknesses.
Introduction
A hybrid legacy is embedded within the historical genesis and evolution of acousmatic music. On the one hand, acousmatic sound is rooted in technologies that rendered the use of prescriptive scores obsolete, and thus reconfigured conceptions about music to favor the listener’s experience of aural phenomena. At the same time, however, many of the field’s pioneering composers inherited their aesthetic ideals from the score-centered conventions of the Western musical canon. This connection is confirmed by the fact that many acousmatic compositions exhibit characteristics associated with the large-scale musical ‘work-concept’. In such pieces, the music can be understood to form a cohesive totality that is articulated by the logical internal organization of its constituent parts, yielding a proliferation of interrelationships that play out on multiple structural levels. If this high degree of complexity is to be fully grasped, then it is absolutely necessary to consider the music “out of time” with the aide of a score. For without a visual representation of the music our ability to retain musical memory becomes a limiting factor, communication breaks down, and any attempts at analytical inquiry are significantly complicated. In light of this situation, the analysis of acousmatic music can greatly benefit from the creation of a
Proceedings of the Electroacoustic Music Studies Network Conference Electroacoustic Music Beyond Performance, Berlin, June 2014
www.ems-network.org
2
Landon Morrison Graphical Music Representations: A Comparative Study Based on the Aural Analysis of Philippe Leroux’s M.É.
descriptive listening score – that is, a transcription prepared by the listener based on their perception of the music.
Descriptive listening scores function as an indispensable aide to memory, providing listeners with a tangible object that facilitates discourse and opens the door to a fuller understanding of musical structure. Based on this assumption, my paper aims to demonstrate some of the analytical tools available to listeners wishing to study acousmatic music. Specifically, I will examine the latest versions of two graphic representation software platforms: 1) EAnalysis©, which was produced by Pierre Couprie, Simon Emmerson, and Leigh Landy at De Montfort University in the UK, and 2) Acousmographe©, a software project spearheaded by Yann Geslin at the INA-GRM in Paris1. My analysis also incorporates Acousmographe’s ‘aural sonology’ graphics plug-in created by Lasse Thoresen and Andreas Hedman. As I hope to show, these two programs offer different solutions for creating musical transcriptions based on the results of aural analysis. For the sake of offering an accurate comparison of the two programs, I’ve conducted dual analyses of Philippe Leroux’s work, M.É (1998), using both software applications. The piece is worthy of an extended analysis in its own right, but that is not the focus of this paper. Rather, the emphasis here is on the software tools themselves. I will begin by discussing some of the theoretical underpinnings of each program, and then shift towards a presentation of several musical excerpts in an effort to show how those theoretical assumptions shape one’s analytical agenda. As with any technological format, Acousmographe and EAnalysis both offer certain affordances, as well as embedded biases that co-opt the psychological framework under which the analysis is conducted. With this in mind, one must ask: What types of analytical questions are encouraged and prioritized by the software design? Conversely, what aspects of the music are not addressed? What is the underlying aesthetic ideology of the institution responsible for the software’s development? Is the software a fixed program, or is it customizable in a way that allows for users to introduce add-on extensions, thereby expanding its potential scope via the decentralized contributions of the broader music research community? These questions reflect the often-ambiguous relationship between individual artistic endeavors and the cultural contexts within which these endeavors are situated. By no means is the trajectory of the arts insulated from the effects of institutional and corporate power structures, and the rise of proprietary music software tools raises many questions about the impact of software design on issues of analytical/compositional process and product. Any attempt to answer all of these questions quickly leads one through a series of interdisciplinary landscapes, including the domains of music theory, musicology, composition, audio technology, sound culture studies, anthropology, and philosophy. Needless to say, such a sprawling inquiry is far beyond the limits of the present paper. But I have raised the issues here merely to give an idea of the subterranean dynamics that lie at the heart of this topic. My intentions for the
1 At the time of this study, the latest version of EAnalysis (1.0.4) can be downloaded online at http://logiciels.pierrecouprie.fr/?page_id=402 (last accessed 09/14), and Acousmographe (version 3.7.2) can be downloaded at www.inagrm.com/accueil/outils/acousmographe (last accessed 09/14).

Proceedings of the Electroacoustic Music Studies Network Conference Electroacoustic Music Beyond Performance, Berlin, June 2014
www.ems-network.org
3
Landon Morrison Graphical Music Representations: A Comparative Study Based on the Aural Analysis of Philippe Leroux’s M.É.
current project are much more modest and will only scratch the surface of this larger debate. In what follows, my primary goal is to offer a useful comparison of the EAnalysis and Acousmographe software platforms by pointing out some of their abstract theoretical assumptions and offering a pragmatic assessment of their various applications to analytical practice.
Overview of Software Design
To begin, let’s take a look at some of the similarities between EAnalysis and Acousmographe: 1) both provide visual sonograms of the music, 2) both provide annotative tool kits featuring different analytical approaches, and 3) both incorporate elements from two complementary theories that frame nearly every facet of discourse related to acousmatic music over the past fifty years – Pierre Schaeffer’s typologie and Denis Smalley’s spectromorphology. As is already well known, Schaeffer’s Tableau de Récapitulatif de la typologie (TARTYP) presents a system for classifying sounds according to their underlying parametric characteristics, such as durée and masse2. Building on Schaeffer’s classification framework, Denis Smalley introduced his spectromorphological model to explain the behavior of sounds over the course of time. In Smalley’s view, the three linked phases of a sound’s amplitude envelope – onset, continuant, and termination – can be abstracted as the basis for a new theory of temporally defined structural functions3. Together, Schaeffer and Smalley’s complimentary approaches lay the groundwork for a deeper understanding of musical structure and they provide a theoretical jumping point for both software programs.
Acousmographe
The influence of Schaeffer and Smalley is perhaps most readily apparent in the spectromorphology library contained in Acousmographe’s ‘aural sonology’ plug-in. This annotative toolkit offers the analyst a system of coded symbols for depicting a wide range of elements derived from Lasse Thoresen’s reconfiguration of the TARTYP. Thoresen’s revised table maintains Schaeffer’s basic orientation – the horizontal axis shows different types of energy articulation, such as sustained, impulse, or iterated, whereas the vertical axis charts variability within the sound spectrum as either pitched, complex, or dystonic4. The main thrust behind Thoresen’s vision of an expanded TARTYP is that each of the typological categories has been assigned a unique graphic symbol. In this sense, the software’s characterization of this library as a set of spectromorphological symbols is a bit
2 Pierre Schaeffer, Traité des objets musicaux, Paris, Éditions du Seuil, 1966, p. 459. 3 Denis Smalley, “Spectromorphology: Explaining Sound Shapes”, Organised Sound, 2(2), 1997, pp. 107-126. 4 Lasse Thoresen, “Spectromorphological Analysis of Sound Objects. An adaptation of Pierre Schaeffer’s Typomorphology”, in Proceedings of the Electroacoustic Music Studies Network Conference (EMS06): Terminology and Translation, Beijing (China), 2006, www.ems-network.org/spip.php?article250& var_mode=calcul (last accessed 09/14).
Proceedings of the Electroacoustic Music Studies Network Conference Electroacoustic Music Beyond Performance, Berlin, June 2014
www.ems-network.org
4
Landon Morrison Graphical Music Representations: A Comparative Study Based on the Aural Analysis of Philippe Leroux’s M.É.
of a misnomer since the library is clearly based on Schaeffer’s TARTYP classifications, not Smalley’s spectromorphological functions.
As one can imagine, it takes a lot of symbols to sketch a relative outline of the infinite durée-masse sound continuum. This task of memorizing Thoresen’s prescribed symbology can prove to be a headache for the analyst, as well as a barrier to entry for the uninitiated reader. To borrow terms from Charles Peirce, these signs correlate to symbolic properties that must be correctly interpreted in order to link them to their associated sound objects5. In other words, there is not typically a direct correspondence to be found between these symbols and the sounds they represent. Having said that, however, there are instances of iconic connections between the two sides of Thoresen’s semiotic equation. For example, with regard to energy articulation and spectrum, a solid line indicates a sustained sound, a dashed line means iterative, and an impulse is represented by a single dot (pitched), diamond (dystonic), or square (complex). In this case, the graphic representation of energy articulation is iconic because the lines mimic the behavior of their respective sounds. The signs used for depicting a sound’s spectrum (dot-diamond-square), on the other hand, have no direct visual association with their signified sound objects, and this disconnected quality holds true for most of the other annotative symbols in the toolkit. In light of the abstract linkage between sign and sound in Thoresen’s system, it is safe to say that the method will meet resistance from those outside of a specialized academic setting. Although the widespread adoption of an abstract coding system is certainly feasible (after all, it’s no different than deciphering notes on a staff), it remains to be seen whether or not Thoresen’s symbols will gain enough traction within the scholarly community to be of any widely translatable value to the ongoing collective discourse. For those committed to acquiring fluency with Thoresen’s coded symbology, the pay off is quite beneficial. The precise nature of the system allows for a remarkable degree of consistency in the process of transcription. Because the relative meanings of the signs are fixed, it is possible to compare multiple analytical interpretations of the same work. Moreover, the stability of the sign system sets the conditions for a more detailed transcription process, and it helps to facilitate a more direct discourse by eliminating excess graphic ambiguities. When the analyst approaches the transcription of a new work using Acousmographe, the sign system demands that he/she ask certain questions in the process of assigning a symbol to each new sound. For instance, in the case of a church bell, one might note that the repetitive ringing exhibits an iterative articulation (dashed line) and that its inharmonic pitch content could be classified as dystonic (diamond). This type of categorizing requires a shift away from what Schaeffer would call indexical listening, and towards reduced listening – that is, a bracketed form of listening that intentionally disregards a sound’s source in favor of concentrating on its underlying acoustical properties and musical potentialities.
Of course, representing sounds in such an abstract way has its on problems. For instance, one loses all information about the source of the sound and what role it plays in a given 5 Charles Sanders Peirce, Collected Papers, Cambridge (MA, USA), Belknap Press of Harvard University Press, vol. 2, paragraph 56, 1960-1966.

Proceedings of the Electroacoustic Music Studies Network Conference Electroacoustic Music Beyond Performance, Berlin, June 2014
www.ems-network.org
5
Landon Morrison Graphical Music Representations: A Comparative Study Based on the Aural Analysis of Philippe Leroux’s M.É.
musical or semantic context. Instead, the listener is drawn towards relationships formed between the underlying timbral characteristics of the sounds. In essence, the sound of a rake being scraped over rocks would be symbolically notated in the same way as the sound of rain on a tin roof. Both are iterative sound types with complex (aka noisy) spectrums, and therefore would be notated with a square connected to an extending dashed line. In an attempt to restore some of this lost source information, my own Acousmographe analysis employs a color-coding system to distinguish each of the various sound types. Beyond symbology, Thoresen introduces a number of other libraries containing analytical sub-genres within the aural sonology program. These include the following: 1) time fields, which highlight the grouping structure of a work, 2) layers, a way of describing the relative positioning of musical lines within a certain field of depth, 3) dynamic form, a tripartite metric for tracking the flow of musical "energy" in a work, and 4) form-building transformations, a framework used for positioning motivic gestalts and textures on a relative scale between “very simple” and “very complex”. For my analysis of M.É., I’ve employed symbols from the spectromorphology library to transcribe local-level events on the music’s surface. Afterward, I used the time-field and dynamic form libraries to illustrate the work’s higher-level segmentation and the overall shape of the work’s inter-related musical processes. These three approaches combined to create a multi-faceted interpretation of the work’s structure, although the implementation of these approaches was not without difficulties. Generally, there seems to be a lack of clearly defined criterion underlying Thoresen’s analytical categories. This situation is especially acute with regard to the libraries for layers and form-building transformations, in which the unmoored relativity of the suggested labels provides no clear guidance on what these assertions mean for the listener. For instance, on what basis should a section of music be characterized as “simple” or “complex”? These terms are entirely subjective, and it is not at all clear what element of the music is being considered in an analytical assessment of this sort. Is it rhythm? Melody? Harmony? Timbre? Or some vague assemblage of these different parameters? A refinement of Thoresen’s theoretical terminology is needed to clarify its use in analytical applications; otherwise, his attempt at creating a precise and coherent system of spectromorphological symbols risks being lost in a sea of relative ambiguity.
EAnalysis
Unlike Acousmographe, the EAnalysis software is designed as an inter-textual hub of analytical methodologies derived from a number of sources. Reviewing these approaches in detail would take considerable time, so I will only briefly provide an overview of each library along with suggestions for further reading. In the following example, I’ve listed a description of each library along with an acknowledgement of its credited developers (excepting the libraries for Schaeffer and Smalley, whom I have already mentioned).
• Figures d’espace – Annette Vande Gorne (graphics – Couprie) The library for Annette Vande Gorne’s Figures d’espace offers the analyst a notation

Proceedings of the Electroacoustic Music Studies Network Conference Electroacoustic Music Beyond Performance, Berlin, June 2014
www.ems-network.org
6
Landon Morrison Graphical Music Representations: A Comparative Study Based on the Aural Analysis of Philippe Leroux’s M.É.
device for representing the spatialized motion of acousmatic sound6. Vande Gorne’s method also assigns structural functions to each type of spatialization. This library seems well suited for transcribing “live” performances of spatially diffused works; however, it is
less useful for stereo recordings, and non-applicable for listening situations without multiple speakers.
• Functions – Stephane Roy The Functions library is derived from Stephane Roy’s theories as presented in his book,
L’analyse des musiques électroacoustiques: modèles et propositions7. Based on a mixture of gestalt principles and elements from Leonard Meyer’s “implication-realization” model
for tonal music, Roy offers the analyst a framework for constructing interpretations of musical syntax in acousmatic music based on the interpretation of listener expectations.
• Images-des-sons – François Bayle (graphics – Couprie) The library inspired by Francois Bayle’s images-des-sons, also known as I-son, contains several pictorial representations for denoting external sound sources such as l’air, l’eau,
and l’oiseau qui parle. Originally outlined in his 1989 article, “Image-of-sound, or i-sound: Metaphor/metaform”8, Bayle’s theory establishes a “trichotomy of the audible” (hearing, listening, understanding) in order to propose a “functional-flowchart [...] between hearing
sound and comprehending its meaning”9. In EAnalysis, Bayle’s theory is reduced to a set of iconic pictures that can be used for referencing concrete sound sources.
• Language Grid – Simon Emmerson Simon Emmerson developed The Language Grid concept in his 1986 book, The Language
of Electroacoustic Music. In a nutshell, it charts the interaction of musical syntax and discourse according to a 9-square grid, which ranges from abstracted syntax/mimetic
discourse at one end of the spectrum to abstract syntax/aural discourse at the other end, with all points in between10.
• Temporal Semiotic Units (TSU) – MIM Research Centre (graphics – Couprie) Temporal Semiotic Units were developed at the MIM Research Centre in Marseilles,
France, and presented in a jointly authored book, Les unités sémiotiques temporelles11. It
6 Annette Vande Gorne, “L’interprétation spatiale. Essai de formalisation méthodologique”, Revue DEMeter, Université Lille 3, 2002, http://demeter.revue.univ-lille3.fr/interpretation/vandegorne.pdf (last accessed 09/14). 7 Stéphane Roy, L’analyse des musiques électroacoustiques : modèles et propositions, Paris, L’Harmattan, 2003, p. 342; see also: “Form and Referential Citation in a Work by Francis Dhomont”, Organised Sound, 1(1), 1996, pp. 29-41. 8 François Bayle, “Image-of-sound, or i-sound: Metaphor/metaform”, Contemporary Music Review, 4, 1989, pp. 165-170. 9 Ibid., 165. 10 Simon Emmerson, “The Relation of Language to Materials”, in The Language of Electroacoustic Music, Simon Emmerson (ed.), London, Macmillan, 1986, pp. 17-39. 11 Francois Delalande et al., Les Unités Sémiotiques Temporelles, Laboratoire Musique et Informatique de Marseille (MIM), Documents Musurgia, Paris, Édition Eska, 1996; see also Aline Frey et al., “Temporal Semiotic Units as Minimal Meaningful Units in Music? An Electrophysiological Approach”, Music Perception: An Interdisciplinary Journal, 26(3), 2009, pp. 247-256.
Proceedings of the Electroacoustic Music Studies Network Conference Electroacoustic Music Beyond Performance, Berlin, June 2014
www.ems-network.org
7
Landon Morrison Graphical Music Representations: A Comparative Study Based on the Aural Analysis of Philippe Leroux’s M.É.
creates a catalogue mapping semiotic tropes onto a set of nineteen common morphological schemes, including floating, obsession, chaotic, heaviness, and propulsion.
• Sound Objects – Pierre Schaeffer (graphics – Couprie, translation – Dack) • Spectromorphology – Denis Smalley (graphics – Couprie)
Exemple 1: EAnalysis Libraries
Each of these libraries allows the listener to hear the music through a different lens, encouraging a multimodal approach to analysis. This patchwork design renders a more diverse software interface and offers the analyst a variety of conceptual frameworks. In addition, EAnalysis offers several different “views”, including: 1) image view for importing pictures, 2) movie view for importing movies, 3) chart view for drawing interactive comparisons between selected musical segments, 4) structure view for diagramming musical segmentation, and 5) data view for illustrating a list of numerical values. Of these, the following analysis only employs the chart view and structure view, which I found especially useful for representing larger levels of musical structure. I also used a variety of transformable shapes available in the software’s graphic events folder for transcribing local-level details. EAnalysis generally allows for greater flexibility working with graphic designs, encouraging the analyst to make free artistic associations between sound types and shapes. Not only does the software contain many pre-set shapes, it also allows the user to import and save custom designs from external programs, such as Adobe Illustrator.
Considered from a Peircian angle, this pictorial approach to sound transcription falls most squarely into the category of iconic representations, a semiotic device similar to a visual onomatopoeia, in which the sound of water would quite literally be represented with a blue water-like shape (i.e., Bayle’s l’eau sound type). Of course, there are other options, and many of the libraries I’ve mentioned contain an array of coded symbols. But judging from the numerous examples posted on Couprie’s EAnalysis website, there seems to be a marked preference for using pictorial renderings of local-level musical details. This approach stands in contrast to the more prevalent use of coded symbology found in Acousmographe, and it has the benefit of making the transcription more immediately comprehensible to non-specialist listeners. There is no complex system of symbols that must be learned in order to understand the descriptive score, and thus EAnalysis seems ideally suited for broad pedagogical applications. Unfortunately, this approach also strips away important information about a sound’s internal attributes, and it changes the types of questions that the analyst must ask during the process of transcription. Instead of adopting a reduced listening perspective, the analyst is encouraged to identify a sound’s source and then create an iconic rendering based on this causal connection. There is no standardized mapping of graphic shapes onto sounds, and so every transcription becomes a self-referential artifact highlighting a particular analyst’s creative inclinations. While this offers the analyst considerable leeway in defining their own lexicon, it also hinders analytical discourse due to a general lack of consistency in the annotations used to represent sounds. In the paragraphs that follow, I will spend some time unpacking this important distinction via an examination of several musical examples showing possible modes of presentation that are available in each software program.

Proceedings of the Electroacoustic Music Studies Network Conference Electroacoustic Music Beyond Performance, Berlin, June 2014
www.ems-network.org
8
Landon Morrison Graphical Music Representations: A Comparative Study Based on the Aural Analysis of Philippe Leroux’s M.É.
Comparative Analysis of Leroux’s M.É.
Having already outlined some basic points of comparison between the two software environments, the rest of the paper will be devoted to presenting excerpts from my analysis of Philippe Leroux’s acousmatic piece, M.É. The work is worthy of a more detailed analysis, but since the focus of this study is software tools – and NOT the analysis itself – my interpretation of the work’s structure will be considerably abridged. It should also be stated that the following analysis does not attempt to provide a complete or definitive view of the work, nor does it exhaust the analytical angles made possible using these two software programs. It is only a sampling of potential approaches that I have chosen in order to highlight certain aspects of the music and to show some of the options available through the use of graphic representation software. No doubt, a different analyst would call attention to other musical features and choose other means of representing their observations within these programs.
To my ears, the work can be clearly divided into three independent sections, each of which possesses its own self-contained form that is subsumed into the larger context of the work as a whole. My analysis aims to demonstrate different ways of representing both the micro- and macro-level formal dimensions of the work. For digging into the surface details, I will begin by comparing two possible representations of the material located at the outset of the work’s third section (6:17 – 7:35). Depending on one’s analytical inclinations and choice of software, it is possible to arrive at very different results for creating a graphic transcription. To explore this issue further, let’s begin with a consideration of the EAnalysis representation in the example below.
Exemple 2: EAnalysis representation of M.É. excerpt (6:17 – 7:35)

Proceedings of the Electroacoustic Music Studies Network Conference Electroacoustic Music Beyond Performance, Berlin, June 2014
www.ems-network.org
9
Landon Morrison Graphical Music Representations: A Comparative Study Based on the Aural Analysis of Philippe Leroux’s M.É.
The screenshot above is divided into four panels, including (from top to bottom) a representation of structural functions based on Denis Smalley’s spectromorphologies, a transcription of surface details using an assortment of graphic shapes, a visual sonogram, and a depiction of the work’s amplitude waveform. With the exception of the bottom panel, all of these different views correspond to the same zoomed-in time scale (6:17 – 7:35); by contrast, the waveform in the bottom panel covers the entire work. Generally speaking, the waveform and sonogram panels provide the viewer with an objective record of the work’s sonic properties, while the top two panels feature annotations conveying my own analytical interpretation of the passage. In the absence of a consistent system of symbology, I have tried to institute my own framework of rules so that the decisions made in my transcription process will be coherent to other readers. It will be helpful if I explain the logic behind the graphic shapes employed in the transcription located on the second panel. This section of the work begins with two distinct sound types: an accented piano-like sound (orange) in the foreground, and an accumulated texture of percussive impulses (black) in the background. The piano-like sound is characterized by a strong attack followed by a decaying resonance, which I have depicted by tapering the orange shape appearing at each successive entrance of the sound. Moreover, the sharp edges of this shape are meant to correspond with the sound’s slightly metallic character and its internal spectral flux. As for the second sound type, I’ve tried to show that the gradual accumulation of percussive impulses features the staggered entrances of three stratified layers that are distinguished by their registral and timbral properties. To this end, I employed three layers of small black shapes amassed together, wherein each layer contains a different shape (circles, squares, and triangles), and the varying degrees of density between the shapes in each layer illustrate the gradual thinning of the iterative textures towards the lower register. The accumulation of percussive elements is interrupted at marker 6:42 by a fourth attack of the piano-like motif and by the emergence of a new sound type – a synthetic, voice-like impulse represented by individual blue dots. In stark contrast to the previous section, the entrance of the voice-like impulses is very sparse and their rhythmic arrangement implies an underlying 4/4 metrical grid. At marker 6:57, the voices settle into a steady pulse and initiate a process of textural proliferation that mimics the aural illusion known as the Shepard-Risset tone. Here, the effect is achieved by superimposing voice streams layer upon layer until they coalesce into a spiraling descent towards a bottomless pitch space. My transcription of this process takes a cue from Bayle’s image-des-sons approach and uses a pictorial rendering of a rain-like image. Of course, I am not suggesting that the listener should literally hear the passage as a mimesis of rain, but rather that the image of rain provides an apt metaphorical representation of the Shepard-Risset tone’s sonic effect. Underneath the showering glissando voices there are sharply accented punctuations possessing a timbre that resembles the earlier piano-like sound. To show this connection, I have color-coded these short impulses orange, but have also altered their shape to show their contrasting articulation. In counterpoint to these bursts of sound, there is a series of soft metallic impulses (yellow strokes) and the brief emergence of a soft, granulated texture

Proceedings of the Electroacoustic Music Studies Network Conference Electroacoustic Music Beyond Performance, Berlin, June 2014
www.ems-network.org
10
Landon Morrison Graphical Music Representations: A Comparative Study Based on the Aural Analysis of Philippe Leroux’s M.É.
(turquoise circle) in the background. Eventually, the weight of the Shepard-Risset effect in the accumulated voices comes crashing down and sets up a nearly verbatim recapitulation of the opening material (7:23). Thus, this excerpt clearly projects a basic ABA formal outline, which my transcription conveys by identifying each of the sound types in the passage and visually mapping their relationships in the space of a descriptive score. Before leaving this example, I will briefly comment on my implementation of Smalley’s spectromorphology in the top panel. The symbols in this library correspond with different categories in Smalley’s theory of structural functions. As I mentioned earlier, these functions are predicated on the tri-partitioning of a sound’s amplitude envelope into the archetypal onset-continuant-termination phases; in addition, Smalley offers several different subgenres within each of these basic categories. For instance, my analysis in the example above shows that the A section commences with a very brief upbeat, followed by three successively larger downbeat-release combinations that mirror the dynamic waveform of the piano-like sound. As the last of these events fades, there is an emergence of the voice-like impulses announcing the onset of the B section, which I have labeled here with a rectangular symbol denoting its transitional continuant function. In turn, this section yields to the momentum of the Shepard-Risset tone to initiate a return to the A section. One potential problem with this approach is that each section can only be assigned a single function. In reality, musical functions often overlap and cut across sections, creating a deep web of interrelated trajectories. For instance, the Shepard-Risset tone effect is not represented in my analysis because I made a choice to subsume this process within the context of the transition section. It becomes a question of what degree of detail one wishes to analyze. If you choose close-up detail, then you miss the bigger picture. And conversely, if you choose a larger level of focus, then you loose sight of the individual details. The situation could be improved by creating degrees of transparency within the annotative figures, such that shapes can overlap and the degree of shading indicates the dominant function. The root of the problem, however, lies in the fuzziness of Smalley’s theory. In particular, Smalley doesn’t explicitly define each of his subcategories, leading the analyst to wonder what exactly the difference is between an upbeat and an anacrusis. And unlike other hierarchical musical perspectives (for instance, Schenker’s Ursatz or Schoenberg’s Grundgestalt), there are no clearly established rules for discerning which level of the hierarchy a given musical event belongs to within Smalley’s theory of spectromorphological functions. Nonetheless, Smalley’s theory remains one of the most viable options for conceptualizing structural relationships in music that is not based on traditional note arguments. I would now like to shift gears to consider an alternate representation of the same passage, but this time employing Thoresen’s symbology. Example 3, shown below, contains my transcription of local-level details using the Acousmographe software. There are three panels in the display, including (from top to bottom) my graphic transcription of the music’s surface, a depiction of the works segmentation into hierarchical time-fields, and an illustration of the work’s dynamic form. Since I have already discussed the primary sound types in this passage, I will focus at this point primarily on differences in Acousmographe’s symbolic notation versus EAnalysis’s pictorial rendering.

Proceedings of the Electroacoustic Music Studies Network Conference Electroacoustic Music Beyond Performance, Berlin, June 2014
www.ems-network.org
11
Landon Morrison Graphical Music Representations: A Comparative Study Based on the Aural Analysis of Philippe Leroux’s M.É.
Exemple 3: Acousmographe representation of M.É. excerpt (6:17 – 7:35)
On the top panel, you’ll notice that I have once again designated the piano-like sound with the color orange. The main difference here is that I am no longer improvising shapes to mimic the behavior of the sound; rather, I am assigning shapes from Thoresen’s spectromorphology library that fit the sound’s underlying characteristics. Hence, the piano-like sound is represented by a combination of attributes, including: 1) a circle indicating that it is a pitched sound, 2) a vertical line to the left of each circle marking the sharp accented onset of the sound, 3) a horizontal line extending to the right of each circle showing the sustained articulation of the sound, and 4) a curvy line with two dots representing the spectral flux within the sustained sound. The same process of decodification can be applied to each of the sound events in my transcription. In lieu of belaboring the point for each symbol, I will only describe a few of the significations that have not yet been addressed. Take for instance the accumulation of percussive elements – the bracketed group of red diamonds implies that each of the stratified layers is comprised of an accumulation of iterative dystonic impulses. Additionally, the short, diagonally-oriented lines to the right of each bracketed group indicate the relative speed of the iterations within each stratified layer, ranging from a very fast flutter-time tempo in the

Proceedings of the Electroacoustic Music Studies Network Conference Electroacoustic Music Beyond Performance, Berlin, June 2014
www.ems-network.org
12
Landon Morrison Graphical Music Representations: A Comparative Study Based on the Aural Analysis of Philippe Leroux’s M.É.
upper register to a slower paced ripple-time in the lowest register. And finally, the horizontal dotted lines extending to the right of each bracket demarcate the iterative nature of the accumulated texture. From this description, it should be readily apparent that it is possible to condense a large amount of information about each sound into a very concise symbolic format using Thoresen’s lexicon. The transcription may not be as intuitive or creatively engaging as the EAnalysis version, but what Acousmographe lacks in visual appeal it makes up for with a much greater degree of specificity and clarity. The second panel in the example shows my segmentation of the passage into distinct time-fields. This method for segmentation is more or less synonymous with what might traditionally be called the music’s phrase structure. But the concept of musical phrasing is historically bound to the notions of motivic organization, harmonic function, and cadential resolution in tonal music. Thoresen’s adoption of the term time-field seems to be geared towards sidestepping these connotations in favor of a much looser criterion for musical segmentation. In my analysis, I have used Smalley’s onset-continuant-termination model as a guide in partitioning the musical surface. The lowest level of segmentation represents the profile of each individual sound, which might be considered as an analog to the motive in traditional theoretical terms. Next, I have grouped the individual sounds into larger sections at the middle ground based on their general coherence as a gestalt. And finally, the highest level of segmentation represents the larger formal divisions of the work. Although the use of time-fields as a substitute for more traditional terminology has its advantages, it also leads to a certain amount of ambiguity regarding the underlying factors relevant to making such decisions, and the time-field paradigm could benefit from a higher degree of formalization. The bottom panel shows my interpretation of the music’s dynamic form, which offers a very loosely formulated tool for conceptualizing the energetic flow of the music. Here, Thoresen has adopted three basic archetypes within this library – forward-oriented, presence-oriented, and backwards-oriented. At first glance, this analytical toolkit seems to be based solely on the music’s dynamic profile, but the toolkit also contains other annotative options, such as goal attainment and goal evasion, which complicate the issue. In this sense, the dynamic form approach seems to share some similarities with Roy’s functions mentioned earlier in the discussion of EAnalysis toolkits. In my own adaptation of the dynamic form tools, I have considered them as an embodiment of both dynamic profile and continuous musical processes. Moreover, I’ve color-coded each of the dynamic form annotations to indicate which of the sound types is driving the process. For instance, the transcription in example 3 shows that the opening material can be conceived as three backwards-oriented gestures (orange piano-like sounds represented by triangles) nested within a larger presence-oriented texture (red accumulation of percussive elements represented by rectangle). This account is based primarily on the dynamic profiles of the constituent elements within the musical segment. By contrast, the Shepard-Risset effect perpetrated by the voice-like iterations (purple) qualifies as a musical process leading the listener’s expectations toward a presumed goal; therefore, I have identified this as a forward-oriented process (triangle). The goal of this process is attained when the original material from the beginning of the movement returns at marker 7:23. I found that this

Proceedings of the Electroacoustic Music Studies Network Conference Electroacoustic Music Beyond Performance, Berlin, June 2014
www.ems-network.org
13
Landon Morrison Graphical Music Representations: A Comparative Study Based on the Aural Analysis of Philippe Leroux’s M.É.
approach was particularly useful for interpreting M.É. because such a large part of the musical discourse centers on the interaction of opposing musical processes – accumulation vs. fragmentation, acceleration vs. deceleration, ascending vs. descending trajectories, and intensification vs. dissipation. Thoresen’s dynamic form annotations offer tools for highlighting the way these musical processes shape the overall form of the work, as will become evident in the following example.
Section A
Section B
Section C
Exemple 4: Acousmographe representation of large-scale form
The three rows of graphic information in example 4 correspond to the three sections of the work (which I have labeled A, B, and C). From bottom to top, each row features a depiction of the section’s dynamic form, a time line, and a tri-level time-field hierarchy. This bird’s eye view of the entire work facilitates an understanding of the work’s large-scale segmentation, as well as the ability to draw connections across noncontiguous sections of

Proceedings of the Electroacoustic Music Studies Network Conference Electroacoustic Music Beyond Performance, Berlin, June 2014
www.ems-network.org
14
Landon Morrison Graphical Music Representations: A Comparative Study Based on the Aural Analysis of Philippe Leroux’s M.É.
the music. For example, it is possible from this vantage point to see that the piano-like sound (orange) from the beginning of the third movement returns again towards the end of the work. Moreover, we can see that it was introduced much earlier in the work (at the 0:30-second mark), and it played a recurring role within the work’s first section. The repetition of this sound type thus becomes an important musical motif that supports the overall form of the work by unifying Sections A and C. After recognizing this fact, I investigated the passages more closely and discovered that the final instance of the piano-like sound at the end of the work occurs at the same pitch class (D♯) as the very first instance of the sound in Section A. Hence, the work exhibits not only a rotational motivic design, but also a long-range tonal recapitulation that ties the musical form together in a very traditional manner.
Another connection made readily apparent from this diagram is that the purple and blue segments in Section C contain material derived from the work’s middle section (B). As I mentioned, the purple area is driven by a voice-like sound, and the blue segment features a strange counterpoint built from windy gestures and the ebb-and-flow of cicada-like rhythmic accumulations. These two sound types make up the entirety of Section B, which exhibits a wonderfully straightforward dynamic form – a prolonged process of ascent, accumulation, intensification, and acceleration of rhythmic activity that crashes headlong into its complete opposite (descent, fragmentation, dissipation, and deceleration). This giant opposition of processes is a perfect microcosm of the discourse that pervades the rest of the work, and the counteraction of musical forces is made all the more dramatic by the introduction of the voice-like sound type at the apex of the second section. This is the first instance in the work of a sound associated with the human domain, as opposed to the digital. In fact, the composer has remarked upon the fact that the work’s title is an allusion to the word hemiola, a musical term used for describing the rhythmic juxtaposition of duple and triple metric subdivisions. In similar fashion, M.É. can either be divided into three sections based on its temporal partitioning, or conversely, it can be construed as two parts – the first without voices (0:00 – 4:53), and the second with the addition of voices (4:54 – 12:53). These long-range insights are only conceivable with the aide of a descriptive score that allows the analyst to account for a work’s total structure outside the confines of the temporally bound listening experience.
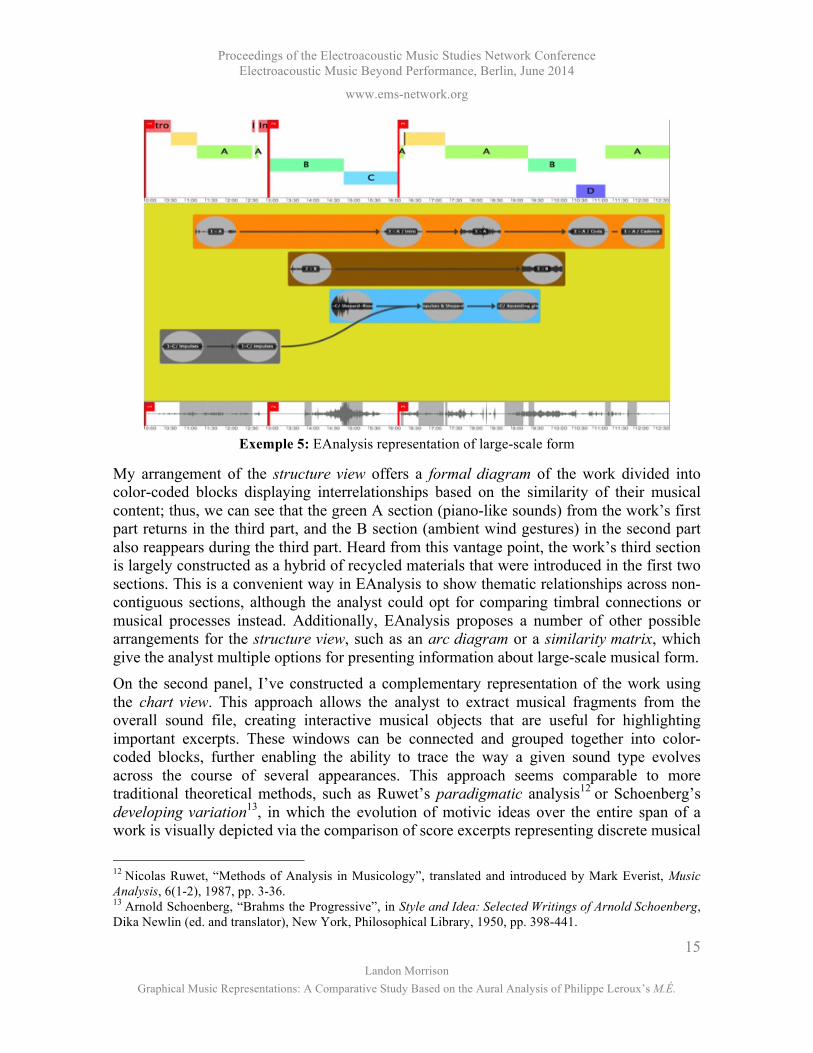
To round out this discussion on M.É., I will return briefly to the EAnalysis software to show some of the options it offers for tackling large-scale formal issues. In example 5, the screen is split into three panels featuring (top to bottom) a structure view, chart view, and a representation of the work’s amplitude waveform. The vertical red lines mark the division of the work into three large sections. In the following paragraphs, I’ll provide a quick description of the information contained within these alternative analytical representations of the music.
Proceedings of the Electroacoustic Music Studies Network Conference Electroacoustic Music Beyond Performance, Berlin, June 2014
www.ems-network.org
15
Landon Morrison Graphical Music Representations: A Comparative Study Based on the Aural Analysis of Philippe Leroux’s M.É.
Exemple 5: EAnalysis representation of large-scale form
My arrangement of the structure view offers a formal diagram of the work divided into color-coded blocks displaying interrelationships based on the similarity of their musical content; thus, we can see that the green A section (piano-like sounds) from the work’s first part returns in the third part, and the B section (ambient wind gestures) in the second part also reappears during the third part. Heard from this vantage point, the work’s third section is largely constructed as a hybrid of recycled materials that were introduced in the first two sections. This is a convenient way in EAnalysis to show thematic relationships across non-contiguous sections, although the analyst could opt for comparing timbral connections or musical processes instead. Additionally, EAnalysis proposes a number of other possible arrangements for the structure view, such as an arc diagram or a similarity matrix, which give the analyst multiple options for presenting information about large-scale musical form. On the second panel, I’ve constructed a complementary representation of the work using the chart view. This approach allows the analyst to extract musical fragments from the overall sound file, creating interactive musical objects that are useful for highlighting important excerpts. These windows can be connected and grouped together into color-coded blocks, further enabling the ability to trace the way a given sound type evolves across the course of several appearances. This approach seems comparable to more traditional theoretical methods, such as Ruwet’s paradigmatic analysis12 or Schoenberg’s developing variation13, in which the evolution of motivic ideas over the entire span of a work is visually depicted via the comparison of score excerpts representing discrete musical
12 Nicolas Ruwet, “Methods of Analysis in Musicology”, translated and introduced by Mark Everist, Music Analysis, 6(1-2), 1987, pp. 3-36. 13 Arnold Schoenberg, “Brahms the Progressive”, in Style and Idea: Selected Writings of Arnold Schoenberg, Dika Newlin (ed. and translator), New York, Philosophical Library, 1950, pp. 398-441.

Proceedings of the Electroacoustic Music Studies Network Conference Electroacoustic Music Beyond Performance, Berlin, June 2014
www.ems-network.org
16
Landon Morrison Graphical Music Representations: A Comparative Study Based on the Aural Analysis of Philippe Leroux’s M.É.
fragments. Here, the primary differences are that EAnalysis substitutes sonogram excerpts in place of the printed score, and it augments the visual comparison of musical fragments with an interactive auditory component. In my own analysis, the orange group containing five sound excerpts showcases a comparison of multiple instances of the piano-like sound type. In similar fashion, the brown group compares dual occurrences of the windy gestures from the second and third sections; the blue group compares the differing incarnations of voice-like sounds; and the grey group compares two synthetic sound types from the first section that share indirect timbral associations with the voice-like sounds in the third section. This view of the work is advantageous in pedagogical contexts because it brings the analysis to life by allowing people to hear the musical connections. Taken together with my presentation of the structure view, Roy’s functions, and a transcription of local-level musical details using graphic shapes, the EAnalysis software affords an accessible, multimodal analysis of the work’s total structure.
Conclusions
The comparative analysis outlined in this paper is by no means comprehensive, but I hope that it has provided enough evidence to suggest that one’s choice of graphic representation software – in this case, EAnalysis or Acousmographe – effects the potential avenues available for presenting the final analysis. As I have argued, both of these platforms incorporate basic tenets from Schaeffer’s typologie and Smalley’s spectromorphology, but they also differ in many important aspects. EAnalysis seems to encourage pictorial transcriptions and offers the analyst a flexible interface for the creation of a customizable lexicon mapping graphic shapes to their respective sound events. This approach has the advantage of being relatively intuitive, and therefore it may be more appropriate in a pedagogical environment geared towards non-specialists. Acousmographe, on the other hand, offers a greater degree of precision in the representation of spectromorphological details and may be better suited for in-depth analytical applications within the realm of specialized research projects. But of course, Acousmographe also requires the user to develop fluency with a somewhat laborious system of coded symbols. In the end, both programs are extremely useful depending on one’s intended audience, and every analyst must have clearly defined intentions in order to decide which software tools are suitable for reaching their specific research objectives. At a time when technology allows composers to create infinitely complex works of art, the lack of a written score has largely precluded careful analytical studies of acousmatic music and it has complicated attempts at a meaningful discourse on the subject. Clearly, an effort must be made to bridge the gap between contemporary musical practice, theoretical knowledge, and analytical methodology. Although not perfect, EAnalysis and Acousmographe represent a major step forward in this process, and the present paper has hopefully provided the reader with several useful examples showing how graphical music transcriptions can contribute to a deeper appreciation of acousmatic music.

Proceedings of the Electroacoustic Music Studies Network Conference Electroacoustic Music Beyond Performance, Berlin, June 2014
www.ems-network.org
17
Landon Morrison Graphical Music Representations: A Comparative Study Based on the Aural Analysis of Philippe Leroux’s M.É.
References
BAYLE François, “Image-of-sound, or i-sound: Metaphor/metaform”, Contemporary Music Review, 4, 1989, pp. 165-170.
DELALANDE François et al., Les Unités Sémiotiques Temporelles, Laboratoire Musique et Informatique de Marseille (MIM), Documents Musurgia, Paris, Édition Eska, 1996.
EMMERSON Simon, “The Relation of Language to Materials”, in The Language of Electroacoustic Music, Simon Emmerson (ed.), London, Macmillan, 1986, pp. 17-39.
FREY Aline et al., “Temporal Semiotic Units as Minimal Meaningful Units in Music? An Electrophysiological Approach”, Music Perception: An Interdisciplinary Journal, 26(3), 2009, pp. 247-256. PEIRCE Charles Sanders, Collected Papers, Cambridge (MA, USA), Belknap Press of Harvard University Press, vol. 2, paragraph 56, 1960-1966. ROY Stéphane, L’analyse des musiques électroacoustiques : modèles et propositions, Paris, L’Harmattan, 2003. ROY Stéphane, “Form and Referential Citation in a Work by Francis Dhomont”, Organised Sound, 1(1), 1996, pp. 29-41. RUWET Nicolas, “Methods of Analysis in Musicology”, translated and introduced by Mark Everist, Music Analysis, 6(1-2), 1987, pp. 3-36. SCHAEFFER Pierre, Traité des objets musicaux, Paris, Éditions du Seuil, 1966.
SCHOENBERG Arnold, “Brahms the Progressive”, in Style and Idea: Selected Writings of Arnold Schoenberg, Dika Newlin (ed. and translator), New York, Philosophical Library, 1950, pp. 398-441. SMALLEY Denis, “Spectromorphology: Explaining Sound Shapes”, Organised Sound, 2(2), 1997, pp. 107-126. THORESEN Lasse, “Spectromorphological Analysis of Sound Objects. An adaptation of Pierre Schaeffer’s Typomorphology”, in Proceedings of the Electroacoustic Music Studies Network Conference (EMS06): Terminology and Translation, Beijing (China), 2006, www.ems-network.org/spip.php?article250&var_mode=calcul (last accessed 09/14). VANDE GORNE Annette, “L’interprétation spatiale. Essai de formalisation méthodologique”, Revue DEMeter, Université Lille 3, décembre 2002, http://demeter.revue.univ-lille3.fr/interpretation/vandegorne.pdf (last accessed 09/14).