Embed Size (px)
Citation preview

CPL Meteorology ALL RIGHTS RESERVED © 2016 141
GRAPHICAL AREA FORECASTS (GAF)
Unlike at TAF, a Graphical Area Forecasts (GAFs) does not describe conditions expected at a particular location, it refers to a defined area and is intended for use in planning the enroute phase of flight. GAFs cover the airspace between the surface and 10000 feet AMSL and are
therefore most useful for unpressurised, non oxygen-equipped general aviation aircraft.
From 10000 feet to FL250 medium level Sig-nificant Weather Charts (SIGWX) are usedand above FL250, high level Significant Weather Charts (SIGWX) are used, but they don't concern us at the moment (Fig 7.13).
Ten GAF areas have been created in Australia and their boundaries are indicated on the Planning Chart Australia (PCA).
The GAF areas are named according to the state that contains them, QLD-N, QLD-S, NSW-E, NSW-W, VIC, TAS, SA, WA-S, WA-N and NT.
The GAFs are issued two at a time, each with a 6 hour validity period, so that each issue covers the next 12 hours.
The validity periods are:2300Z to 0500Z0500Z to 1100Z1100Z to 1700Z1700Z to 2300Z
Two 6 hour GAFs are issued no later than 30 minutes be-fore the commencement of each 12 hour validity period.
GAFs feature clearly defined sections comprised of -
A HEADER giving details of the time of issue and the associated validity period.
AN IMAGE of the GAF area along with subdivisions if necessary, defined by letters such as A. Any further subdivisions with those subdivisions will be identified as A1, A2 etc. (See Fig 7.15).
10000 feet
FL250
GRAPHICAL AREA FORECASTS
MEDIUM LEVEL SIGNIFICANT WEATHER CHARTS (SIGWX)
10000 feet to FL250
HIGH LEVEL SIGNIFICANT WEATHER CHARTS (SIGWX)
Above FL250
Flight Information Region boundary
Graphical Area Forecast boundary
WA-S SA
NSW-W
NT
TAS
VIC
QLD-S
QLD-N
NSW-E
WA-N
Fig 7.13
Fig 7.14

142 BOB TAIT'S AVIATION THEORY SCHOOL CPL Meteorology
A TABLE containing a description of the weather forecast for each area subdivision.
A LEGEND explaining the association between cloud, icing and turbulence. For example-
The presence of TS, CB or TCU always implies severe icing and severe turbulence. Severe ic-ing and turbulence may not be separate forecast elements.
The presence of CU, SC or AC always implies moderate turbulence even if turbulence is not mentioned as a separate item.
Any cloud above the freezing level (CLD ABV FZLVL) always implies moderate icing even if icing is not mentioned as a separate item.
REMARKS The remarks section contains information on phone numbers, any corrections to the GAF and critical locations for NSW-E and VIC. Critical locations relate to areas frequently used by VFR aircraft where a combination of terrain and weather can present a hazard to those aircraft.
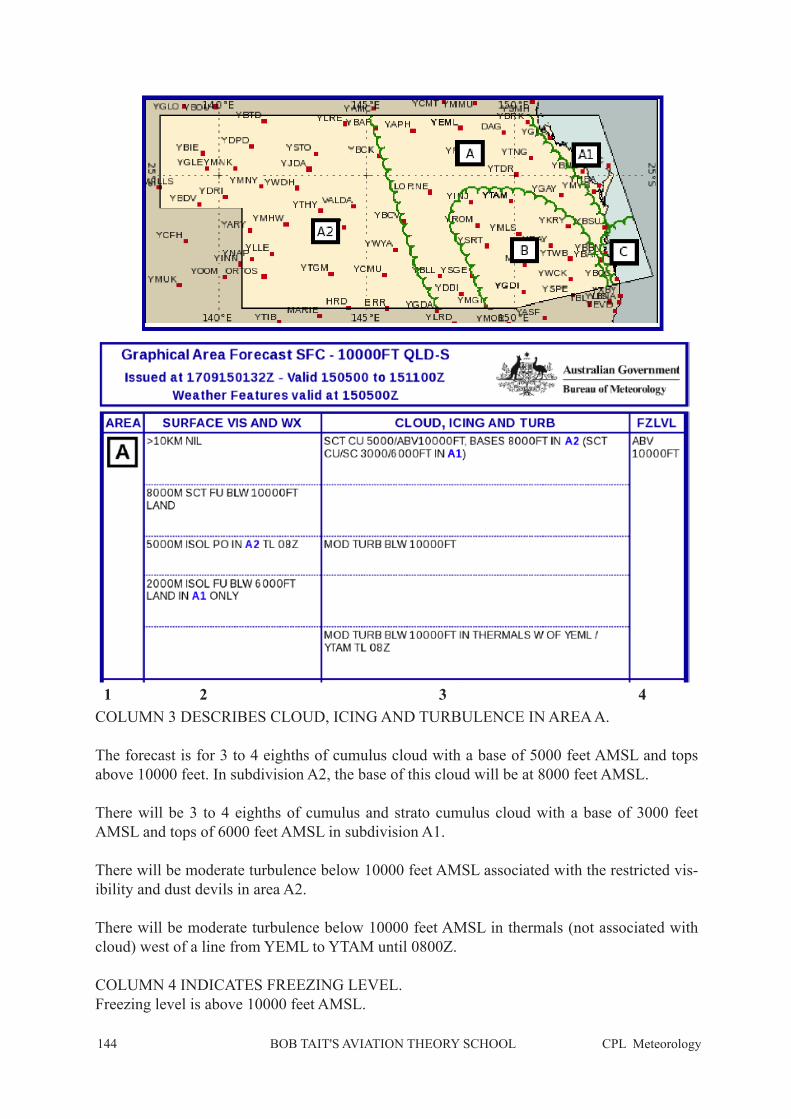
Another example of a GAF is shown on the opposite page ( See Fig 7.15). This is a GAF for QLD-S and it features a number of subdivisions.
The subdivisions are indicated by scalloped lines and identified as A, A1, A2, B and C.

CPL Meteorology ALL RIGHTS RESERVED © 2016 143
Areas A1 and C represents the coastal strip down as far as Brisbane and the Gold Coast, area B represents the Darling Downs, area A represents the ranges and the western slopes of the ranges, while area A2 represents the area west of the ranges.
COLUMN 1 IDENTIFIES SUBDIVISION A
COLUMN 2 DESCRIBES VISIBILITY AND WEATHER FOR AREA A. The visibility in subdivision A is forecast to be better than 10km except that-
Visibility will drop to 8000m in areas of smoke over land below 10000 feet.
Visibility will drop to 5000m in isolated areas with dust devils in Area A2 until 0800Z.
Visibility will drop to 2000m in isolated smoke below 6000 feet over land in Area A1 only
Fig 7.15
1 2 3 4
144 BOB TAIT'S AVIATION THEORY SCHOOL CPL Meteorology
COLUMN 3 DESCRIBES CLOUD, ICING AND TURBULENCE IN AREA A.
The forecast is for 3 to 4 eighths of cumulus cloud with a base of 5000 feet AMSL and tops above 10000 feet. In subdivision A2, the base of this cloud will be at 8000 feet AMSL.
There will be 3 to 4 eighths of cumulus and strato cumulus cloud with a base of 3000 feet AMSL and tops of 6000 feet AMSL in subdivision A1.
There will be moderate turbulence below 10000 feet AMSL associated with the restricted vis-ibility and dust devils in area A2.
There will be moderate turbulence below 10000 feet AMSL in thermals (not associated with cloud) west of a line from YEML to YTAM until 0800Z.
COLUMN 4 INDICATES FREEZING LEVEL.Freezing level is above 10000 feet AMSL.
1 2 3 4

CPL Meteorology ALL RIGHTS RESERVED © 2016 145
COLUMN 1 IDENTIFIES SUBDIVISION B
COLUMN 2 DESCRIBES VISIBILITY AND WEATHER FOR AREA B. The visibility in subdivision A is forecast to be better than 10km except that-
Visibility will drop to 8000m in isolated areas of smoke below 10000 feet throughout the area.
Visibility will drop to 3000m in isolated showers of rain.
Visibility will drop to 2000m in isolated thunderstorms with rain.
COLUMN 3 DESCRIBES CLOUD, ICING AND TURBULENCE IN AREA BThe forecast is for 3 to 4 eighths of cumulus cloud with a base of 5000 feet AMSL and tops above 10000 feet AMSL throughout area B.
Associated with the reduced visibility in showers of rain (3000m) there will be isolated tower-ing cumulus cloud with a base of 3500 feet AMSL and tops above 10000 feet AMSL. Also 5 to 7 eighths of stratus cloud with a base of 2000 feet AMSL and tops of 3500 feet AMSL plus 5 to 7 eighths of cumulus and strato cumulus with a base of 3500 feet and tops above 10000 feet AMSL
Associated with the reduced visibility of 2000 metres in isolated thunderstorms, there will be isolated cumulonimbus cloud with a base of 3500 feet and tops above 10000 feet AMSL. Also there will be 5 to 7 eighths of stratus cloud with a base of 2000 feet and tops of 3500 feet AMSL plus 5 to 7 eighths of cumulus and strato cumulus cloud with a base of 3500 feet and tops above 10000 AMSL.
There will be moderate turbulence in thermals without cloud west of a line from YGDI to YTAM.
COLUMN 4 INDICATES FREEZING LEVEL Freezing Level above 10000ft.
1 2 3 4

146 BOB TAIT'S AVIATION THEORY SCHOOL CPL Meteorology
COLUMN 1 IDENTIFIES SUBDIVISION C
COLUMN 2 DESCRIBES VISIBILITY AND WEATHER FOR AREA C.The visibility in subdivision C is forecast to be better than 10km except that-
Visibility will be reduced to 3000 meters in isolated showers of rain.
COLUMN 3 DESCRIBES CLOUD, ICING AND TURBULENCE IN AREA CThe forecast is for 3 to 4 eighths of cumulus and strato cumulus cloud with a base of 3000 feet AMSL and tops of 7000 feet AMSL throughout area C
Associated with the areas of visibility reduced to 3000 metres in isolated showers of rain, there will be 5 to 7 eighths of stratus cloud with a base of 1500 feet and tops of 3000 feet AMSL. Also, there will be an overcast of cumulus and stratocumulus cloud with a base of 3000 feet and tops of 9000 feet AMSL.
COLUMN 4 INDICATES FREEZING LEVEL Freezing Level above 10000ft.
1 2 3 4

CPL Meteorology ALL RIGHTS RESERVED © 2016 147
AREA QNH ZONE BOUNDARIES.Apart from the GAF area boundaries, separate area boundaries have been created for defining Area QNH based on the current synoptic situation. The Area QNH boundaries define smaller areas that do not coincide with the GAF boundaries.
For example Fig 7.16 above shows that Coober Pedy is in the SA GAF boundary, and is in the Area QNH zone 52. Meanwhile, Ceduna is also in the SA GAF boundary but it is in the Area QNH zone 53, while Adelade is also in the SA GAF boundary but is in the Area QNH zone50. The GAF and Area QNH boundaries are shown on the Planning Chart Australia (PCA)
Area QNH Zones will be subdivided, if necessary, to meet the following standards of accuracy:a. Area QNH forecasts are to be within ± 5HPA of the actual QNH at any low-
level point (below 1,000FT AMSL) within or on, the boundary of the appropriate area during the period of validity of the forecasts.
b. Area QNH must not differ from an adjoining Area QNH by more than 5HPA.
Coober Pedy is in Area QNH zone number 52
Ceduna is in Area QNH zone number 53
Adelade is in Area QNH zone number 50
148 BOB TAIT'S AVIATION THEORY SCHOOL CPL Meteorology
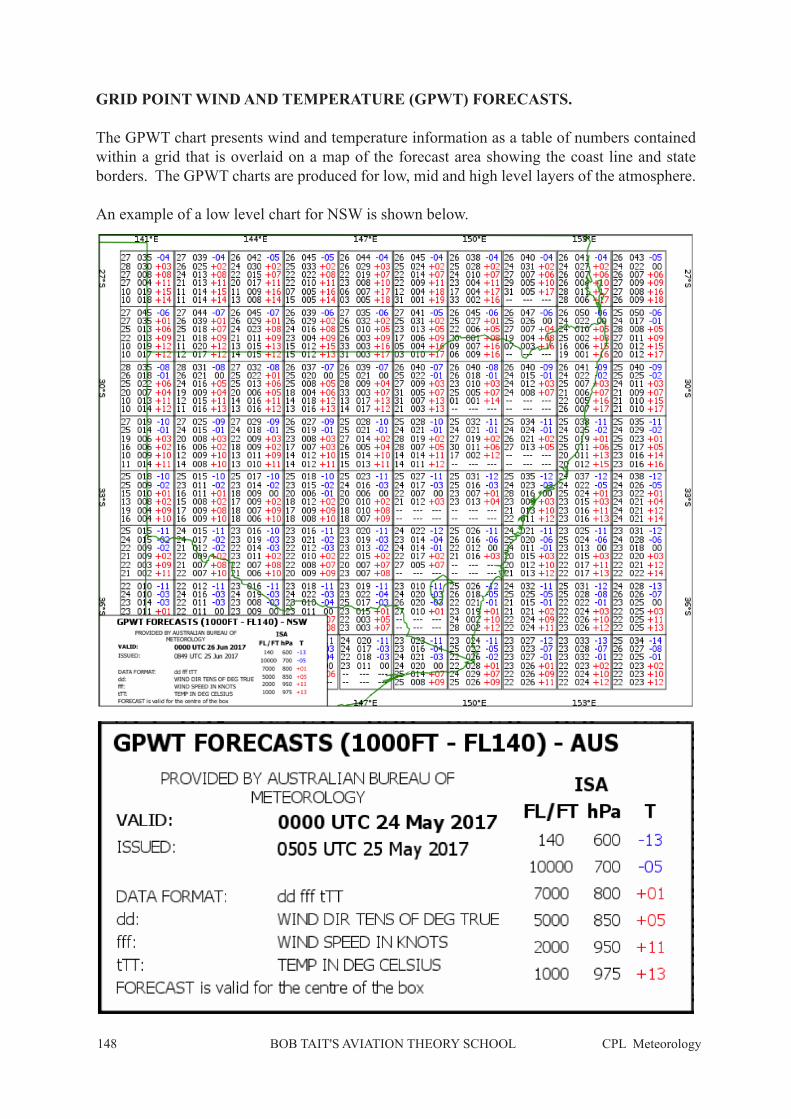
GRID POINT WIND AND TEMPERATURE (GPWT) FORECASTS.
The GPWT chart presents wind and temperature information as a table of numbers contained within a grid that is overlaid on a map of the forecast area showing the coast line and state borders. The GPWT charts are produced for low, mid and high level layers of the atmosphere.
An example of a low level chart for NSW is shown below.

CPL Meteorology ALL RIGHTS RESERVED © 2016 149
1000 the wind is from 110°T at 16 knots and temperature is +13°C2000 the wind is from 120°T at 15 knots and temperature is +11°C5000 the wind is from 190°T at 09 knots and temperature is +04°C7000 the wind is from 240°T at 16 knots and temperature is +05°C10000 the wind is from 260°T at 21 knots and temperature is 0°C
FL140 the wind is from 280°T at 31 knots and temperature is -08°C
THE ROWSThe horizontal rows in each grid square relate to set levels in the standard atmosphere (ISA). From the bottom up the levels are, 1000ft, 2000 ft, 5000ft, 7000ft, 10000ft and FL 140.
The left-hand column in each grid square consists of two-digit num-bers representing the wind direction in tens of degrees true. (28 in this column indicates a wind from 280°T).
The centre column in each grid square consists of three-digit num-bers representing the wind speed in knots. (031 in this column indi-cates a wind speed of 31 knots).
The right-hand column in each grid square consists of a + or - sign followed by a two digit number representing the temperature in de-grees Celsius. (-08 in this column indicates a temperature of minus 8 degrees Cleisus.
This row relates to the 1000ft level in ISA.
THE COLUMNS
This row relates to the 2000ft level in ISA.This row relates to the 5000ft level in ISA.This row relates to the 7000ft level in ISA.This row relates to the 10000ft level in ISA.This row relates to the 14000ft level in ISA.
PUTTING IT ALL TOGETHER.
The dimensions of the each grid is 1.5° of latitude by 1.5° of longitude and the values con-tained in each grid relate to the centre point of each grid.
Sometimes, high terrain in a certain area may cause the 1000ft or 2000ft levels to be below ground level. When this happens, the data for those levels will be replaced by dashed lines.
Note that the levels do not correspond to the table of VFR cruising levels and a degree of interpolation may be necessary to obtain ac-curate figures for a particular cruising altitude.