Embed Size (px)
Citation preview
East Tennessee State UniversityDigital Commons @ East
Tennessee State University
Electronic Theses and Dissertations Student Works
8-2006
Graph Theory for the Middle School.Laura Ann RobinsonEast Tennessee State University
Follow this and additional works at: https://dc.etsu.edu/etd
Part of the Curriculum and Instruction Commons, and the Science and Mathematics EducationCommons
This Thesis - Open Access is brought to you for free and open access by the Student Works at Digital Commons @ East Tennessee State University. Ithas been accepted for inclusion in Electronic Theses and Dissertations by an authorized administrator of Digital Commons @ East Tennessee StateUniversity. For more information, please contact [email protected].
Recommended CitationRobinson, Laura Ann, "Graph Theory for the Middle School." (2006). Electronic Theses and Dissertations. Paper 2226.https://dc.etsu.edu/etd/2226

Graph Theory for the Middle School
________________
A thesis
presented to
the faculty of the Department of Mathematics
East Tennessee State University
In partial fulfillment
of the requirements for the degree
Master of Science in Mathematical Sciences
________________
by
Laura Ann Robinson
August 2006
________________
Teresa Haynes, Ph. D., Chair
Debra Knisley, Ph. D.
George Poole, Ph. D.
Keywords: Graph Families, Graph Operations, Graph Theory,
Map Coloring, Middle School

2
ABSTRACT
Graph Theory for the Middle School
by
Laura Ann Robinson
After being introduced to graph theory and realizing how it can be utilized to
solve real-world problems, the author decided to create modules of study on
graph theory appropriate for middle school students. In this thesis, four
modules were developed in the area of graph theory: an Introduction to
Terms and Definitions, Graph Families, Graph Operations, and Graph
Coloring. It is written as a guide for middle school teachers to prepare
teaching units on graph theory.

3
DEDICATION
I would like to dedicate this thesis to the many people who have
helped me to get to where I am today. To my husband, Doug, and my
children, Cody and Dylan, thank you so much for your patience and
understanding while I worked on this thesis. Also, your support and
encouragement made this a reality. I love you all! To my mother, who has
always encouraged me in my endeavors and instilled in me the values that
help me to reach all of my goals. To all of my teachers throughout the years,
that instilled in me a love for education, both mine and the education of my
students. And, to Sherry, who has been by my side, helping, guiding,
supporting, and encouraging me. Thank you for being such a good friend!

4
ACKNOWLEDGEMENTS
I would like to thank Dr. Teresa Haynes for her guidance, support,
and encouragement. I would also like to thank Dr. Anant Godbole for
introducing me to Graph Theory, the topic of this thesis.

5
CONTENTS
Page
ABSTRACT ...................................................................................................... 2
DEDICATION .................................................................................................. 3
ACKNOWLEDGEMENTS .............................................................................. 4
LIST OF FIGURES .......................................................................................... 8
Chapter
1. INTRODUCTION ..................................................................................... 11
1.1 The Idea......................................................................................... 11
1.2 Selecting the Units ........................................................................ 12
2. INTRODUCTION TO GRAPH THEORY ............................................... 14
2.1 Graphs as Models.......................................................................... 14
2.2 What is a Graph? .......................................................................... 15
2.3 Examples ...................................................................................... 16
2.4 Exercises ……………………………………………………….. 19
2.5 Solutions ……………………………………………………….. 20
2.6 The First Theorem ……………………………………………... 21
2.7 Examples ……………………………………………………….. 22
2.8 Exercises ……………………………………………………….. 24
2.9 Solutions ……………………………………………………….. 25
6
Chapter Page
3. GRAPH FAMILIES ..................................................................................... 26
3.1 Types of Graphs ........................................................................... 26
3.2 Exercises ....................................................................................... 28
3.3 Solutions ……………………………………………………….. 30
3.4 Classes of Graphs ………………………………………………. 31
3.5 Exercises ……………………………………………………….. 40
3.6 Solutions ……………………………………………………….. 42
4. GRAPH OPERATIONS ............................................................................ 46
4.1 Union ............................................................................................ 46
4.2 Join ............................................................................................... 49
4.3 Deletion ………………………………………………………… 51
4.4 Edge Contraction ………………………………………………. 54
4.5 Cartesian Product ………………………………………………. 56
4.6 Exercises ……………………………………………………….. 59
4.7 Solutions ……………………………………………………….. 61
5. GRAPH COLORING ................................................................................ 65
5.1 Vertex Coloring ............................................................................ 65
5.2 Examples ...................................................................................... 66
5.3 Exercises ……………………………………………………….. 71
5.4 Solutions ……………………………………………………….. 73
5.5 Map Coloring …………………………………………………... 77
5.6 Exercises ……………………………………………………….. 82

7
Chapter Page
5.7 Solutions ……………………………………………………….. 86
BIBLIOGRAPHY.............................................................................................. 87
VITA ................................................................................................................. 88
8
LIST OF FIGURES
Figure Page
1 Graph G .................................................................................................. 16
2 Konigsberg Bridge Problem ................................................................... 17
3 Konigsberg Bridge Solution ................................................................... 18
4 The First Theorem ................................................................................... 22
5 Party Problem .......................................................................................... 23
6 Types of Graphs ...................................................................................... 26
7 Complete Graphs ..................................................................................... 31
8 Cycle ....................................................................................................... 32
9 Path ....................................................................................................... 33
10 Path-P8 ..................................................................................................... 34
11 Complete Bipartite Graph........................................................................ 34
12 Complete Bipartite Graph-K3, 4 ............................................................... 35
13 Star Graph................................................................................................ 35
14 Star Graph- K1, 6 ...................................................................................... 36
15 Wheel....................................................................................................... 37
16 Wheel-W1, 4.............................................................................................. 38
17 Tree of Hydrocarbon Molecule .............................................................. 38
18 Softball Tournament................................................................................ 39
19 P3 U P4 ..................................................................................................... 46
20 A1 Bus Lines .......................................................................................... 47
9
21 Best Ride Bus Lines ................................................................................ 47
22 City Line .................................................................................................. 48
23 P3 + P4 ..................................................................................................... 49
24 Tri-County Band Festival ....................................................................... 50
25 C3 + K1 = W1, 3 ....................................................................................... 50
26 Graph A, A - v ........................................................................................ 51
27 Graph A, A – wx .................................................................................... 52
28 Graph T = K4, T – b ................................................................................ 52
29 State Park ................................................................................................ 53
30 State Park, S Trail Deleted ..................................................................... 53
31 Graph G, Graph G/uv ............................................................................. 54
32 Warehouse Graph W .............................................................................. 55
33 Warehouse W/ef ..................................................................................... 55
34 Graph G, Graph H, and G X H ............................................................... 57
35 P3, P2, and P3 X P2 .................................................................................. 58
36 Vertex Coloring of W1, 4 ......................................................................... 65
37 Vertex Coloring of a Cycle, C5 ............................................................... 66
38 Central Middle School Clubs ................................................................. 68
39 Central Middle School Clubs With Lines .............................................. 69
40 Central Middle School Clubs With Coloring ......................................... 70
41 Map Coloring .......................................................................................... 78
42 Map ......................................................................................................... 79
43 Colored Map ........................................................................................... 79

10
44 The Southern United States .................................................................... 80
45 Three-colorable Graph of the Southern States ....................................... 81
11
1 INTRODUCTION
1.1 The Idea
In the spring of 2004 the author had the opportunity to enroll in the
class MATH 5010 Patterns and Problem Solving for Teachers taught by Dr.
Anant Godbole. During this course, the author was introduced to the area of
Graph Theory. This was new to the author and was found to be fun and
exciting. An Independent Study class the next term focused on some topics
of Graph Theory, namely vertex coloring, Hamiltonian Paths, and exploring
Euler’s Theorem. Again, it was found to be an interesting area of
mathematics and enjoyable. When it was time to choose a topic for a thesis
the author decided Graph Theory was an area of mathematics she would like
to pursue.
Having taught in Middle School for the past seventeen years, the
author decided to create modules of study on Graph Theory appropriate for
middle school students. Graph Theory is not generally taught at the middle
school level; however, in problem solving modules, students are taught
modeling and how to draw diagrams to solve problems. Thus, a unit on
Graph Theory suitable for middle school students was created that
incorporates problem solving of real world problems.
12
This paper was written as reference material for middle school
teachers. It includes the material needed to teach a unit such as: definitions,
examples, and drawings. It also includes exercises and accompanying
solutions.
1.2 Selecting the Units
The math curriculum in the author’s school is dictated by the state
standards of learning and testing of these standards. Testing occurs about a
month before the end of the school year. Graph Theory modules were
designed to be taught in about one week and may be taught whenever there
is free time.
The units are: An Introduction to Graph Theory, Graph Families,
Graph Operations, and Graph Coloring. An Introduction to Graph Theory
includes using graphs as models, basic graph theory definitions, and the first
theorem of graph theory. Graph Families consists of the different types of
graphs. Graph Operations consists of various operations involving graphs.
And Graph Coloring focuses on vertex coloring and map coloring. Each
module is designed to teach the basics of graph theory while solving real
world problems. The module An Introduction to Graph Theory and the
Graph Families module should be taught first and in this order. References

13
to terms used in these two modules are found in Graph Operations and
Graph Coloring. Any order is permissible for the other two modules.
Each module has an introduction that includes definitions and
examples, real-world problems, exercises, and solutions. Some units include
activities. All units may be taught using cooperative learning groups,
working with a partner, or working individually. Pair-share may be used
when students are asked to come up with their own graphs. Pair-share
involves pairing up students and having them share and check each others
work. This is a great tool for allowing students to see other students’ work
as well as experience problems where there may be multiple solutions.
The author used Microsoft Paint to create each of the drawings in the
units. A good use of technology would be to have students draw their
graphs on the computer. Any appropriate program may be used.
A variety of resources were examined while creating this unit of study.
The following references were found to be very useful: [1], [2], [3], [4], [5],
[6], and [7].

14
2 INTRODUCTION TO GRAPH THEORY
2.1 Graphs as Models
Graphs. When most people think of this word they think of a bar, line,
circle, or some other statistical graph, or a graph of a function. In graph
theory, graphs are used as models consisting of vertices and edges. These
mathematical models illustrate real life problems and situations.
Graphs can be used to model acquaintances, transportation routes,
molecules, sports schedules, and computer networks. Businesses may use
graphs to keep track of warehouses and retail outlets. Scientists may use
graphs to ensure that chemicals that will react with one another are stored in
separate cabinets. Guidance counselors may use graphs for scheduling
exams. A coach may use a graph for scheduling a tournament. And the list
goes on.
In these models, the vertices of the graph might represent people,
atoms, bus stops, or computers. The edges would represent a relationship
between the vertices. For example, the technology supervisor in a school is
trying to network all the computers in the school. He would want to draw a
model showing the layout of all the computers, represented by vertices, so
that he can find the best way to run the cables, represented by edges. Or, a
15
city planner wants to illustrate the city bus routes on a map, the stops are
represented by vertices and the connections between stops by edges. These
are just a few examples of the many problems that involve graph theory.
2.2 What is a Graph?
A graph (G) is a mathematical model consisting of a finite set of
vertices (V) and a finite set of edges (E). The vertices, represented by points,
may be connected by edges, represented by line segments. The order of a
graph is the number of vertices and the size of a graph is the number of
edges. Two vertices that are connected by an edge are said to be adjacent.
An edge is said to be incident to the vertices it connects. The vertices
adjacent to a vertex are called it neighbors. The degree (deg) of a vertex is
the number of adjacent vertices. The minimum degree of all the vertices of
the graph is noted as (). The maximum degree of all the vertices of the
graph is noted as (). A vertex that has degree equal to zero (i.e., no
neighbors) is called an isolated vertex.

16
2.3 Examples
Figure 1: Graph G
The order of graph G is 8. The size of graph G is 9. The vertices of G, V (G)
= {a, b, c, d, e, f, g, h}. The edges of G, E (G) = {ac, ae, af, ag, bc, bg, ef, fg,
gh}. Vertex d is an isolated vertex. The number of degrees of each vertex is
deg (a)=4, deg (b)=2, deg (c)=2, deg (d)=0, deg (e)=2, deg (f)=3, deg (g)=4,
deg (h)=1. The minimum degree, of G is 0. The maximum degree, of
G is 4.

17
Now, let’s begin with a problem that is often said to have been
responsible for the birth of graph theory [7]. This is a great problem to use
to introduce graph theory, not to mention boosting interest levels.
The Konigsberg Bridge Problem. The city of Konigsberg was
located on the Pregel River in Prussia. The city occupied two islands plus
areas on both banks. These regions were linked by seven bridges as shown
below. The citizens wondered whether they could leave home, cross every
bridge exactly once, and return home.
Figure 2: Konigsberg Bridge Problem
The letters represent land masses and the numbers represent each
bridge.
*Note: Students may draw the map when exploring this problem. However,
a graph should be drawn when presenting a solution to introduce them to
graph theory.

18
Figure 3: Konigsberg Bridge Solution
We use a graph to model this problem. Vertices are drawn to represent each
land mass. The lines drawn between the vertices represent bridges
connecting the respective land masses. Each time we enter and leave a land
mass we use two bridges. Thus, every vertex should be incident to an even
number of edges. This model makes it easy to see that the desired result is
not possible because all of the vertices are incident to an odd number of
edges.

19
2.4 Exercises
Use the following graph to answer the questions.
1. Name the vertex set of the graph.
2. Name the set of edges of the graph.
3. What is the order?
4. What is the size?
5. List the degrees of each vertex.
6. What is the minimum degree of the graph? the maximum degree?
7. Name at least two vertices that are adjacent to vertex a.
8. Is there an isolated vertex? If so, what is it?

20
2.5 Solutions
1. {a, b, c, d, e, f}
2. {ab, ac, ae, be, ce, ed, ef, df}
3. 6
4. 8
5. deg (a) =3, deg (b) =2, deg (c) =2, deg (d) =2, deg (e) =5, deg (f) =2
6. =2, =5
7. any two choices of either b, c, or e
8. no

21
2.6 The First Theorem
Leonhard Euler (1707-1783) was one of the most prolific
mathematicians of all time. There are many formulas and theorems with his
name attached. He is often referred to as the father of graph theory due to
the following result [2].
*Note: This is usually the first graph theory result taught to students
beginning the study of graph theory.
Theorem 2.6: In any graph G, the sum of the degrees equals twice the
number of edges.
Proof: When finding the sum of the degrees of a graph each edge is
counted twice because each end is connected to two different vertices. ٱ
From now on we will call this theorem Euler’s Theorem.

22
2.7 Examples
Figure 4: The First Theorem
Example 1: In the graph above, the degrees are as follows: deg (a) =1,
deg(b)=2, deg (c)=3, deg (d)=2. The size of the graph is 4. The sum of the
degrees equals 8. Thus, the sum of the degrees, 8, is equal to two times the
number of edges, 4.
Example 2: Party Problem – There are 5 people at a party, Joe, Kay, Lou,
Meg, and Ned. Can every person there know exactly 2 people? 3 people?
Let’s look at Figure 5:
23
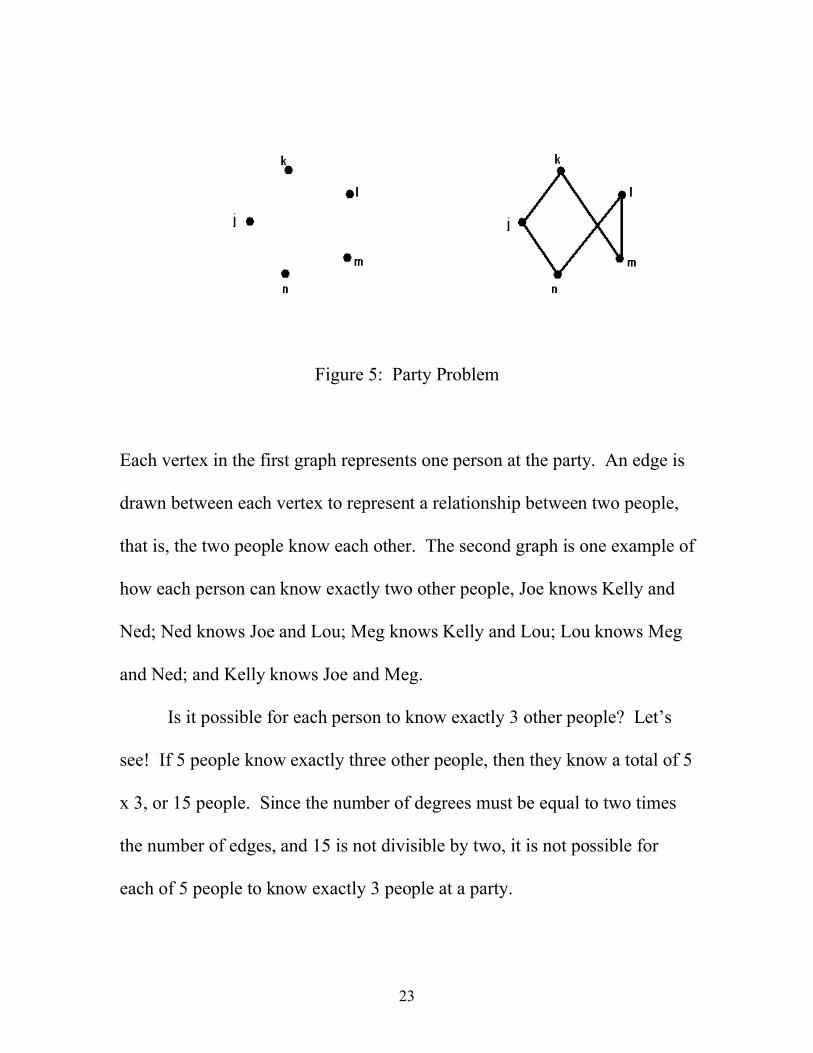
Figure 5: Party Problem
Each vertex in the first graph represents one person at the party. An edge is
drawn between each vertex to represent a relationship between two people,
that is, the two people know each other. The second graph is one example of
how each person can know exactly two other people, Joe knows Kelly and
Ned; Ned knows Joe and Lou; Meg knows Kelly and Lou; Lou knows Meg
and Ned; and Kelly knows Joe and Meg.
Is it possible for each person to know exactly 3 other people? Let’s
see! If 5 people know exactly three other people, then they know a total of 5
x 3, or 15 people. Since the number of degrees must be equal to two times
the number of edges, and 15 is not divisible by two, it is not possible for
each of 5 people to know exactly 3 people at a party.

24
2.8 Exercises
1. Use the figure above.
(a) Find the size of the graph.
(b) Find the degrees for each vertex.
(c) Demonstrate with this graph that Euler’s Theorem is true.
2. Is it possible to draw a graph with 4 vertices, each with the following
degrees: 1, 2, 3, 3? Explain.
3. You are at a birthday party. There are seven children at the party. Is it
possible for each child to know exactly five children?
25
2.9 Solutions
1. (a) 6
(b) deg (a)=3, deg (b)=3, deg (c)=1, deg (d)=2, deg (e)=3
(c) The sum of the degrees is 12 and the number of edges is 6. The sum
of the degrees of any graph is equal to twice the number of edges.
12 = 2(6)
12 = 12
2. No, a graph with vertices with degrees of 1, 2, 3, 3 has a sum of 9. Nine
is not divisible by two and therefore will not form a graph.
3. According to Euler’s Theorem, the sum of the degrees is equal to twice
the number of edges. The sum must be an even number. In this case 7 x 5 =
35, an odd number, therefore it is not possible for seven children to each
know exactly five children at the party.
26
3 GRAPH FAMILIES
3.1 Types of Graphs
There are many classes of graphs. In this section we will study some
that are encountered more frequently. Let’s begin with some basic types of
graphs.
A u-v walk in a graph is an alternating sequence of vertices and edges
beginning at one vertex and ending at another. In a walk, it is only
necessary to list the vertices since the edge connects the two. Vertices and
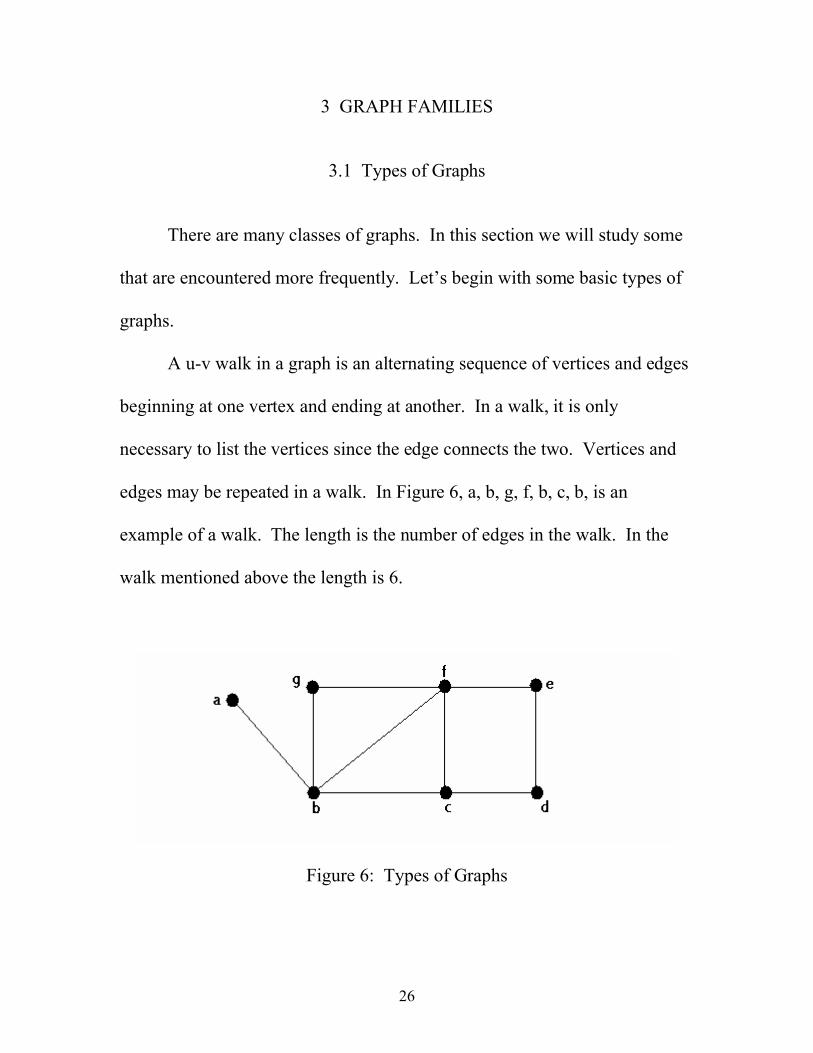
edges may be repeated in a walk. In Figure 6, a, b, g, f, b, c, b, is an
example of a walk. The length is the number of edges in the walk. In the
walk mentioned above the length is 6.
Figure 6: Types of Graphs
27
A trail is a walk in which no edge is repeated. Note that vertices may
be repeated. In Figure 6, a, b, f, g, b, c, f, is a trail. The vertices f and b are
repeated.
A walk in which no vertex is repeated is a path. An example of a path
in Figure 6 is g, b, f, c, d. Since an edge cannot be repeated if the two
vertices of that edge are not repeated, then a path is also a trail.
A circuit is a trail that begins and ends at the same vertex; g, b, f, c, d,
e, f, g, is a circuit. Any graph that begins and ends at the same vertex is said
to be closed. A cycle, on the other hand, is a closed path (no vertex
repeated). A cycle in Figure 6 is b, f, e, d, c, b.
Activity 1: Have students work in groups to model each of these; a
walk, trail, path, circuit, and cycle. Let students be the vertices and use
string for the edges.
Activity 2: Brainstorm real-world examples of each of these types of
graphs.
28
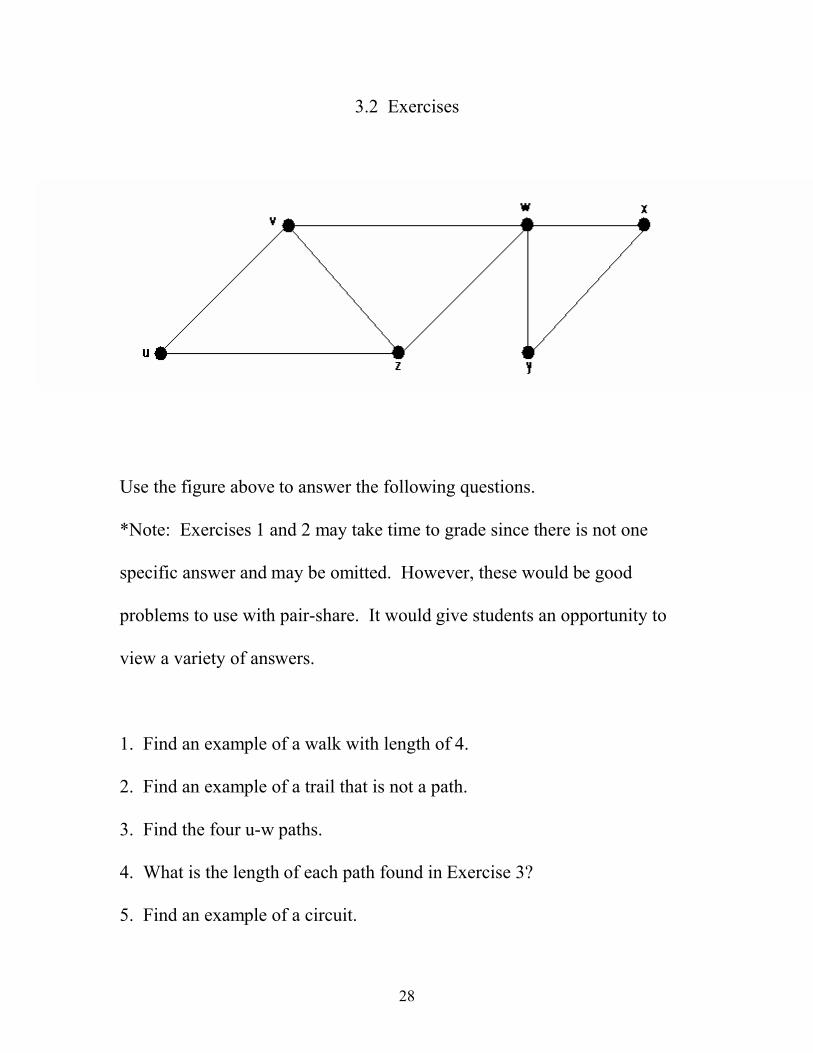
3.2 Exercises
Use the figure above to answer the following questions.
*Note: Exercises 1 and 2 may take time to grade since there is not one
specific answer and may be omitted. However, these would be good
problems to use with pair-share. It would give students an opportunity to
view a variety of answers.
1. Find an example of a walk with length of 4.
2. Find an example of a trail that is not a path.
3. Find the four u-w paths.
4. What is the length of each path found in Exercise 3?
5. Find an example of a circuit.

29
6. Find an example of a circuit that is not a cycle.
7. List all possible types of sub-graphs that describe y, x, w, v, z, w, y.
Which one best describes it?
8. List four distinct cycles.
9. Make a graph of your bus route to school. Let each stop be represented
by a vertex and the edge will be the road traveled between each stop. (If you
don’t ride a bus, draw the route you drive to school, let each vertex represent
an intersection.) Which type of graph best describes your bus route?
30
3.3 Solutions
1. Some possible answers are: u, v, z, w, y; u, z, v, w, x; u, v, w, z, u; z, v,
w, y, x; and w, z, v, w, y.
2. Some possible answers are: u, v, z, w, y, x, w; w, v, u, z, v; and z, w, y, x,
w, v.
3. u, v, w; u, z, w; u, v, z, w; and u, z, v, w.
4. 2; 2; 3; 3.
5. Some possible answers are: u, v, w, z, u; w, x, y, w; and z, u, v, w, x, y,
w, z.
6. Two examples are: z, u, v, w, x, y, w, z; and w, x, y, w, v, z.
7. A walk, trail, and circuit. A circuit best describes it.
8. u, v, w, z, u; u, v, z, u; v, w, z, v; and x, y, w, x.
9. Accept all reasonable answers. Allow students to share their graphs,
possibly by trading with a partner. Have partners check to see if the type of
graph chosen is accurate.

31
3.4 Classes of Graphs
The first graph class we will consider is a complete graph. A
complete graph is a graph with edges between all possible pairs of vertices.
This graph is called regular, which is a graph with all vertices having the
same number of degrees. A complete graph is denoted by Kn, where n is the
number of vertices.
Figure 7: Complete Graphs
Problem: Four students are working together on an experiment for science
class. The experiment consists of testing the life of four different brands of
batteries. Each student must call every other student in the group to report

32
their results. How many phone calls will take place? Construct a graph to
model these results.
Solution: The result would be the graph K4. The vertices would represent
each group member and the edges would represent the phone calls, thus a
total of six phone calls would take place.
A cycle, defined earlier in Section 3.1, is denoted by Cn, where n is
equal to the number of vertices. The cycle C5 is shown in the figure below.
Figure 8: Cycle
Problem: A basketball coach has seven members on her team. In case of a
schedule change, the coach created a phone plan that would inform everyone
on the team. The coach calls the first player on the roster, player one calls
the second player, and so on, and the last player calls the coach so she knows
everyone has been informed. How many phone calls take place? Draw a
cycle to model the plan. What kind of cycle is this?

33
Solution: Eight phone calls would take place, the coach and seven players
each make a call. The graph formed would be a C8.
The next graph we will look at is the path. A path with n vertices is
denoted by Pn. The path P4 is found below.
Figure 9: Path
Problem: Suzi collects attendance folders for the 7th grade every morning
and takes them to the office. She leaves Room 1 with the folder, and goes to
Rooms 2, 3, and 4, turns right and collects folders in Rooms 5, 6, and 7,
turns right again and goes to the office. Draw a graph of Suzi’s morning
venture. How do you denote this path?

34
Solution: The result is the path P8.
Figure 10: Path-P8
A complete bipartite graph, Km, n, is a graph whose vertex set can be
split into two different sets, A and B of order m and n, respectively. Each
vertex of set A is adjacent to each vertex in set B. No vertex is adjacent to
any other vertex in its own set. The following figure is an example of K2, 4.
Figure 11: Complete Bipartite Graph
Problem: The Reds tennis team has three players Al, Bob, and Cory. The
Blues team has four members Jeff, Ken, Mike, and Ned. Each member
plays every member of the opposing team. How many games take place?

35
Draw a graph of the match ups between teams. Write the symbol for the
graph.
Solution: Each vertex represents a player, each edge represents a match.
The graph is a K3, 4. Twelve games will take place.
Figure 12: Complete Bipartite Graph-K3, 4
The star graph is the complete bipartite graph that consists of one
vertex of degree n, while the remaining n vertices have a degree of one,
denoted by K1, n. The following figure is an example of the star graph K1, 3.
Figure 13: Star Graph

36
Problem: A school has a computer network that has one network server.
This server is linked to 6 other computers. Draw and label the graph
illustrating this network [2].
Solution: The vertex on top represents the network server. The six vertices
on the bottom represent the computers. This is the star graph, K1, 6.
Figure 14: Star Graph-K1, 6
The next graph we will discuss is the wheel. The wheel is a combination of
a star graph and a complete graph. The wheel, W1, n, is the star graph K1, n
and the complete graph Cn. The wheel has one vertex in the middle
connected to n vertex points surrounding it on the outside, like a star graph.
The outer vertex points are also connected to one another like a cycle. The
following figure is the wheel W1, 5.
37
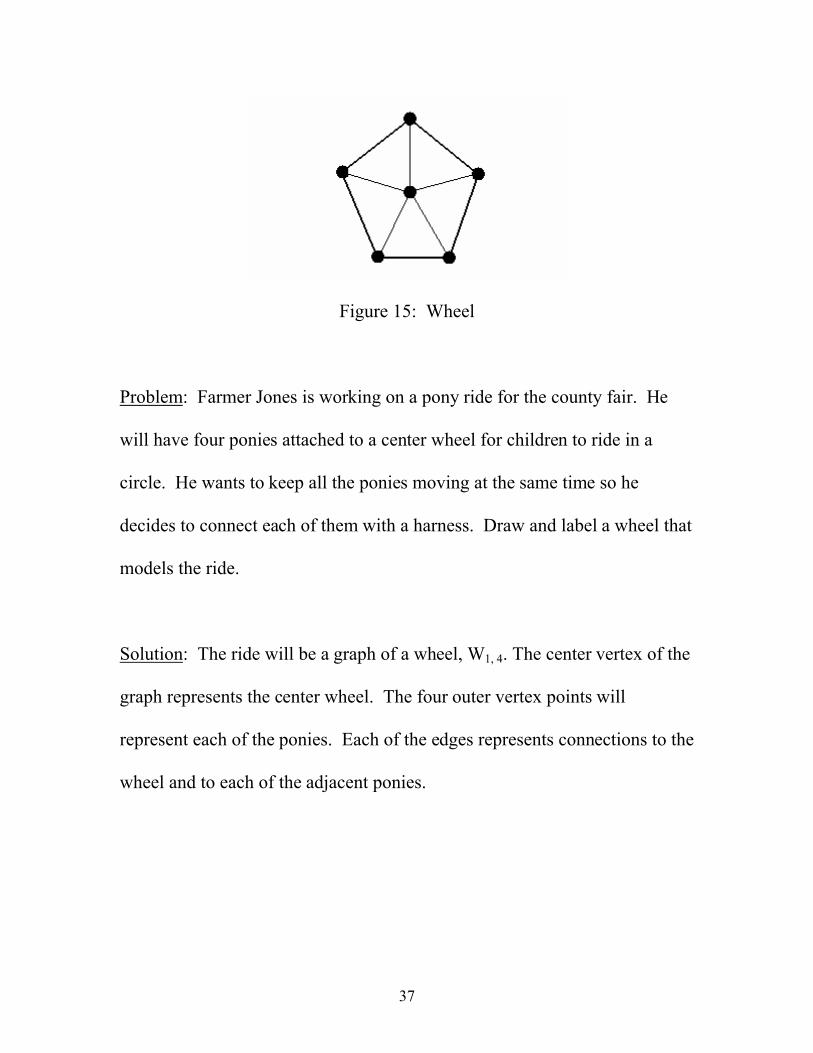
Figure 15: Wheel
Problem: Farmer Jones is working on a pony ride for the county fair. He
will have four ponies attached to a center wheel for children to ride in a
circle. He wants to keep all the ponies moving at the same time so he
decides to connect each of them with a harness. Draw and label a wheel that
models the ride.
Solution: The ride will be a graph of a wheel, W1, 4. The center vertex of the
graph represents the center wheel. The four outer vertex points will
represent each of the ponies. Each of the edges represents connections to the
wheel and to each of the adjacent ponies.
38
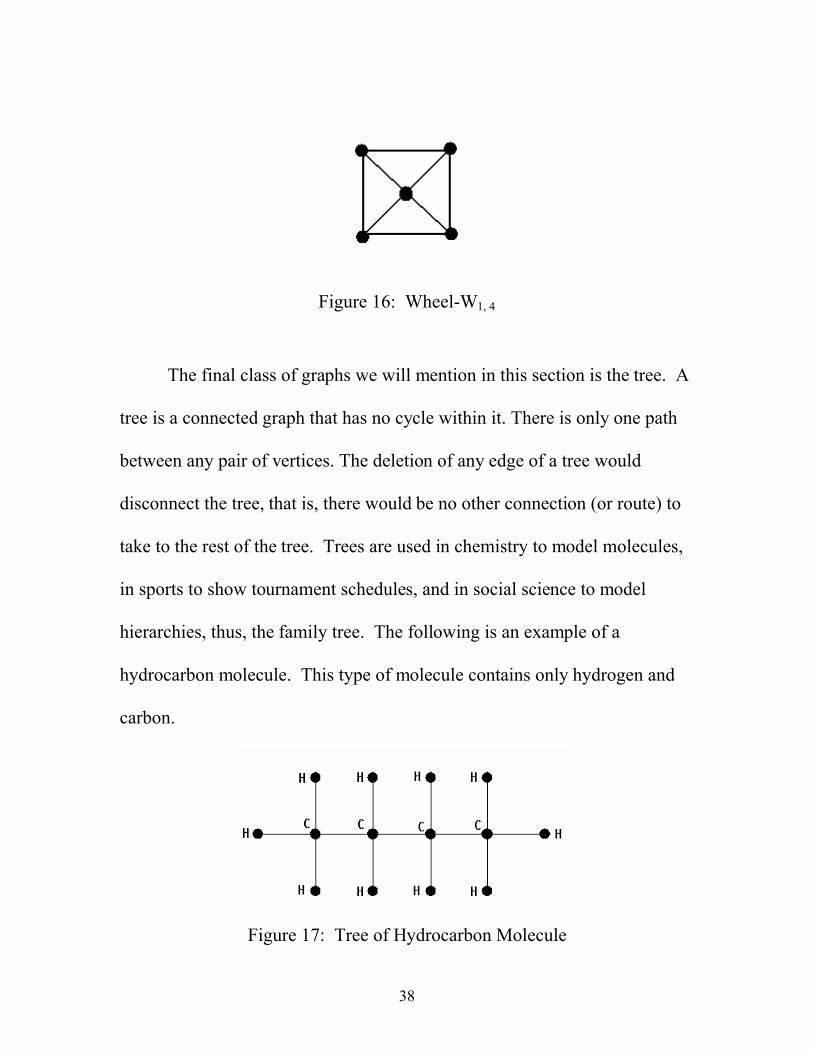
Figure 16: Wheel-W1, 4
The final class of graphs we will mention in this section is the tree. A
tree is a connected graph that has no cycle within it. There is only one path
between any pair of vertices. The deletion of any edge of a tree would
disconnect the tree, that is, there would be no other connection (or route) to
take to the rest of the tree. Trees are used in chemistry to model molecules,
in sports to show tournament schedules, and in social science to model
hierarchies, thus, the family tree. The following is an example of a
hydrocarbon molecule. This type of molecule contains only hydrogen and
carbon.
Figure 17: Tree of Hydrocarbon Molecule

39
Problem: North High School is conducting a softball tournament this
weekend. Eight teams will compete in a single elimination tournament (only
the winner advances). Draw a graph that would show the tournament
schedule.
Solution: Each vertex would represent a team, labeled a, b, c, d, e, f, g, and
h. Edges represent advancement to the next level of play.
Figure 18: Softball Tournament

40
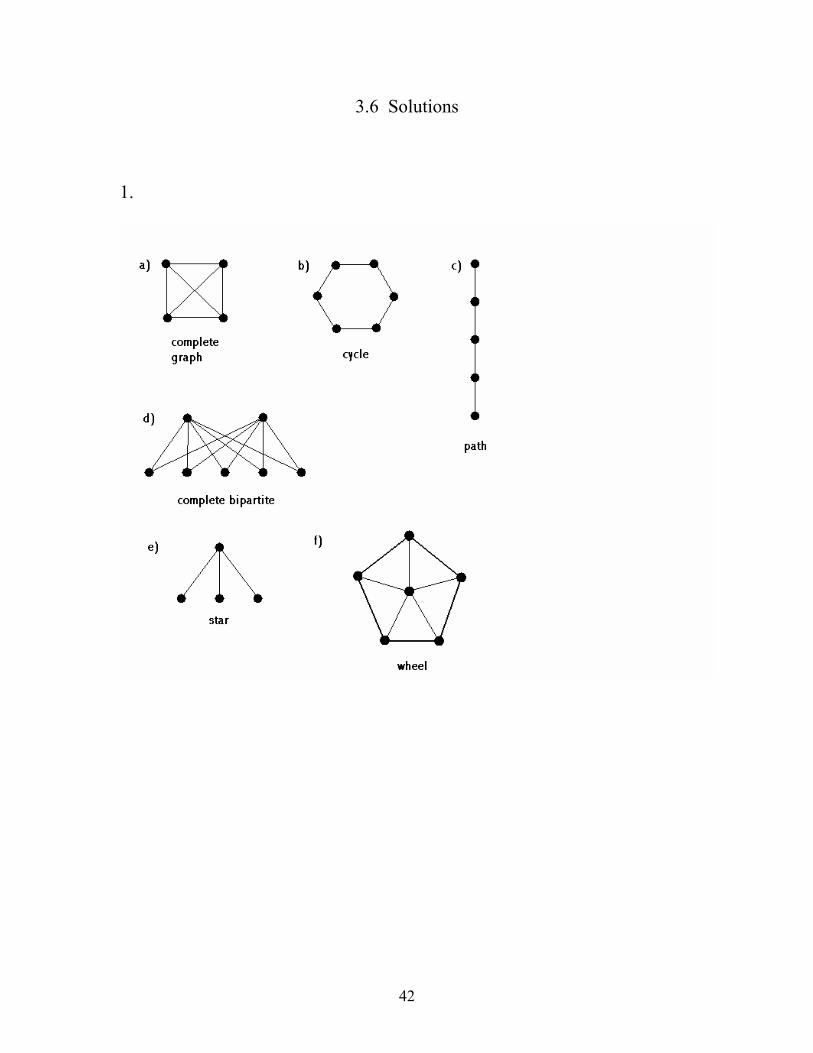
3.5 Exercises
1. Draw each of the following and name the type of graph.
a) K4 b) C6 c) P5 d) K2, 5 e) K1, 3 f) W1, 5
2. How many biological great-great grandparents do you have? Names are
unimportant. Construct a tree to illustrate the hierarchy.
3. There are four girls at a party: Jan, Kim, Lacy, and Mae. There are also
five boys at this same party: Bill, Chad, Dave, Eli, and Fred. If every girl
dances with every boy at the party exactly one time, how many dances will
take place? Draw a graph to model the outcome. Name and label the graph.
4. Mrs. Smiths’ advisory class is playing the game Pass It On (the first
person whispers a secret to her neighbor who in turn whispers the secret to
the next person, and so on, until the last person retells the secret to the
student who started it). There are eight students in the group. Draw, name,
and label a graph to model the secret passing.
5. At the beginning of the school year the student council presidents of the
four county middle schools meet to discuss countywide projects for the year.
Each president introduces themselves to every other president. How many
introductions take place? Draw, name, and label a graph to model the
introductions.
41
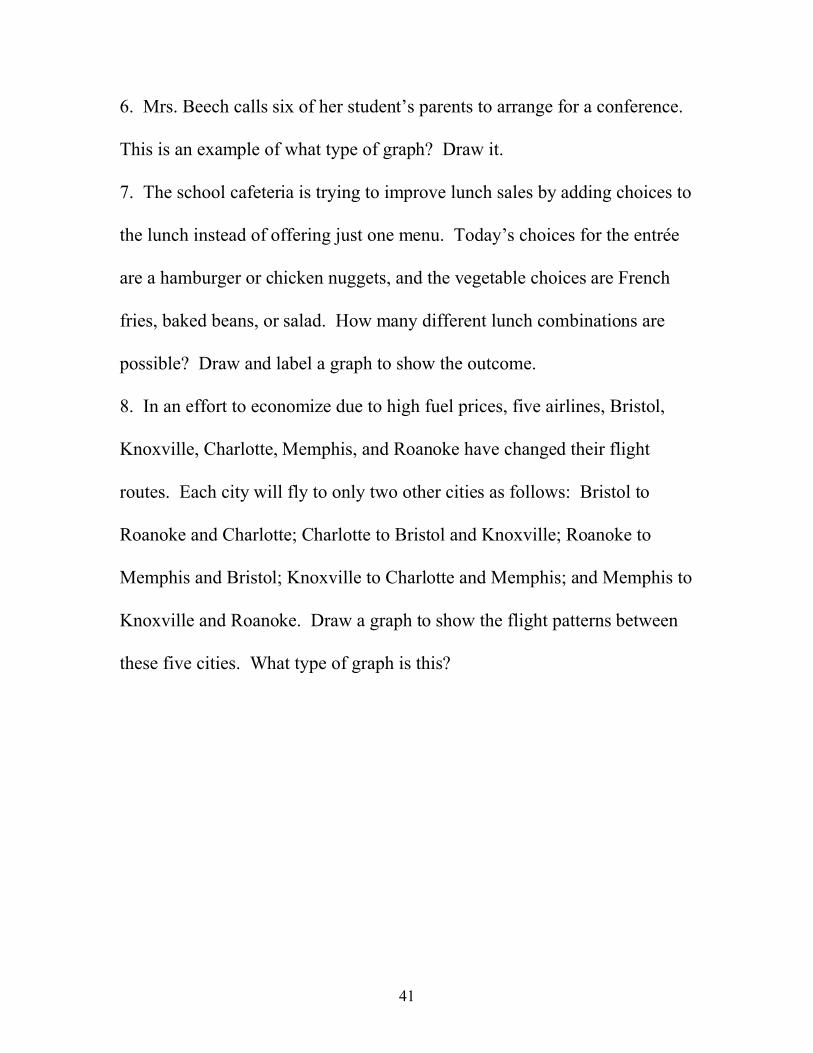
6. Mrs. Beech calls six of her student’s parents to arrange for a conference.
This is an example of what type of graph? Draw it.
7. The school cafeteria is trying to improve lunch sales by adding choices to
the lunch instead of offering just one menu. Today’s choices for the entrée
are a hamburger or chicken nuggets, and the vegetable choices are French
fries, baked beans, or salad. How many different lunch combinations are
possible? Draw and label a graph to show the outcome.
8. In an effort to economize due to high fuel prices, five airlines, Bristol,
Knoxville, Charlotte, Memphis, and Roanoke have changed their flight
routes. Each city will fly to only two other cities as follows: Bristol to
Roanoke and Charlotte; Charlotte to Bristol and Knoxville; Roanoke to
Memphis and Bristol; Knoxville to Charlotte and Memphis; and Memphis to
Knoxville and Roanoke. Draw a graph to show the flight patterns between
these five cities. What type of graph is this?
42
3.6 Solutions
1.
43
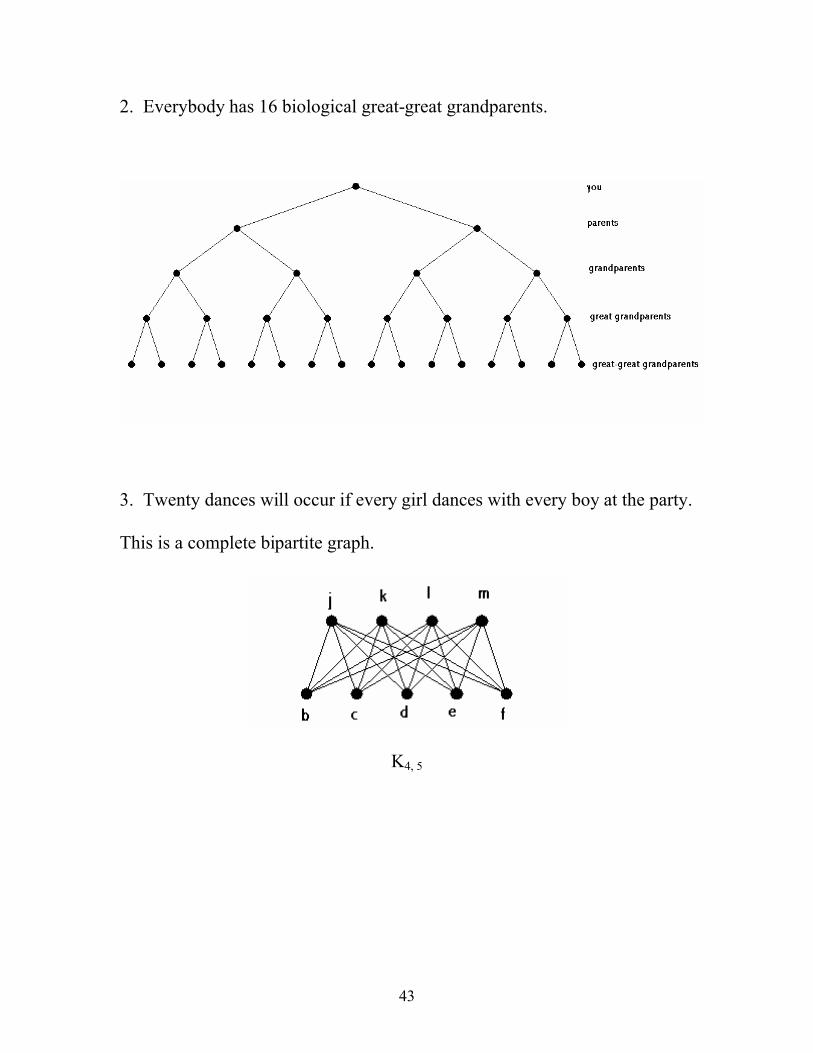
2. Everybody has 16 biological great-great grandparents.
3. Twenty dances will occur if every girl dances with every boy at the party.
This is a complete bipartite graph.
K4, 5
44
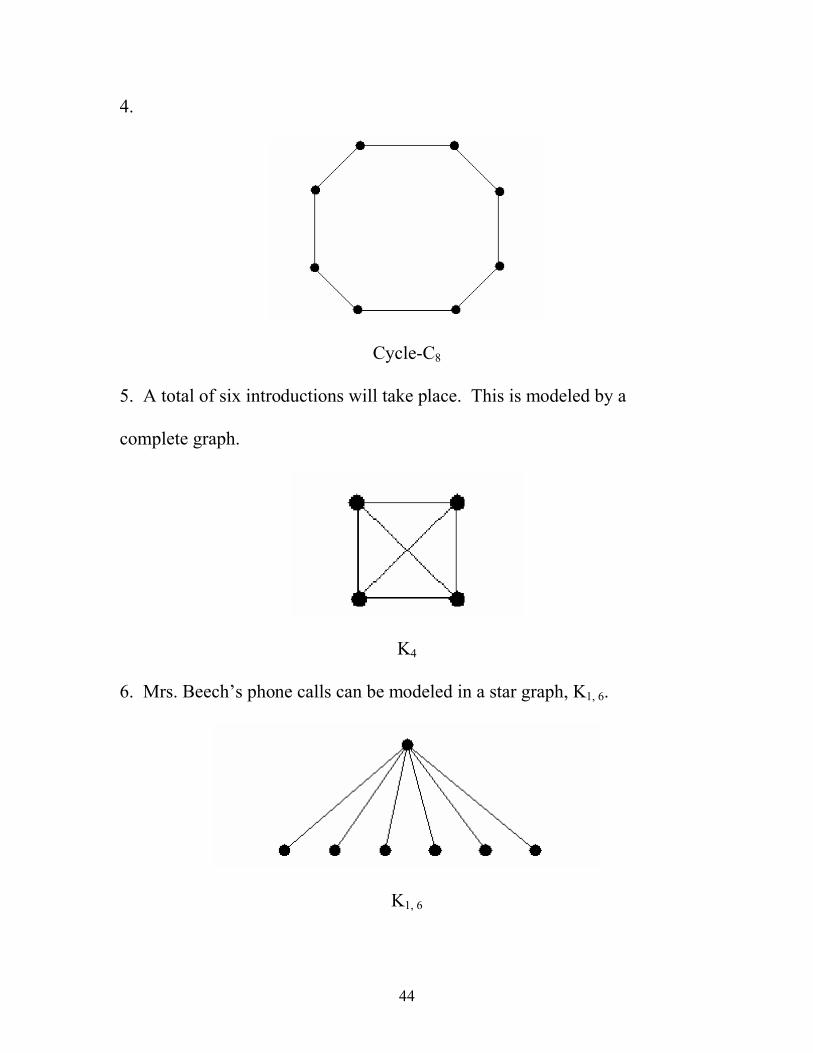
4.
Cycle-C8
5. A total of six introductions will take place. This is modeled by a
complete graph.
K4
6. Mrs. Beech’s phone calls can be modeled in a star graph, K1, 6.
K1, 6

45
7. The lunchroom is serving a total of six different choices for lunch.
K2, 3
8. The flight patterns between the cities of Bristol, Charlotte, Roanoke,
Knoxville, and Memphis can be modeled with a cycle, C5.
C5
46
4 GRAPH OPERATIONS
Now that we know some of the different types of graphs, let’s look at
combining graphs. In this section, we will look at different operations that
can be performed on graphs.
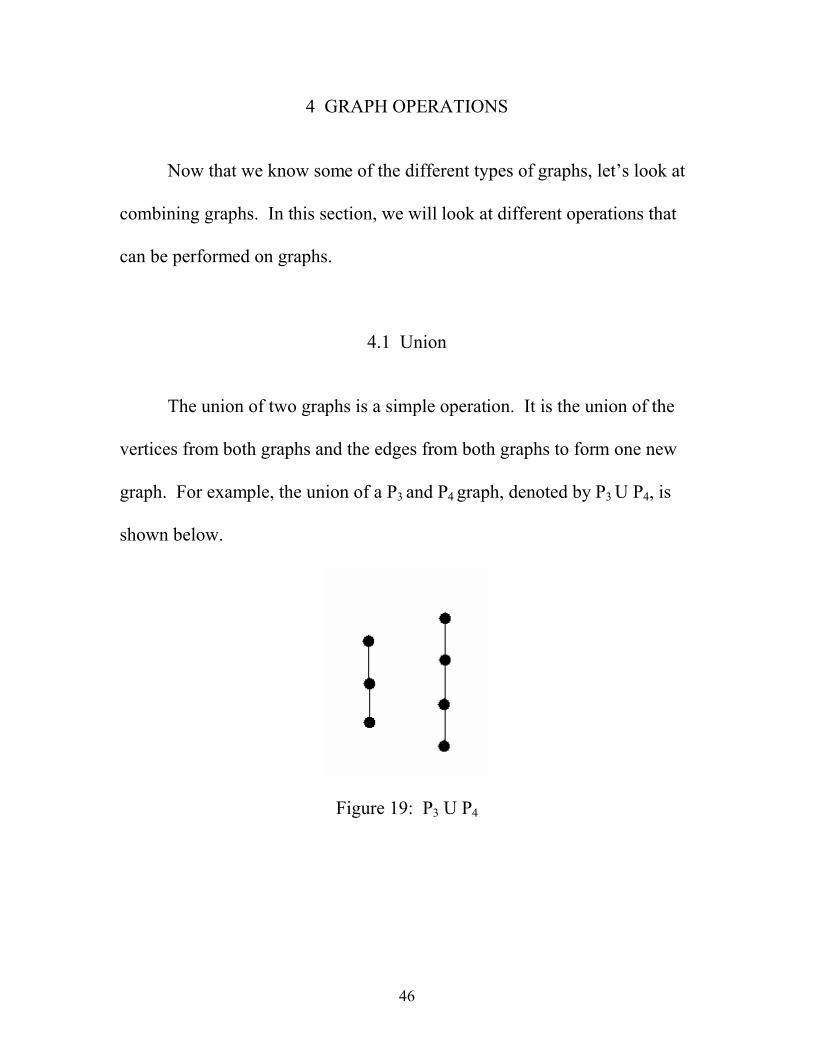
4.1 Union
The union of two graphs is a simple operation. It is the union of the
vertices from both graphs and the edges from both graphs to form one new
graph. For example, the union of a P3 and P4 graph, denoted by P3 U P4, is
shown below.
Figure 19: P3 U P4
47
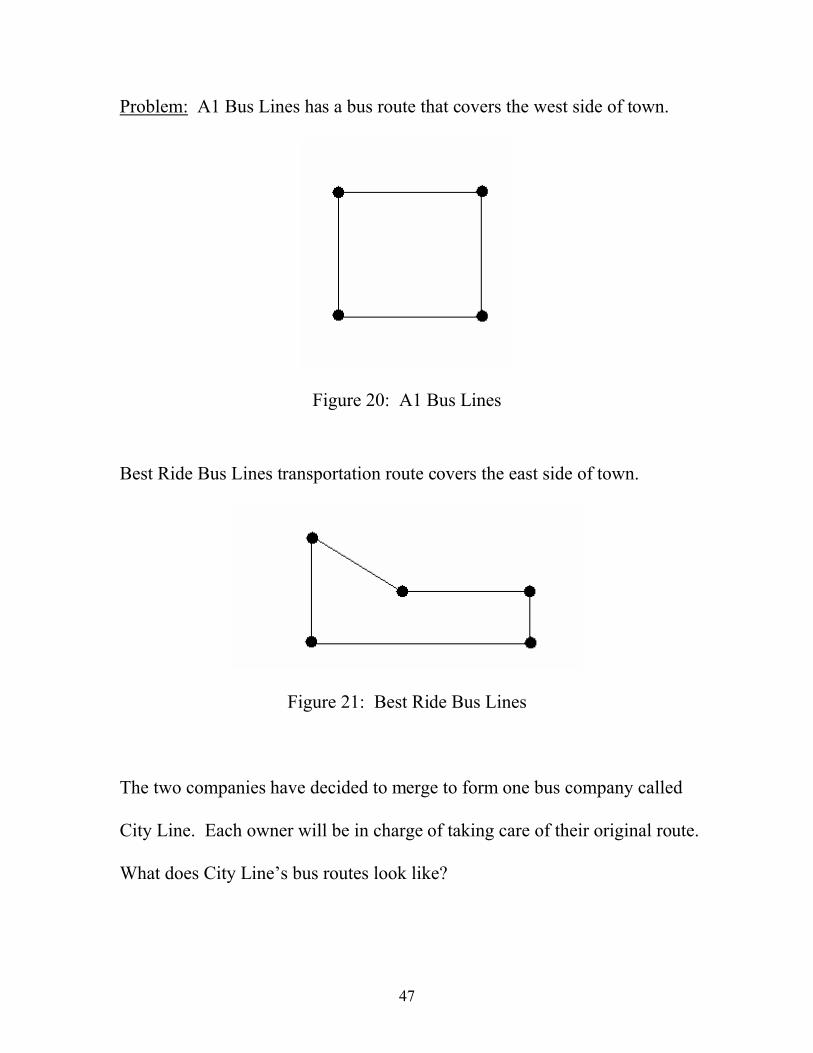
Problem: A1 Bus Lines has a bus route that covers the west side of town.
Figure 20: A1 Bus Lines
Best Ride Bus Lines transportation route covers the east side of town.
Figure 21: Best Ride Bus Lines
The two companies have decided to merge to form one bus company called
City Line. Each owner will be in charge of taking care of their original route.
What does City Line’s bus routes look like?

48
Solution: The merge of the two companies in this case will constitute a
union of the two bus routes.
Figure 22: City Line
49
4.2 Join
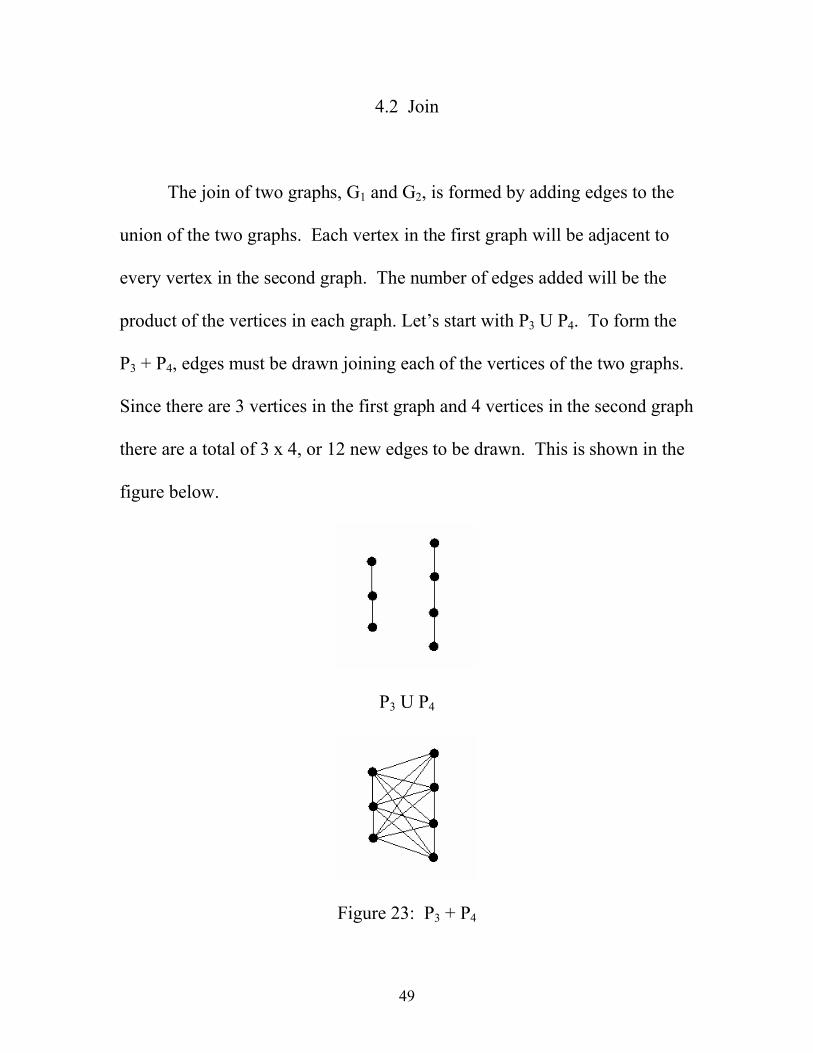
The join of two graphs, G1 and G2, is formed by adding edges to the
union of the two graphs. Each vertex in the first graph will be adjacent to
every vertex in the second graph. The number of edges added will be the
product of the vertices in each graph. Let’s start with P3 U P4. To form the
P3 + P4, edges must be drawn joining each of the vertices of the two graphs.
Since there are 3 vertices in the first graph and 4 vertices in the second graph
there are a total of 3 x 4, or 12 new edges to be drawn. This is shown in the
figure below.
P3 U P4
Figure 23: P3 + P4
50
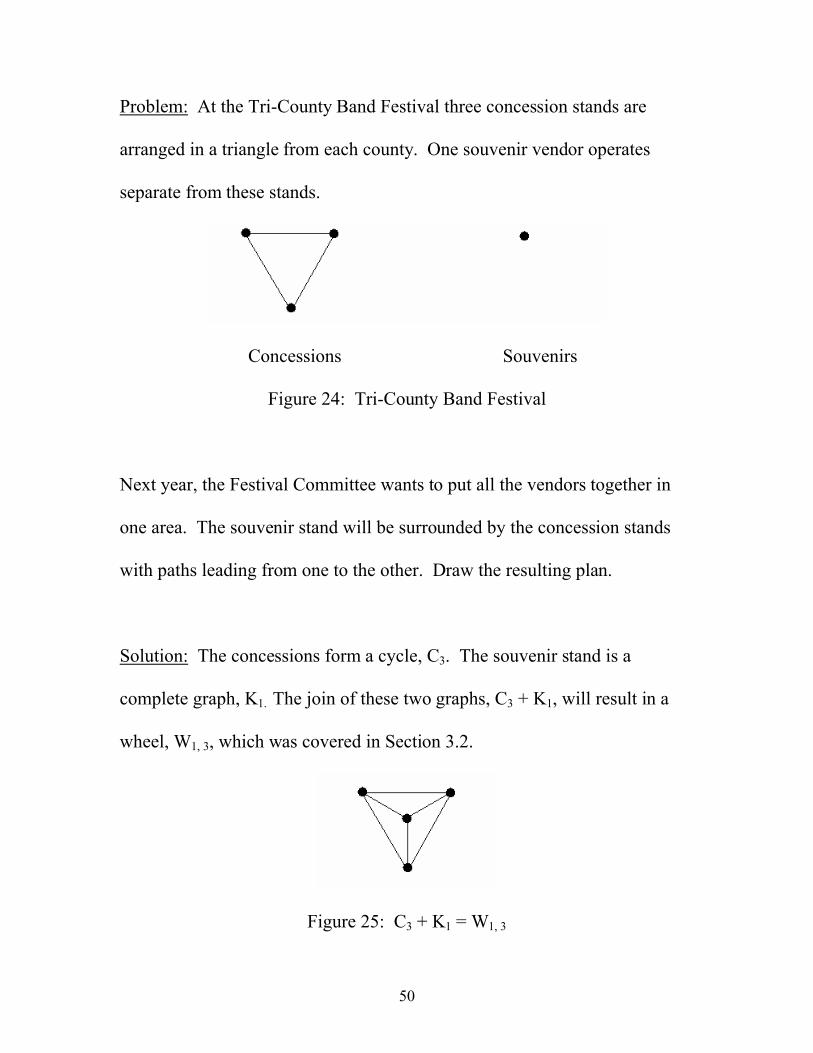
Problem: At the Tri-County Band Festival three concession stands are
arranged in a triangle from each county. One souvenir vendor operates
separate from these stands.
Concessions Souvenirs
Figure 24: Tri-County Band Festival
Next year, the Festival Committee wants to put all the vendors together in
one area. The souvenir stand will be surrounded by the concession stands
with paths leading from one to the other. Draw the resulting plan.
Solution: The concessions form a cycle, C3. The souvenir stand is a
complete graph, K1. The join of these two graphs, C3 + K1, will result in a
wheel, W1, 3, which was covered in Section 3.2.
Figure 25: C3 + K1 = W1, 3
51
4.3 Deletion
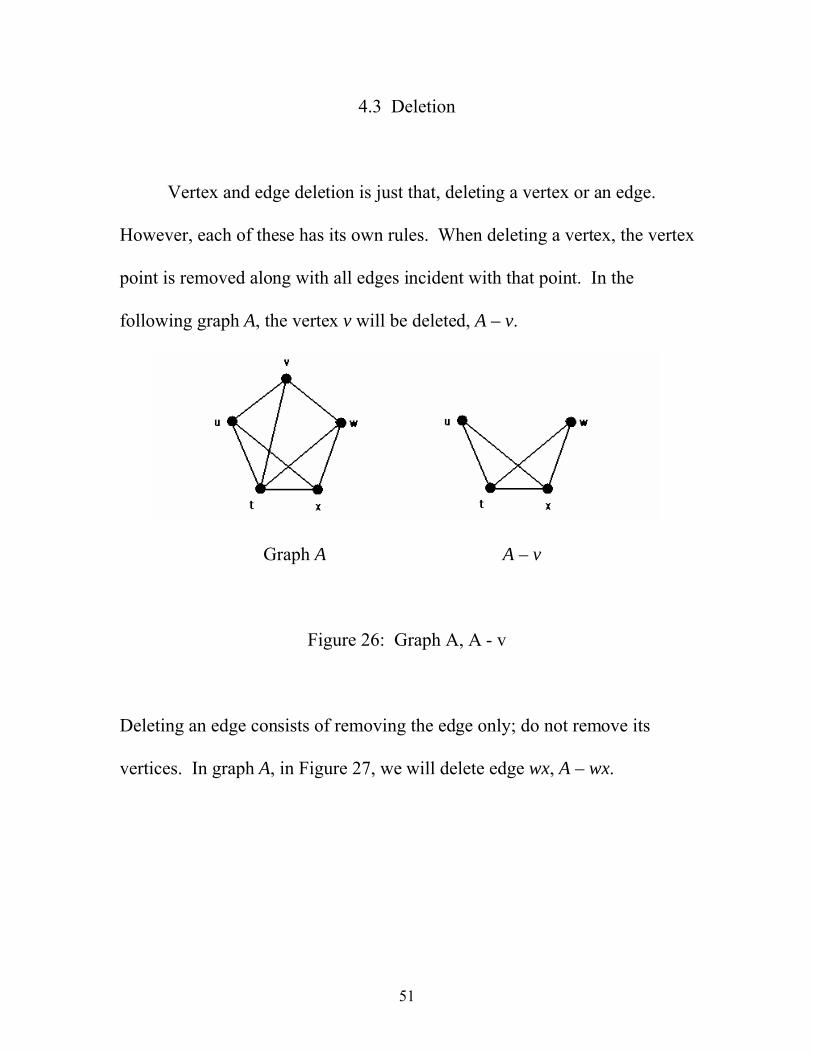
Vertex and edge deletion is just that, deleting a vertex or an edge.
However, each of these has its own rules. When deleting a vertex, the vertex
point is removed along with all edges incident with that point. In the
following graph A, the vertex v will be deleted, A – v.
Graph A A – v
Figure 26: Graph A, A - v
Deleting an edge consists of removing the edge only; do not remove its
vertices. In graph A, in Figure 27, we will delete edge wx, A – wx.

52
Graph A A – wx
Figure 27: Graph A, A - wx
Problem: Four teams participated in a recent basketball tournament. Each
of the four teams played all of the other four teams. For the next tournament,
one of the teams will not be able to participate so the tournament will go on
with only three teams participating. Draw a graph of the original tournament
and the impending tournament.
Solution: The original tournament T is a complete graph, K4. The deletion
of one team will remove a vertex and all edges associated with that vertex.
Graph T = K4 T – b
Figure 28: Graph T = K4, T - b
53
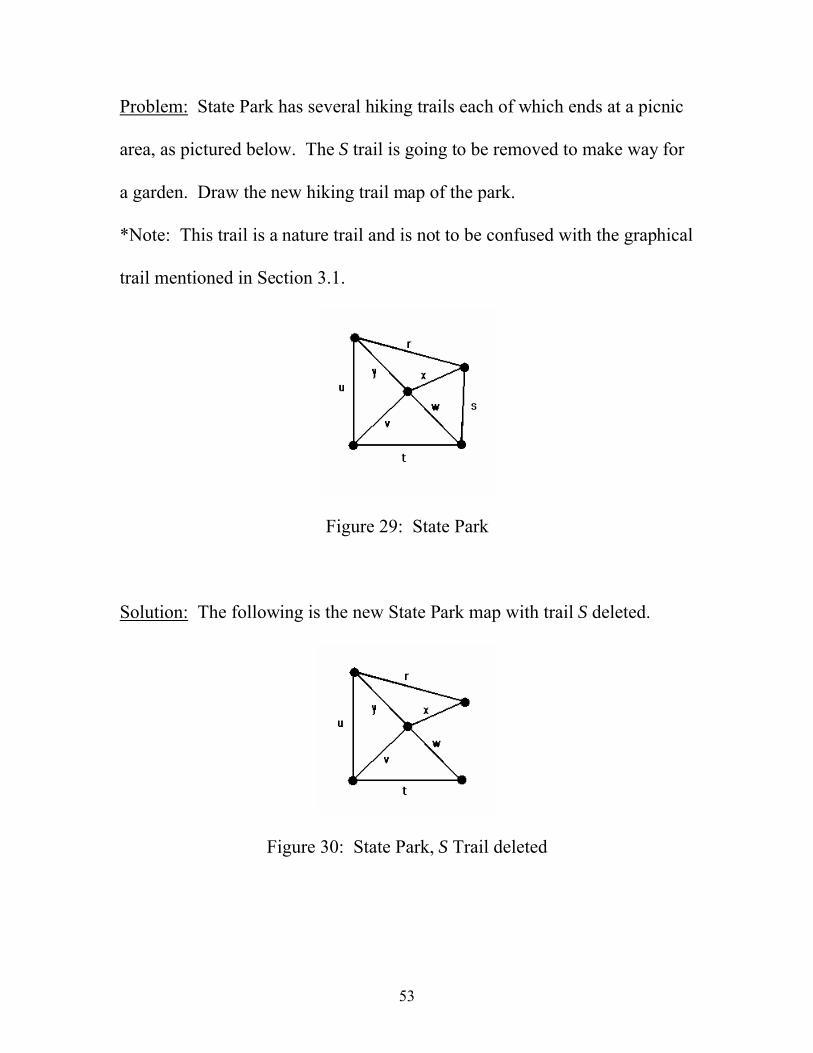
Problem: State Park has several hiking trails each of which ends at a picnic
area, as pictured below. The S trail is going to be removed to make way for
a garden. Draw the new hiking trail map of the park.
*Note: This trail is a nature trail and is not to be confused with the graphical
trail mentioned in Section 3.1.
Figure 29: State Park
Solution: The following is the new State Park map with trail S deleted.
Figure 30: State Park, S Trail deleted

54
4.4 Edge Contraction
Edge contraction is the contracting of two vertices and two edges into
one vertex and one edge. Let uv be an edge in graph G below. The graph
G/uv is the graph obtained from G by removing u and v, as well as any
edges incident with them. Then a new vertex, uv, is inserted. The vertex uv
is then made adjacent to each vertex that was adjacent to u or v.
Graph G Graph G/uv
Figure 31: Graph G, Graph G/uv
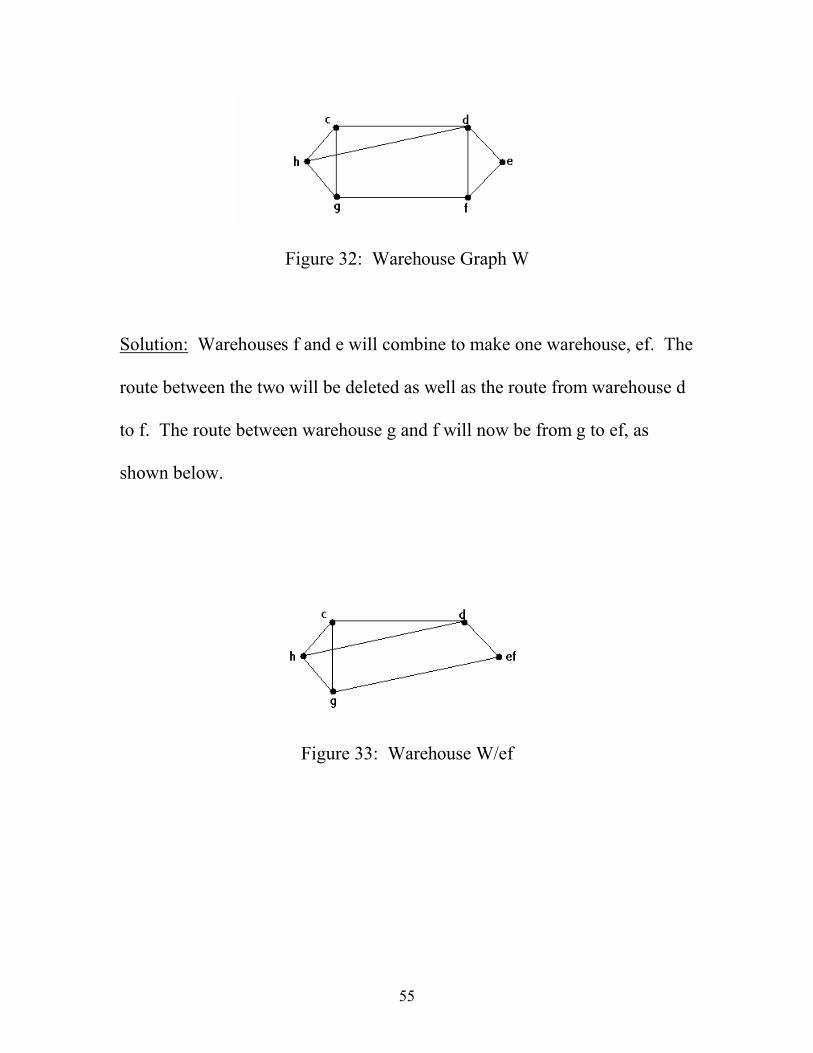
Problem: Six warehouses ship products between them for distribution to
retail stores in the immediate region of the warehouse. The trade routes are
shown below in graph W. Warehouse f recently had a fire and had to move
its headquarters to warehouse e where the two will share distribution
temporarily. Construct a graph showing the new warehouse distribution
routes.
55
Figure 32: Warehouse Graph W
Solution: Warehouses f and e will combine to make one warehouse, ef. The
route between the two will be deleted as well as the route from warehouse d
to f. The route between warehouse g and f will now be from g to ef, as
shown below.
Figure 33: Warehouse W/ef
56
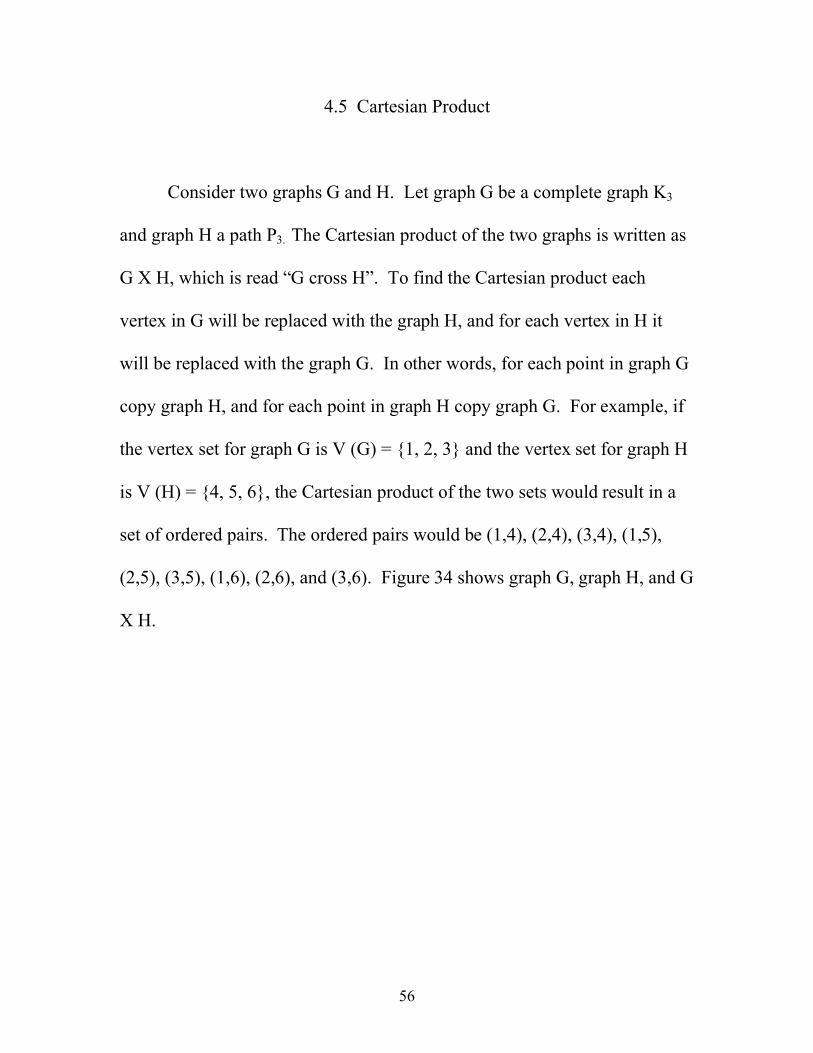
4.5 Cartesian Product
Consider two graphs G and H. Let graph G be a complete graph K3
and graph H a path P3. The Cartesian product of the two graphs is written as
G X H, which is read “G cross H”. To find the Cartesian product each
vertex in G will be replaced with the graph H, and for each vertex in H it
will be replaced with the graph G. In other words, for each point in graph G
copy graph H, and for each point in graph H copy graph G. For example, if
the vertex set for graph G is V (G) = {1, 2, 3} and the vertex set for graph H
is V (H) = {4, 5, 6}, the Cartesian product of the two sets would result in a
set of ordered pairs. The ordered pairs would be (1,4), (2,4), (3,4), (1,5),
(2,5), (3,5), (1,6), (2,6), and (3,6). Figure 34 shows graph G, graph H, and G
X H.
57
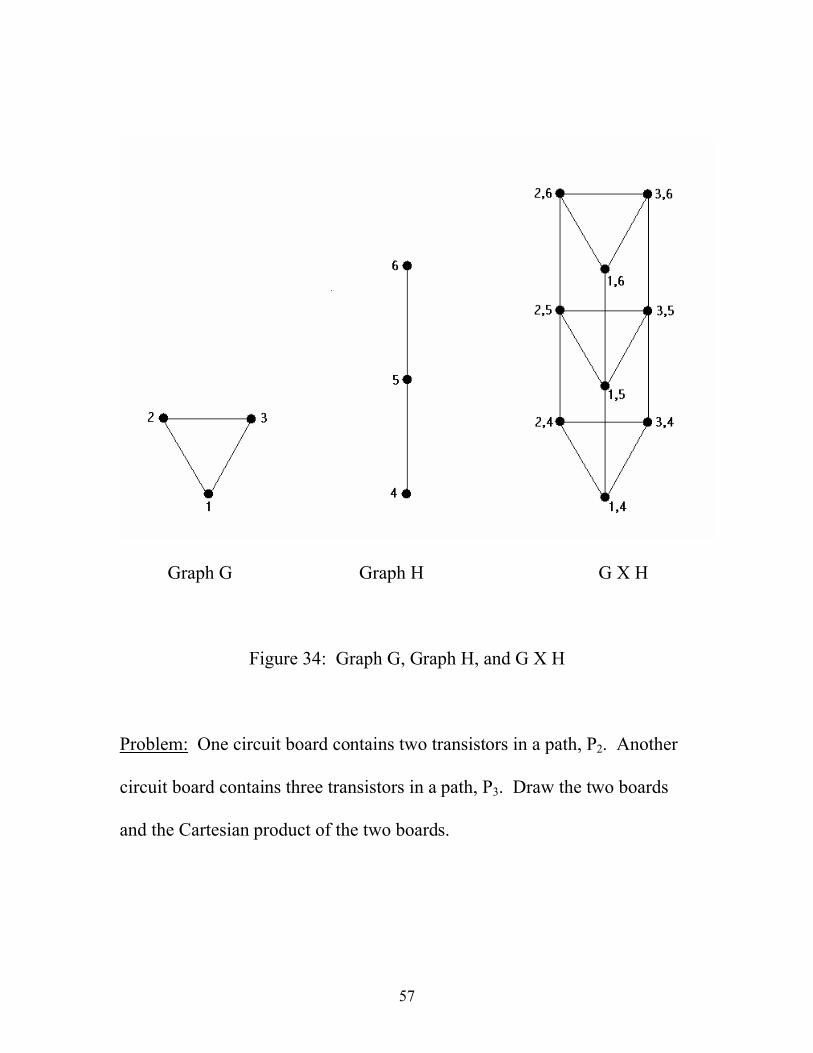
Graph G Graph H G X H
Figure 34: Graph G, Graph H, and G X H
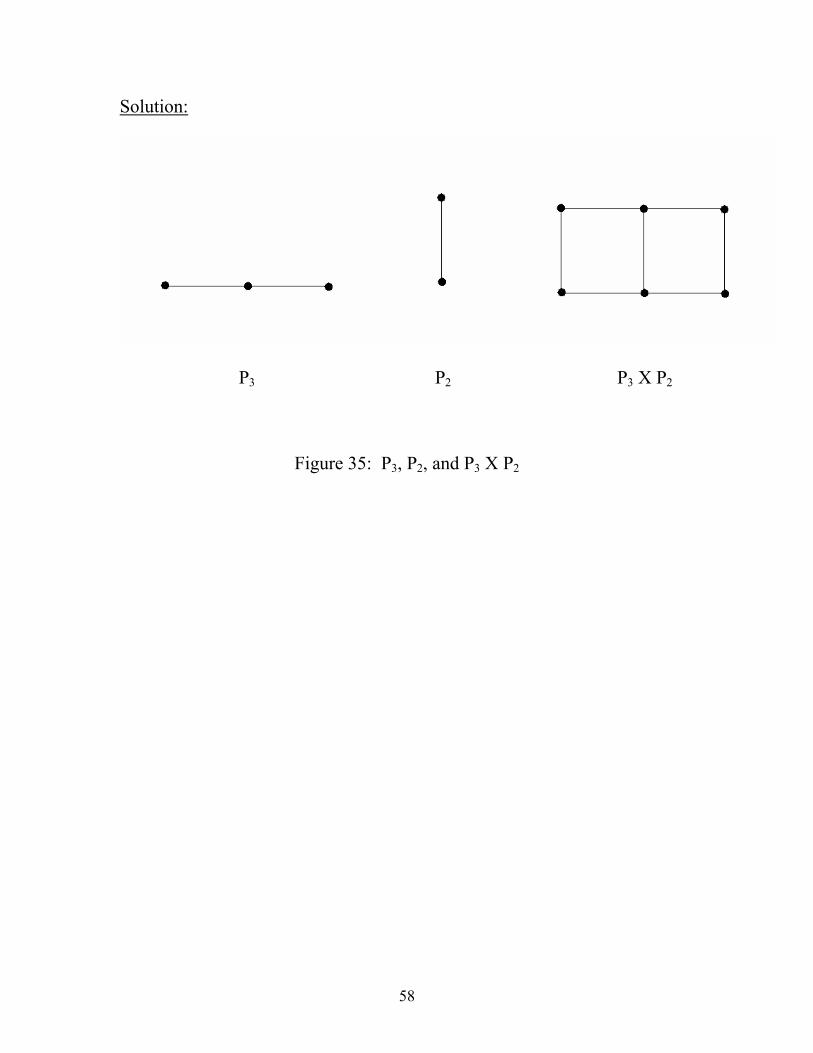
Problem: One circuit board contains two transistors in a path, P2. Another
circuit board contains three transistors in a path, P3. Draw the two boards
and the Cartesian product of the two boards.
58
Solution:
P3 P2 P3 X P2
Figure 35: P3, P2, and P3 X P2
59
4.6 Exercises
1. Draw the union of C4 and K2.
2. Join a P4 and K1.
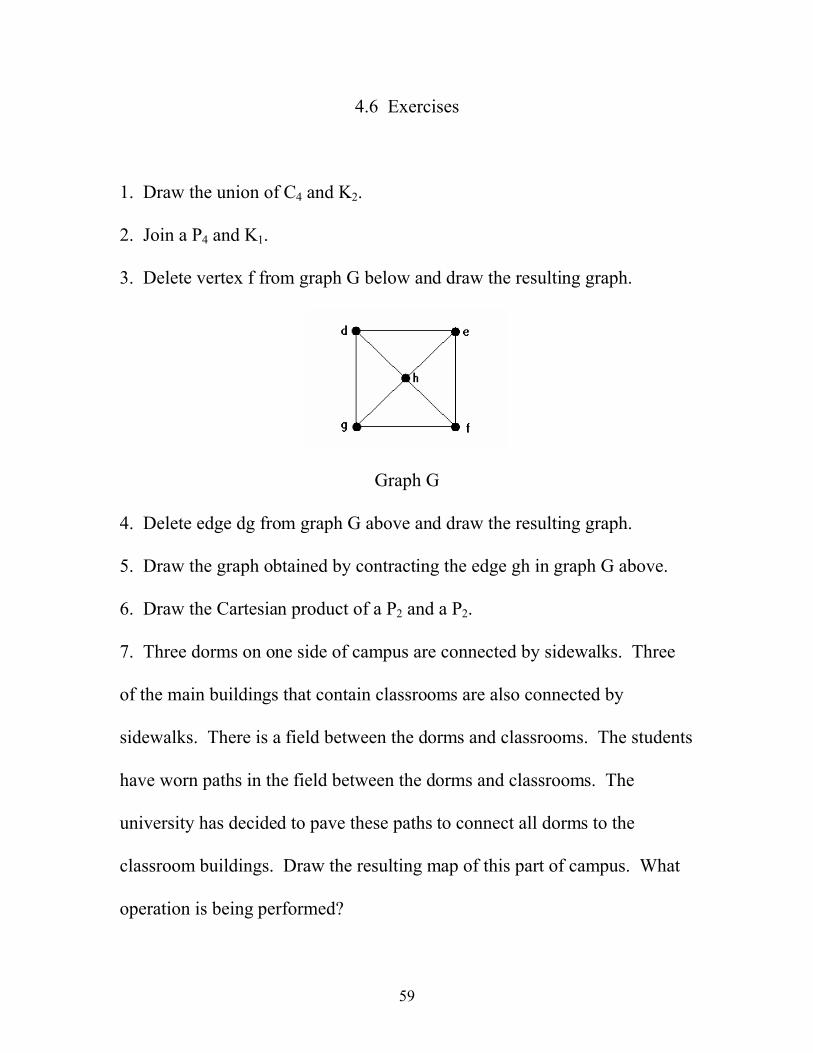
3. Delete vertex f from graph G below and draw the resulting graph.
Graph G
4. Delete edge dg from graph G above and draw the resulting graph.
5. Draw the graph obtained by contracting the edge gh in graph G above.
6. Draw the Cartesian product of a P2 and a P2.
7. Three dorms on one side of campus are connected by sidewalks. Three
of the main buildings that contain classrooms are also connected by
sidewalks. There is a field between the dorms and classrooms. The students
have worn paths in the field between the dorms and classrooms. The
university has decided to pave these paths to connect all dorms to the
classroom buildings. Draw the resulting map of this part of campus. What
operation is being performed?
60
8. A mall is in the shape of a W1, 5 with a food court in the middle and
hallways leading out to each vertex and around the exterior. One of the
exterior hallways is closed for maintenance. Draw an example of the mall
access with the deletion of an exterior hallway.
9. A basketball coach has a phone tree to call his players about snow
schedule changes. There are five players on the team: Al, Bob, Con, Dan,
and Ed. On this particular day Ed is at Dan’s house when the calls go out.
Draw the graph (originally a C6) of the phone calls. What operation is
taking place?
10. A foot bridge in an area office building is being repaired. The company
that owns the building wants it to have lots of support. One drawing calls
for an extra beam that looks like a P2. The other drawing calls for beams in
the shape of a K3. The company decides it likes both and wants the
contractor to use them both. Draw the Cartesian product of these two graphs
to show the extra support added to the bridge.

61
4.7 Solutions
1.
C4 U K2
2.
P4 + K1
3.
G – f

62
4.
G – dg
5.
Graph G/gh
6.
P2 P2 P2 X P2 = C4

63
7. The graph is the result of the join of a P3 and a P3.
P3 + P3
8. This is one example. Any of the exterior edges may be deleted.
9. The graph P below is the result of an edge contraction.
Graph P/de

64
10.
K3 P2
K3 X P2

65
5 GRAPH COLORING
Graph coloring is used in solving problems that may involve conflicts,
or items that need to be separated. Some examples might include scheduling
classes or exams, separating chemicals in a lab, or separating animals in a
zoo. Graph coloring may also be used to color maps to separate distinct
countries. In this section we are going to focus on vertex and map coloring,
beginning with vertex coloring.
5.1 Vertex coloring
Vertex coloring is an assignment of colors to the vertices so that
adjacent vertices have distinct colors. For example, the vertex coloring of a
W1, 4 is shown in the graph below. Let r = red, b = blue, and g = green.
Figure 36: Vertex coloring of W1, 4
66
Notice that no adjacent vertices have been labeled with the same color. For
the coloring of this wheel only three colors were used. The chromatic
number of a graph is the minimum number of colors needed to color the
vertices of the graph. The chromatic number will be denoted by .
5.2 Examples
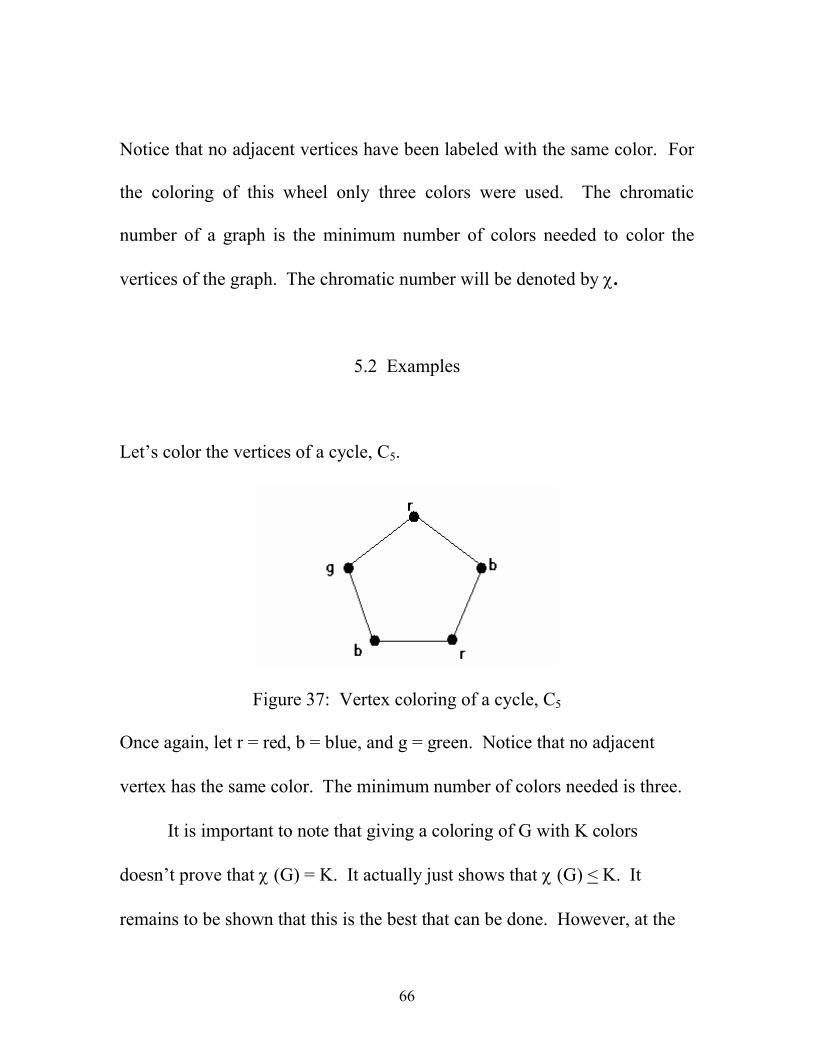
Let’s color the vertices of a cycle, C5.
Figure 37: Vertex coloring of a cycle, C5
Once again, let r = red, b = blue, and g = green. Notice that no adjacent
vertex has the same color. he minimum number of colors needed is three.
It is important to note that giving a coloring of G with K colors
doesn’t prove that (G) = K. It actually just shows that (G) < K. It
remains to be shown that this is the best that can be done. However, at the

67
7th and 8th grade level we will just let the students try to find the minimum,
without proof. For example, a student could color a C6 with six colors and
have a proper coloring, but this clearly is not the minimum.
Now, let’s see how vertex coloring can be used in solving a problem.
One way is to avoid conflicts. Each edge represents a conflict between the
vertices it connects, thus, those vertices will have a different color. Suppose
Central Middle School is trying to schedule class and club meetings.
Students sometimes belong to more than one club so the schedule must
allow for this. The schedule will allow for as many club and class meetings
as possible to meet on one day. Club day is held once a week. How many
weeks will be needed to allow each club to meet at least once? First, you
need to know the classes and clubs that will be meeting. Every student will
attend his or her grade level meeting: 6th grade Class, 7th grade Class, and 8th
grade Class. Every student may choose to be in one of the academic clubs;
Math Club or Science Club. Any student in the 7th or 8th grade may choose
to be in the Student Athlete Club. All students are eligible to join the SADD
Club.
Let’s begin with seven vertices to represent the seven clubs. Letters
and numbers have been used to identify the clubs.

68
Figure 38: Central Middle School Clubs
Edges should now be drawn between clubs that may contain some of the
same students because they cannot meet on the same day. All sixth, seventh,
and eighth graders can be members of an academic club, and SADD, so lines
must be drawn between 6, 7, and 8 and m, s, and S. Seventh and eighth
graders may be a member of the Student Athlete Club so lines must be
drawn between 7, 8, and a. Members of the academic clubs may also be
members of the other two clubs and lines must be drawn here. Also, Student
Athlete members may belong to SADD so a line must be drawn here. The
diagram would look like this:

69
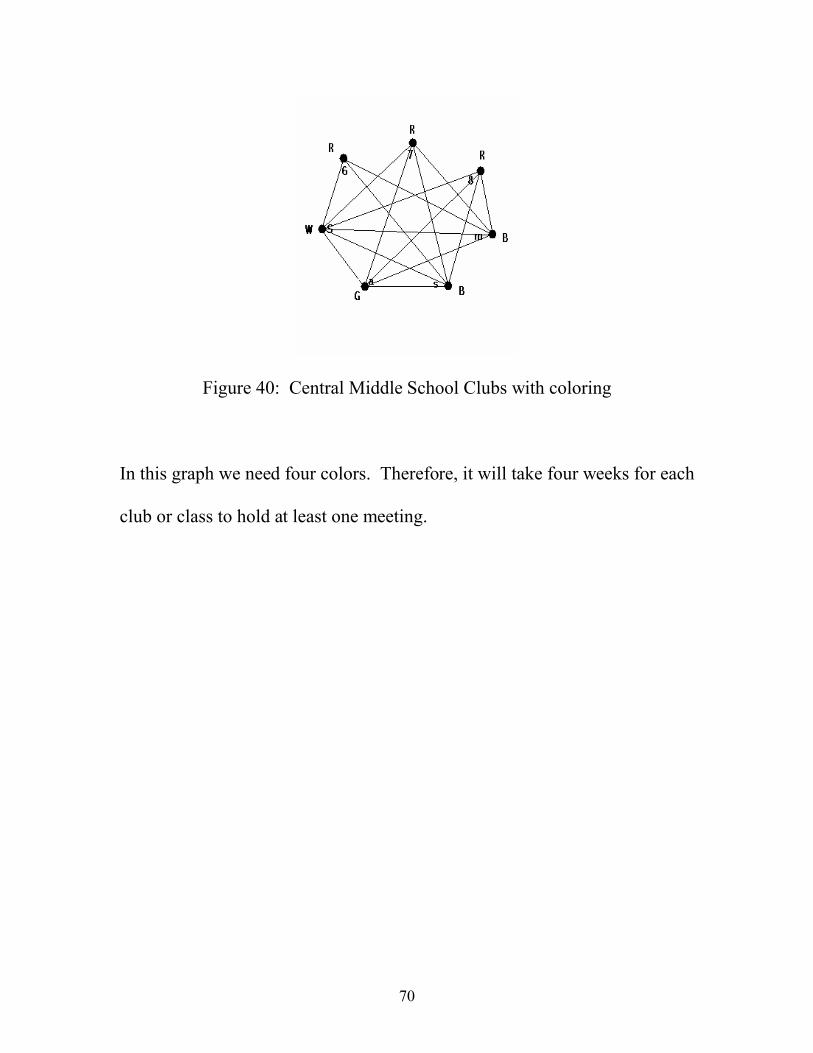
Figure 39: Central Middle School Clubs with lines
Now let’s try to color the graph with the minimum number of colors because
we will schedule all those of the same color at the same time. Colors must
be assigned to the vertices to represent the days the clubs can meet. A
coloring using the minimum number of colors is shown in Figure 40. Since
sixth, seventh, and eighth graders all have the same color-red, these
meetings can occur on the same day. The ones colored blue are academic
clubs, so the blue is scheduled at the same time. This makes sense because
students may choose only one academic club. Then the green can be
scheduled at one time and the white at another time. This also makes sense
because all students can be a member of SADD as well as an academic club,
and student athletes can be members of all other clubs and classes except the
sixth grade.
70
Figure 40: Central Middle School Clubs with coloring
In this graph we need four colors. Therefore, it will take four weeks for each
club or class to hold at least one meeting.

71
5.3 Exercises
1. Draw a C6. Label each vertex with colors and find the chromatic number.
2. Draw the first four cycles (begin with C3). Find the chromatic numbers
of each. What is the chromatic number of a C20? C27? What can you
conclude about the chromatic number of cycles?
3. Draw a K4. Use vertex coloring to find the chromatic number.
4. Draw the first five complete graphs. What is the chromatic number of a
K19? K22? What can you conclude about the chromatic number of complete
graphs?
5. Color this graph using the minimum number of colors.
6. The Animal Care Corp. has decided to start a new zoo with animals that
have been displaced or abandoned. They want the animals to roam as freely
as possible on the land they have obtained. However, they know that there
will have to be some enclosures because some of the animals like to feast on

72
some of the others! The Corp. has acquired seven types of animals:
baboons, foxes, goats, lions, porcupines, rabbits, and zebras. Baboons like
to feast upon goats and rabbits. Foxes are known to eat goats, porcupines,
and rabbits. Lions eat goats and zebras. Porcupines enjoy a tasty rabbit!
All the other animals eat vegetation. Draw a graph and use vertex coloring
to determine how many enclosures will be needed. Which animals would
you place in each enclosure?

73
5.4 Solutions
1.
= 2
2.
= 3
C20 has a chromatic number of 2. C27 has a chromatic number of 3. A
complete graph with an even number of vertices will have a chromatic
74
number of 2 while one with an odd number of vertices will have a
chromatic number of 3.
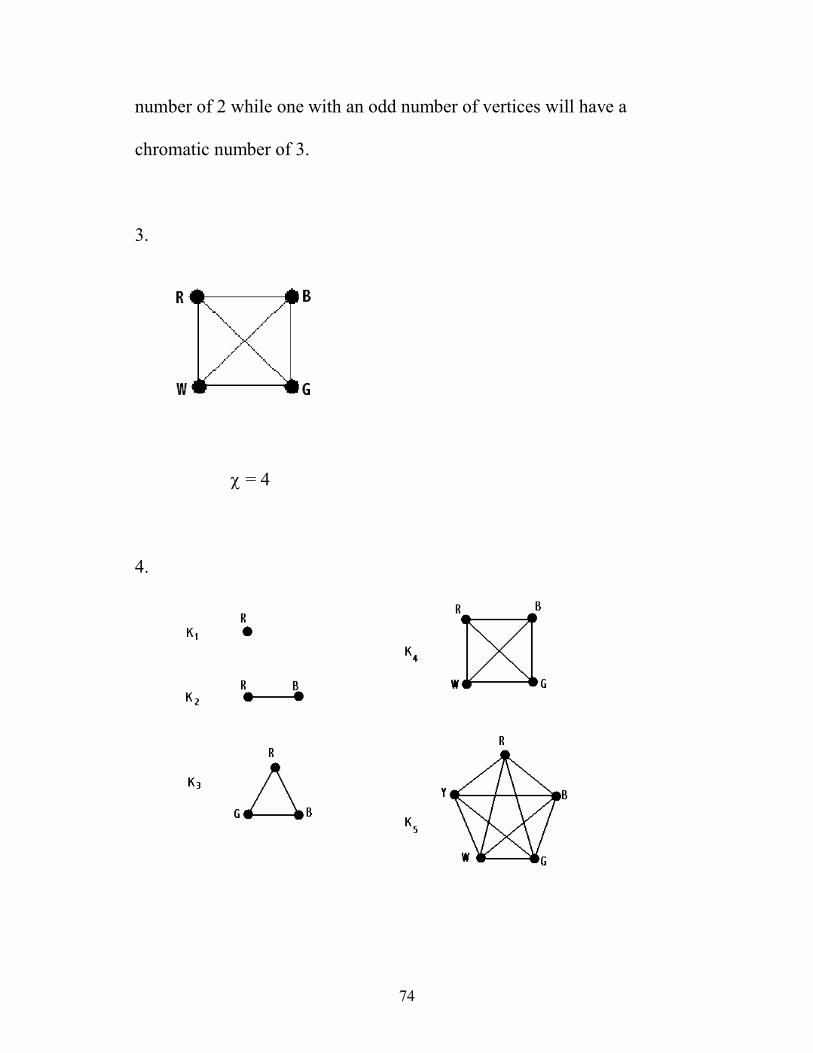
3.
= 4
4.

75
K1 = 1K2 = 2K3 = 3K4 = 4K5 = 5
K19 has a chromatic number of 19. K22 has a chromatic number of 22. Each
complete graph will have a chromatic number equal to the number of
vertices in the graph because each vertex is connected to every other vertex.
5. The following is one possible coloring.
76
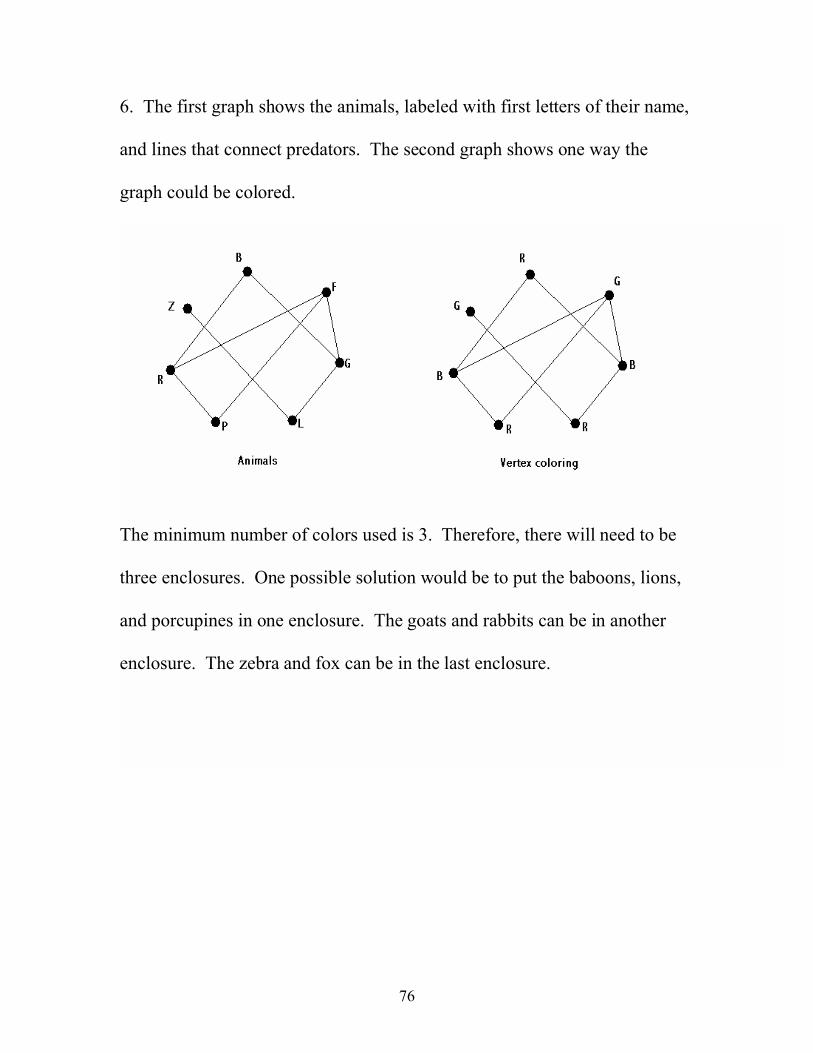
6. The first graph shows the animals, labeled with first letters of their name,
and lines that connect predators. The second graph shows one way the
graph could be colored.
The minimum number of colors used is 3. Therefore, there will need to be
three enclosures. One possible solution would be to put the baboons, lions,
and porcupines in one enclosure. The goats and rabbits can be in another
enclosure. The zebra and fox can be in the last enclosure.
77
5.5 Map coloring
If you ever looked at a map you know that adjacent countries are
colored differently to make it easier to read. A map is a group of countries
where each country is all one piece and none of the countries are isolated.
Vertex coloring can be used to color a map. Draw the capital of each
country. Draw roads between each capital of adjacent countries. The
drawing that results is a planar graph, that is, the drawing lies in one plane,
or flat surface. Then, color the capitals, or vertices, as you would in vertex
coloring. Look at the following map. The capitals of each country are
labeled a, b, c, d, and e. The graph that follows shows the edges drawn
between each capital of an adjacent country, resulting in a graph. The third
drawing represents the vertex coloring of the graph which, in turn, would
represent the coloring of the map.

78
Map with capitals Graph of capitals Vertex coloring
Figure 41: Map Coloring
Three colors were used to color the graph, therefore 3. We say that the
map is three colorable.
79
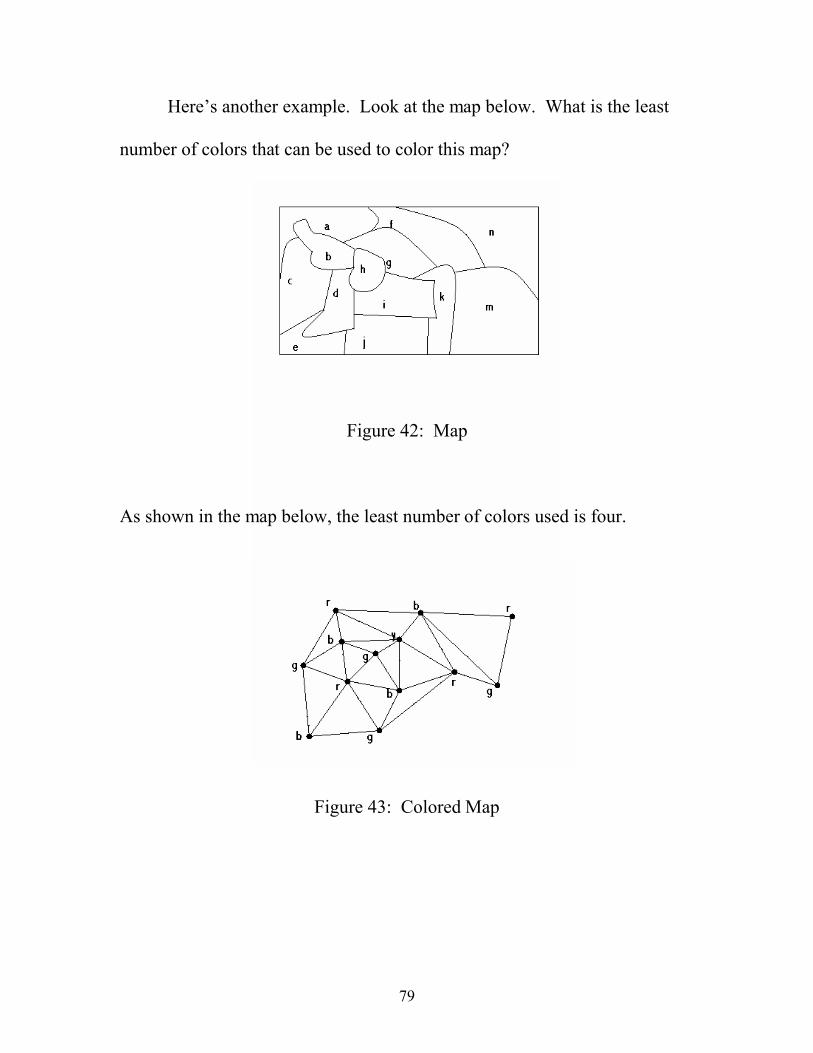
Here’s another example. Look at the map below. What is the least
number of colors that can be used to color this map?
Figure 42: Map
As shown in the map below, the least number of colors used is four.
Figure 43: Colored Map

80
Suppose a mapmaker gave you the following map of the
Southern United States. Color the map using the least amount of colors
possible.
Figure 44: The Southern United States

81
The map is three-colorable as shown in the graph below.
Figure 45: Three-colorable graph of the southern states
The Four Color Problem. Can any map that consists of at least four
countries be 4-colorable? Try it. Draw a map divided into countries.
Assign each country a color. Is it possible to use only four colors (or less)?
This problem has been around awhile. Guthrie, a student in London
in the 1850’s, found he could color the counties in England with just four
colors and believed he could do so with any map [3]. In the 1970’s the
mathematicians, Appel and Haken presented evidence that this was true
using a computer [3]. No pure mathematical proof has been given.
82
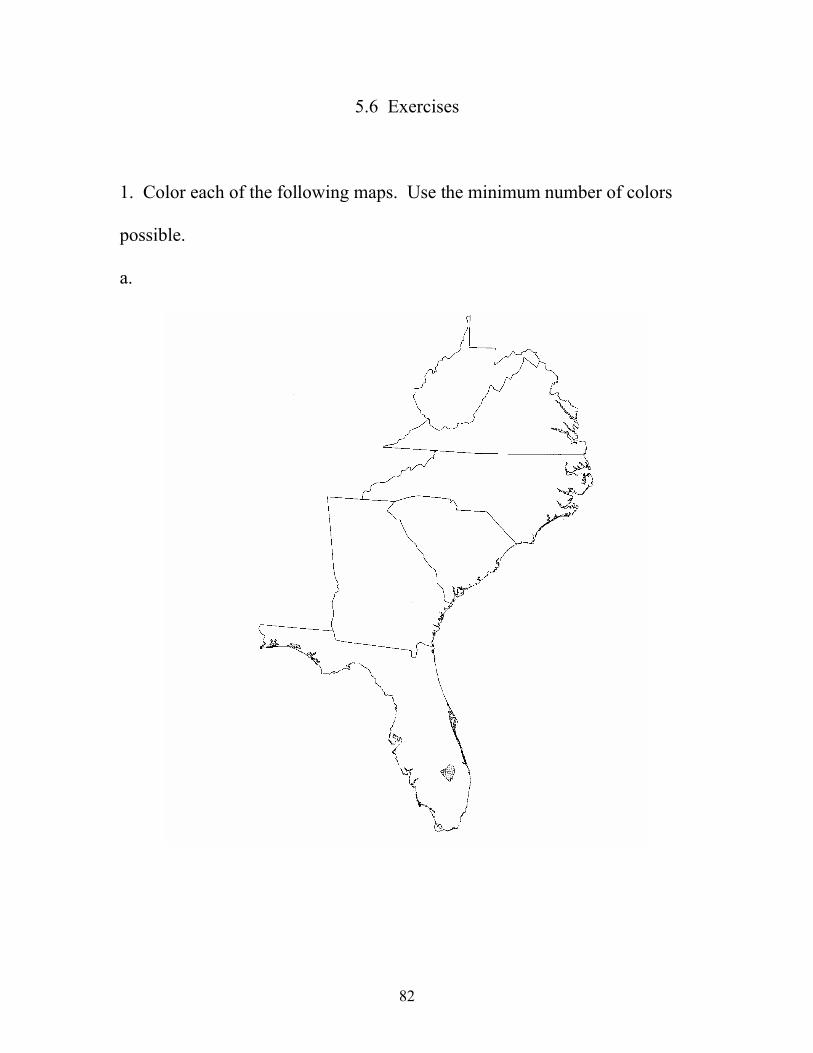
5.6 Exercises
1. Color each of the following maps. Use the minimum number of colors
possible.
a.
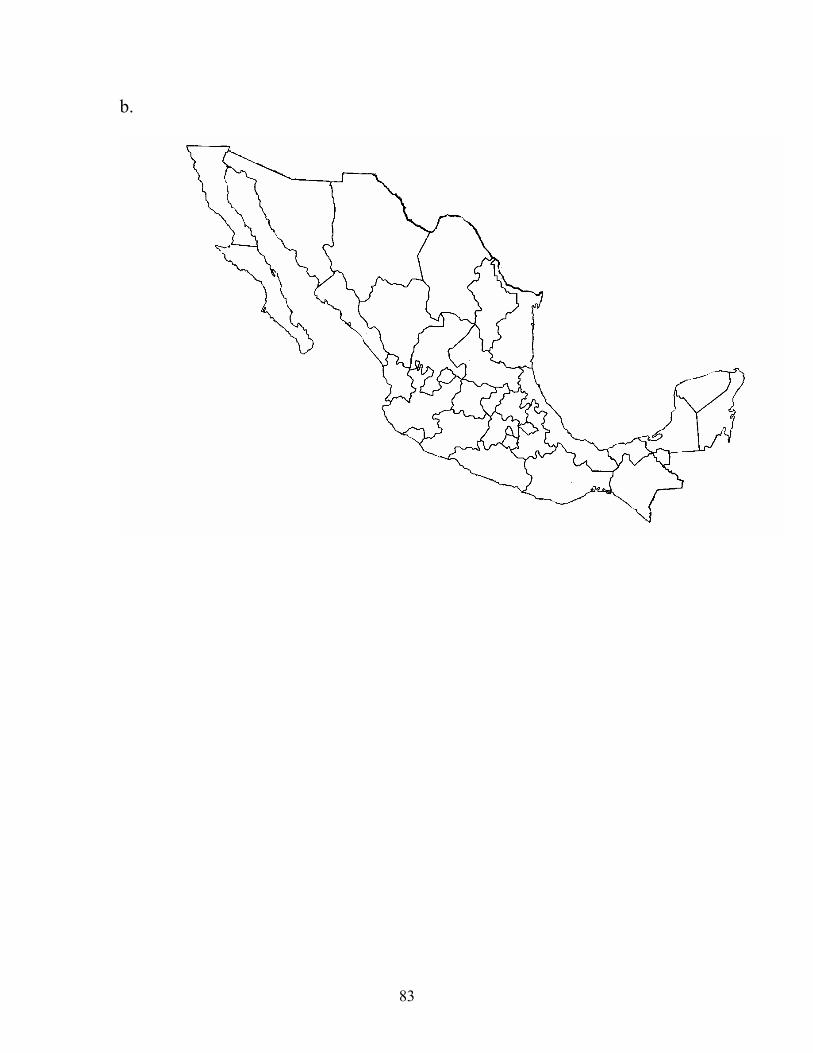
83
b.
84
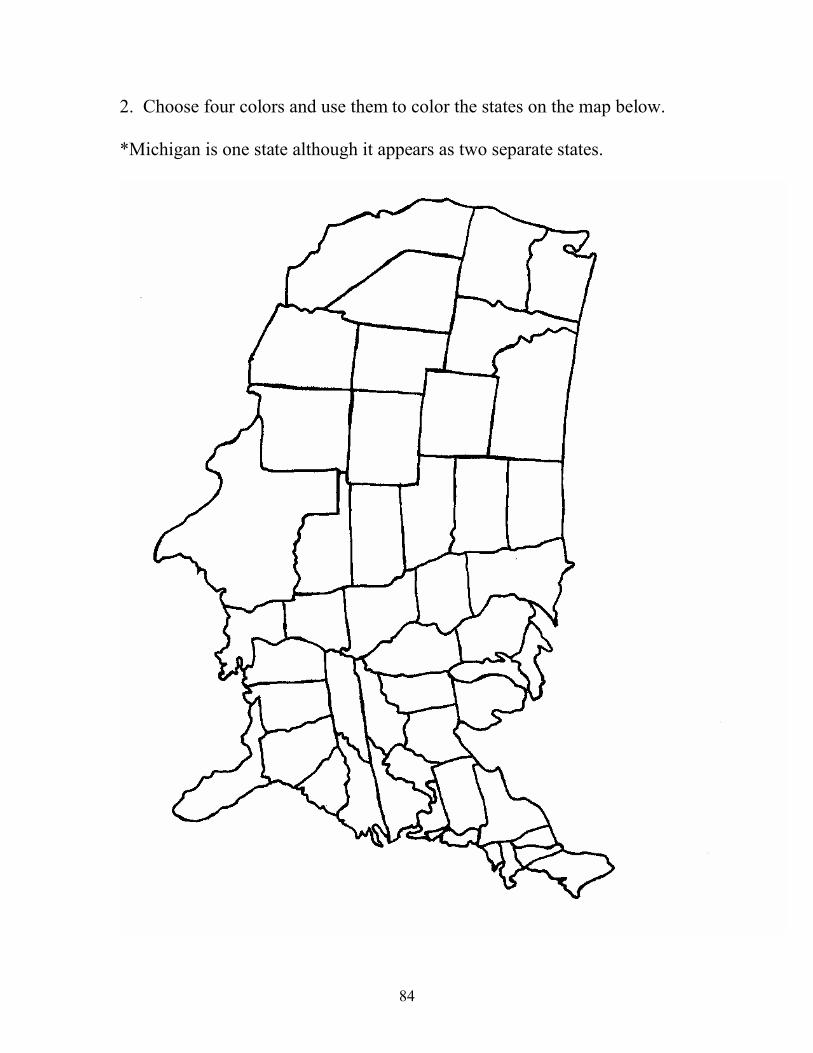
2. Choose four colors and use them to color the states on the map below.
*Michigan is one state although it appears as two separate states.

85
3. a. Draw a three-colorable map.
b. Draw a four-colorable map.
c. Draw a map that is five-colorable.

86
5.7 Solutions
1. a. The map of the Southern Atlantic States can be colored in a minimum
of three colors.
b. The map of Mexico can be colored using a minimum of four colors.
2. The map of the United States can be colored with a minimum of four
colors. Keep trying.
3. Maps can be drawn that require three and four colors. Have students
share the maps they have drawn with a partner and have the partner try to
color the map as indicated. No map will ever require five colors, but it is
fun to try!

87
BIBLIOGRAPHY
[1] Behzad, Mehdi, Gary Chartrand, and Linda Lesniak-Foster. Graphs and
Digraphs. Belmont, CA: Wadsworth, 1979.
[2] Buckley, Fred, and Marty Lewinter. A Friendly Introduction to Graph
Theory. Upper Saddle River, NJ: Prentice Hall, 2003.
[3] Chartrand, Gary. Introductory Graph Theory. New York: Dover
Publications, 1977.
[4] D’Angelo, John P., and Douglas B. West. Mathematical Thinking
Problem Solving and Proofs. 2nd edition. Upper Saddle River, NJ:
Prentice Hall, 2000.
[5] Glencoe Outline Map Resource Book. New York: Glencoe/McGraw-
Hill.
[6] Mathematics: Applications and Concepts. Course 2. New York:
Glencoe/McGraw-Hill, 2005.
[7] West, Douglas B. Introduction to Graph Theory. 2nd edition. Upper
Saddle River, NJ: Prentice Hall, 2001.

88
VITA
LAURA ANN ROBINSON
412 Vance Drive
Chilhowie, VA 24319
Education
Masters of Science Degree in Mathematics, East Tennessee State
University, August 2006.
Bachelors of Arts Degree in Elementary Education, Virginia
Polytechnic Institute and State University, August 1987.
Professional Experience
Teacher, 7th grade mathematics, Chilhowie Middle School,
Chilhowie, VA, 1989-present.