Embed Size (px)
Citation preview

Graph each inequality on a number line.1. x > –5 2. y ≤ 0
3. Write –6x + 2y = –4 in slope-intercept form, and graph.
y = 3x – 2
Warm-Up

Inequalities
Learning Targets
Review Inequalities
Graphing Inequalities
Knowing where Possible Solutions Exist
Testing for Possible Solutions
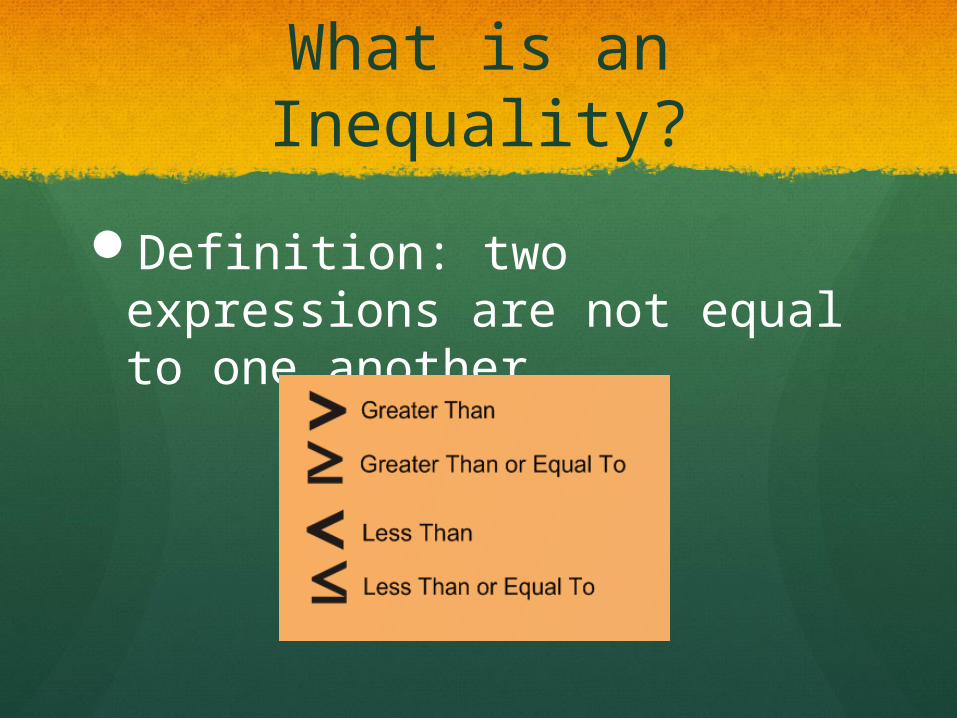
What is an Inequality?
Definition: two expressions are not equal to one another.

Equality vs. Inequality
Equality sets expressions values so that they are equal to one another.Ex:
Inequality compares the two expressions values.Ex:
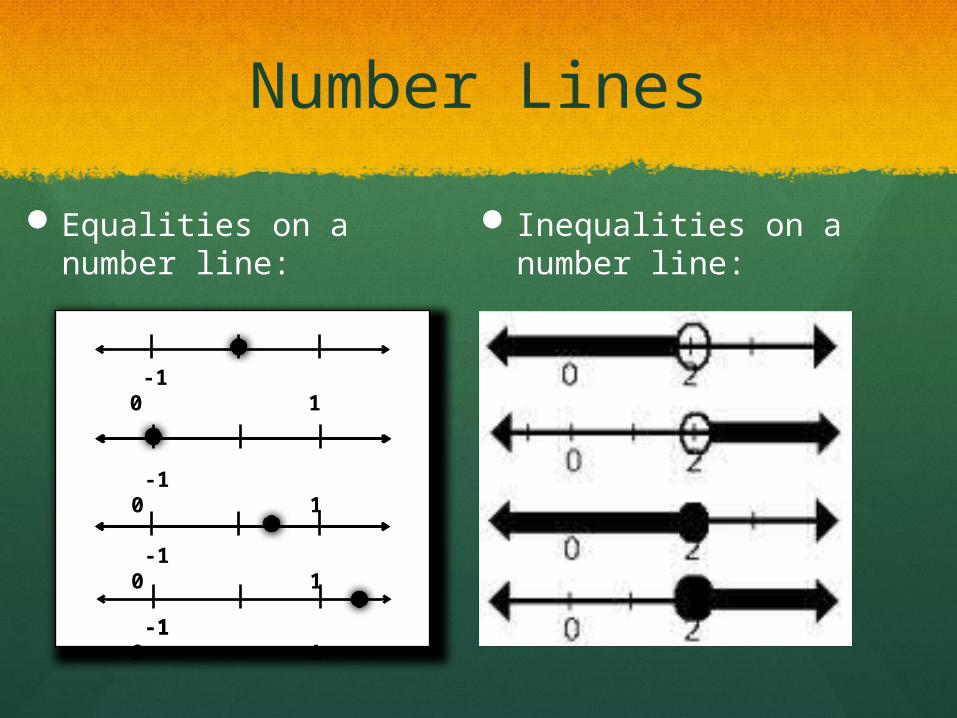
Number Lines
Equalities on a number line:
Inequalities on a number line:
-1 0 1
-1 0 1
-1 0 1
-1 0 1 -1 0 1
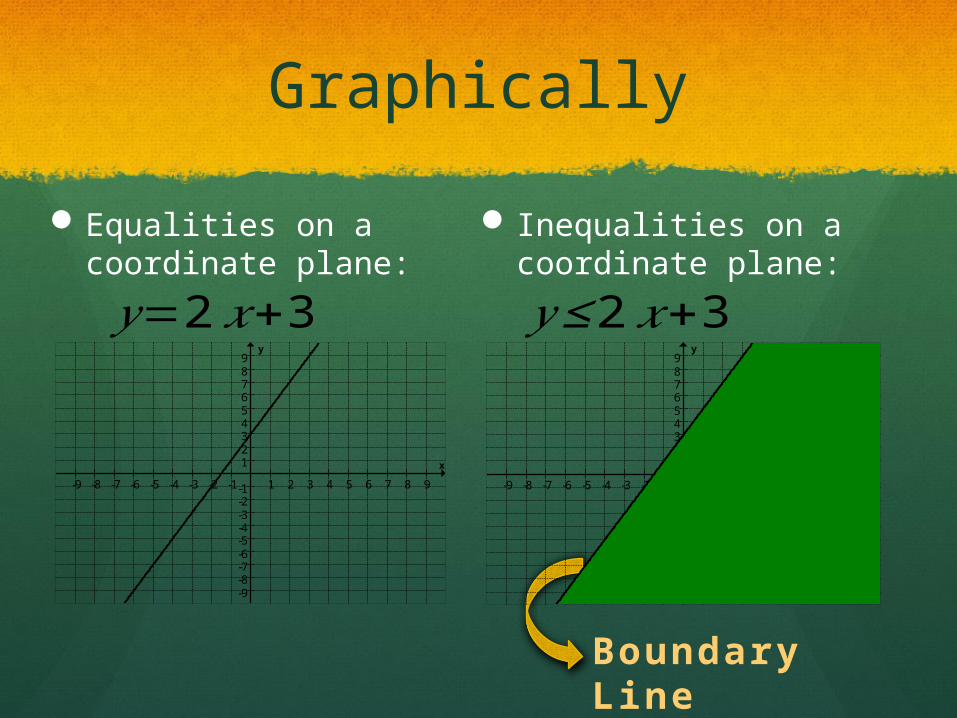
Graphically
Equalities on a coordinate plane:
Inequalities on a coordinate plane:
-9 -8 -7 -6 -5 -4 -3 -2 -1 1 2 3 4 5 6 7 8 9
-9-8-7-6-5-4-3-2-1
123456789
x
y
-9 -8 -7 -6 -5 -4 -3 -2 -1 1 2 3 4 5 6 7 8 9
-9-8-7-6-5-4-3-2-1
123456789
x
y
𝑦=2 𝑥+3 𝑦 ≤ 2 𝑥+3
Boundary Line
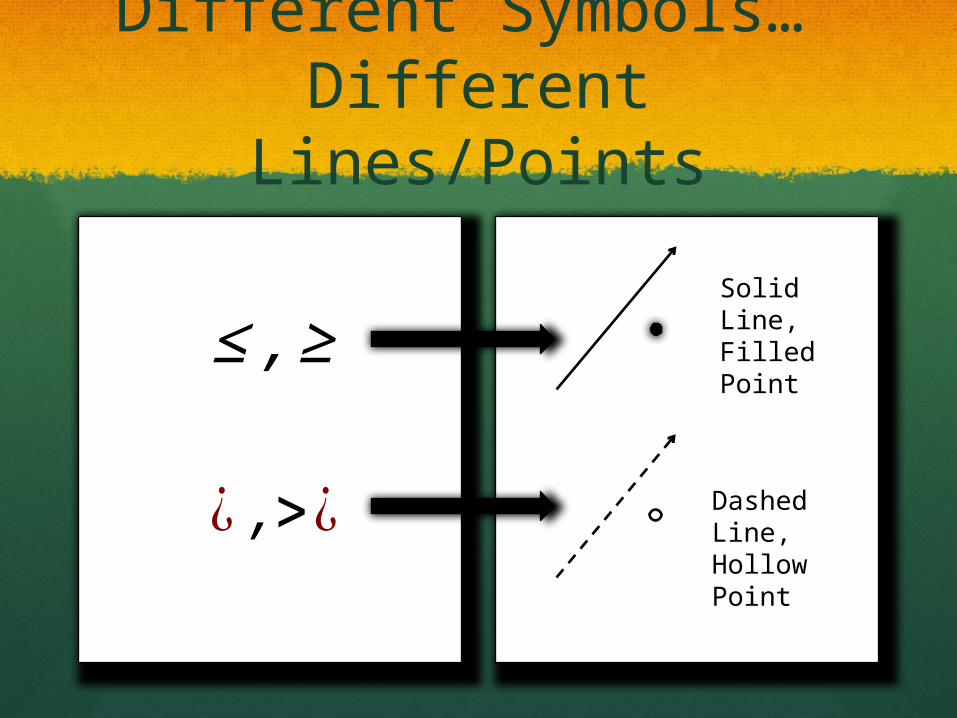
Different Symbols… Different Lines/Points
≤ , ≥
¿ ,>¿
Solid Line, Filled Point
Dashed Line, Hollow Point

Objective - To graph linear inequalities in the coordinate plane.
Number Line Coordinate Plane
-4 -3 -2 -1 0 1 2 3 4
x 3 y
x
x 3
x = 3
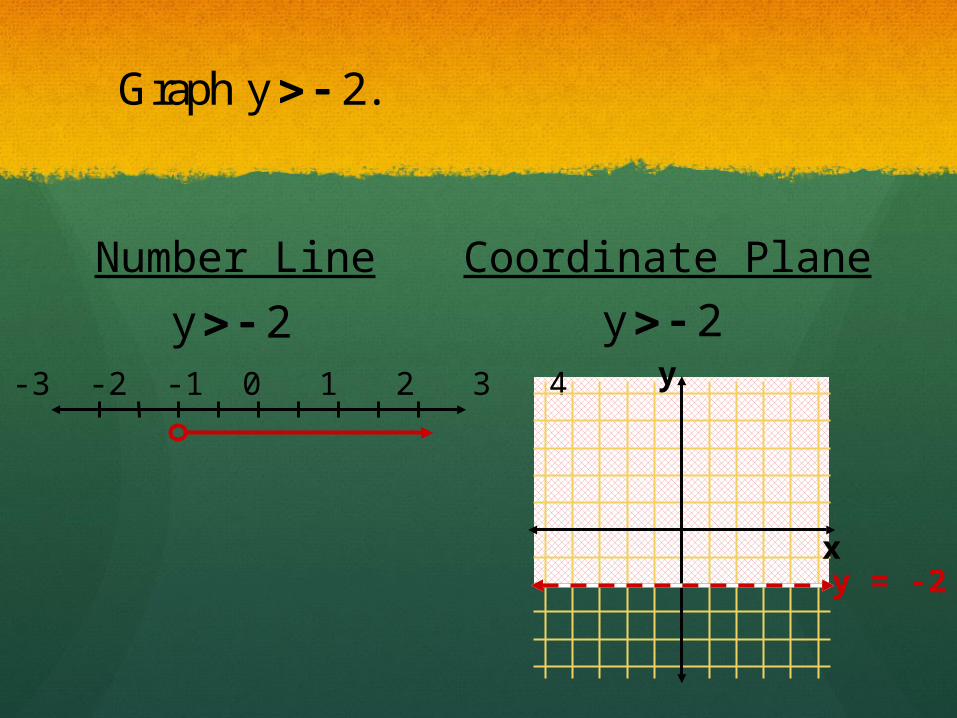
Graph y 2.
Number Line Coordinate Plane
-4 -3 -2 -1 0 1 2 3 4
y 2 y
x
y 2
y = -2
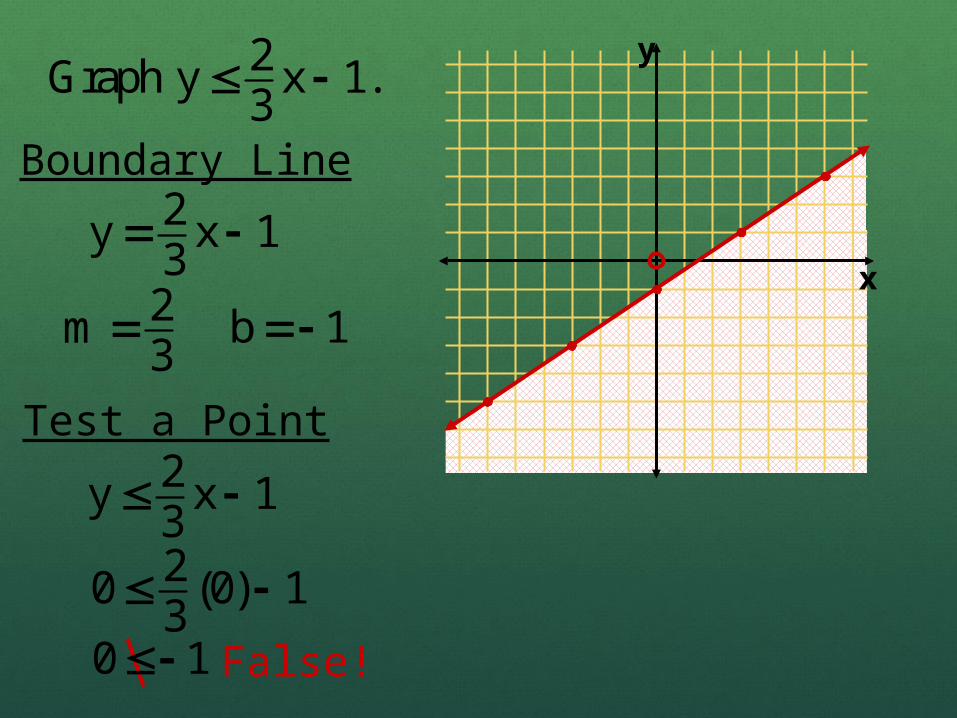
2Graph y x 1.3
Boundary Line2y x 13
2m3
b 1
Test a Point2y x 13
20 (0) 13
0 1 False!
y
x

Graph 4x 5y 10.
y
x
4x 5y 10 4x 4x
5y 4x 10 5 5
4y x 25
4m5
b 2
Solid line
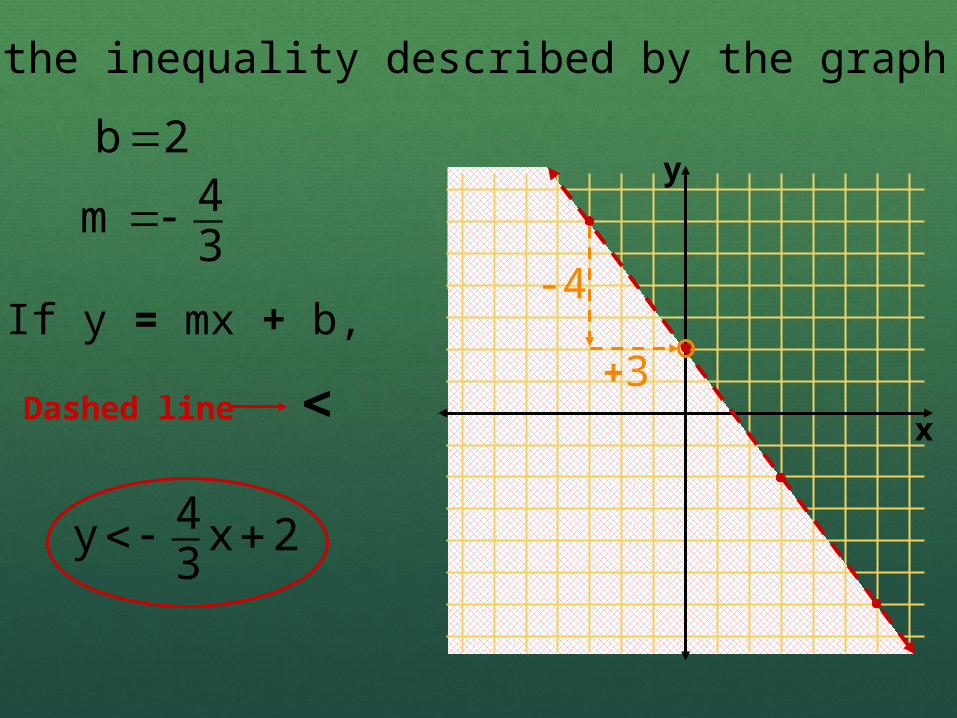
If y = mx + b,
45
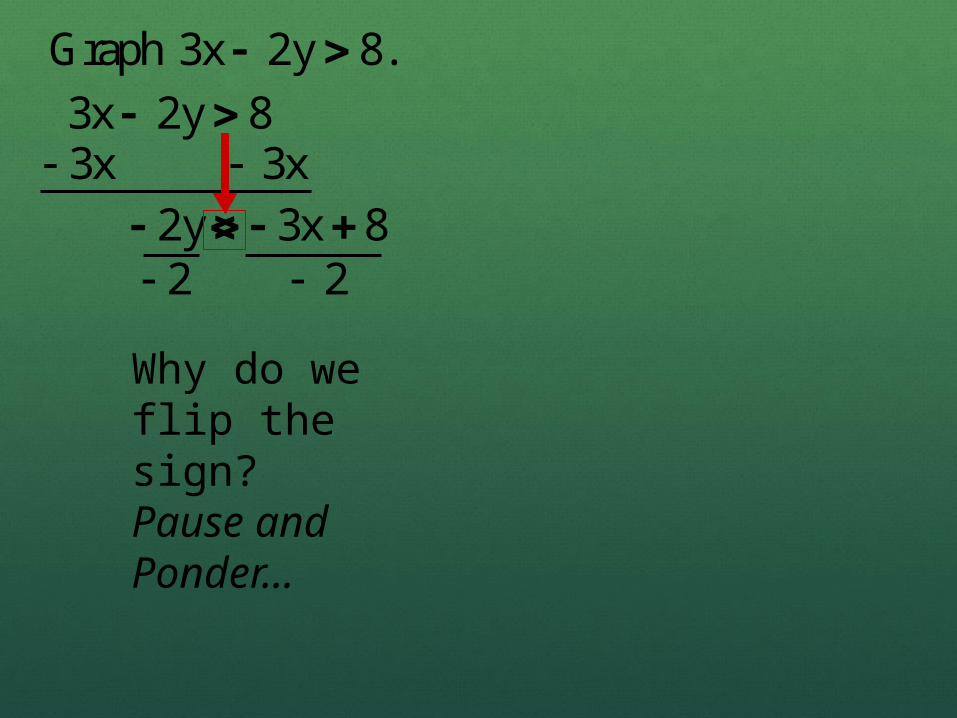
Graph 3x 2y 8. 3x 2y 8 3x 3x
2y 3x 8 2 2
Why do we flip the sign?Pause and Ponder…
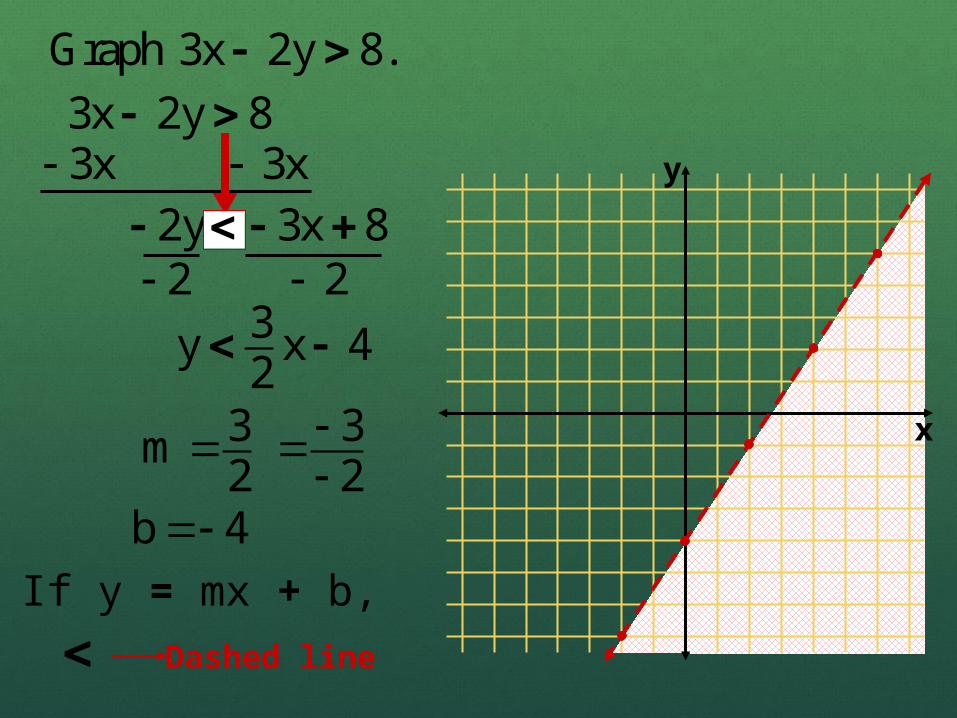
Graph 3x 2y 8.
y
x
3x 2y 8 3x 3x
2y 3x 8 2 2
3y x 42
3m2
b 4
Dashed line
If y = mx + b,
32
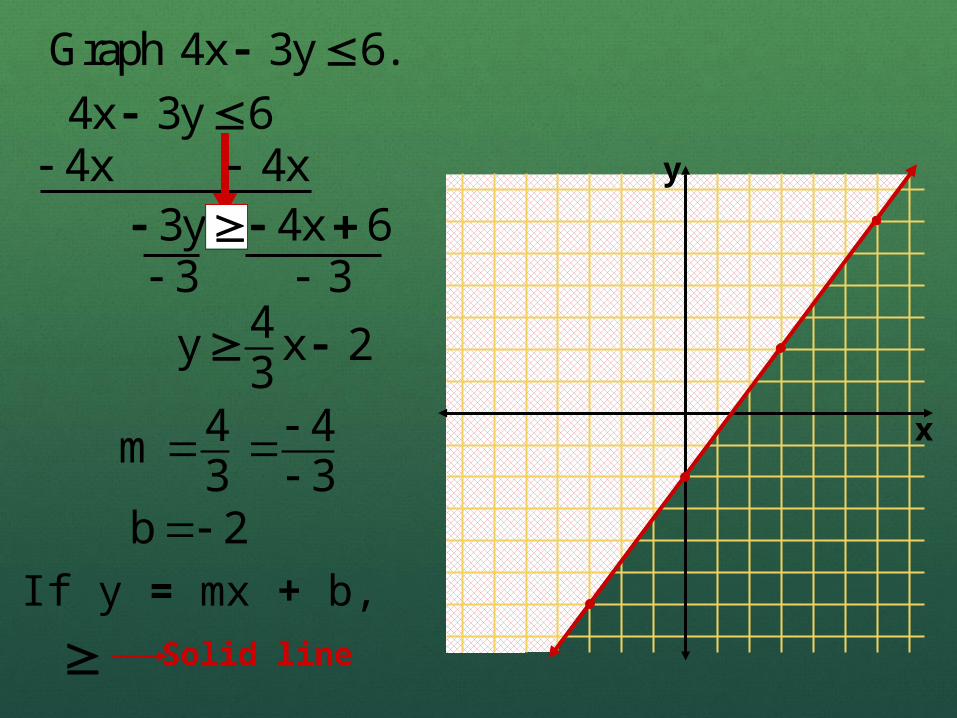
Graph 4x 3y 6.
y
x
4x 3y 6 4x 4x
3y 4x 6 3 3
4y x 23
4m3
b 2
Solid line
If y = mx + b,
43
y
x
4m3
b 2
Dashed line
If y = mx + b,
Write the inequality described by the graph below.
4y x 23
-4
+3
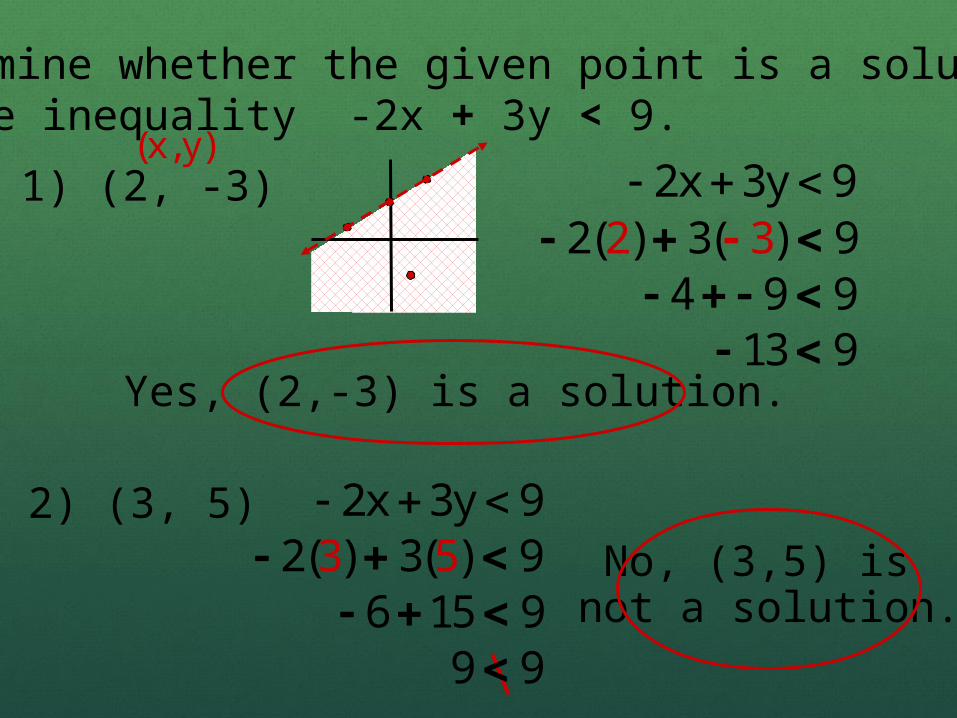
Determine whether the given point is a solution to the inequality -2x + 3y < 9.
1) (2, -3) 2x 3y 9 (x, y)
2( ) 3 3( ) 92 4 9 9
13 9 Yes, (2,-3) is a solution.
2) (3, 5) 2x 3y 9 2( ) 33 ( ) 95
6 15 9 9 9
No, (3,5) is not a solution.

ProblemIf you have less than $5.00 in nickels and dimes, find an inequality and sketch a graph to describe how many of each coin you have.
Let n = # of nickelsLet d = # of dimes
0.05 n + 0.10 d < 5.00
or
5 n + 10 d < 500
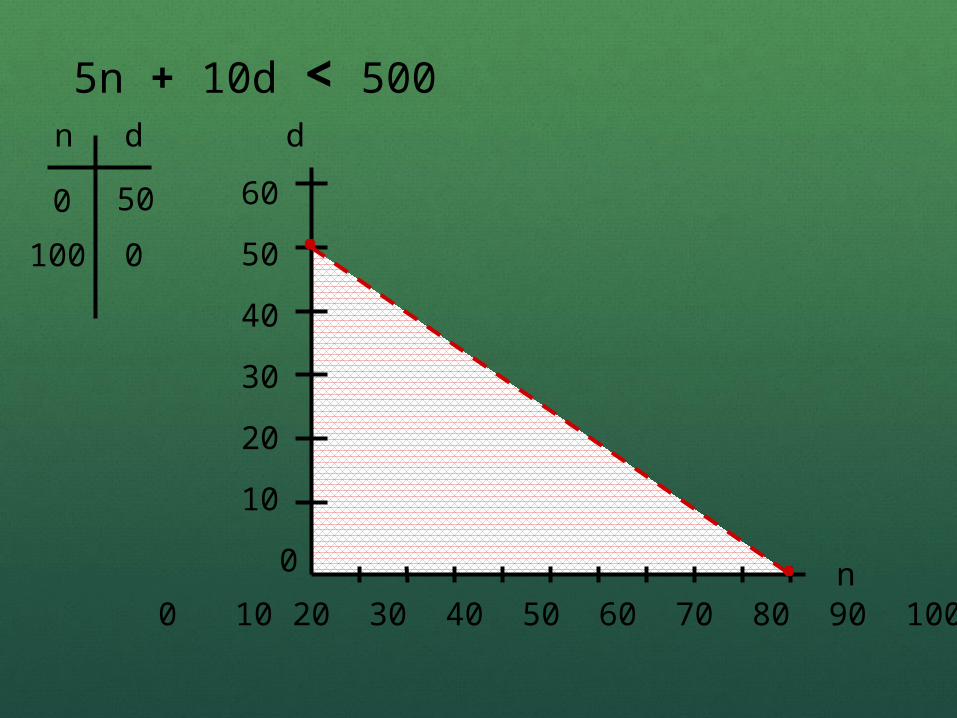
5n + 10d < 500n d
0 50
100 0
0 10 20 30 40 50 60 70 80 90 100n
d
60
50
40
30
20
10
0
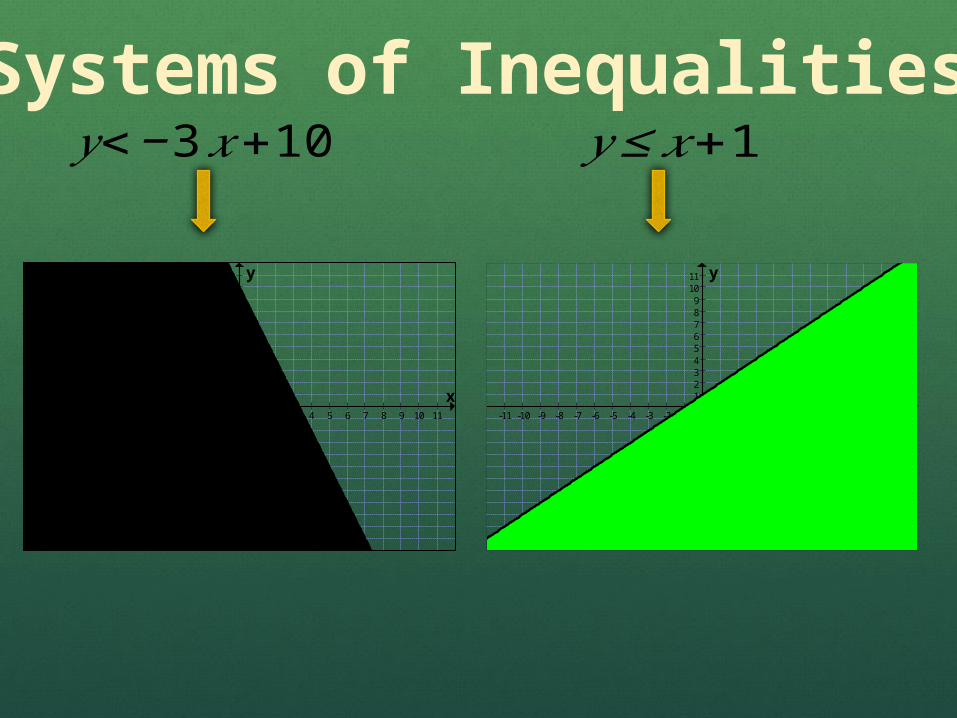
𝑦<−3 𝑥+10 𝑦 ≤ 𝑥+1
-11 -10 -9 -8 -7 -6 -5 -4 -3 -2 -1 1 2 3 4 5 6 7 8 9 10 11
-11-10
-9-8-7-6-5-4-3-2-1
123456789
1011
x
y
-11 -10 -9 -8 -7 -6 -5 -4 -3 -2 -1 1 2 3 4 5 6 7 8 9 10 11
-11-10
-9-8-7-6-5-4-3-2-1
123456789
1011
x
y
Systems of Inequalities
-11 -10 -9 -8 -7 -6 -5 -4 -3 -2 -1 1 2 3 4 5 6 7 8 9 10 11
-11-10
-9-8-7-6-5-4-3-2-1
123456789
1011
x
y
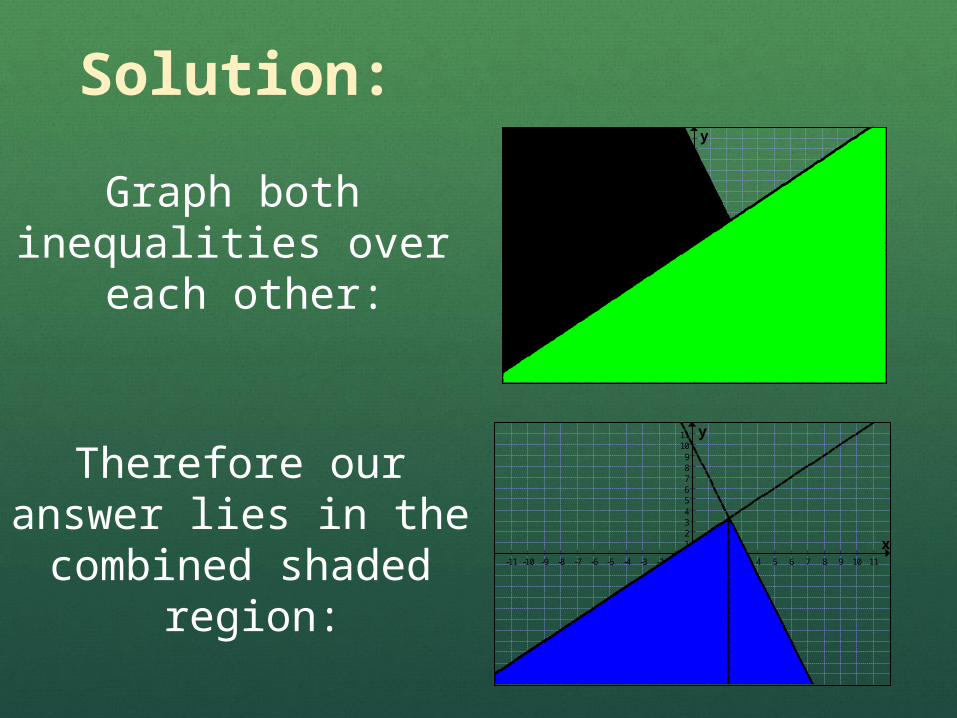
Solution:
-11 -10 -9 -8 -7 -6 -5 -4 -3 -2 -1 1 2 3 4 5 6 7 8 9 10 11
-11-10-9-8-7-6-5-4-3-2-1
123456789
1011
x
y
Graph both inequalities over
each other:
Therefore our answer lies in the combined shaded
region:
Non linear Inequalities

Non Linear Inequalities
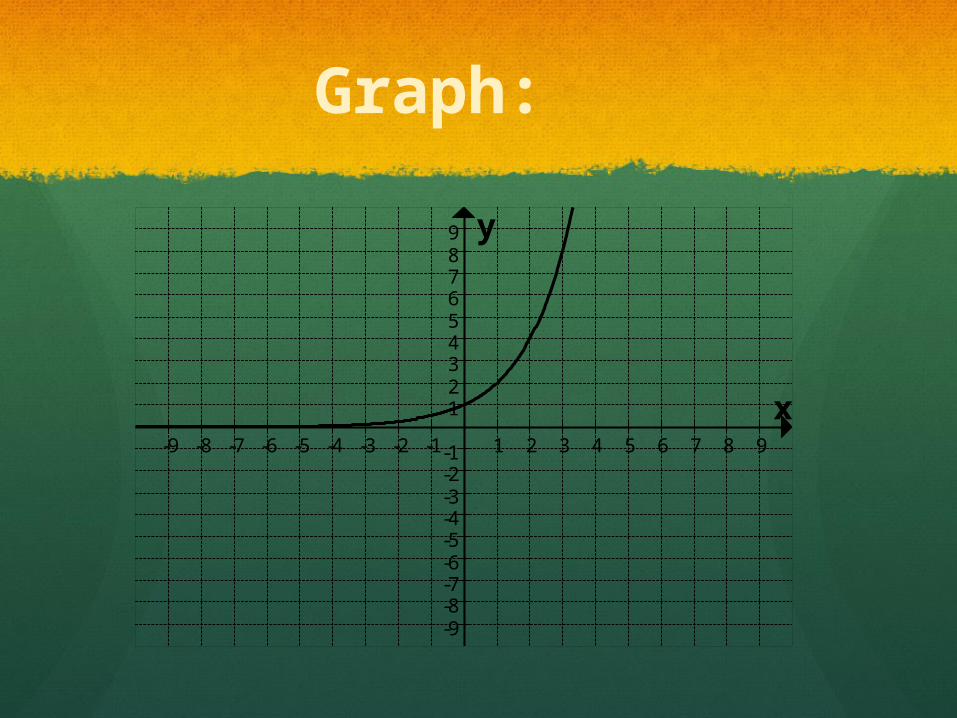
In chapter 4 we studied parent graphs and their transformation.
In the next few slides you will be given non linear graphs. Use your knowledge of parent graphs to display a graph for each function.
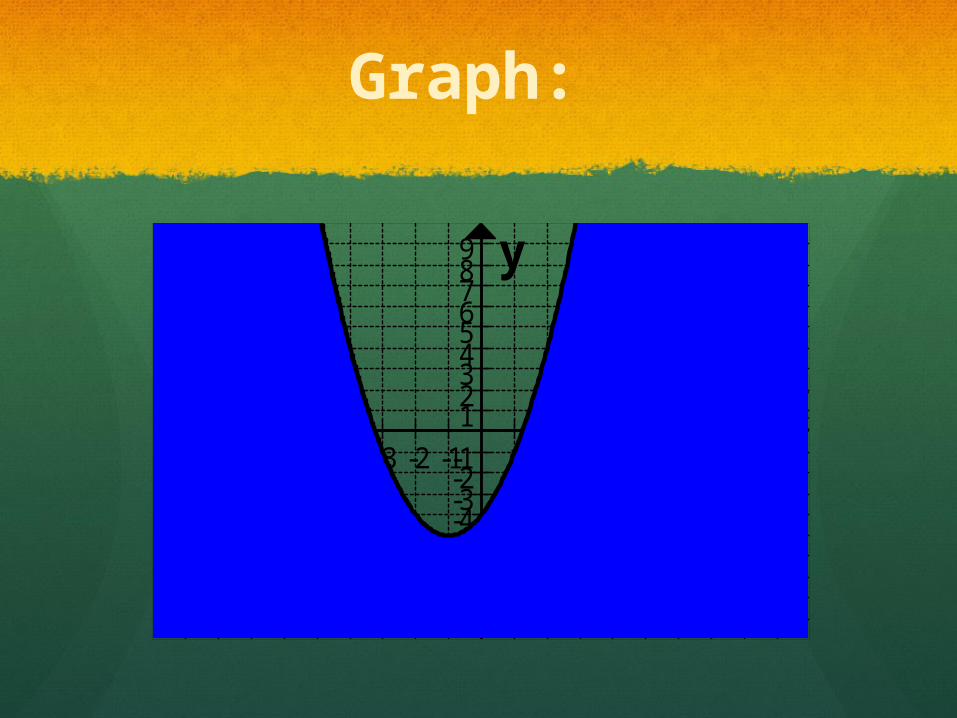
Then use a test point to graph the inequalities that follow.
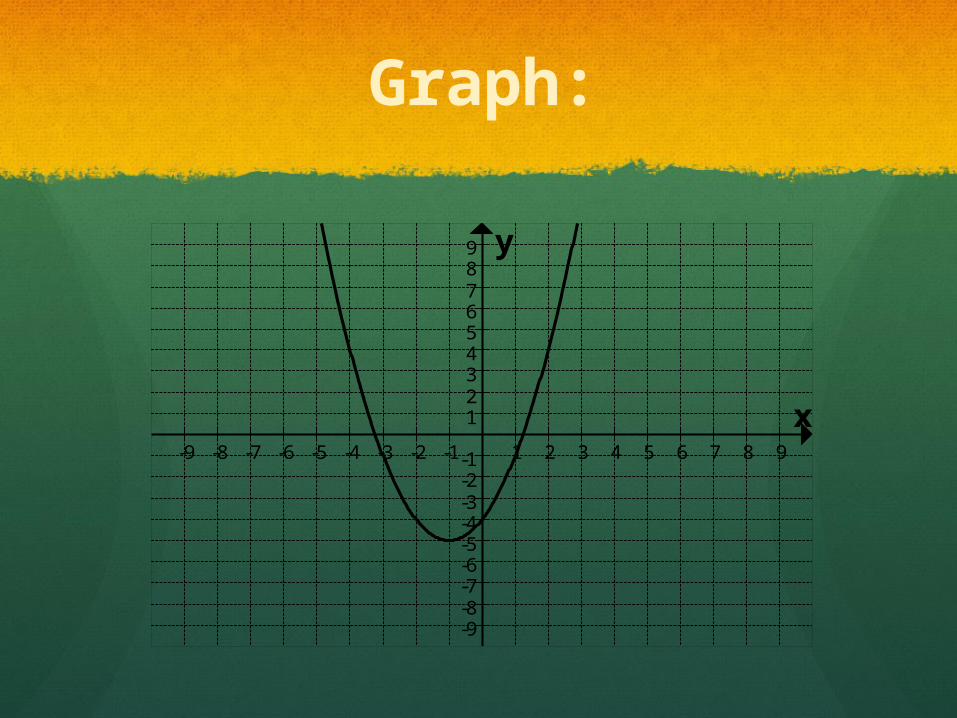
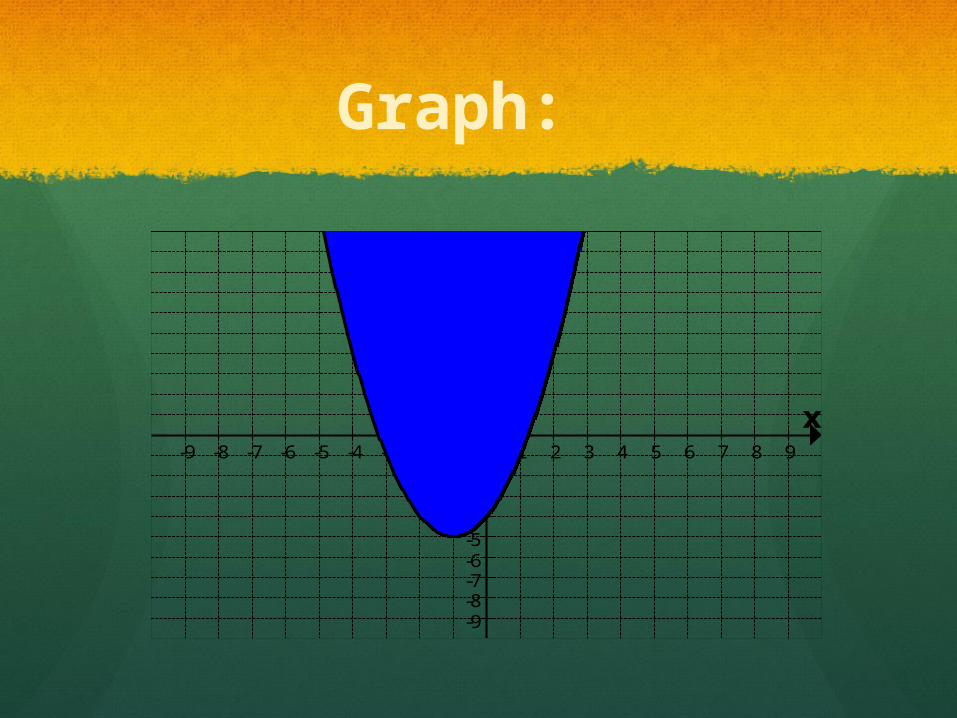
Graph:
-9 -8 -7 -6 -5 -4 -3 -2 -1 1 2 3 4 5 6 7 8 9
-9-8-7-6-5-4-3-2-1
123456789
x
y
-9 -8 -7 -6 -5 -4 -3 -2 -1 1 2 3 4 5 6 7 8 9
-9-8-7-6-5-4-3-2-1
123456789
x
y
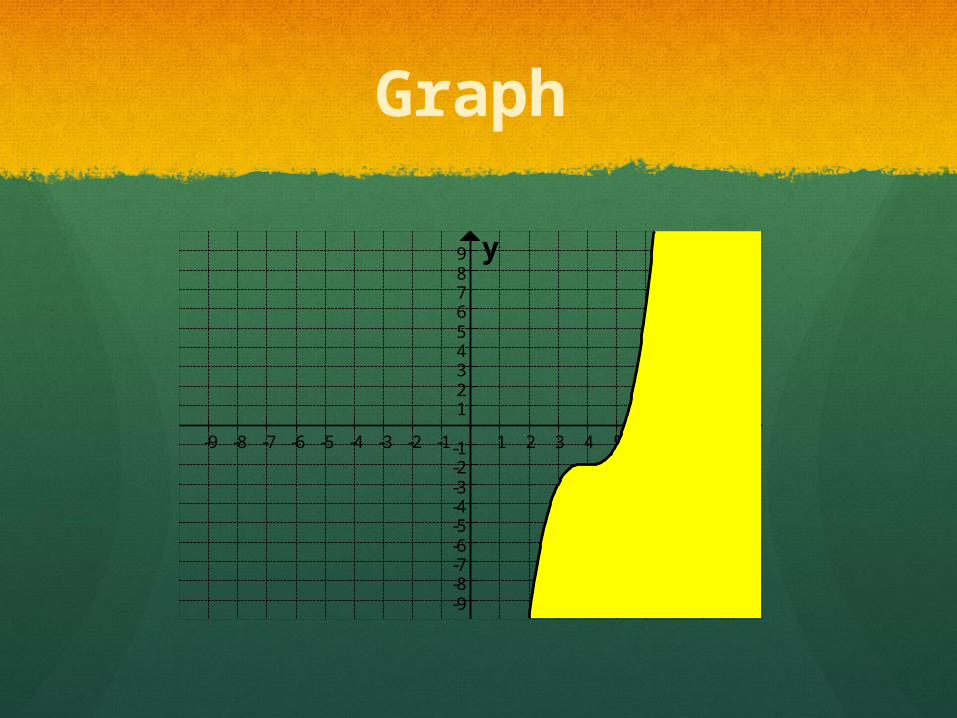
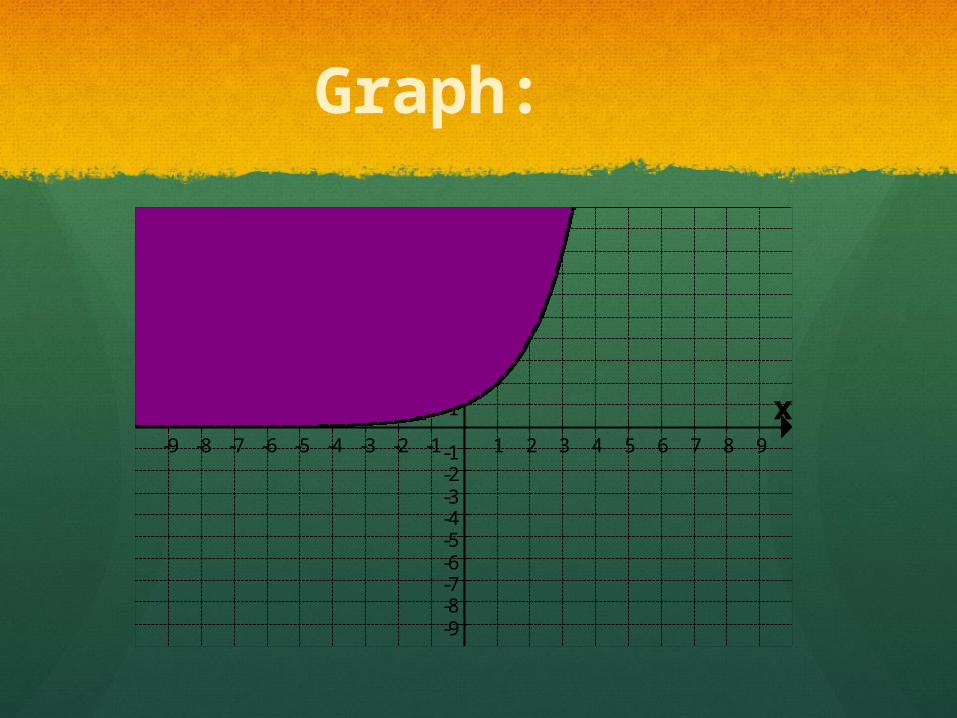
Graph:
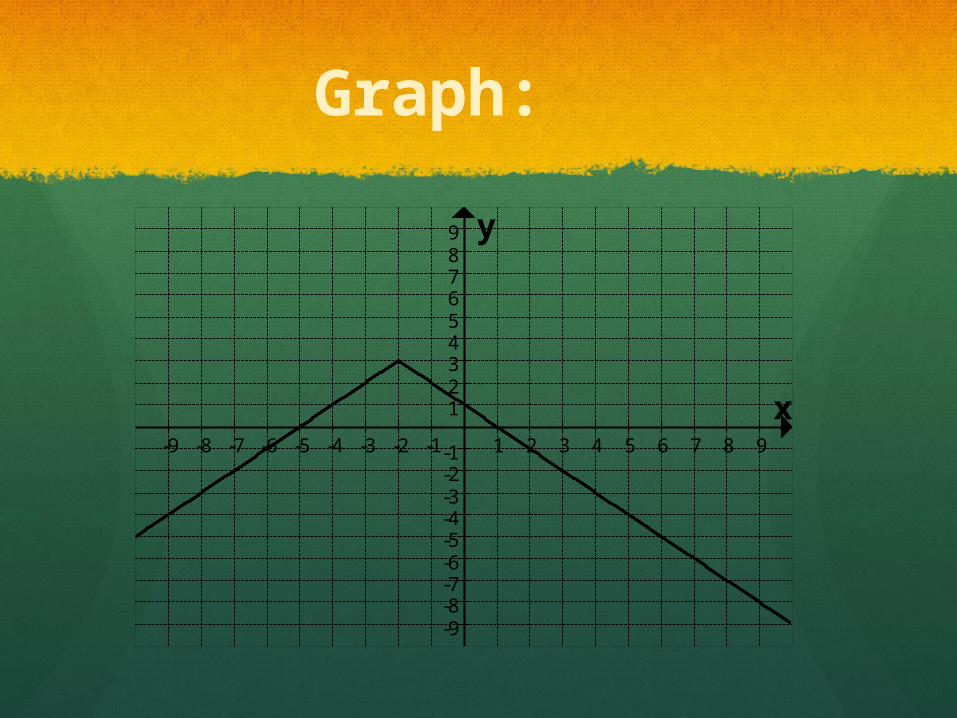
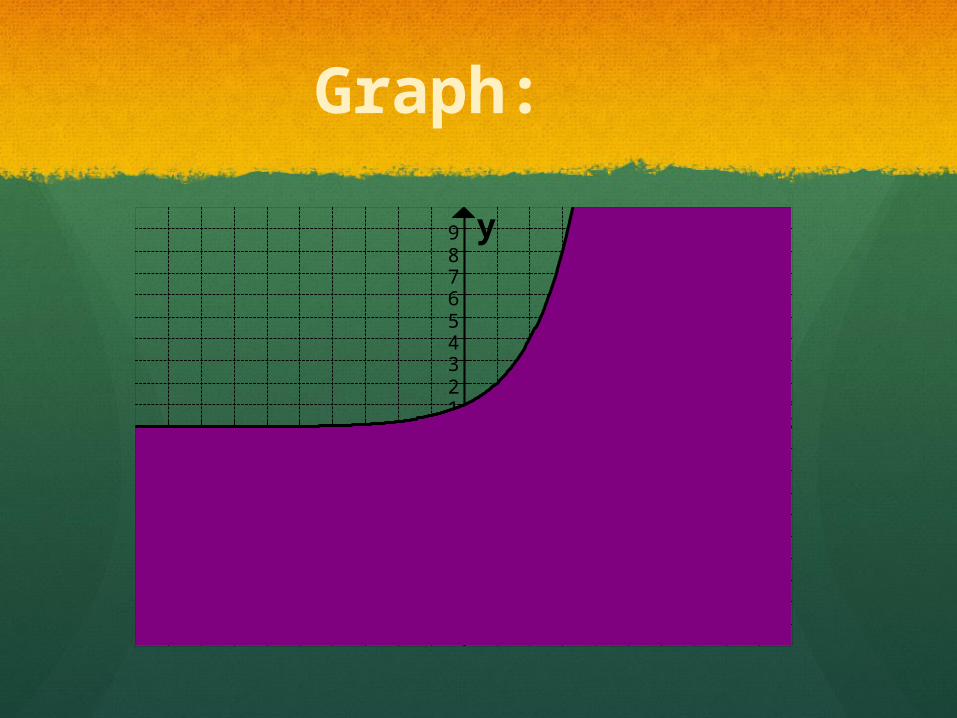
Graph:
-9 -8 -7 -6 -5 -4 -3 -2 -1 1 2 3 4 5 6 7 8 9
-9-8-7-6-5-4-3-2-1
123456789
x
y

-9 -8 -7 -6 -5 -4 -3 -2 -1 1 2 3 4 5 6 7 8 9
-9-8-7-6-5-4-3-2-1
123456789
x
y
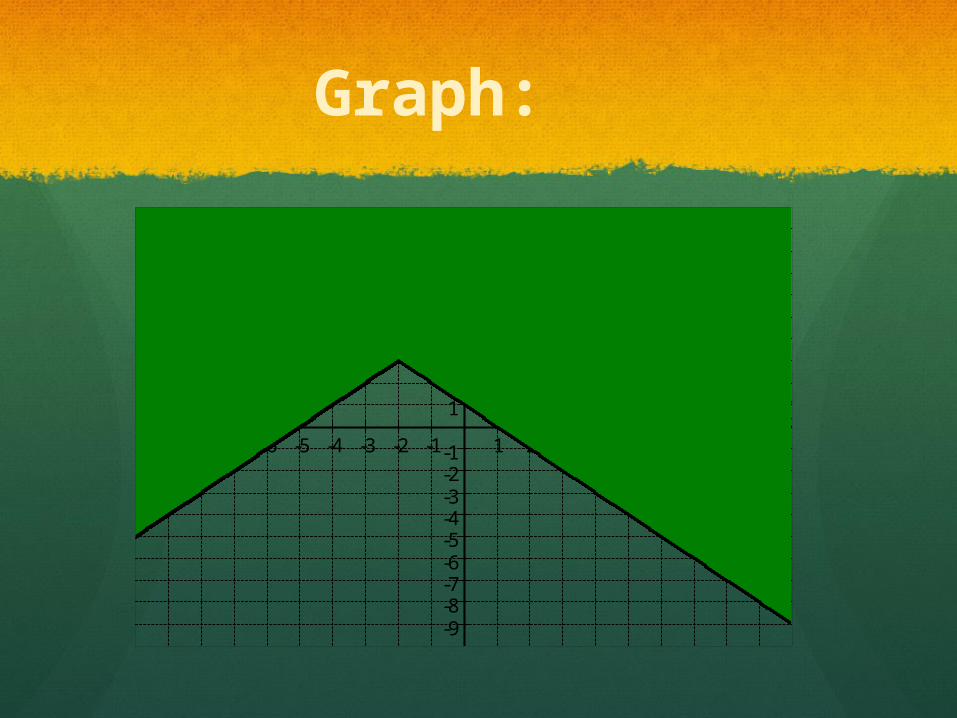
Graph

Graph
-9 -8 -7 -6 -5 -4 -3 -2 -1 1 2 3 4 5 6 7 8 9
-9-8-7-6-5-4-3-2-1
123456789
x
y
-9 -8 -7 -6 -5 -4 -3 -2 -1 1 2 3 4 5 6 7 8 9
-9-8-7-6-5-4-3-2-1
123456789
x
y
Graph
Graph:
-9 -8 -7 -6 -5 -4 -3 -2 -1 1 2 3 4 5 6 7 8 9
-9-8-7-6-5-4-3-2-1
123456789
x
y
Graph:
-9 -8 -7 -6 -5 -4 -3 -2 -1 1 2 3 4 5 6 7 8 9
-9-8-7-6-5-4-3-2-1
123456789
x
y

Graph:
-9 -8 -7 -6 -5 -4 -3 -2 -1 1 2 3 4 5 6 7 8 9
-9-8-7-6-5-4-3-2-1
123456789
x
y
Graph:
-9 -8 -7 -6 -5 -4 -3 -2 -1 1 2 3 4 5 6 7 8 9
-9-8-7-6-5-4-3-2-1
123456789
x
y
Graph:
-9 -8 -7 -6 -5 -4 -3 -2 -1 1 2 3 4 5 6 7 8 9
-9-8-7-6-5-4-3-2-1
123456789
x
y
Graph:
-9 -8 -7 -6 -5 -4 -3 -2 -1 1 2 3 4 5 6 7 8 9
-9-8-7-6-5-4-3-2-1
123456789
x
y
On your own:
Review your notes. Rewrite and fortify them if needed.
Update your vocab list, if needed.