Embed Size (px)
Citation preview
Granular Fertiliser Particle Dynamics On and Off a Spinner Spreader
A. Aphale; N. Bolander; J. Park; L. Shaw; J. Svec; and C. Wassgren
School of Mechanical Engineering, Purdue University, West Lafayette, IN 47907-2088, USA; email of corresponding author: [email protected]
Abstract
A comprehensive experimental and analytical study was performed to investigate particle
trajectories on and off a spinner spreader. Sixteen different granular fertilisers were used.
Measurements of the significant material properties, on-spinner trajectories, and off-
spinner distance distributions were made. Analytical models for the on-spinner and off-
spinner trajectories were also presented and a comparison between the predictions and
experimental results were made. The models reasonably predict, on average, the distance
the real fertiliser materials travel.
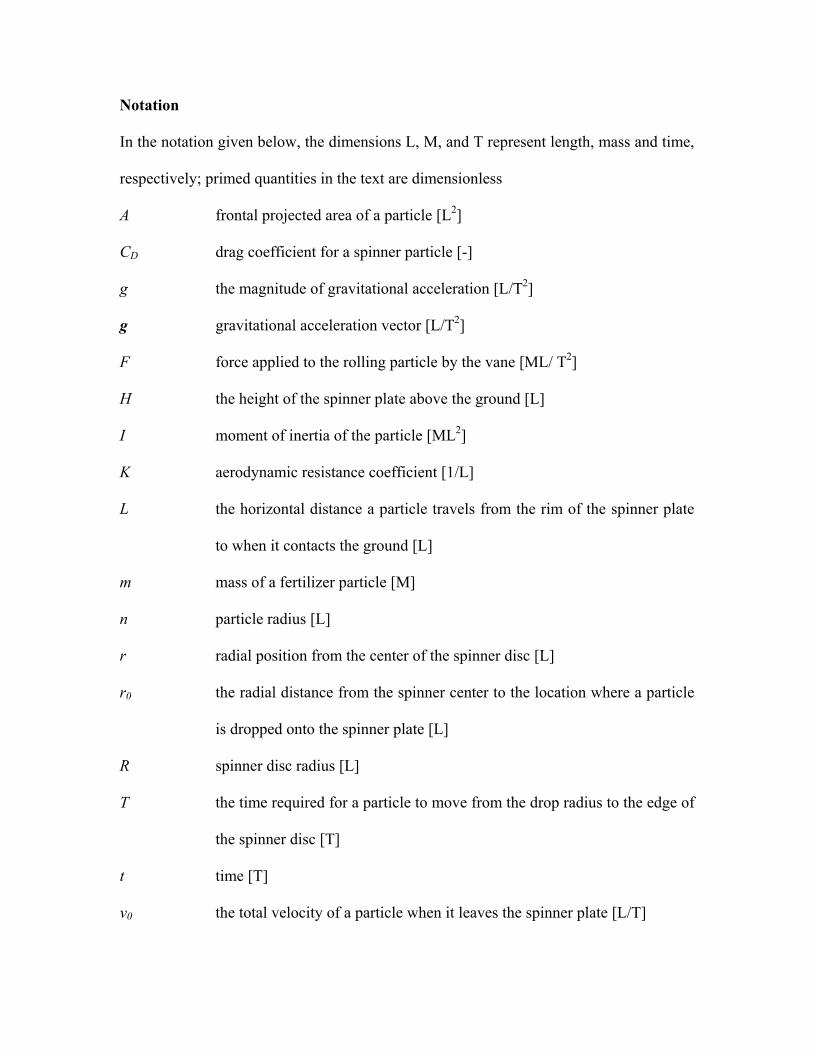
Notation
In the notation given below, the dimensions L, M, and T represent length, mass and time,
respectively; primed quantities in the text are dimensionless
A frontal projected area of a particle [L2]
CD drag coefficient for a spinner particle [-]
g the magnitude of gravitational acceleration [L/T2]
g gravitational acceleration vector [L/T2]
F force applied to the rolling particle by the vane [ML/ T2]
H the height of the spinner plate above the ground [L]
I moment of inertia of the particle [ML2]
K aerodynamic resistance coefficient [1/L]
L the horizontal distance a particle travels from the rim of the spinner plate
to when it contacts the ground [L]
m mass of a fertilizer particle [M]
n particle radius [L]
r radial position from the center of the spinner disc [L]
r0 the radial distance from the spinner center to the location where a particle
is dropped onto the spinner plate [L]
R spinner disc radius [L]
T the time required for a particle to move from the drop radius to the edge of
the spinner disc [T]
t time [T]
v0 the total velocity of a particle when it leaves the spinner plate [L/T]

vT particle terminal velocity in water [L/T]
V the volume of a particle [L3]
x position vector of a particle from the edge of the spinner plate [L]
α,β characteristic roots to the pure-sliding, on-spinner differential equation [-]
µ friction coefficient between a particle and the spinner disc and a particle
and a spinner vane [-]
ρ mass density of a particle [M/L3]
ρair mass density of air [M/L3]
ρw mass density of water [M/L3]
τ the total time from when a particle leaves the spinner plate to when it
contacts the ground [T]
ω rotational speed of the spinner plate [1/T]
θ angular position of the particle about its center of mass[-]

1
1. Introduction
In recent years, greater emphasis has been placed on the proper handling and
application of agricultural fertilisers in order to increase crop yield, reduce costs, and
minimise environmental pollution. Granular fertilisers are the most common type of
agricultural fertiliser since they are easily produced, transported, and applied. In order to
be effective, however, granular fertilisers must be properly handled and distributed.
One of the most common granular fertiliser application devices is the spinner
spreader. The spinner spreader consists of a rotating disc with vanes bolted to the disc
surface (Fig. 1). Fertiliser poured onto the spinner is thrown onto the ground after
colliding with the rotating vanes. The chief advantages of the spinner spreader are that it
has a large spread width, small size, simple and robust construction, and is inexpensive to
produce.
The performance of spinner spreaders has been widely investigated. Studies have
typically focused on analytical models for particle trajectories on and off of the spinner.
Several experimental studies have also been performed, but these often utilise idealised
particles, typically steel ball bearings, or a limited number of granular fertilisers. An
excellent summary of many of these studies, in addition to the significant material
properties affecting fertiliser distribution from spinner spreaders, is given in Hofstee and
Huisman (1990) and Hofstee (1992).
Patterson and Reece (1962) investigated the motion of spherical particles on a spinner
with a near-centre feed neglecting particle bounce off of the spinner vanes. They
developed analytical models for on-spinner particle motion and found reasonable

2
agreement between their models and experimental measurements of the radial and total
velocities of steel ball bearings leaving the spinner plate as well as the angle between
where particles are dropped and where they leave the spinner plate. Inns and Reece
(1962) developed a similar model for on-spinner particle motion, but considered an off-
centre feed and particle bounce against the spinner vanes. Their model predicted the
dynamics of steel ball bearings well but performed poorly for irregularly-shaped fertiliser
particles due to the wide range of rebound angles. Cunningham (1963) developed models
for various straight and curved vane configurations that were later found to be consistent
with experimental measurements of the angle at which two different fertilisers leave the
spinner plate (Cunningham & Chao, 1967). Hofstee (1994 & 1995) utilised an ultrasonic
transducer to determine the velocity and direction of particles leaving a spinner spreader.
He found that the friction coefficient between a particle and the spinner plate and vane is
a significant variable; however, obtaining representative values for this variable for use in
on-spinner models is difficult.
Mennel and Reece (1963) developed an approximate model for off-spinner particle
trajectories assuming turbulent flow. Although their model includes drag coefficients for
both spherical and irregularly-shaped particles, they only compared their analytical
results with experimental measurements using steel ball bearings. They report good
agreement between the model and experiments but do not present the experimental data
in their publication. Pitt et al. (1982) simplified the off-spinner equations of motion to
generate an explicit analytical expression for the distance a particle travels after leaving
the spinner plate. The error between the approximate solution and the models of Mennel
and Reece (1963) is less than 7%. Using their explicit relation, they found that the

3
particle size distribution has little influence on the shape of the fertilizer spread pattern,
but that the drop location of the particles does have a significant effect. An experiment
using ammonium nitrate showed general agreement with the predicted spread pattern
assuming a range of drop locations.
The previously described models have been incorporated into comprehensive
simulation studies by Griffis et al. (1983) and Olieslagers et al. (1996). These
comprehensive models consider both on-spinner and off-spinner particle motion and
ultimately predict the location at which particles land on the ground. Griffis et al. (1983)
compared their predicted spread patterns with experiments using two different fertilisers
and found large discrepancies. They attributed these to irregularly-shaped particles (the
models assumed spheres) and particle-particle interactions. Olieslagers et al. (1996) also
found a significant difference between their predicted spread pattern and an experimental
distribution. They also attributed the discrepancy to particle-particle interactions, which
they corrected for by adjusting the simulation input parameters to fit the experimental
data.
These previous investigations have greatly increased our understanding of how to
model the dynamics of particles distributed by a spinner spreader. However, relatively
few experiments, many of which utilise idealised fertiliser particles such as steel ball
bearings, have been performed to validate the analytical models, especially using a wide
variety of actual granular fertilisers. Our goals in this paper are to review the analyses for
on- and off-spinner particle dynamics, and compare predictions from these models to
experimental data for sixteen granular fertilisers.

4
2. Analyses
Analyses of the granular fertiliser dynamics are presented in two sections: particle
dynamics while on the spinner plate (on-spinner dynamics) and particle dynamics after
the fertiliser has left the spinner plate (off-spinner dynamics). In both of these analyses,
it is assumed that particles do not interact with one another.
2.1. Particle dynamics on the spinner plate
A schematic of the geometry used to investigate the on-spinner particle dynamics is
shown in Fig. 2. A flat spinner with radial vanes is used in this analysis since the
experiments also utilize this geometry. A particle is assumed to fall onto the spinning
plate against a vane, without bouncing, and with zero radial velocity at the ‘drop’ radius,
r0. The analysis is presented for both pure-sliding and pure-rolling conditions.
2.1.1. Pure sliding
Applying Newton’s Second Law in the radial direction to the particle and considering
centrifugal acceleration and sliding friction forces applied by the vane and the plate
gives:
22 - mr mr mr mgµ ω ω µ= − + (1)
where the overdots imply differentiation with respect to time t, m is the particle mass, r is
the radial position of the particle, ω is the angular velocity of the spinner plate, µ is the
particle/vane and particle/plate friction coefficient (the two friction coefficients are
assumed to be equal) and g is the gravitational acceleration. Equation (1) is identical to
5
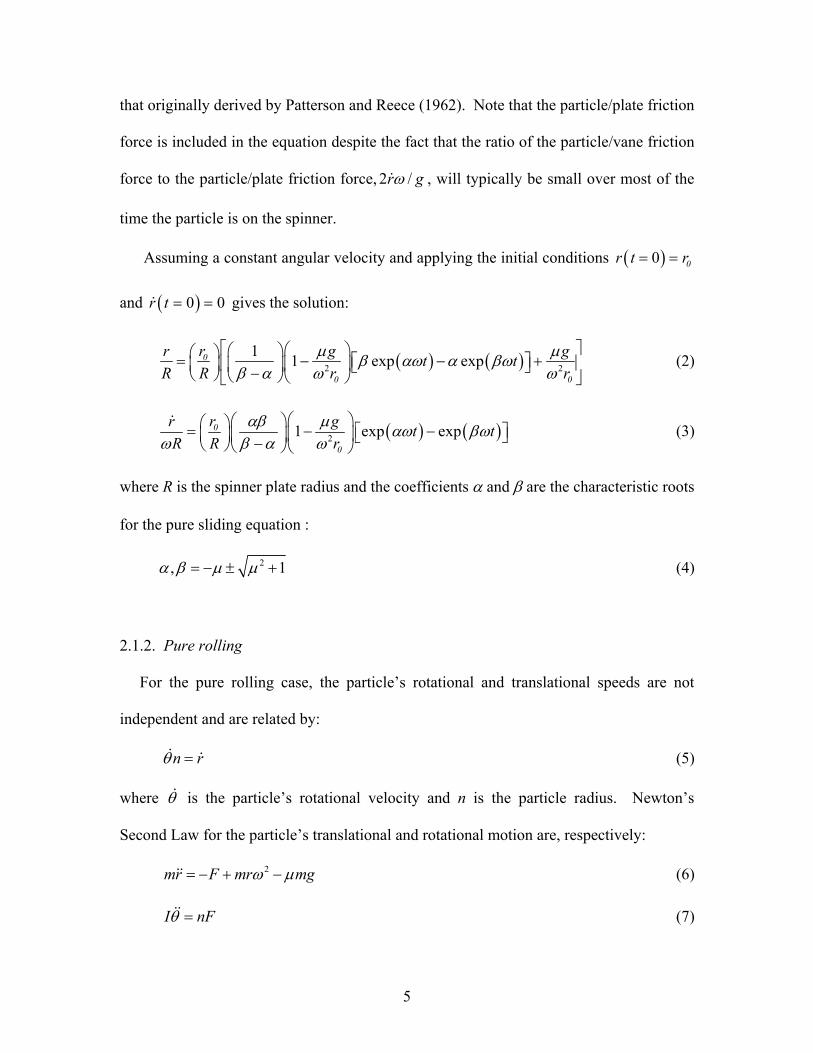
that originally derived by Patterson and Reece (1962). Note that the particle/plate friction
force is included in the equation despite the fact that the ratio of the particle/vane friction
force to the particle/plate friction force, 2 /r gω , will typically be small over most of the
time the particle is on the spinner.
Assuming a constant angular velocity and applying the initial conditions ( )0 0r t r= =
and ( )0 0r t = = gives the solution:
( ) ( )2 2
1 1 exp exp0
0 0
r r g gt tR R r r
µ µβ αω α βωβ α ω ω
= − − + − (2)
( ) ( )21 exp exp0
0
r r g t tR R r
αβ µ αω βωω β α ω
= − − − (3)
where R is the spinner plate radius and the coefficients α and β are the characteristic roots
for the pure sliding equation :
2, 1α β µ µ= − ± + (4)
2.1.2. Pure rolling
For the pure rolling case, the particle’s rotational and translational speeds are not
independent and are related by:
n rθ = (5)
where θ is the particle’s rotational velocity and n is the particle radius. Newton’s
Second Law for the particle’s translational and rotational motion are, respectively:
2mr F mr mgω µ= − + − (6)
I nFθ = (7)
6
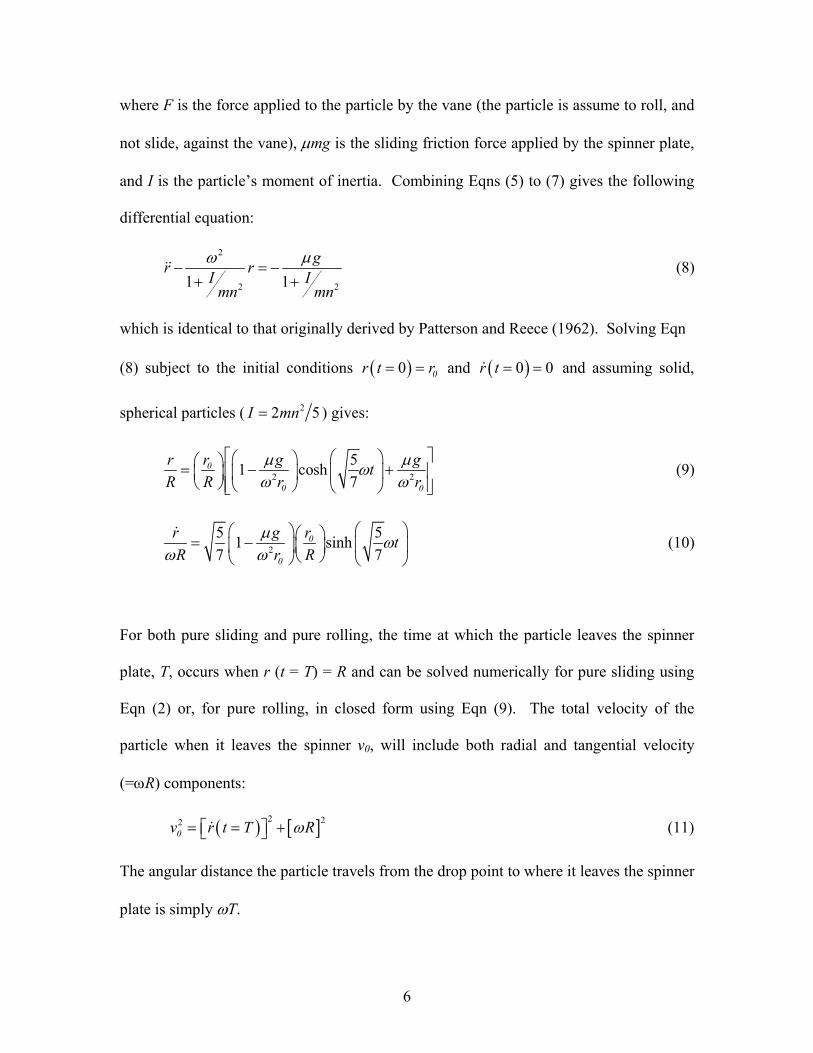
where F is the force applied to the particle by the vane (the particle is assume to roll, and
not slide, against the vane), µmg is the sliding friction force applied by the spinner plate,
and I is the particle’s moment of inertia. Combining Eqns (5) to (7) gives the following
differential equation:
2
2 21 1gr rI I
mn mn
ω µ− = −
+ + (8)
which is identical to that originally derived by Patterson and Reece (1962). Solving Eqn
(8) subject to the initial conditions ( )0 0r t r= = and ( )0 0r t = = and assuming solid,
spherical particles ( 22 5I mn= ) gives:
2 2
51 cosh7
0
0 0
r r g gtR R r r
µ µωω ω
= − +
(9)
2
5 51 sinh7 7
0
0
r g r tR r R
µ ωω ω
= −
(10)
For both pure sliding and pure rolling, the time at which the particle leaves the spinner
plate, T, occurs when r (t = T) = R and can be solved numerically for pure sliding using
Eqn (2) or, for pure rolling, in closed form using Eqn (9). The total velocity of the
particle when it leaves the spinner v0, will include both radial and tangential velocity
(=ωR) components:
( ) [ ]2 220v r t T Rω= = + (11)
The angular distance the particle travels from the drop point to where it leaves the spinner
plate is simply ωT.

7
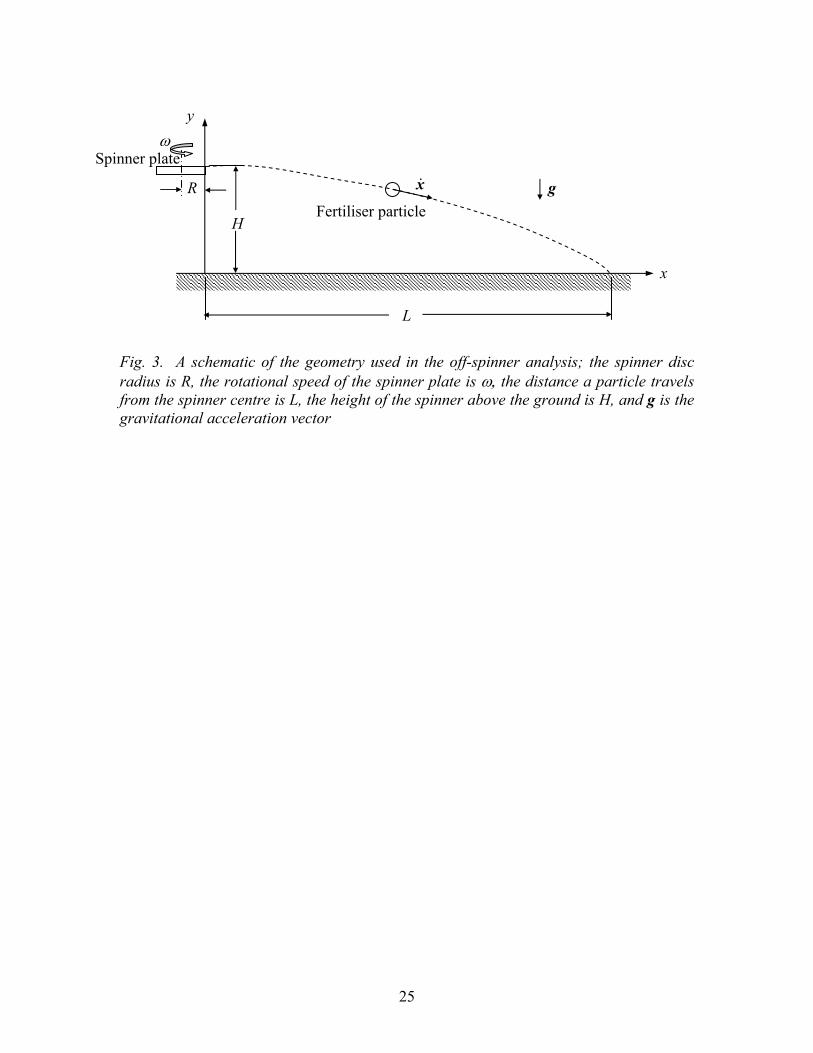
2.2. Particle motion off the spinner plate
A schematic of the off-spinner geometry is shown in Fig. 3. The spinner plate is
assumed to remain level and is located a height H, above the ground. A particle is
assumed to leave the spinner plate with the total velocity given by Eqn (11). The forces
acting on a particle after it leaves the plate are assumed to include only gravitational
forces and aerodynamic drag. Lift forces due to particle rotation and local drag
coefficient void fraction effects are neglected. From Newton’s Second Law, a particle’s
equations of motion are:
D airm m C A / 2ρ= −x g x x (12)
where x is the particle’s position, CD is the particle’s drag coefficient, A is the particle’s
frontal-projected area, ρair is the surrounding air density, and g is the gravitational
acceleration vector (assumed to act in the downward vertical direction).
To simplify the analysis, the drag coefficient is assumed to remain constant over the
range of Reynolds numbers encountered by the particle. For spherical particles, the drag
coefficient is nearly constant at 0.44 over the range of Reynolds numbers between 1000
and 200,000 (see for example, Fox & McDonald, 1999). However, for typical granular
fertilisers that are more irregular in shape, the transition to a constant drag coefficient
occurs at a much lower Reynolds number, typically around 50 (Lapple, 1951). For a
typical fertiliser with a diameter of 2 mm traveling through air, the Reynolds number will
be larger than 50 for particle velocities greater than 0.4 m/s. Eqns (2) and (3) predict that
a sliding particle with a friction coefficient of 0.5 dropped at a radius of 5.0 cm will leave
a 30.5 cm diameter spinner plate rotating at 540 rpm at a velocity of 10.1 m/s, well above

8
the critical transition velocity. Hence, a constant drag coefficient is a reasonable
assumption.
The initial conditions for solving Eqn (12) are:
( ) ( )0 0,t H= =x (13)
( ) ( )0 ,00t v= =x (14)
where v0 is the total particle velocity found from Eqn (11). The closed form solution to
Eqn (12) subject to initial conditions in Eqns (13) and (14) for the time τ that a particle
remains airborne (the particle will contact the ground when the vertical component of the
position is zero) and the horizontal distance the particle travels L are given, respectively,
by:
( ) ( )ln exp exp 2 1H Hτ ′ ′ ′= − − − (15)
( )ln 1 0L vτ′ ′ ′= + (16)
where:
12
0 0
air D
Kg H HK
KL LK v vg
C AKV
τ τ
ρρ
′ ′≡ ≡
′ ′≡ ≡
≡
(17)
The primed quantities in the previous equations are expressed in dimensionless terms.
The quantity K is an aerodynamic resistance coefficient taking into account the particle’s
drag coefficient CD, frontal projected area A, volume V, and the ratio of the air to particle

9
densities ρair/ρ (Grift et al., 1997). Eqns (15) and (16) have not been previously
presented in the literature.
3. Experiments
Experiments were performed to measure both on-spinner and off-spinner particle
trajectories as well as material properties. Sixteen fertiliser materials, listed in Table 1,
were used in the experiments. The objectives of the experiments were to determine
typical fertilizer properties and determine how well the previously described models
predict the trajectories for a much wider variety of materials than has been previously
reported in the literature.
3.1. Material characterisation
Measurements of the particle size distributions, densities, friction coefficients, and
aerodynamic resistance coefficients were made for each of the fertilisers and are listed in
Table 1. Details of the measurements are given in the following sections.
3.1.1. Particle shape
Although a detailed analysis of the particle shapes was not made, a brief discussion of
the general shapes is presented here. Five of the materials were roughly angular in shape,
two were roughly spherical, and five had shapes that were somewhere between angular
and roughly spherical. Urea was nearly spherical in shape while the AMS (ammonium

10
sulphate) standard and DAP (diammonium sulphate) had crystalline shapes. The pell
lime was roughly spherical in shape but also had a large percentage of agglomerated
particles.
3.1.2. Particle size distribution
The particle size distributions and size guide numbers (SGNs - the median particle
sieve diameter in hundredths of a millimeter as indicated by the Canadian Fertiliser
Institute, 1986), were determined using a sieve analysis with aperture sizes ranging from
4.75 to 1.00 mm (Endecott’s Ltd. ASTME:11 sieves). The SGNs are reported in Table 1
along with the diameters below which 84% and 16% (by mass) of the material was
collected (corresponding to ±1 standard deviation). Twelve of the sixteen materials have
an SGN within ±10% of the mean SGN value of 212, i.e. 2.12 mm. However, the
uniformity of each material varies considerably as indicated by the large differences
between the 84% and 16% values. The smallest SGN value of 123 corresponds to AMS
Standard, which contained a large number of fines resulting, presumably, from the
product’s friability. The largest SGN of 292 corresponds to the pell lime, which
contained a large percentage of agglomerated particles. Both of these materials also have
the largest non-uniformity. Urea, a nearly spherical material, and the zinc micronutrient
have the greatest uniformity of size. A typical size distribution plot is shown in Fig. 4 for
the zinc micronutrient.
3.1.3. Particle density
11
The particle mass densities ρ, were determined by measuring the volume of water
displaced in a graduated cylinder for a known mass of particles. The cylinder was tapped
several times after the particles were poured into the cylinder in order to eliminate
trapped air bubbles, and the displacement measurements were quickly made in order to
avoid errors due to particle dissolution. More than twenty separate density measurements
were made for each material to obtain an average value. The variations in each material’s
density measurements were less than 5% from the average.
The particle densities for the sixteen materials are also reported in Table 1 and range
from 1260 kg/m3 for the urea to 2600 kg/m3 for the limestone. Most of the material
densities fall into two groups. Nine of the materials have a density within ±10% of 1910
kg/m3 while five materials have densities within ±4% of 2510 kg/m3.
3.1.4. Friction coefficient
Since the friction coefficient µ, between the particle and the spinner vane and particle and
spinner plate plays an important role in the spinner dynamics, measurements of the
friction coefficient between the fertiliser materials and the spinner plate material
(aluminum) were made for several of the fertilisers. A crude estimate of the friction
coefficient was made by gluing fertiliser particles to a flat, wooden block, then placing
the block on an aluminum plate and tilting it until the block first begins to slide. The
tangent of the plate angle at which first movement occurs is the static friction coefficient.
The friction coefficient measurements were only made for some of the materials.
Since the measured values are all close to 0.5 with a large relative error of ±0.1,
additional measurements were deemed unnecessary. While this measurement method is

12
not very accurate, it at least gives some estimate of the friction coefficients. Hofstee
(1992) measured friction coefficients between aluminum and six different fertilizers at
four different normal loads over a range of relative velocities between 1.0 to 21.0 m/s.
His friction measurements ranged from approximately 0.33 to 0.44 over the range of
tests, close to the values reported here. Note that Hofstee (1992) made measurements of
the dynamic friction coefficient values rather than the static values. Hence, we expect out
results to be larger than those reported by Hofstee (1992). Since the on-spinner dynamics
utilize a dynamic friction coefficient, we expect our predicted results using the static
value to give velocities that are smaller than the measured values. Note that spinner plates
in practice are often coated with rust along with a variety of fertiliser dusts so a very
accurate measurement of friction coefficient is unwarranted and instead reporting a range
of possible friction coefficients is more reasonable.
3.1.5. Aerodynamic resistance coefficient
The aerodynamic resistance coefficient K, of the particles plays an important role in
the off-spinner dynamics as indicated in the previous analyses (Eqns (15) to (17)).
Measurements of individual particle aerodynamic resistance coefficients can be difficult
to make. Law and Collier (1973) designed an elutriator for determining the terminal
velocity aerodynamic resistance coefficients of five fertiliser materials and three types of
seed. Grift et al. (1997) described experiments utilising a 15.8 m tall, enclosed tube drop
tower for determining the aerodynamic diameters of three different fertilisers. A drop
tower apparatus was utilised here to measure the terminal velocity resistance coefficients,
but instead of dropping particles in air which requires a large vertical distance before the

13
particle terminal velocity is reached, a 1.5 m tall, 7.6 cm inner diameter water column
was used. There are two advantages to using water as the surrounding fluid rather than
air. First, a particle reaches its terminal velocity in water in roughly 1% of the distance it
takes in air. Second, the terminal velocity of the particle in water is approximately 5% of
that in air and, as a result, the time required for the particle to pass a known distance can
be easily measured using a hand-held stopwatch rather than requiring specialised
electronic equipment. The primary disadvantage to using water as the surrounding fluid is
that the terminal Reynolds number in water is much smaller than that in air. However, as
long as the terminal Reynolds number is greater than approximately 50, the resistance
coefficient will not vary considerably with Reynolds number (Lapple, 1951).
The terminal aerodynamic resistance coefficient K can be determined by considering
gravitational, drag, and buoyant forces acting on a particle:
212 0D w T wVg C v A Vgρ ρ ρ− + + = (18)
where ρ is the particle density, V is the particle volume, g is the acceleration due to
gravity, CD is the drag coefficient, ρw is the water density, vT is the particle’s terminal
velocity, and A is the particle’s frontal projected area. Solving for the aerodynamic
resistance coefficient as defined in Eqn (17) gives:
21 air
w T
gKv
ρ ρρ ρ
= −
(19)
where ρair is the density of air and the terminal velocity is:
THvT
∆=
∆ (20)

14
where ∆H is the height the particle falls in the drop tower over time ∆T. For the
experiments performed here, the value for ∆H was 1.5 m, and ∆T ranged from 6.2 s to
19.2 s depending on the material tested. The error in measuring the transit time with a
hand-held stopwatch was estimated at ±0.1 s. The terminal velocities range from 0.08 –
0.25 m/s giving a range of Reynolds numbers from 130-720, well above the critical
Reynolds number of 50. Twenty measurements were averaged for each fertiliser material
to give the aerodynamic resistance coefficients reported in Table 1. The measured K
values range between 0.12 m-1 and 0.45 m-1 with an average value of 0.24 m-1. These
values are at the high end of the K values reported by Hofstee and Huisman (1990) and
within the range of values measured by Law and Collier (1973).
3.2. Particle motion on the spinner plate
The spinner plate used in the experiments consisted of a flat 30.5 cm diameter
aluminum plate with four 2.5 cm tall radial vanes spaced every 90° (Fig. 1). The plate
was driven by a DC motor (Leeson Electric Corp. 12V DC) attached to a variable DC
power supply (Nobatron DCR60). The rotational speed of the spinner plate was
determined using a stroboscope (Nova-Strobe DA 115 KT). Individual fertiliser particles
were dropped onto the plate from a height just greater than the vane height to minimise
bouncing in the vertical direction. A drop radius of 26 mm was used in all of the
experiments.
The trajectory of a particle on the spinner plate was recorded using a high-speed video
camera (RedLake MotionScope 1000S) operating at 500 frames/s. The particle radial

15
velocity was determined by measuring the radial distance the particle traveled between
successive frames on the videotape. The distance measurements were made using a ruler
attached to the rotating plate. The position measurements have an error of ±0.1 mm.
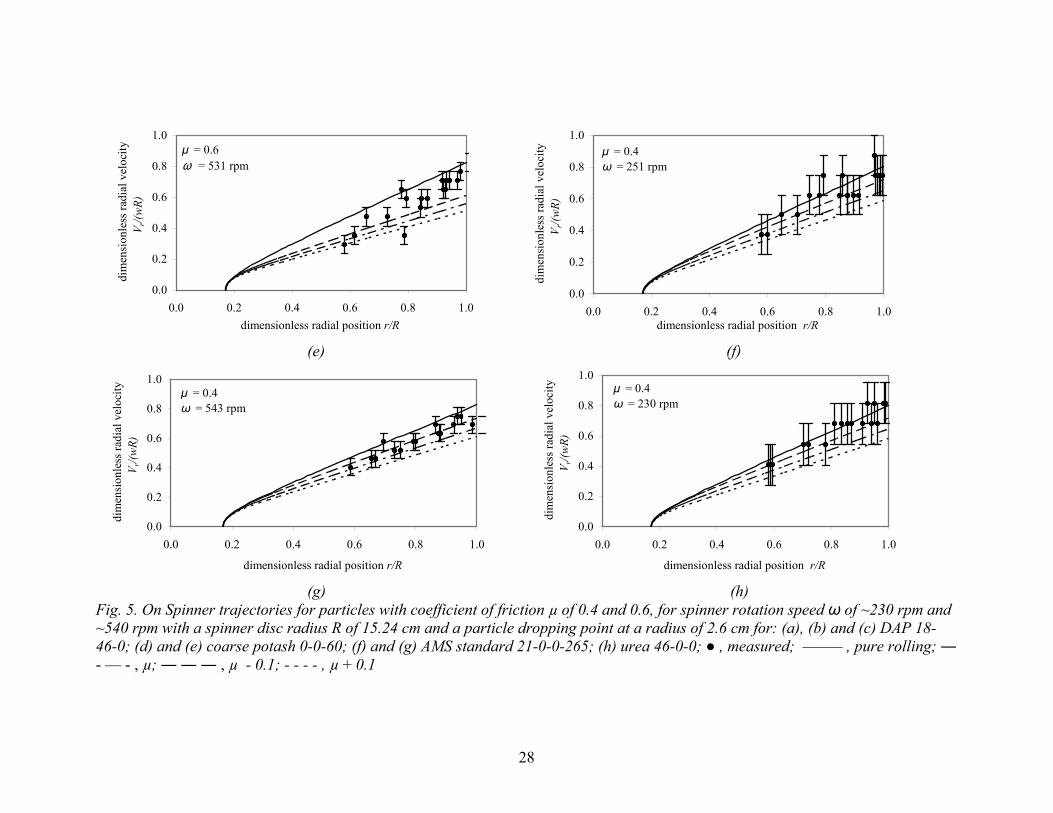
The radial trajectories of four different materials (urea, DAP, coarse potash, and AMS
Standard) at two nominally different spinner rotation speeds (~230 and ~540 rpm) were
investigated. The data, presented in dimensionless form, are shown in Fig. 5a-h. The
curves in the figures correspond to the analytical models discussed previously. Due to
the camera’s limited field of view, measurements could only be made at the outer half of
the disc radius.
3.3. Particle motion off the spinner plate
The distance particles are thrown from the spinner before contacting the ground was
also measured using the previously described spinner plate apparatus. The surface of the
fixed spinner plate was located 1.0 m above the ground. A row of 15 plastic collection
trays, each with a depth of 8.9 cm and a rectangular planform area with dimensions 20.3
cm by 27.9 cm, was arranged in a single row emanating radially from the spinner center.
The tray centers were spaced 30.5 cm apart. A plastic tarpaulin was spread on the floor
beneath the trays to minimise the bouncing of particles from the floor into the trays. The
entire spinner/tray experiment was located indoors to eliminate wind effects.
The experiments proceeded by pouring the fertiliser material through a funnel with a
1.3 cm diameter exit from a drop height just greater than the height of the spinner vanes.
The drop radius in the experiments was nominally 5.1 cm. After the material was
16
distributed from the spinner, the mass of the particles collected in each of the trays was
measured using an electronic scale (Acculab VI-4800).
Distribution experiments were conducted for all 16 materials at two spinner speeds
(~540 and ~810 rpm). Three trials were conducted for each operating condition in order
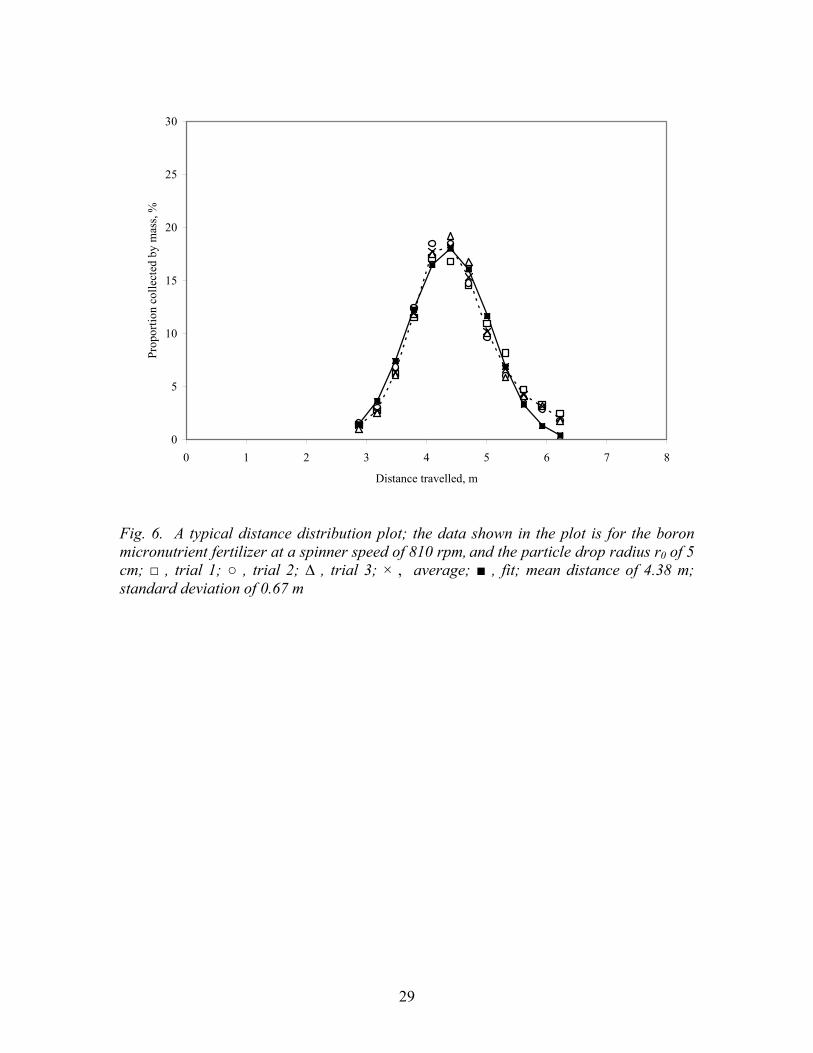
to verify repeatability of the experiments. A typical distribution result is shown in Fig. 6
for the granular boron distributed by the spinner operating at 810 rpm. The plot shows
the percentage of material collected in each tray (compared to the mass collected in all of
the trays) as a function of the distance from the spinner center. The total mass collected
in all of the trays was typically 110 gms. As can be seen in the figure, the three trials
produced very similar results. In order to compare the experimental and analytical results
more easily, each tray’s mass collected percentage is averaged over the three trials. The
resulting averaged distribution curve is then fit to a Gaussian curve using a least squares
approach in order to give a well-defined mean distribution distance and standard
deviation. The Gaussian curve fit closely follows the averaged data except at points
furthest from the spinner where the curve fit tends to under-predict the distribution of
fertiliser.
The mean distribution distances and standard deviations for all sixteen materials are
presented in Fig. 7. There is a variation of less than 25% in the mean distances for a
given spinner rotational speed. The mean distribution distances at 540 rpm vary between
2.7 m for AMS Standard and 3.4 m for pell lime. The distances for 810 rpm range
between 4.0 m for the AMS Standard and 4.8 m for the pell lime. In general, the lower
the material’s aerodynamic resistance coefficient, the further the material travels, as
expected. The distribution standard deviations are approximately 10-15% of the mean

17
distance values for 540 rpm and 10-20% of the mean for 810 rpm. Hence, the sixteen
fertilisers tend to collect at a well-defined location that does not vary significantly
between fertilisers.
4. Comparison of analyses and experiments
4.1. Particle motion on the spinner plate
Figures 5a-h plot the experimentally measured radial velocities of fertiliser particles
on the spinner plate along with the analytical curves given in Eqns (2) to (4) for pure
sliding and Eqns (9) and (10) for pure rolling. A range of sliding friction coefficients is
used in the analyses in order to show the effects of this parameter. The data generally lie
between the pure sliding (using the experimentally measured friction coefficient) and
pure rolling curves; however, the large uncertainty bars in the experimental data make
drawing conclusions regarding friction coefficient and pure rolling trends difficult. Note
that the radial velocity at the disc rim varies by 15 to 25% between the pure rolling and
pure sliding (experimentally determined friction coefficient) cases and can vary by
approximately 5% if the friction coefficient is varied by ±0.1. Hence, the analytical
models perform reasonably well in predicting the on-spinner trajectories; however,
assuming a range of friction conditions from pure sliding with a µ of 0.5 to pure rolling
seems most appropriate.
4.2. Particle motion off the spinner plate

18
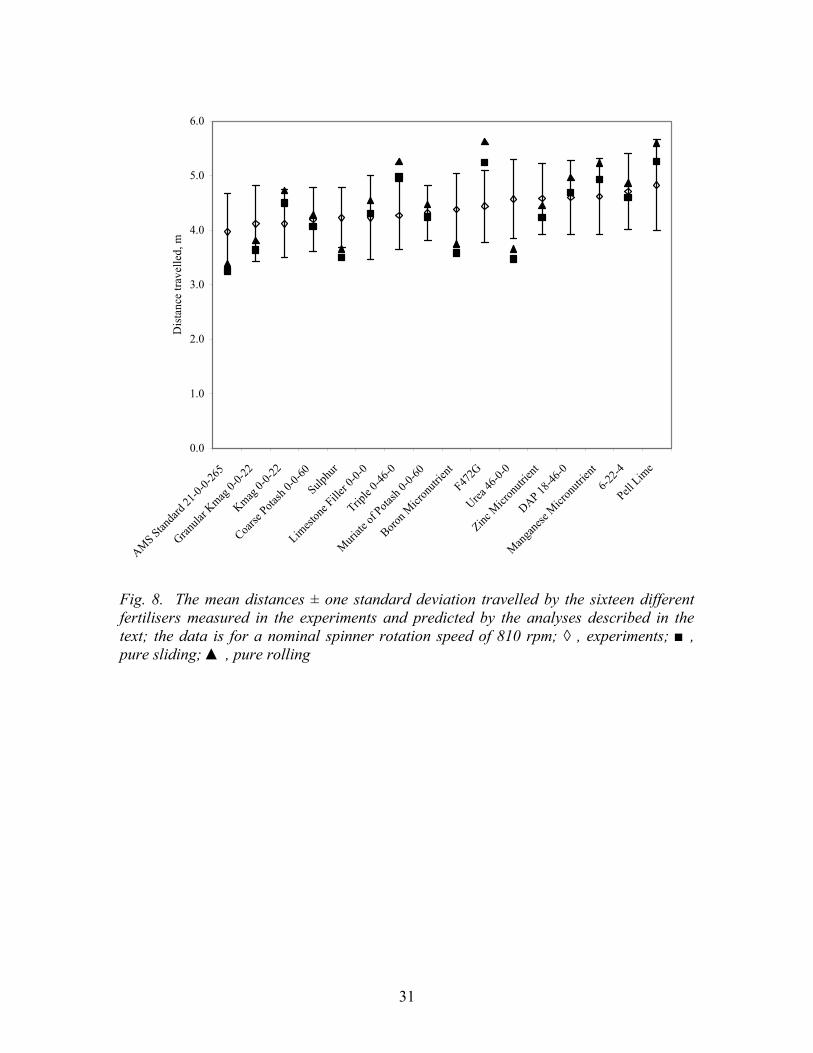
Figures 7 and 8 plot the mean distance and standard deviation data collected in the
experiments, along with the distances predicted using Eqns (15) to (17) assuming an
initial particle speed predicted by the on-spinner analyses (Eqns (2) to (4) and (9) and
(10)) with pure sliding (µ = 0.5) and pure rolling conditions (refer to the discussion in
the previous section for the justification for this range of values).
There is significant variation between the analytical predictions for the distance
travelled and the experimentally measured values. For the 540 rpm data, the models
over-predict the distance traveled for all but two of the fertilisers. No consistent offset is
observed in the 810 rpm data. To quantify the variation between the predictions and the
experiments, we compare the relative difference between the predicted distance averaged
between the pure slip and pure rolling cases, and the mean distance measured in the
experiments. For the 540 rpm case, the variation ranges between 3% and 35% with an
average variation of 15%. Agreement between the experiments and models is better for
the 810 rpm data in which the variation ranges from less than 1% to 23% with an average
of 11% error. A weak correlation between the error and aerodynamic resistance
coefficient is observed with the error decreasing with increasing aerodynamic resistance
coefficient.
Equation (16) indicates that the horizontal distance traveled by a particle L is less
sensitive to small variations in the initial particle speed v0 as v0 increases. This may
account for the smaller error in the predictions at the larger spinner angular speed since
inaccuracies in the on-spinner model have less of an effect on the horizontal distance
travelled.

19
5. Conclusions
A comprehensive experimental and analytical study was performed to investigate
particle trajectories on and off a spinner spreader. Sixteen different granular fertilisers
were used. Measurements of the significant material properties, on-spinner trajectories,
and off-spinner distance distributions were made. Analytical models for the on-spinner
and off-spinner trajectories were also presented and a comparison between the
predictions and experimental results were made.
The experimental data for on-spinner particle trajectories generally lie between the
analytical models for the pure rolling and pure sliding conditions using a sliding friction
coefficient of 0.5. Although the on-spinner motion is relatively sensitive to the friction
coefficient for pure-sliding conditions, using a specific value for the friction coefficient
seems unwarranted since accurate determination of this parameter is difficult, especially
for materials and spinner plates used in practice.
The average relative error between the experimental data for the horizontal distance
traveled by the fertilizer materials after being thrown from the spinner plate and the
combined on- and off-spinner models is 15% and 11% for the 540 rpm and 810 rpm
spinner speeds, respectively. The error generally decreases with increasing aerodynamic
resistance coefficient. Analysis of the off-spinner model indicates that larger spinner
speeds will be less sensitive to variations in the particle speed leaving the spinner plate.
These results suggest that the on- and off-spinner models presented here reasonably
predict, on average, the distance the real fertiliser materials travel. However, these

20
models must be carefully applied for in-field conditions since other factors such as wind
and terrain effects will significantly affect the particle spread patterns.

Acknowledgements
The authors gratefully acknowledge the support of Royster-Clark, Inc. and the National
Science Foundation for their support of this work.

References
Canadian Fertilizer Institute (1986). The CFI guide of material selection for the
production of quality granular blends, Ottawa, Ontario
Cunningham F M (1963). Performance characteristics of bulk spreaders for granular
fertilizer. Transactions of the ASAE, 6(2), 108-114
Cunningham F M; Chao, E Y S (1967). Design relationships for centrifugal fertilizer
distributors. Transactions of the ASAE, 10(1), 91-95
Fox R W; McDonald A T (1999). Introduction to Fluid Mechanics, 5th ed., Wiley
Griffis C L; Ritter D W; Matthews E J (1983). Simulation of rotary spreader
distribution patterns. Transactions of the ASAE, 26(1), 33-37
Grift T E; Walker J T; Hofstee J W (1997). Aerodynamic properties of individual
fertilizer particles. Transactions of the ASAE, 40(1), 13-20
Hofstee J W; Huisman W (1990). Handling and spreading of fertilizers. Part 1:
Physical properties of fertilizer in relation to particle motion. Journal of Agricultural
Engineering Research, 47, 213-234
Hofstee J W (1992). Handling and spreading of fertilizers: Part 2, Physical properties of
fertilizer, measuring methods and data. Journal of Agricultural Engineering Research, 53,
141-162
Hofstee J W (1994). Handling and spreading of fertilizers: Part 3, Measurement of
particle velocities and directions with ultrasonic transducers, theory, measurement system
and experimental arrangements. Journal of Agricultural Engineering Research, 58(1), 1-
16
Hofstee J W (1995). Handling and spreading of fertilizers: Part 5, The spinning disc type
fertilizer spreader. Journal of Agricultural Engineering Research, 62(3), 143-162
Inns F M; Reece A R (1962). The theory of the centrifugal distributor. II: Motion on
the disc, off-centre feed. Journal of Agricultural Engineering Research, 7(4), 345-353
Lapple C F (1951). Fluid and Particle Mechanics, Univ. Delaware Press
Law S E; Collier J A (1973). Aerodynamic resistance coefficients of agricultural
particulates determined by elutriation. Transactions of the ASAE, 16(5), 918-922
Mennel R M; Reece A R (1963). The theory of the centrifugal distributor. III: Particle
trajectories. Journal of Agricultural Engineering Research, 7(3), 78-84

Olieslagers R; Ramon H; De Baerdemaeker J (1996). Calculation of fertilizer
distribution patterns from a spinning disc spreader by means of a simulation model.
Journal of Agricultural Engineering Research, 63, 137-152
Patterson D E; Reece A R (1962). The theory of the centrifugal distributor. I: Motion on
the disc, near-centre feed. Journal of Agricultural Engineering Research, 7(3), 232-240
Pitt R E; Farmer G S; Walker L P (1982). Approximating equations for rotary
distributor spread patterns. Transactions of the ASAE, 25(6), 1544-1552

21
Tables
Table 1 The sixteen fertilisers used in the study with their measured properties; SGN, median particle sieve diameter in mm × 10-2; SGN16, sixteen percent of the material has a particle size in mm × 10-2 below SGN16; SGN84, eighty-four percent of the material has a particle size in mm × 10-2 below SGN84 Material name Material shape SGN,
mm × 10-2
SGN16, mm × 10-2
SGN84, mm × 10-2
Density (ρ), kg/m3
Friction coefficient (µ)
Aerodynamic resistance coefficient (K), m-1
AMS standard 21-0-0-265 Crystalline 123 0 178 1819 0.4 0.456 Granular kmag 0-0-22 Angular 204 122 298 2473 - 0.348 Kmag 0-0-22 Angular 207 130 295 2542 0.5 0.189 Coarse potash 0-0-60 Crystalline 234 179 300 1910 0.6 0.259 Sulphur Angular 201 121 274 1771 - 0.380 Limestone filler 0-0-0 Angular 212 142 276 2604 0.4 0.216 Triple 0-46-0 Roughly spherical 170 124 222 1834 0.5 0.135 Muriate of potash 0-0-60 Angular 228 176 298 1937 0.6 0.232 Boron micronutrient Roughly spherical to angular 208 158 257 1887 - 0.358 F472G Roughly spherical to angular 216 147 267 2070 - 0.110 Urea 46-0-0 Spherical 216 178 261 1257 0.4 0.393 Zinc micronutrient Roughly spherical to angular 198 185 255 2497 - 0.229 DAP 18-46-0 Roughly spherical 211 149 266 1606 0.6 0.168 Manganese micronutrient Roughly spherical to angular 219 160 274 2411 - 0.138 6-22-4 Roughly spherical to angular 252 189 314 1852 - 0.177 Pell lime Roughly spherical (agglomerates) 292 188 371 2105 0.4 0.105
22
List of Figures
Fig. 1. A photograph of the spinner plate apparatus used in the experiments
Fig. 2. A schematic of the spinner vane geometry used in the analysis of the on-spinner particle motion; the spinner rotation speed is ω, the particle drop radius is r0, and the spinner radius is R
Fig. 3. A schematic of the geometry used in the off-spinner analysis; the spinner disc radius is R, the rotational speed of the spinner plate is ω, the distance a particle travels from the spinner centre is L, the height of the spinner above the ground is H, and g is the gravitational acceleration vector
Fig. 4. A typical particle size distribution plot of zinc micronutrient
Fig. 5. On Spinner trajectories for particles with coefficient of friction µ of 0.4 and 0.6, for spinner rotation speed ω of ~230 rpm and ~540 rpm with a spinner disc radius R of 15.24 cm and a particle dropping point at a radius of 2.6 cm for: (a), (b) and (c) DAP 18-46-0; (d) and (e) coarse potash 0-0-60; (f) and (g) AMS standard 21-0-0-265; (h) urea 46-0-0; ● , measured; —–— , pure rolling; ― - — - , µ; ― ― ― , µ - 0.1; - - - - , µ + 0.1
Fig. 6. A typical distance distribution plot; the data shown in the plot is for the boron micronutrient fertilizer at a spinner speed of 810 rpm and the particle drop radius r0 of 5 cm; □ , trial 1; ○ , trial 2; ∆ , trial 3; × , average; ■ , fit; mean distance of 4.38 m; standard deviation of 0.67 m
Fig. 7. The mean distances ± one standard deviation travelled by the sixteen different fertilisers measured in the experiments and predicted by the analyses described in the text; the data is for a nominal spinner rotation speed of 540 rpm; ◊ , experiments; ■ , pure sliding; ▲ , pure rolling
Fig. 8. The mean distances ± one standard deviation travelled by the sixteen different fertilisers measured in the experiments and predicted by the analyses described in the text; the data is for a nominal spinner rotation speed of 810 rpm; ◊ , experiments; ■ , pure sliding; ▲ , pure rolling

23
Figures Fig. 1. A photograph of the spinner plate apparatus used in the experiments

24
Fig. 2. A schematic of the spinner vane geometry used in the analysis of the on-spinner particle motion; the spinner rotation speed is ω, the particle drop radius is r0, and the spinner radius is R
R
ω
r0
r
Spinner vane
Fertiliser particle
r
25
Fig. 3. A schematic of the geometry used in the off-spinner analysis; the spinner disc radius is R, the rotational speed of the spinner plate is ω, the distance a particle travels from the spinner centre is L, the height of the spinner above the ground is H, and g is the gravitational acceleration vector
ω
R
H
x
y
x
L
g
Spinner plate
Fertiliser particle

0
10
20
30
40
50
60
70
80
90
100
0 50 100 150 200 250 300 350 400 450 500Sieve aperature size, mm × 10-2
Prop
ortio
n re
tain
ed o
n si
eve
(by
mas
s), %
Fig. 4. A typical particle size distribution plot of zinc micronutrient
SGN = 216

27
0.0
0.2
0.4
0.6
0.8
1.0
0.0 0.2 0.4 0.6 0.8 1.0dimensionless radial position r/R
dim
ensi
onle
ss ra
dial
vel
ocity
V r
/(wR)
µ = 0.6ω = 230 rpm
0.0
0.2
0.4
0.6
0.8
1.0
0.0 0.2 0.4 0.6 0.8 1.0dimensionless radial position r/R
dim
ensi
onle
ss ra
dial
vel
ocity
V r
/(wR)
µ = 0.6ω = 233 rpm
(a) (b)
0.0
0.2
0.4
0.6
0.8
1.0
0.0 0.2 0.4 0.6 0.8 1.0dimensionless radial position r/R
dim
ensi
onle
ss ra
dial
vel
ocity
V r
/(wR)
µ = 0.6ω = 513 rpm
0.0
0.2
0.4
0.6
0.8
1.0
0.0 0.2 0.4 0.6 0.8 1.0dimensionless radial position r/R
dim
ensi
onle
ss ra
dial
vel
ocity
V r
/(wR)
µ = 0.6ω = 233 rpm
(c) (d)
28
0.0
0.2
0.4
0.6
0.8
1.0
0.0 0.2 0.4 0.6 0.8 1.0dimensionless radial position r/R
dim
ensi
onle
ss ra
dial
vel
ocity
V r
/(wR)
µ = 0.6ω = 531 rpm
0.0
0.2
0.4
0.6
0.8
1.0
0.0 0.2 0.4 0.6 0.8 1.0dimensionless radial position r/R
dim
ensi
onle
ss ra
dial
vel
ocity
V r
/(wR)
µ = 0.4ω = 251 rpm
(e) (f)
0.0
0.2
0.4
0.6
0.8
1.0
0.0 0.2 0.4 0.6 0.8 1.0
dimensionless radial position r/R
dim
ensi
onle
ss ra
dial
vel
ocity
V r
/(wR)
µ = 0.4ω = 543 rpm
0.0
0.2
0.4
0.6
0.8
1.0
0.0 0.2 0.4 0.6 0.8 1.0
dimensionless radial position r/Rdi
men
sion
less
radi
al v
eloc
ity
V r/(w
R)
µ = 0.4ω = 230 rpm
(g) (h)
Fig. 5. On Spinner trajectories for particles with coefficient of friction µ of 0.4 and 0.6, for spinner rotation speed ω of ~230 rpm and ~540 rpm with a spinner disc radius R of 15.24 cm and a particle dropping point at a radius of 2.6 cm for: (a), (b) and (c) DAP 18-46-0; (d) and (e) coarse potash 0-0-60; (f) and (g) AMS standard 21-0-0-265; (h) urea 46-0-0; ● , measured; —–— , pure rolling; ― - — - , µ; ― ― ― , µ - 0.1; - - - - , µ + 0.1
29
0
5
10
15
20
25
30
0 1 2 3 4 5 6 7 8
Distance travelled, m
Prop
ortio
n co
llect
ed b
y m
ass,
%
Fig. 6. A typical distance distribution plot; the data shown in the plot is for the boron micronutrient fertilizer at a spinner speed of 810 rpm, and the particle drop radius r0 of 5 cm; □ , trial 1; ○ , trial 2; ∆ , trial 3; × , average; ■ , fit; mean distance of 4.38 m; standard deviation of 0.67 m

30
Fig. 7. The mean distances ± one standard deviation travelled by the sixteen different fertilisers measured in the experiments and predicted by the analyses described in the text; the data is for a nominal spinner rotation speed of 540 rpm; ◊ , experiments; ■ , pure sliding; ▲ , pure rolling
0.0
0.5
1.0
1.5
2.0
2.5
3.0
3.5
4.0
4.5
AMS stand
ard 21
-0-0-2
65
Sulphu
r
Limest
one f
iller 0
-0-0
Kmag 0-
0-22
Granula
r kmag
0-0-2
2
Coarse
potas
h 0-0-
60
Zinc m
icron
utrien
t
F472G
Triple
0-46-0
Muriate
of po
tash 0
-0-60
Manga
nese
micron
utrien
t
Boron m
icron
utrien
t
DAP 18-46
-0
Urea 46
-0-0
6-22-4
Pell lim
e
Dis
tanc
e tra
velle
d, m
31
0.0
1.0
2.0
3.0
4.0
5.0
6.0
AMS Standar
d 21-0
-0-26
5
Granula
r Kmag
0-0-2
2
Kmag 0-0
-22
Coarse
Potash
0-0-60
Sulphu
r
Limest
one F
iller 0
-0-0
Triple
0-46-0
Muriate
of Pota
sh 0-0
-60
Boron M
icron
utrien
t
F472G
Urea 46
-0-0
Zinc M
icron
utrien
t
DAP 18-46
-0
Mangan
ese M
icron
utrien
t6-2
2-4
Pell Lim
e
Dis
tanc
e tra
velle
d, m
Fig. 8. The mean distances ± one standard deviation travelled by the sixteen different fertilisers measured in the experiments and predicted by the analyses described in the text; the data is for a nominal spinner rotation speed of 810 rpm; ◊ , experiments; ■ , pure sliding; ▲ , pure rolling