Embed Size (px)
Citation preview

D.JRA 5.10 Dissemination level PU
ULICE -GA n°228436 Page 1 of 58
Project co-funded by the European Commission within the FP7 (2007–2013)
Grant agreement no.: 228436
ULICE Union of Light Ion Centres in Europe
Project type: Combination of CP & CSA
Integrating Activities / e-Infrastructures / Preparatory phase
Start date of project: 1st
September 2009 Duration: 48 months
D.5.10 – Representative treatment plans and recommendations for different
fractionation schemes
Delivery date: M42 (13//02/28)
WP n° and title: WP5 – Adaptive Treatment Planning
WP leader: Michael Kraemer
Reporting period: 3nd
Name Partner
Authors: Bleddyn Jones, Urszula
Jelen, Emanuele Scifoni
UOXF, UNIMAR, GSI
Contributor(s): Alina Santiago, Filippo
Ammazzalorso, Michael
Kraemer
UNIMAR, GSI
Pillar coordinator: Richard Poetter MUW
2013/02/28
Approved by TPB and CPO signature
Dissemination Level
PU Public x
PP Restricted to other programme participants (including the Commission Services)
RE Restricted to a group specified by the consortium (including the Commission Services)
CO Confidential, only for members of the consortium (including the Commission Services)

D.JRA 5.10 Dissemination level PU
ULICE -GA n°228436 Page 2 of 58
TABLE OF CONTENTS
LIST OF ABBREVIATIONS AND DEFINITIONS.................................................................................... 3
PUBLISHABLE SUMMARY ........................................................................................................................ 4
PART A –Modeling fractionation in particle radiotherapy ....................................................................... 5
1. Introduction & background radiobiology........................................................................................ 5
2. A brief history of fractionation ......................................................................................................... 5
3. The relevant equations and worked examples ............................................................................... 10
4. RBE and dose per fraction............................................................................................................... 16
5. Effects of regions of higher and lower dose per fraction relative to the prescribed dose for
different fractionation patterns. ...................................................................................................... 18
6. Interpretation of RBE and fractionation effects within the ICRU framework of target volume
definitions. ......................................................................................................................................... 20
7. The use of the LQ model with large fraction sizes......................................................................... 23
8. Optimisation of fractionation using calculus methods.................................................................. 23
9. Model variants .................................................................................................................................. 26
10. Other fractionation contributions .................................................................................................. 27
PART B - Representative treatment plans for different fractionation schemes...................................... 28
1. Head tumours ................................................................................................................................... 28
2. Prostate tumours .............................................................................................................................. 35
3. Head and Neck tumours .................................................................................................................. 39
4. Impact of fraction dose on plan robustness.................................................................................... 46
5. Impact of fraction dose on best particle choice.............................................................................. 49
6. Impact of fraction dose on hypoxia irradiation. ............................................................................ 50
7. Impact of fraction dose on moving targets irradiation ................................................................. 51
CONCLUSIONS............................................................................................................................................ 51
REFERENCES .............................................................................................................................................. 52

D.JRA 5.10 Dissemination level PU
ULICE -GA n°228436 Page 3 of 58
LIST OF ABBREVIATIONS AND DEFINITIONS
RBE=Relative Biological Effectiveness
BED=Biological Effective Dose
LET =linear energy transfer
IMRT= Intensity modulated radiation therapy
GyE=Gray equivalent dose
LEM=Local Effect Model
NT= Normal Tissue
PCP=positively charged particle therapy
LQ= linear quadratic model.
D.JRA 5.10 Dissemination level PU
ULICE -GA n°228436 Page 4 of 58
PUBLISHABLE SUMMARY
In the first part of this report a critical analysis of fractionation in particle therapy and related modeling
approaches is given. In the second part we discuss examples of treatment plans according to different
schemes of fractionation. We present a set of examples we have planned at different fraction sizes with
different α/β ratio combinations (normal tissue versus tumour) and analyze the results, mainly in terms of
dose to normal tissue. The observed dependencies are quite small as compared to photon fractionated plans,
but still reveal a few singularities which suggest specific deepening of research. A general trend of plan
improvement for smaller fraction size appears. Moreover, the impact of fraction dose in different irradiation
approaches is briefly presented and commented.
Fractionation of high LET particle radiotherapy imposes challenges and opportunities to improve and
optimise therapeutic index and cost effectiveness, given that hypofractionation, even if applicable in only
some clinical situations, will allow greater patient throughput. This can be achieved by further experimental
RBE and fractionation programmes, eventually leading to carefully constructed and conducted clinical trials
that will appropriately compare particle radiotherapy with low LET radiotherapy alternatives.
There also needs to be greater understanding of the radiobiological principles and new opportunities to
calculate isoeffective treatments, by taking into proper account of the underlying complexity. Calculations
should include both normal tissues and tumour effects, since they depend on different parameters, and
compromises in choice of dose/fractionation are often necessary. Thus, even if most of the computational
tools are available, as well as the ideal platform for treatment planning, as here shown, further research is
needed to obtain proper BED optimized treatment plans.

D.JRA 5.10 Dissemination level PU
ULICE -GA n°228436 Page 5 of 58
PART A –Modeling fractionation in particle radiotherapy
1. Introduction & background radiobiology
Fractionation refers to the splitting of dose into separate treatment ‘fractions`, or treatment sessions. It is of
vital importance in radiotherapy since fractionation can be used to change clinical outcomes, or can be used
to achieve closely similar outcomes. For example, a greater degree of fractionation of the same total dose
reduces most tissue side-effects, whereas the same biological endpoint can be achieved by two very different
fractionation schedules provided total dose is changed to accommodate the degree of fractionation used.
Time is a further parameter, since the overall treatment duration is related to the number of fractions
multiplied by the average inter-fraction interval. Fractionation was often referred to as “time-dose-
fractionation”. The role of time will be considered later in this text.
There is a large literature on fractionation of conventional x-ray (photon) based therapy, which varies from
relatively simple qualitative considerations to more complex mathematics. The process of fractionation
includes variables which are in most situations under medical control: the dose per treatment (d), the number
of treatments (n), the total dose D (or n×d) and the overall treatment time (t). In general, when n is increased,
d decreases (to an extent that D almost always increases) in order to preserve the same bio-effect. This
occurs due to sub-lethal radiation damage repair between fractions: the greater the fractionation the greater
the opportunity for repair between fractions. It follows that cells which have defects in damage recognition
or repair pathways, as found in mutated tumour cells, will be more radiosensitive and less fraction sensitive.
Prolongation of t may also require increases in d or n, or both, in order to preserve a biological iso-effect
such as to match tumour cell repopulation with time in the case of tumours that contain rapidly dividing
cells, or normal epithelial tissues that contain rapidly growing cell populations. The relative magnitude of
these changes vary in different normal tissues and tumours, depending on their biological properties:
• Slow proliferation states, associated with a high repair capacity, have a high fractionation sensitivity:
that is a large change in effect follows a small change in d. These conditions are characterised by a
low α/β ratio.
• Fast proliferation states, associated with a lower repair capacity, have a lower fractionation
sensitivity: that is a much smaller change in effect follows a small change in d. These conditions are
characterised by a high α/β ratio.
Although there have been many attempts to characterise fractionation ‘rules’ in terms of equations, the most
successful and widely used model is that of the linear quadratic (LQ) model of radiation effect, which
contains α and β radiosensitivity parameters and for fractionation studies the α/β ratio is important since it is
essentially inversely related to fractionation sensitivity, although the terms are sometimes used
synonymously.
The term hypofractionation may require clarification: this essentially refers to a shift in fractionation to
larger doses per fraction than 2 Gy by using fewer numbers of fractions. The converse is hyperfractionation.
These terms can be confusing to some readers. Accelerated fractionation refers to dose schedules which
deliver greater than 2 Gy (of conventional radiotherapy photons or x-rays) per day, independently of the
number of fractions per day or week.
2. A brief history of fractionation
2.1 Radiobiology
In the meantime, Fowler et al (1963) had confirmed the dominance of dose per fraction in comparison with
overall time for experimental pig acute skin reactions and later applied linear quadratic theory, originally an
empirical description of the yield of lethal chromosomal events with dose per cell by Douglas Lea, to the
study of isoeffective doses (Douglas & Fowler, 1976) using an algebraic reconfiguration of the LQ model in
the form of an FE plot (Fractionation Effect).

D.JRA 5.10 Dissemination level PU
ULICE -GA n°228436 Page 6 of 58
Linear quadratic effect, E (or yield of lethal chromosomal aberrations in terms of Lea`s findings), is
expressed in fractionated form as:
E=n (αd+βd2) [2.1]
It follows that
dEED
βα+=
1 [2.2]
This transformation to linearity allowed Douglas and Fowler (1976) to study iso-effective doses in their ‘Fe’
(or fractionation effect) plots of 1/D against d. By taking the ratio of the intercept to the slope showed that
α/β ratios differed for acute and late effects. They also, importantly showed that α/β values were far higher
for fast neutron fractionation experiments, including in pig skin which closely resembles human skin in
radiation tolerance. This finding correlated with the fact that increased fractionation does not require as great
a change in total dose as in the case of X-rays (photons) to preserve an iso-effect.
Denekamp (1973) showed that the time effect, measured as the additional radiation dose required to maintain
an isoeffective skin reaction, was variable and commenced after a finite time delay: mouse skin repopulation
is initiated only after the expression of radiation damage and so the concept of acceleration of repopulation in
early reacting tissues emerged (Denekamp et al 1974). It is therefore inappropriate to use a power law model
for such an effect since the change in isoeffective dose with time requires a variable slope, even on a
logarithmic plot. For tumour control, Fowler et al (1974, 1976) described an optimum overall time in an
experimental tumour while maintaining a normal tissue (skin) isoeffect, followed by later experiments by
Suit and colleagues (1977). This achievement was attributed to effective tumour reoxygenation at the
optimum overall time since equally high tumour control was found at much shorter overall times either by
the addition of metronidazole (as a hypoxic cell sensitiser), or by using fast neutrons (due to their reduced
dependency on oxygen for cell killing, often referred to as a reduced oxygen enhancement ratio). At longer
overall times than the optimum time, tumour control was progressively reduced probably due to tumour cell
repopulation.
During the 1980s further progress included the detailed analysis of Withers that acute reacting tissues (by
then characterised by high α/β values) required little change in total dose with increasing fractionation,
whereas late reacting tissues (with low α/β ratios) required more substantial changes in total dose: the form
of the relationship, with an asymptotic limit at very small values of d (large n) was compatible with LQ
theory. Towards the end of the decade several advances occurred, including:
1. Inclusion of a repopulation factor alongside the LQ surviving fraction [by Dale, Fowler, Tucker and
Travis. Van den Geijn] in one equation which allowed different fractionation schedules to be
compared and allowed Fowler to speculate that clinical outcomes with quite different schedules
could be broadly equivalent.
2. Evolution of the LQ model to the Biological Effective Dose concept following the original idea of
Barendsen and subsequent important adaptations by Dale and Fowler. This allowed calculation of
isoeffective (or equieffective) treatment schedules, ranking of different fractionation schedules,
addition of multiple phases of treatment by different radiation modalities or different fractionation
patterns, different dose rates [Jones et al (2001), Fowler (2010)] and eventually the inclusion of RBE
limits, as originally described by Bewley, in BED equations for high LET radiations [Jones, Carabe-
Fernandez and Dale, 2007, Carabe-Fernandez, Jones and Dale, 2008], and which allow a variable or
flexible RBE to change with dose per fraction, as will be shown later.
2.2 Clinical
Progress in clinical fractionation was made by careful empirical practice and observation. Following the lead
of Regaud in France, who used very low dose rate radium applications, Coutard noted that protraction and
hyper-fractionation of teletherapy to high total doses produced a substantial reduction in both acute and late
effects of therapy while maintaining the desired tumour effect. There emerged several different “schools” of

D.JRA 5.10 Dissemination level PU
ULICE -GA n°228436 Page 7 of 58
radiotherapy, separated not just geographically and linguistically but also by differing attitudes to selection
of dose per fraction. The French (Coutard, Baclesse, Pierquin, Chassagne) and American schools (Fletcher,
Kaplan, Hellman, Suit) had a preference for small fractions over protracted time durations. In Germany and
Austria experience was gained in the use of hypofractionation. In the United Kingdom, severe economic
constraints in the provision of radiotherapy equipment led to sequential fractionation studies, particularly in
Manchester (Patterson) and Edinburgh (McWhirter), where relatively hypofractionated schedules were
preferred (2.25-3.5 Gy per fraction).
The advent of megavoltage radiotherapy, with improved depth dosage, led to further and more formal
studies, such as the studies at The Hammersmith Hospital (for example those published by Morrison, 1975).
There, patients were treated with several total doses, but the overall time remained constant since the number
of fractions was fixed at twenty. The results effectively confirmed that small increments in dose per fraction
and total dose in twenty fractions caused enhanced toxicity and tumour control. A general trend emerged:
Cancer Centres in the North of England, Scotland & Canada (Duncan, Bush, Ryder, Ross, Pointon) favoured
daily hypofractionated radiotherapy at 2.5 - 3.3 Gy per fraction in 15 to 20 fractions over 3-4 weeks, while
those in the South of England/London (Cade, Smithers, Ledermann, Bloom, Jones) favoured the
French/American approach of conventional daily (five fractions per week) doses of 1.8 - 2 Gy given in 30-35
fractions over 6-7 weeks. These prescription differences are very significant, but there was at that time no
reliable method for quantification of the effect of variation in overall time, total dose and dose per fraction on
the clinical endpoints.
The concept of hyperfractionation combined with acceleration emerged in the early 1980`s and followed
advances in the understanding of the radiobiology of cell killing, repair processes and repopulation effects.
Prospective randomised trials were conducted by the EORTC (pure hyperfractionation to the same total dose
and overall time reported by Horiot et al 1992), MRC (hyperfractionated and accelerated to a lower total
dose – CHART, reported by Saunders et al 1996), and the North American RTOG (hyperfractionated and
partially accelerated - e.g. Fu et al 2000) but long term meta-analysis continues to generate statements of
significant improvements in some cancer types e.g. Baujat et al (2010) and Mauguen et al (2012).
Because of persistent economic constraints in the provision of radiotherapy facilities, there remains
considerable interest in the use of relatively hypofractionated radiotherapy, especially for delivery of sub-
radical doses in an adjuvant setting, such as pre-operative rectal cancer or after wide excision of a primary
breast cancer. The UK START breast cancer trial was designed to test daily 2 Gy fractions against larger
fraction sizes over the same overall treatment time and which showed broadly equal effects (Hopwood et al
2010).
The assumption that if the same overall treatment time is in the case of the same radiation modality, then the
only variable is dose per fraction and number of fractions, seems sound. Yet, for two quite different radiation
qualities, this could differ because repair capacity and kinetics will change, along with a greater cell killing
effect which may overwhelm acute tissue tolerance and contribute to consequential late effects.
2.3 The power law equations
The relationships between overall treatment time, number of fractions and iso-effective dose have been fitted
by power law equations in a variety of clinical situations (Thames & Hendry, 1987). Strandqvist in 1944
considered the influence only of overall time on skin reactions and skin cancer control. This pioneering work
ignored the possible effect of variations in dose per fraction and therefore of DNA repair. The separation of
the time and fractionation components and the dominant effect of the fractionation exponent evident in the
power-law fit given in the equation of Frank Ellis (1969) below, which was based on acute skin effect data,
but was inappropriately applied to other tissues:
yx TNNSDD ⋅⋅= [2.3]
Here, D is the total dose, NSD the nominal standard dose, N the number of fractions, T the overall treatment
time, x and y are exponents and were the fitted values were 0.22 (6 fractions per week) or 0.24 (five fractions
per week) for x and 0.11 for y. The equation formed the basis of other empirical methods for adjustment of
the total dose for changes in overall time or fraction number. Liversage (1971), Fowler (1971), Withers and
Peters (1980) argued that there were several deficiencies in this form of model. The logarithmic scaling of
the power law models imply that the initial time factor and repair factors are greatest during the early part of
D.JRA 5.10 Dissemination level PU
ULICE -GA n°228436 Page 8 of 58
treatment and that there will be an indefinite increase in the isoeffective dose with increasing fraction
number, which are both contrary to biological evidence. There is actually an asymptotic relationship with
increasing fraction number (N), where further increments in N do not require such large increases in
isoeffective total doses (Withers 1977, 1983). There was also the impossibility of representing single
fractions at time zero on double logarithmic plots.
Subsequent clinical experience in post-mastectomy patients (Bates and Peters, 1975) and carefully designed
clinical studies (Turesson & Notter 1984 a & b) showed that the equations were appropriate only for early
but not late skin and subcutaneous complications. There are greater deviations from the model in other
tissues, such as is the CNS, for which the fractionation exponent is much larger (x is 0.42 in equation 2.1)
and the time exponent was only 0.02 (Sheline et al, 1980). Safer, organ-specific power law models, which
included larger fraction exponent values, also became available for late reacting tissues, such as lung and
kidney.
The power law models eventually correctly emphasised the importance of fraction size on late tissue
isoeffects. There was also a considerable error in the allocation of a significant time exponent (derived from
acute tissue reactions) if these models were applied to late reacting tissues. Unfortunately, the original idea
of the importance of the time factor for tumour control was largely forgotten for many years, particularly
because of the assumption that the long human pre-treatment tumour volume doubling times would reflect
the repopulation rate during treatment. Subsequent developments of the Ellis relationship, such as the Time
Dose Factors of Orton and Ellis (1973) and the Cumulative Radiation Effect of Kirk et al., (1971) were
essentially algebraic rearrangements of the Ellis formulation and provide similar predictions (Goitein, 1976).
Later developments such as the extremely complex empirically derived models of Orton (1985) and Cohen
(1983) are far less valuable than the later, simpler and less empirical Linear Quadratic (LQ) model. In this
context, an empirical power law model which contains the wrong time factor for late reacting tissues is
actually more dangerous in clinical practice than a biophysical model (such as the LQ) which for late
reacting tissue isoeffect calculations completely omits the time factor. This is because of the lack of
importance of time in most examples of late tissue damage, except for instances where overall time is very
short: short inter-fraction intervals may allow incomplete DNA repair, and excessive dose in a short time
may lead to consequential late reactions.
Similar power law models were derived for continuous radiation applications (Trott, 1987). Here, the
objections of a variable time exponent for cellular repopulation are not relevant and the time exponent itself
represents repair of sublethal DNA damage during radiation exposure. Again, the power law models
erroneously predict that the isoeffective dose will rise continuously at extended treatment durations, which is
contrary to clinical findings. Power law models were also available for high LET (fast neutron) radiotherapy,
as discussed by Bewley, including the concept of a maximum RBE at low dose per fraction and a minimum
RBE at far higher doses, but they were not were not applied in fast neutron therapy since only a constant
RBE was used. This is of interest since the application of even a partially correct model may well have
reduced the toxicity associated with neutron therapy where a fixed rather than a variable RBE (between these
two extreme limits) was used. In retrospect, it is perhaps difficult to understand why the British used a
constant RBE for fast neutron therapy, despite knowing that RBE varied with dose per fraction. One reason
would have been that they were using a hand dose planning technique, rather than computerised dose
planning, in those early days: a fixed RBE would be easier to implement. There was also some degree of
misplace confidence that the low energy neutron beams had rapid dose fall off with tissue depth (rather like
that from a 250 keV x-ray generator), so that increments in RBE with dose fall off mattered less.
2.4 Fractionation in high LET radiation
In comparison with conventional x-ray based fractionation experience, detailed fractionation experiments
using high LET radiation have only a 50 year history (for example, Barendsen and Broerse, 1970, Fowler et
al 1976). They show reduced dependency on fractionation effects compared with low LET radiations.
Changing radiation quality, quantified by increasing linear energy transfer (LET, measured in kev/µm), from
the baseline of photons (or x-rays) in the Compton scattering energy range (defined as low LET, values
usually being 1-3 kev/µm), to positively charged particles (PCP) such as protons and ions in their pristine
Bragg peaks. Increasing LET, up to around 120 kev/µm in most instances, is associated with an increased
relative biological effect (RBE), which is essentially an increased bio-effectiveness. The predominant

D.JRA 5.10 Dissemination level PU
ULICE -GA n°228436 Page 9 of 58
increase in RBE with PCP occurs within the Bragg peak region, where particle velocities (and energies) are
smaller resulting in more intense LET values. It is also the case that higher values of LET are found with x-
rays (or photons) in the lower photoelectric effect energy range (generally speaking x-rays below 70-80 kev,
and also with neutrons. RBE is usually defined as the ratio of dose required for the same bio-effect using a
low LET radiation compared with one at a higher LET. Symbolically this is represented as
H
L
d
dRBE = , [2.4]
where the subscripts L and H refer to low and high LET respectively.
Now, when the fractionation schedule changes, the numerator dL changes with fractionation to a greater
extent than dH. The low LET numerator dose changes because of repair occurring between fractions, but the
denominator (dH) is less susceptible to changes in fractionation. This is because high LET radiations form
more clustered, locally complex damage within DNA, which is more difficult or impossible to repair. So,
there is lesser repair between fractions in the case of high LET radiations compared with low LET radiations.
This must also be understood in terms of the single fraction experiment, where there is no opportunity for
repair between fractions. With increasing LET, the α radiosensitivity parameter increment is proportionately
greater than the accompanying much smaller increase in the β parameter: this means that the ratio of αH/αL
should always exceed βH/βL. Now since αH/αL is RBEmax (the RBE at near zero dose where β related cell kill
is negligible) and √(βH/βL) is RBEmin (the RBE at high dose where β related cell kill predominates). It follows
that a reduction in dose per fraction will increase the RBE towards the RBEmax limit; conversely as dose
increases the RBE will approach the lower RBEmin value. It can also be appreciated that the yield of complex
lethal chromosomal aberrations per unit dose increases with LET, so the same biological end points can be
achieved with lower doses, where α cell killing mechanism predominates, rather than the β related
mechanism. This again means that radiations that have high LET and RBEs will be associated with reduced
fractionation sensitivity, since it is the β related damage that is susceptible to sub-lethal damage repair.
This original description of RBE was convenient to radiobiologists, since RBE could be measured from the
defining ratio given in equation 2.4, but this allowed RBE to be viewed as being over simplistic, indeed
almost of trivial complexity. In fact RBE is a highly complex parameter, depending on multiple variables
including particle mass, energy, charge, target volume (and its depth), dose, beam contamination (e.g. with
neutrons, γ rays etc) and the radiobiological characteristics of the tissue/tumour being targeted (repair
capacity, proliferative status - linked to the low LET α/β).
The importance of fractionation in radiotherapy cannot be doubted because of its clinical impact. Increasing
the number of fractions n, along with a reduction in d, inevitably increases t if, say, only a maximum of 5
fractions a week are to be given: this will allow acute reacting normal tissues (such as epithelial surfaces,
skin, oesophagus, intestine) to tolerate radiation treatment better, since the increase in elapsed time will
allow more cellular repopulation to occur. Exactly the same will occur with PCP, so that for large treatment
volumes containing epithelial surfaces that can repopulate within a month, longer treatment courses tend to
be given in order to spare acute effects. The opposite, over intensification of dose in time, can cause very
severe acute effects that can lead to so-called ‘consequential’ late effects in tissues, as well as being very
unpleasant to the cancer patient.
The situation with late tissue effects is different. In their case, increasing fraction size will have a more
deleterious effect for x-rays (photons) than for PCP: the former will require a larger reduction in total dose to
maintain an isoeffect, whereas the latter will not require as great a change in total dose and so can be given in
fewer fractions.
Late effects and very slow growing tumours generally require no time correction factor, unless treatment is
very protracted or if multiple fractions per day (MFD) are used. For MFD, incomplete repair (IR) equations
are required, especially for three fractions or more per day. IR is likely to be reduced for high LET radiations
compared with low LET radiations, since IR is included within the LQ model by linkage to the β parameter
and not the α parameter which increases to a greater extent than β with LET, as explained previously.
Another issue with IR, is fraction duration (tf): difficult to deliver techniques allow short but significant
interruptions of treatment, (due to gantry rotation, re-imaging etc). This also applies to some modern photon
techniques such as GammaKnife and linear accelerator treatments such as CyberKnife. This is because there
D.JRA 5.10 Dissemination level PU
ULICE -GA n°228436 Page 10 of 58
are principally two repair half times: the best estimates remain those in rat spinal cord, namely the first
component is fast (half time=0.19 hr) and the second slower (half time =2.16 hr) with close to 50% of
damage associated with either form of repair (Pop et al, 2000). It has been shown that many treatments with
prolonged tf values can result in a significant reduction in BED per fraction [J Hopewell, personal
communication 2012]. It can be argued that all fractional durations longer than 30 minutes should be
recorded for later analysis. Ion beam treatments such as the large 44 Gy-eq single fraction given for early
stage lung cancer in Japan can in some instances take over 2 hours to deliver. The intervals of time within a
fraction that allow repair to continue between ‘pulses’ of treatment will affect low LET therapy to a greater
extent than high LET. Also, tumours and tissues with a high α/β are less sensitive to dose rate and
incomplete repair effects than their low α/β counterparts where extension of tf produces a greater reduction in
BED. More detailed work is required on this topic in the context of particle radiotherapy, using prospective
data recorded in the ion beam centres to be eventually correlated with clinical outcomes.
It must always be remembered that a small increment in dose per fraction beyond that prescribed and
deposited in normal tissue can lead to enhanced tissue damage due to the non linear effects associated with
the LQ model. This has been termed double trouble at 2 Gy per fraction and this effect is enhanced when
dose per fraction increases further, when it is called treble (or triple) trouble [Jones et al 2001, Jones,
Khaksar and Dale 2000). It follows that increasing hypofractionation (larger doses per fraction) must be
given with caution with respect to dose homogeneity and individual calculations should be done since RBE
effects will also complicate this effect, as shown later in this report.
Much could be written here on the economic advantages of hypofractionation: fewer treatments of larger
doses per fraction allows greater throughput of patients per year, reduced individual patient costs and
inconvenience, with greater utility within society bearing in mind strong competition for finite health care
resources. Such potential advantages can only be pursued if outcomes, in terms of tumours controlled and
cured along with satisfactory quality of life statistics, either match expectations or can be proven to be
superior to other more expensive approaches. The use of adjuvant therapies, either conventional or
experimental, must also be considered with fractionation trials, since they may overcome certain
disadvantages (e.g. cetuximab on tumour repopulation for longer schedules, new antimetabolites which
reduce oxygen consumption and permit rapid tumour reoxygenation prior to short schedules).
Also, it remains to be shown if protons can be delivered in hypofractionated form as safely as carbon ions. It
is paradoxical that the majority of patients treated with protons had eye melanomas, treated in 4 large
fractions to 52-54 Gy doses, using ‘small fields’. The large and protective volume effect will tend to favour
larger fractions for small target volumes as long as non-essential tissues are included in the tumour-normal
tissue margin. Our inadequate, but improving, knowledge of the mathematical relationship between normal
tissue volume and radio-tolerance may yet provide safer guidelines in the future.
3. The relevant equations and worked examples
3.1 BED equations
Biological Effective Dose (BED) equations expresses the dose in Gy required for a defined biological (or
clinical) endpoint when the dose is given in very small fraction sizes. BED essentially acts as a reference
dose from which it is possible to calculate the dose required to produce a given bio-effect when using
different fractionation schedules. BED is the highest possible dose that can be given to achieve a specified
bio-effect. The basic BED principle can also be extended to provide EQD-2 equations, which express the
dose required for a defined biological or clinical endpoint when the dose is given in 2 Gy fractions.
Further details of BED are given in the previous ULICE report. In summary, BED is derived from
fractionated form of the LQ survival equation, where surviving fraction is expressed as a Poissonian function
where the exponent contains the expected number of lethal lesions per cell:
)( 2ddn
eSFβα +−= [3.1]
Then, by taking the natural logarithm of each side and multiplying by -1, then dividing by α, we obtain

D.JRA 5.10 Dissemination level PU
ULICE -GA n°228436 Page 11 of 58
+=
βα
dndBED 1 . [3.2]
Where BED replaces – ln(SF)/α,
but which can also be expressed in words as:
BED = Total Dose × Relative Effect, [3.3]
or also as in symbols as
+=
βαd
DBED 1 , [3.4]
where D is the total dose and d the dose per fraction. D can be replaced by nd, where n is the number of
fractions.
The function of the α/β ratio is to act as a coefficient which controls the fractionation sensitivity. When
fraction size is changed, the resulting total dose needs to be modified in order to provide a constant BED
(and the same bio-effect). It is important to understand that different tissues and tumours can possess quite
different α/β ratios, so that they respond differently to different changes in dose fractionation.
The BED equation can be modified for particle radiotherapy (Jones et al 2006, Carabe-Fernandez et al 2007),
as
+=
βα
H
H
dRBERBEDBED
2
minmax
[3.5]
It can be seen that the α/β ratio used is the same as that for the low LET (x-ray) case and that this parameter
will now be less important in influencing the BED when dH is changed, compared to the standard low LET
equation, especially when RBEmax is large. The percentage BED increment with dose per fraction is
consequently larger for low LET treatments.
This equation also allows the RBE at any intermediate dose to vary between the RBEmax and RBEmin values
chosen.
3.2 Converting a specific low LET BED fractionation to that for high LET, when the low LET α/β ratio is
known, but with no change in overall treatment time.
It is then possible to pursue isoeffect calculations using the equality:
Low LET BED = High LET BED
+=
+
L
HH
L
LL
dRBERBED
dD
βα
βα
2min
max1 [3.6]
The major advantage here is that the α/β ratio used throughout this equality is that of the low LET α/β, which
are well established for some tissue types e.g. brain and spinal cord, although it is necessary to know the
likely values of RBEmax and RBEmin. In important clinical scenarios these RBE parameters should be
sufficiently large to produce conservative values of dose per fraction for the protection of normal tissues with
low α/β values, yet sufficiently low in the case of fast growing tumours with large α/β ratios.

D.JRA 5.10 Dissemination level PU
ULICE -GA n°228436 Page 12 of 58
Worked example:
It is decided to design a clinical trial which provides the same BED for late brain effects as 60 Gy in 30
fractions of megavoltage x-rays, using either 10 or 15 fractions of carbon ions, which are assumed to have
RBEmax values of 6 and RBEmin of 1.25. Find, also, the dose required if given in 2, 3 or 4 Gy fractions. The
brain α/β is 2 Gy. Compare the results with an assumption that dose is modified by constant RBE factors of
(a) 3 and (b) 4, regardless of the magnitude of dose.
The BED for x-rays is:
60(1+2/2)=120 Gy [2]
And this BED must now equate with the high LET BED such that
120 = n dH (RBEmax+RBEmin2dH/k), where k is from now on the low LET α/β ratio.
So, for n=10, dH=1.65 Gy and n=15, dH=1.16 Gy,
If doses (dH) of 2 Gy, 3Gy or 4 Gy fractions are to be given solution of the above equation provides n=7.9,
4.79 and 3.29. These are not close to integer values. Rounding off to the nearest fraction would be
inappropriate, resulting in under- or over-dosage. Consequently, it is best to use the former approach which
calculates the dose per fraction.
Now if the ‘overall RBE’ is a constant at all doses, it has a purely dose modifying function, so that each d
term in the BED equation is multiplied by RBE, then we must solve for dH in :
120 = n dH (RBE+RBE2dH/k), (or 120 = n dH RBE(1+RBEdH/k),
So that for RBE=3, n=10, dH=1.33 Gy and n=15, dH=1.04 Gy,
And for RBE=4, n=10, dH=1.00 Gy and n=15, dH=0.78 Gy,
These results show the critical dependency of the RBE model (fixed versus flexible) for the assumptions
used.
3.3 Overall Fractionation differences between low and high LET radiations
Solution of the isoeffect equations given above (equation 3.6 is solved for dL and the result divided by dH to
provide the RBE at any value of dH) can be used to show how low LET (figure 1) and high LET (figure 2)
fractionation influences the total dose required to maintain a tissue isoeffect. The change in total dose with
number of fractions (and consequently dose per fraction) is much greater for the low LET megavoltage x-
rays. The dependency on tissue α/β can also be seen, with a pronounced flattening of the relationship after a
few fractions only for the high LET radiation: the change over the first few fractions indicates the shift from
reliance on RBEmin for the first few fractions to a greater dependency on RBEmax after that. There appear to
be little change in total dose after the 4-6 fraction schedules, with only marginal changes after 10-20
fractions. These modelled examples are typical of the pioneering fast neutron experiments (summarised by
Catterall and Bewley 1979, Fowler 1981).
In PCP therapy, it is important to remember that these considerations apply to the high LET part of the beam;
fractionation effects corresponding more closely to the low LET will be found where there are only entry
beams that are distant from the Bragg peak regions. Thus if, say the skin and rib dose (mainly low LET)
determine tolerance for a lung cancer treatment, as is the case in Japan, then fractionation will continue to
have an important function. The incidence of rib fractures with large single doses remains of concern and
this would probably fall with modest further fractionation since the ribs are not in the very high LET region.
3-D LET, dose and BED plans will ideally be required. LET and dose distributions at any voxel are already
available through the ion beam treatment planning system TRiP98 (Kraemer et al. 2000), while the BED can
be obtained from the photon equivalent dose through the equation 3.4.
LET based treatment plans have already been generated by Grassberger et al (2011), although in the head
region and just for protons, and a similar concept has been recently introduced in TRiP98 (Kraemer et al
2012a).

D.JRA 5.10 Dissemination level PU
ULICE -GA n°228436 Page 13 of 58
Figure 1: Total dose and number of fractions (of different fraction sizes) for megavoltage x-rays.
Figure 2: Total dose and number of fractions (of different fraction sizes) for carbon ions or fast neutrons
assuming RBEmax = 6 and RBEmin = 1.25.
3.4 Boost doses.
In radiotherapy practice it is often the case that treatment is given in phases, typically beginning with wider
field arrangements, often to cover regional lymphatic tissues, but ending with a boost dose to a smaller
volume (the tumour itself with appropriate infiltrative margins); with x-ray based IMRT the boost can be
given simultaneously with the wider field. Sometimes different radiation modalities are used for each phase:
for example the larger initial treatment could be given by megavoltage IMRT, followed by the final phase
using protons or ionic beams. As we discussed in the report D.JRA 5.5, this possibility has been already
introduced in TRiP98 (Kraemer et al. 2012b).
D.JRA 5.10 Dissemination level PU
ULICE -GA n°228436 Page 14 of 58
Worked example:
A dose of 45 Gy in 25 fractions delivered by IMRT, is followed by a carbon ion boost, with the aim of
giving a total tumour dose equivalent to 70 Gy in 35 fractions of megavoltage x-rays, but preserving a
normal tissue isoeffect, equivalent to 40 Gy in 20 fractions. Find the dose per fraction required for a 3, 4 or 5
fraction boost for the same tumour control, but also give the normal tissue BED values for each case. The
likely tumour α/β is 4 Gy with RBEmax = 4 and RBEmin=1.4; the critical late normal tissue has α/β of 3 Gy
and RBEmax=4.7 and RBEmin=1.3 and the most relevant normal tissue volume receives a modal 72% of the
IMRT dose and only 42% of the ion beam dose.
The intended total tumour BED is 70 (1+2/4) =105 Gy [4]
The IMRT will provide a tumour BED of 45 (1+1.8/4) =65.25 Gy [4]
The deficit tumour BED to be provided is 105-65.25=39.75 Gy [4]
The allowed total NT BED will be 40 (1+2/3)=66.67 Gy [3]
The IMRT will provide a NT BED of 0.72 45 (1+0.72 1.8/3) =46.40 Gy [3]
For tumour boost dose per fraction find dH for n=3, 4 and 5 in:
39.75 = n dH (RBEmax+RBEmin2dH/4),
For n=3, then dH=2.53 Gy; for n=4, then dH=2.00 Gy and if n=5, then dH=1.65 Gy
The NT BEDs will be, for each dose per fraction:
0.72 45 (1+0.72 1.8/3) +3×2.53×0.42(4.7+1.32×2.53×0.42/3) = 62.87 Gy [3]
0.72 45 (1+0.72 1.8/3) +4×2.00×0.42 (4.7+1.32×2.00×0.42/3) = 63.34 Gy [3]
0.72 45 (1+0.72 1.8/3) +5×1.65×0.42 (4.7+1.32×1.65×0.42/3) = 63.74 Gy [3]
All of these BED values are below the allowed 66.67 Gy [3], but it is instructive to note that the lowest NT
BED is found for the least number of fractions (and the highest dose per fraction), because of the effective
fall of RBE with hypofractionation in this case when using the extreme limits of RBE as parameters.
In other clinical situations, if NT tolerance is exceeded, a BED calculation cannot provide the desired result
for both normal tissue and tumour, because their BEDs are separately governed by different α/β and RBE
parameters. A compromise in dose selection is necessary and this will require detailed clinical discussion,
perhaps accepting increased risks of either recurrence or toxicity, or even a modest amount of each. Typical
examples were given in the previous report on unintended treatment interruptions.
3.5 Converting a specific low LET BED fractionation to that for high LET, when the low LET α/β ratio is
known, but with a change in overall treatment time.
The equations have been used previously to estimate compensatory doses for unintended treatment
interruptions.
H
L
HHL
L
LL KT
dRBERBEDKT
dDBED −
+=−
+=
βα
βα
2min
max1 , [3.7]
and where K is the low LET BED dose equivalent of repopulation per day, K being defined as:
ωα L
K693.0
= , [3.8]
where ω is the operative cellular doubling time. K values are known for some tumour types and are
sometimes used along with a lag (or delay) time until the onset of accelerated repopulation. In such cases
(usually assumed for squamous cell and transitional cell cancers) the T values are reduced by the delay time
TK, which is usually assumed to be 21-28 days. It is advantageous that the low LET K values can be used in

D.JRA 5.10 Dissemination level PU
ULICE -GA n°228436 Page 15 of 58
this form, even within the high LET side of the equation, but provided the RBE factors are included within
the BED portion of the equation.
3.6 Alternative approach for isoeffect calculations in the case of two high LET schedules.
For two identical high LET treatments, fractionation iso-effects can be calculated using BED equations that
contain high LET α/β ratios.
Thus for two isoeffective schedules of high LET we have for N1 factions and N2 fractions of dose d1 and d2
N1H(αHd1H+βHd12
H)= N2H(αHd2H+βHd22
H) [3.9]
It is them permissible to divide throughout by αH (and not αL, as was previously the case) and obtain
+=
+
H
HH
H
HH
dD
dD
βα
βα
22
11 11 [3.10]
In this case, the two RBE parameters RBEmax and RBEmin are no longer necessary. It would also be possible to
use the single RC conversion factor, where
RC=RBEmax/RBEmin2
[3.11]
This is because
min2
max
RBE
RBE
LL
H
L
H
L
H =
=
ββ
αα
βα
βα
[3.12]
in the situation of comparing two identical high LET radiations, so that equation 15 would become
+=
+
L
c
HH
L
c
HH
R
dD
R
dD
βα
βα
22
11 11 [3.13]
which could also be used in this form along with the time factor corrections, as given below.
For unintended treatment interruptions, the most appropriate time and repopulation correction factors can be
added for the case of tumour isoeffects. This is not necessary for late reacting tissues. The equations are then:
HH
H
HHHH
H
HH tK
dDtK
dD 2
221
11 11 −
+=−
+
βα
βα
[3.14]
where t1 and t2 are the respective overall treatment times for schedule 1 and 2 and KH is defined as
ωα H
HK693.0
= [3.15]
Compared with the K values for low LET (KL), there is little knowledge of KH values in the literature. KH can
however be found from KL by dividing by RBEmax (which is αH/αL), that is
maxRBE
KK L
H = [3.16]

D.JRA 5.10 Dissemination level PU
ULICE -GA n°228436 Page 16 of 58
Some authorities have encouraged total dose RBEs to be used, although with extreme caution (Dasu and
Toma-Dasu, 2008), but this approach can lead to confusion and potential errors. It is best to use RBE on a
dose per fraction basis, which is consistent with cell survival curve theory and the original definition of RBE
by LH Gray. It is recommended that individual dose per fraction RBE`s be calculated and then total dose
calculated. Where fraction numbers differ between low and high LET schedules this is especially important.
For example, let us suppose that a 10 Gy carbon ion physical dose in 5 fractions produces the same late
effect as a 50 Gy in 25 fractions photon dose – what is the RBE?
By taking each of the:
• total doses, the RBE is 50/10=5.
• delivered doses per fraction, the RBE is 2/2, which is absurd.
However, by using the following procedure - based on corrected dose per fraction - a different answer is
obtained:
The RBE denominator will be the high LET dose per fraction, which is 2 Gy. The photon dose per fraction,
if given in 5 fractions (rather then 25), which would match the same effect as 50 Gy in 25 fractions of
photons, assuming a late effect α/β=3 Gy, would be given by d in the following BED isoeffective doses:
BED (5 fractions, unknown d) = BED (25 fractions, d=2)
5 d(1+ d/3)=50(1+2/3)
d=5.73 Gy, which is then used as the numerator of the RBE.
The RBE is then 5.73/2=2.87.
In situations where under- or over-dose has occurred or in calculation of x-ray equivalent schedules the most
reasonable estimates of the parameters should be used; clinicians may prefer to use the safest choices, such
as a high RBEmax in tissues which are highly fraction sensitive for x-rays, such as the central nervous system.
The general advice for such calculations in the case of x-rays has been published elsewhere (e.g. Joiner 2004,
Jones and Dale, 2008), but the additional effect of RBE must be included if there is any attempt to use (low
LET) x-ray tissue tolerances or x-ray tumour control data. The alternative approach is to use only high LET
α/β ratios within BED equations where the tolerance and tumour control BED values for the high LET
radiation are known. These are subtle but important differences that will be considered in further detail
within the ENVISION project.
4. RBE and dose per fraction
Early RBE experiments, especially studies using fast neutrons, with RBE values similar to carbon ion
therapy, showed that RBE reduced with increasing dose per fraction, leading to potential clinical dangers for
small fractions, or higher than expected bio-effects despite high LET dose fall off in normal tissues. Fall off
of megavoltage x-ray dose causes a reduction in tissue dose per fraction; but fall off of high LET dose
beyond a target volume may be, at least partially, compensated for by a higher RBE.
It is instructive to study figure 3, which shows the relationship between dose per fraction of neutrons and
RBE for tissues with different α/β ratios: the overall change in RBE with dose per fraction is much less for
biosystems with a high α/β than for those with a low α/β.
This was compiled using parameters derived from a variety of fast neutron experiments in vivo and on
human cancer cells in vitro (Jones et al 2011a). Due to RBEmax being inversely related to the low LET α/β,
and RBEmin being linearly related to the square root of α/β, there is a crossing over of the RBE values such
that biosystems with a low α/β have the highest RBEs at low doses, but the lowest RBE at high doses. If a
cell or tissue system does not have a clearly identified α/β ratio then the choice of dose per fraction around
the cross over part of the curves would minimise RBE uncertainty.

D.JRA 5.10 Dissemination level PU
ULICE -GA n°228436 Page 17 of 58
Figure 3. Plot of RBE against dose per fraction of high LET radiation (based on fast neutron data sets) as in
reference [Jones et al 2011]
There are important implications for clinical fractionation here, although these predictions must be better
validated by further experimental studies. It is interesting to note that lowering the dose per fraction probably
caused more toxicity in late reacting tissues in UK neutron trials. Also, there are suggestions from the
Japanese ion beam centres that late side effects may be less prevalent with hypofractionated schedules. Such
claims must however be subjected to prospective studies, since at present the hypofractionated regimens
have the shortest follow up times and so may show bias. However, these findings are compatible with a
hypothesis that the rank order of RBE values can be reversed according to the dose level, as in figure 3. In
the case of the brain, with the lowest α/β of 2 Gy, this may be important, since the therapeutic ratio might be
improved by hypofractionation as long as the brain RBE at large doses would be sufficiently lower than the
tumour RBE. This may already explain some excellent outcomes at Heidelberg and GSI for skull base
tumours compared with low dose per fraction protons in USA, although the shorter treatment time (<20
days) may also be operative in at least some tumours which may contain more rapidly growing clonogenic
cells as may be found after repeated surgery and long intervals of time between the original diagnosis and
definitive therapy. In contrast the Swiss PSI centre, has used protons with low dose per fraction and claimed
favourable results also, but in their case the use of beam scanning techniques permits a more favourable
physical dose distribution. All these results should eventually be subjected to rigorous comparative analysis
using the BED with flexible RBE concept.
Major decisions are required in Europe before carbon ion dose per fraction is changed from a relatively fixed
dose equivalent of around 3 Gy of photons.
The use of hypofractionation is increasing with newer photon treatments such as Gammaknife and
Cyberknife and other robotic guided linear accelerator techniques. The possibility that normal tissue late
toxicities would be reduced by using hypofractionated PCP therapy compared to these other photon based
techniques, would be a reasonable starting point for clinical trials at some future time, but they would need to
be guided by better and more specific data on RBE, leading to improved BED estimates.
Proton radiotherapy also needs some discussion here: the persistent use of a fixed proton RBE of 1.1, based
on in vivo and in vitro experiments using rapid assays (Paganetti et al 2002, 2003), with a tendency to high
α/β values, has a high chance of underestimating RBE values in late reacting tissues and in slowly growing
tumours, as well as overestimating RBE in some very rapidly dividing systems such as cancers of childhood:
the latter could lead to under-dosage in long fractionated schedules (Jones et al 2012). Scaling of the fast
neutron RBE data down to protons can only be a rough estimate of how RBE might change with α/β, but this
is shown in figure 4. The reader is left to contemplate the potential differences compared to an RBE of 1.1,
which remains the international world standard (Wambersie et al 2007), especially for α/β of 2 Gy (brain and
CNS) and other late effects with α/β=3Gy.

D.JRA 5.10 Dissemination level PU
ULICE -GA n°228436 Page 18 of 58
Figure 4: extrapolation of data used to generate figure 3, to fit proton data where high α/β ratio bio-systems
provide a median RBE of around of 1.1
5. Effects of regions of higher and lower dose per fraction relative to the prescribed dose
for different fractionation patterns.
The medical prescription refers to a volume of interest, normally the Planning target volume (PTV) where
the prescribed dose often refers (e.g. in photon therapy) to the dose at the field intersection or other
representative point such that the PTV is allowed to have a variation of dose by as much as -5% to +7%.
Normally these percentages (expressed as 95% to 107% of the prescribed dose) do not deviate by these
amounts, but with large field sizes and with difficult individual treatment geometry these figures are
approached and rarely exceeded.
Homogenisation of dose has become increasingly possible due to intensity modulation in photon therapy and
with similar approaches in PCP therapy due to beam scanning and weighting approaches. A deviation in dose
will produce a changed biological effect, such that the surviving fraction will be multiplied each fraction; in
the case of BED, which is derived as a logarithm, allows the BEDs to be added for each fraction. For larger
doses per fraction the biological deviation will be more significant, although fewer fractions are then given;
for smaller doses per fraction the biological deviation will be smaller but will occur over a larger number of
fractions.
Essentially, if x represents the change in dose, then the low and high LET BED will be respectively
+=
L
LL
xdxDBED
βα
1 [5.1]
+=
L
HH
xdRBERBExDBED
βα
2min
max [5.2]
Where, for example, x = 0.96 for 96% of the prescribed dose (of 100%), and 1.05 for 105% of prescribed
dose etc.
It is instructive to compare BED values for various values of x in low and high LET radiations, for two
tumours or tissues with α/β=4 Gy and α/β=8 Gy in Figure 4 (a and b). A non linear effect is apparent,

D.JRA 5.10 Dissemination level PU
ULICE -GA n°228436 Page 19 of 58
probably caused by the complexity of PCP radiobiology, where the RBE is inversely related to dose, with
RBE ‘crossing-over’ effects (as in figure 3).
These high LET dose changes tend to oppose under-dose (since the BED ratios exceed unity at doses below
the prescribed dose) and also protect against overdose (where the ratios are lower than unity), although only
partial protection is given.
So, high LET can be considered to be more ‘forgiving’ in these respects. However, when figures 5 (a and b)
are looked at closely, it can be seen that the α/β values change the order of these BED ratio plots for different
fraction numbers, indicating the need for individual calculations of the BEDs in all cases.
Figure 5 (a and b). Ratios of high LET BED to low LET BED are plotted against percentage dose deviation
(the factor x expressed as a percentage), for a prescribed dose of 100%, and for different fraction numbers
that provide isoeffective tumour control at the prescribed dose level for each fractionation schedule. The
colour codes are red=1#, black=4#, blue=10#, grey=20# and green=37#. In figure (a) the tumour α/β is 4
Gy and in figure (b) it is 8 Gy.
(5a)
(5b)
It is important to note that the dose gradient across the tumour target volume may be different between an x-
ray (photon) plan and a PCP plan, where greater uniformity can be achieved, although this is based on
assumptions linking LET and RBE as in the work of Kanai et al in Japan where, from the example of a
single field, the distal dose is down-weighted because of the increased LET due to a greater number of Bragg

D.JRA 5.10 Dissemination level PU
ULICE -GA n°228436 Page 20 of 58
peaks whereas the proximal part of the target contains more plateau dose regions with lower LET. Ideally,
comparison of an averaged BED across the target volume should be used to compare high and low LET
target volumes. Failure to do so may allow an advantage for either modality. For example, schematic proton
(red line) and x-ray (green curve) dose distributions across a target volume are shown in figure 6. There is a
dilemma as to what proton dose should be given to provide the same tumour control: should the proton dose
be matched to the calculated average x-ray dose across the volume (as attempted here), rather than be close
to the minimum or maximum x-ray dose. Techniques such the uniform equivalent dose of Niemierko (1997)
may be of use in this dilemma.
Figure 6: Percentage dose across a planning target volume (PTV) of width 5 cm for protons (red) and x-rays
(green).
6. Interpretation of RBE and fractionation effects within the ICRU framework of target
volume definitions.
Among the most recent ICRU recommendations of radiation target volumes [8] for the treatment of a
primary tumour using proton therapy (and MVRT), for which:
Gross Tumour Volume (GTV, where tumour is present),
Clinical Target Volume (CTV, where infiltrating tumour probably occurs), and
Planning Target Volume (PTV, denoting a wider limit of the prescribed anti-tumour dose, consisting of two
components: the internal margin (IM) required for physiological changes such as breathing and changes in
GTV, CTV with time; and also SM, the margin required for patient positioning and beam alignment
uncertainties.
A further volume (the OTV) – is in the present article defined as being the remainder of the patient outside
the PTV.
These volumes are shown together in figure 7, with two examples of critical normal tissues that exist either
partially in PTV or entirely in OTV: these two differences represent the difficult and the ‘ideal’ treatment
scenarios respectively.

D.JRA 5.10 Dissemination level PU
ULICE -GA n°228436 Page 21 of 58
Figure 7: Purely schematic diagram of zonal definitions relative to a body outline, where zone 1 is same as
GTV, zone 2 is same as PTV, with two examples of organs at risk, OAR 1 which which falls partly within
zone 2, and OAR 2 which is entirely in zone 3, which is also shown.
Table 1: Dose status for each zone and likely clinical outcome changes produced by Particle therapy
compared with X-ray based therapy , where ↑ is an increased dose, = is the ‘equivalent’ dose and ↓ is a
reduced dose for the CPT.
Dose Status
Tumour Control
in GTV and
{CTV+PTV}
{CTV+PTV}
side effects
OTV
side effects
GTV↑,{CTV+PTV}↑,
OTV↓
much better*** worse* betterΨ
GTV↑,{CTV+PTV}=,
OTV↓
better*** equal** betterΨ
GTV=,{CTV+PTV}=,
OTV↓
equal** equal ** betterΨ
GTV=,{CTV+PTV}↓,
OTV↓
worse betterΨ
betterΨ
*In some instances reduced doses outside {CTV+PTV} may allow better radio-tolerance due to less vascular
insufficiency caused by dose in OTV. Also, this condition may be acceptable in a non-essential tissue or for
a small volume of essential tissue with little functional change.
**An equal status exists only if dose distributions and RBE are correct.
***Also, in some instances (the radiosensitive tumour classes), tumour control will be very high with x-rays
and there will may be no gain from dose escalation using any form of radiotherapy.
Ψ In these cases, a higher than expected RBE in the normal tissues could outweigh the dose advantage and
cause equal or worse side effects as for photons/x-rays.
From the table 1, which includes logical conditional statements (essentially a ‘gedankenexperiment’ that is
commonly used in theoretical physics but not in medicine), the potential usefulness and limitations of
particle therapy can be seen in a useful way for practical guidance and for critical analysis of clinical data
sets when these are available. The critical dependency on accurate knowledge of RBE is seen. It is self-
evident that particle therapy is most useful in reducing dose to OAR in the OTV (as in column 4 in table 1).
D.JRA 5.10 Dissemination level PU
ULICE -GA n°228436 Page 22 of 58
That situation seems relatively simple. Even so, there may be such uncertainty in the RBE used,
underestimating the true RBE, that there could be a reversal of the presumed physical dose advantage.
Taking RBE uncertainty into account
Where there is uncertainty as to the RBE of tumour or normal tissue, it can be shown that additional ‘safety’
can be introduced by imposing a tougher demand on treatment planning, essentially by increasing the normal
tissue constraints. The combined effect of physical dose sparing and RBE can be incorporated in a single
equation as an index, SI (Jones et al 2011, b).
)1(
)1(
z
d
tum
norm
L
HI
Error
Error
RBE
RBE
P
PS
±
±××= [6.1]
Where PH is the physical dose sparing ratio (between normal tissue and tumour, i.e. normal tissue
dose/tumour dose) with high LET, PL the dose sparing ratio achieved with low LET x-ray based techniques,
with RBE of the normal and tumour tissue and the error in RBE to normal tissue (Errord) receiving dose d
and the Error in RBE in tumour which receives dose z (Errorz).
Worked Example of allowing for RBE uncertainty
Applying 25% errors to the above equation, then
67.1)25.01(
)25.01(×=
−+
=tum
norm
L
H
tum
norm
L
HI
RBE
RBE
P
P
RBE
RBE
P
PS
Accordingly, it is necessary to improve PH by 1/1.67=0.6 approximately, in order to maintain the same value
of
SI. If, for example, PH was 0.7, it must then be 0.7×0.6=0.42, which would be a further challenge to the
treatment planning physicist!
The situation is more difficult than the above for important normal tissues (or organ at risk, OAR) that
extend into the PTV (in this case PH=PI in equation 6.1). For example, consider the optic chiasm (which
carires all visual information between the eye and the brain), within the PTV of an adjacent tumour of the
skull base, pituitary or supra-sellar region. The dose received by the OAR is then assumed to be the same as
the tumour. If the OAR has a higher RBE than the tumour, then the OAR will be susceptible to radiation
injury, depending on its tolerance level. The only way of reversing this adverse RBE condition would be to
lower BED by changing dose-fractionation. In x-ray (photon) therapy it would be considered standard
practice in conventional low LET radiotherapy to use greater fractionation (hyperfractionation). However,
high LET treatment hyperfractionation will be associated with a higher RBE; the alternative course of action
would be to consider the opposite – hypofractionation, since the RBE may fall. Indeed, the RBEs between
the two systems (tumour and OAR may reverse as show previously in figure 3.
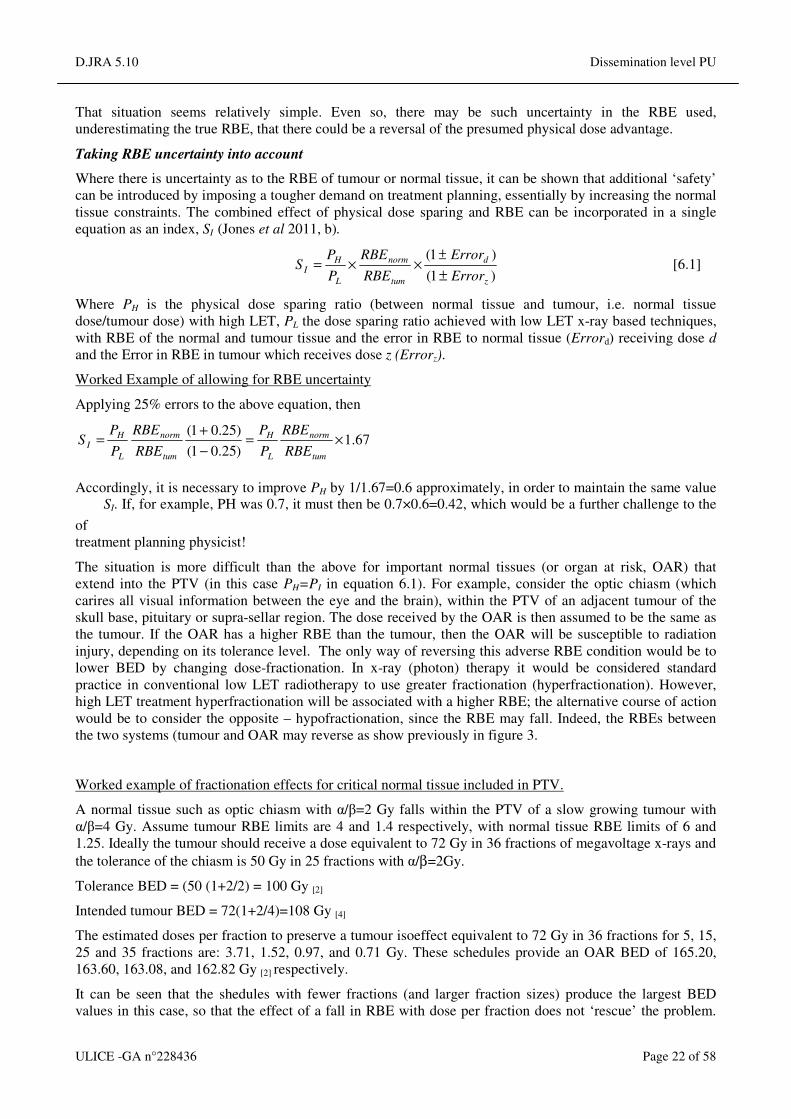
Worked example of fractionation effects for critical normal tissue included in PTV.
A normal tissue such as optic chiasm with α/β=2 Gy falls within the PTV of a slow growing tumour with
α/β=4 Gy. Assume tumour RBE limits are 4 and 1.4 respectively, with normal tissue RBE limits of 6 and
1.25. Ideally the tumour should receive a dose equivalent to 72 Gy in 36 fractions of megavoltage x-rays and
the tolerance of the chiasm is 50 Gy in 25 fractions with α/β=2Gy.
Tolerance BED = (50 (1+2/2) = 100 Gy [2]
Intended tumour BED = 72(1+2/4)=108 Gy [4]
The estimated doses per fraction to preserve a tumour isoeffect equivalent to 72 Gy in 36 fractions for 5, 15,
25 and 35 fractions are: 3.71, 1.52, 0.97, and 0.71 Gy. These schedules provide an OAR BED of 165.20,
163.60, 163.08, and 162.82 Gy [2] respectively.
It can be seen that the shedules with fewer fractions (and larger fraction sizes) produce the largest BED
values in this case, so that the effect of a fall in RBE with dose per fraction does not ‘rescue’ the problem.

D.JRA 5.10 Dissemination level PU
ULICE -GA n°228436 Page 23 of 58
Also, all BED values exceed tolerance. Also, if a lower dose then has to be given (at least to a part of the
tumour adjacent to the OAR), it is necessary to check tumour BED values.
Then, for 1, 2, 3, 4, 5 and 6 fractions (considering the case of extreme hypofractionation) we have – to
maintain an isoeffect for the normal tissue tolerance level, dH doses of 8.11, 5.03, 3.74, 3.00, 2.51, and 2.17
Gy respectively. These schedules give tumour BED values of 64.64, 65.10. 65.37, 65.56, 65.69, 65.80 Gy [4]
respectively. These are considerably less than the intended value of 102 Gy [4]. It can be seen that, in this
example, increasing the number of fractions improves the tumour BED. This is because the tumour α/β is
larger than the OAR α/β.
If it is decided to undertreat part of the tumour PTV but accept an higher dose to the chiasm equivalent to 56
Gy in 28 fractions, then we obtain
In 5, 10, 15, 20, 25, 30 and 35 fractions, to preserve this OAR isoeffect the tumour control BED will be
73.50, 73.92, 74.12, 74.23, 74.30, 74.36 and 74.40 Gy [4]. Again it can be seen that increasing fractionation is
slightly better for tumour control, but it is interesting to note that the equivalent dose for conventional x-ray
tumour control to 74 Gy [4] is 49.33 Gy in 2 Gy fractions.
Altenratively if the number of fractions is further increased to 40, and we accept a reduced tumour BED of
say 85 Gy [4], this can be achieved by a dose per fraction of 0.5 Gy, but this gives 127.8 Gy [2] as a late effect
BED. Another attempt might be to use 40 fractions to give the expected totlerance level of 100 Gy [2], which
requires a dose per fraction of around 0.4 Gy, but then the tumour BED falls to be equivalent to 44.75 Gy in
2 Gy fractions.
So, the therapeutic window is not good and it would be reasonable not to proceed with particle therapy in
this instance. In practice, a ‘small amount’ of tumour is sometimes given a reduced BED, sufficient to
respect the tolerance of the chiasm.
7. The use of the LQ model with large fraction sizes.
It is known that deviations from the LQ model occur in some cellular systems at doses above 6-8 Gy. Some
modellers apply linear models above a certain threshold dose and extrapolate the effect to higher doses.
There is no entirely satisfactory method to overcome this. However, it is important to realise that the
increasing cell survival slope with dose provided by the LQ model can be considered to be an advantage
when assessing normal tissue effects since the LQ inevitably provides the ‘worse case scenario’ and is
consequently protective on normal tissues. Deviations from the model matter less for tumour with high α/β
and for very high LET radiations since the cell survival curves have reduced curvature compared with low
LET radiations.
8. Optimisation of fractionation using calculus methods
It is, in principle, possible to study tumour cell kill for an equivalent normal tissue toxicity grading or
intensity level. A variety of mathematical techniques could be used such as numerical analysis or, most
conveniently, graphical methods. However, relatively simple differential calculus can be used provided the
discontinuous fraction number parameter n is replaced by a function of overall time (t) and the mean inter-
fraction interval (f). The approximation
t=f(n-1) [8.1]
can be used to replace t and then n can be replaced by the normal tissue BED(NT) where
+=
k
dRBERBEndBED H
H
2min
max [8.2]
Where, for convenience, k is now the late reacting NT α/β ratio, so that

D.JRA 5.10 Dissemination level PU
ULICE -GA n°228436 Page 24 of 58
+
=
βα
H
H
dRBERBEd
BEDn
2
min
max
[8.3]
The dose per fraction dH will be used as d from now.
With a repopulation correction factor included we know that
KtdRBE
RBEndBED
tum
−
+=
βα
2min
max [8.4]
Then using the replacement given in equation 8.1, we obtain
)1(2min
max −−
+= nKf
dRBERBEndBED
tumβα
[8.5]
And then replacing n by equation 8.3, and defining z as the tumour dose and d the normal tissue dose (where
d=gz) which leads to:
−
+
−
+⋅
⋅
+
=
1)(
)(
)(
)()(
)(
2min
max
2min
max
2min
max
k
dNTRBENTRBEd
NTBEDKf
dRBERBEz
k
dNTRBENTRBEd
NTBEDBED
tumβα
[8.6]
Of course, if the normal tissues receive very low LET radiation, when the RBE factors will be close to unity,
we can simplify as
−
+−
+⋅
+= 1
1
)(
1
)(2min
max
k
dd
NTBEDKf
dRBERBEz
k
dd
NTBEDBED
tumβα
[8.7]
The normal tissue dose per fraction symbol, d, can in all cases be replaced by gz. Then, a maximum tumour
BED (which is proportional to tumour cell kill) while preserving the same normal tissue response occurs
only when
0)(
=dz
BEDd [8.8]
This last equation can be solved easily using mathematical software and is, very interestingly, independent of
the actual normal tissue BED constraint, but does include the normal tissue α/β (given the symbol k). Plots of
BED in this form show that optimum turnover points are found especially when the normal tissues sparing
increases (low g values) as shown in figure 8.

D.JRA 5.10 Dissemination level PU
ULICE -GA n°228436 Page 25 of 58
Figure 8: Plot of tumour BED for an equal late normal tissue isoeffect against tumour dose per fraction
using the equations given above and parameters as in previous worked examples.
In these plots it has been assumed that – from empirical data – the α/β ratio of the tumour is approximately
50 divided by the tumour cell doubling time and that the low LET α parameter is approximated by
0.03×α/β[tumour]. This gives a reasonably realistic relationship between cell proliferation, fraction sensitivity
and cell doubling rates for tentative modelling purposes. In other words, a larger tumour α/β is consistent
with faster repopulation and greater radiosensitivity and vice versa. The other assumptions made were
tumour RBEmax=2+20/ktum, tumour RBEmin=0.9+0.2 √ktum, five fractions a week can only be given, the
normal tissue RBEmax is 7 with RBEmin=1.2. It can be seen that there are subtle turnover points between 0 and
5 Gy.
Plots of the estimated optimum z are shown in figure 9, where it can be seen that the required dose per
fraction increases with tumour α/β (as represented by ktum), due to increased tumour cell proliferation rates,
and also increases with improvement of treatment geometry (a lower g value) and vice versa.
For this set of parameters and the other assumptions made, hypofractionation (to very high doses) is
predicted to be a better option for conditions of good normal tissue sparing and for more rapidly growing
tumours. Such calculations can only be a rough guide and it would be essential to take further measures to
ensure excellent results: the aim should always be give the lowest possible normal tissue dose consistent with
the highest tumour BED. So, individual calculations will always be required. However, useful trends emerge
such as the requirement of a higher dose per fraction for more rapidly growing tumours (with higher α/β
ratios); the alternative would be to provide twice daily fractions using a lower dose per fraction (f is then
shorter, around 0.78 days for say 10 fractions per week).

D.JRA 5.10 Dissemination level PU
ULICE -GA n°228436 Page 26 of 58
Figure 9. Plots of optimum tumour dose per fraction for maximum cell kill, against tumour low LET α/β
ratio, for variations in normal tissue sparing (g) for a constant BED of 100 Gy [2] in the normal tissue of
interest, assuming five fractions per week are given.
These interesting findings, however, need verification and testing by in vivo animal experiments, using
implanted human tumours, are necessary to search for such effects, as well as careful phase I and II dose
fractionation studies. Extrapolation of the interesting dose fractionation results from Japan to Europe in
carbon ion therapy is not easy, owing to the different assumptions made in the dose calculations.
International uniformity must be encouraged.
A particular problem associated with the calculus method is that parameters used must represent the average
values during treatment and cannot easily be changed during treatment. This creates a difficulty with
accelerated repopulation, although this is only relevant perhaps to squamous cell cancers (SCC) treated over
durations longer than 28 days. Slower growing tumours have less significant repopulation factors and, in any
case, ion beam therapy is normally completed well within this time frame. The present author considers it a
mistake to assume that there is no repopulation up to 28 days even in SCC, for there is always cellular
turnover even if this is at a lower rate.
9. Model variants
Clinicians especially should be aware of two classes of models that can assist with RBE determination, and
therefore fractionation issues:
A. Bottom up models: microdosimetry studies, such as the local effect model, based on LET values, together
with assumed or measured ( the so called low level) sub-cellular and cellular parameters allow prediction of
RBE, although remain to be perfected, but will be essential in the future to guide choice of dose, and to
deliver the correct dose and so aid treatment planning by application on a voxel to voxel basis etc.
B. Top Down models: these include high level parameters (at the clinical level) such as the BED and α/β
related work discussed above. They link our present knowledge of clinical radiobiology with fractionation
phenomena and can be applied usually in worse case scenarios where it is usually assumed that LET remains
high. These are an effective check for the clinician, who should be able to perform such calculations and
understand their implications and limitations.
Obtaining a model that contains the entire scale of the problem must remain a future goal. This type of
challenge exists in many parts of science, including physics where the separate quantum and gravitational
models have yet to be unified in a single framework, despite each model being highly accurate in their own
domains. However, there are some realistic assessments of the use of α/β to obtain RBE alongside other

D.JRA 5.10 Dissemination level PU
ULICE -GA n°228436 Page 27 of 58
microdosimetry related models as in Japan and Germany (Scholz et al 2006, Kasai et al 2011), for example
to predict brain RBE using α/β=2 Gy.
10. Other fractionation contributions
No account of fractionation would be complete without mention of these other important mechanisms that
influence fractionation effects. Fractionation is often taught as being dependent on several factors beginning
with R, including Radiosensitivity, Repopulation, Reoxygenation, Repair, Reassortment (of the cell cycle).
The α/β ratios used, if derived from clinical data, probably inherently include all these processes. We have
already discussed repair and that α/β is the ratio of radiosensitivities, along with the different susceptibility of
α and β to changes in LET.
Reoxygenation rates are thought to be rapid in most tumours, with perhaps sarcomas, high grade gliomas
being exceptions. Much will depend on tumour and vascular supply responsiveness, but there is insufficient
knowledge of the rate of reoxygenation in individual tumours at the present time. This key rate can in theory
influence the potential outcomes of therapy even in the case of PCP (Dale and Jones, 2007 [see book
reference]). A single fraction offers no time for reoxygenation and even two fractions (given daily) will
suffer from the fact that the second fraction will contain a greater fraction of hypoxic cells. The minimum
time for significant although incomplete reoxygenation might be a week, consistent with 4 fractions given
over 4-5 days. A greater number of fractions also might carry an advantage in the case of hypoxia caused by
cyclical opening and closing of blood vessels in a tumour, since the volume of tumour treated during a
hypoxic phase is expected to be less.
Reassortment of the cell cycle was thought to be important, since high LET radiations exhibit less variation
in radiosensitivity in the different phases of the cell cycle and so increasing fractionation would not be so
important. This was established for neutron therapy but it is an effect which is mostly seen at low dose;
higher doses ehich produce much lower surviving fractions appear to show less change with cell cycle
position (see Catterall and Bewley 1979), presumably since the cell kill then follows the type B (β-related)
cell kill process, which has a lower RBE (the RBEmin). Such an effect will apply to both normal tissues and
tumours.
The results obtained by Fowler and colleagues, in terms of an improvement in tumour control for x-rays by
extending the number of fractions beyond a single fraction were consistent with cell cycle reassortment and
reoxygenation, in a tumour where reoxygenation was known to be almost complete in three days after a large
single dose. The use of fast neutrons gave just as high a tumour control as the optimum dose per fraction and
treatment time even if given in a single fraction because of their reduced dependency on hypoxia and perhaps
to a lesser extent on cell cycle position.
Repopulation factors can be used for unintended treatment gap corrections, as discussed previously and
included in overall BED calculations for longer treatment schedules. However, since most ion beam
treatments do not at present extend beyond a month, this is considered unnecessary in most tumour types.
However, the use of ion beams as a boost after IMRT will usually cause treatment time to be more
prolonged.
What if radiobiological parameters change during irradiation? We assume that the parameters used in
fractionation calculation are the average values during radiotherapy. Where abrupt changes occur it may be
necessary to use different forms of mathematics such as summations or series expansions -see appendix A.
The effect of irradiated normal tissue volumes has only been considered briefly above: the precise location of
the radiation relative to the 3-D vascular supply of organs may yield further useful data that will permit more
selective particle radiotherapy with reduction in normal tissue complications.
Another ‘contribution’ to the effective BED values would be those of chemotherapy, age, surgery etc, which
can provide a further increment in cell kill or susceptibility to radiation effects. In principle, these can be
represented by a variable BED increment as shown elsewhere (Jones, Dale and Gaya, 2006).
One further issue is malignant induction. It has been argued that the most protective effect of PCP therapy is
a reduction in normal tissue cell numbers exposed to radiation, especially since RBE effects can increase the

D.JRA 5.10 Dissemination level PU
ULICE -GA n°228436 Page 28 of 58
risk of malignant induction in individual cells. This effectively means that particle radiotherapy should only
use the lowest number of treatment fields which meets with the treatment aims and tissue constraints. In
principle, fractionation may alter the yield of malignant cells in some hypofractionated cases if the ‘turnover
points’ of malignant induction rates are exceeded and cell killing rather than malignant induction then
dominates. Much further work is required in this area, although the changes are likely to be small and must
be assessed together with any detriments in tumour control or normal tissue side effects that could occur.
(Jones 2009, Timlin et al 2011)
PART B - Representative treatment plans for different fractionation schemes
We report here several exemplary particle radiotherapy treatment plans performed for different fractionation
schemes and sensitivity (α/β) scenarios between target and normal tissue.
The plans were optimized with the treatment planning system (TPS) for particles TRiP98 (Kraemer et al.
2000, Kraemer et al. 2012), developed at GSI, using carbon beams, mostly with two opposed fields, for
several patient examples.
TRiP98 biological optimization is using the local effect model (LEM) (Scholz et al. 1994, Elsaesser et al.
2010) for producing the initial intrinsic RBEmax tables, which are then combined with different models for
obtaining the final biological effect of the mixed radiation field (Kraemer and Scholz 2000, Kraemer and
Scholz 2006). In the first set of examples the version LEM II (Elsaesser et al 2007) is used. The physical
dose calculations were performed with the different algorithms available in the program according to the
required accuracy in the different cases.
For all the patient cases, dose profiles as fraction of the planned RBE weighted dose, as well as BED maps
are shown, normalized to the BED in the target. For the latter, BED at any voxel are computed according to
equation 3.4 from the (RBE weighted) dose cubes Dbio(x,y.z), which are output from the program. It is
important to note that eq. 3.5, connecting directly the BED to the ion physical dose is only valid for a
monoenergetic ion beam where the LET is fixed and arising from a single ion contribution. It is not directly
applicable in a mixed beam field, where the RBE contributions of the single beam elements (in particle type
and energy) are combined in a complex way as accounted in TRiP98 (see e.g. Kraemer and Scholz 2006).
Dose volume histograms (DVHs) are also provided for each configuration, and for both above mentioned
quantities, with several organ at risks (OARs) included, where the different fraction sizes are shown by
different linestyles. The fraction sizes were taken consistent to those of the example of section 3.2; the (α/β)
ratios for the target, (α/β)T, and for the normal tissue, (α/β)N, were chosen in different combinations to map
different realistic situations, keeping into account the collection provided in D.JRA5.8 and also according to
the available RBE tables in use.
We conclude this section with an overview of the impact of fraction doses on different planning approaches.
1. Head tumours
In figures 10, 11, 12 and 13 we plot the case of a head tumour, with regular shape (cranial example A),
irradiated with two opposed lateral fields (180º irradiation angle).
In the first setup (fig.10), with tumour more sensitive than normal tissue, as visible from the DVHs, as well
as from the entrance channel isolevels, the dose to normal tissue slightly increases with fraction size, while
the BED slightly decreases. In the iso-sensitive configuration (fig.11), instead, BED is constant, as
expectable, while the increase in the dose plots is more pronounced. For (α/β)T <(α/β)N (fig.12) also the BED
start to increase with the fraction size, and for a larger difference of sensitivity (10 to 2, fig.13), the BED
increase becomes also relevant.
A similar situation is verifiable in a different patient case, with a more complex tumour shape (patient B, figs
14-15), where we show only two opposite sensitivity configurations (α/β)T =2, (α/β)N=1 and (α/β)T =2,
(α/β)N=3. The new feature here appearing is that for the BED plots also the target dose conformity is slightly
spoiled with increasing fraction size in the first configuration (fig.14).
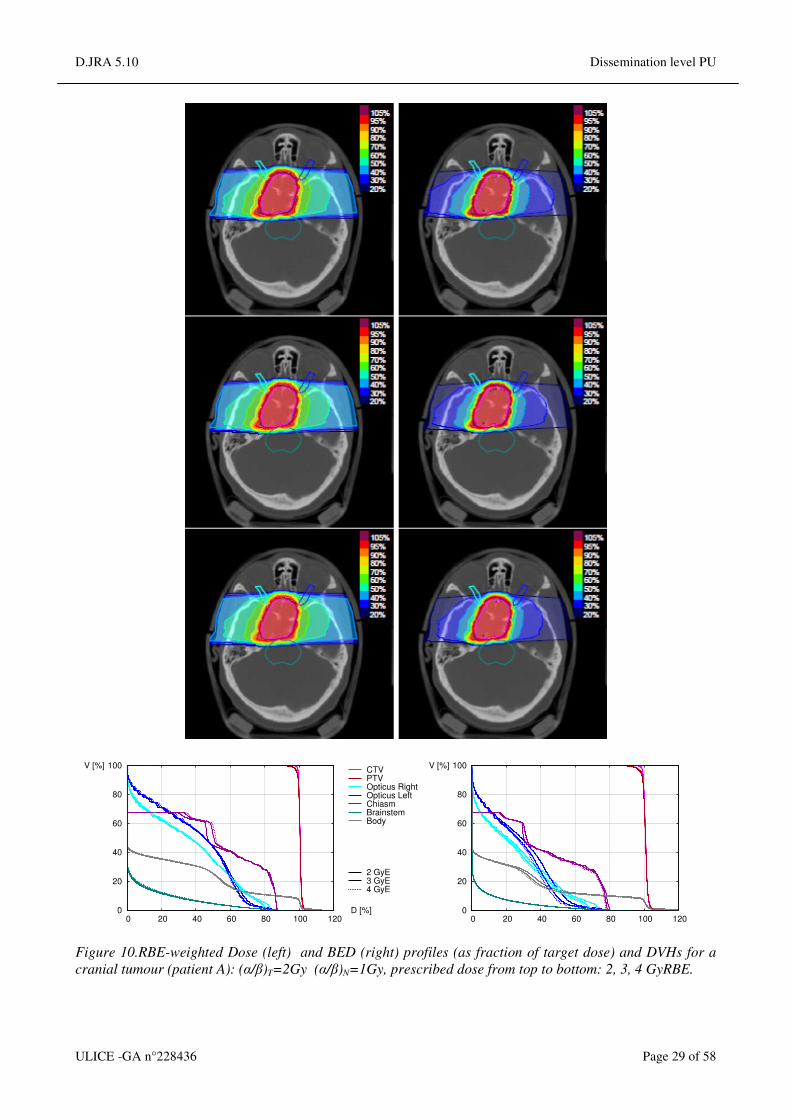
D.JRA 5.10 Dissemination level PU
ULICE -GA n°228436 Page 29 of 58
0
20
40
60
80
100
0 20 40 60 80 100 120D [%]
V [%]CTVPTVOpticus RightOpticus LeftChiasmBrainstemBody 2 GyE3 GyE4 GyE
0
20
40
60
80
100
0 20 40 60 80 100 120
V [%]
Figure 10.RBE-weighted Dose (left) and BED (right) profiles (as fraction of target dose) and DVHs for a
cranial tumour (patient A): (α/β)T=2Gy (α/β)N=1Gy, prescribed dose from top to bottom: 2, 3, 4 GyRBE.

D.JRA 5.10 Dissemination level PU
ULICE -GA n°228436 Page 30 of 58
0
20
40
60
80
100
0 20 40 60 80 100 120D [%]
V [%]CTVPTVOpticus RightOpticus LeftChiasmBrainstemBody 2 GyE3 GyE4 GyE
0
20
40
60
80
100
0 20 40 60 80 100 120
V [%]
Figure 11.RBE-weighted Dose (left) and BED (right) profiles (as fraction of target dose) and DVHs for a
cranial tumour (patient A)r: (α/β)T=2Gy (α/β)N=2Gy, prescribed dose from top to bottom: 2, 3, 4 GyRBE
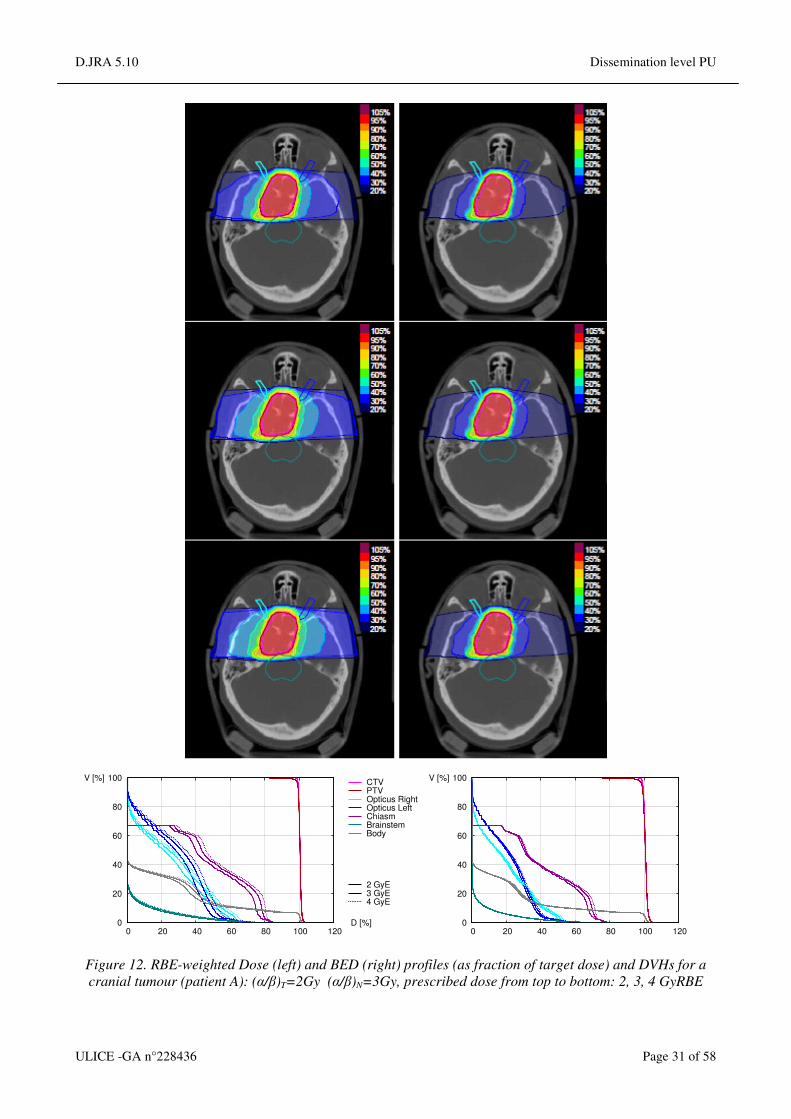
D.JRA 5.10 Dissemination level PU
ULICE -GA n°228436 Page 31 of 58
0
20
40
60
80
100
0 20 40 60 80 100 120D [%]
V [%]CTVPTVOpticus RightOpticus LeftChiasmBrainstemBody 2 GyE3 GyE4 GyE
0
20
40
60
80
100
0 20 40 60 80 100 120
V [%]
Figure 12. RBE-weighted Dose (left) and BED (right) profiles (as fraction of target dose) and DVHs for a
cranial tumour (patient A): (α/β)T=2Gy (α/β)N=3Gy, prescribed dose from top to bottom: 2, 3, 4 GyRBE

D.JRA 5.10 Dissemination level PU
ULICE -GA n°228436 Page 32 of 58
0
20
40
60
80
100
0 20 40 60 80 100 120D [%]
V [%]CTVPTVOpticus RightOpticus LeftChiasmBrainstemBody 2 GyE3 GyE4 GyE
0
20
40
60
80
100
0 20 40 60 80 100 120
V [%]
Figure 13.. RBE-weighted Dose (left) and BED (right) profiles (as fraction of target dose) and DVHs for a
cranial tumour (patient A): (α/β)T=2Gy (α/β)N=10Gy, prescribed dose from top to bottom: 2, 3, 4 GyRBE.

D.JRA 5.10 Dissemination level PU
ULICE -GA n°228436 Page 33 of 58
0
20
40
60
80
100
0 20 40 60 80 100 120D [%]
V [%]CTVPTVOpticus RightOpticus LeftChiasmBrainstemBody 2 GyE3 GyE4 GyE
0
20
40
60
80
100
0 20 40 60 80 100 120
V [%]
Figure 14.. RBE-weighted Dose (left) and BED (right) profiles (as fraction of target dose) and DVHs for a
cranial tumour (patient B): (α/β)T=2Gy (α/β)N=1Gy, prescribed dose from top to bottom: 2, 3, 4 GyRBE.

D.JRA 5.10 Dissemination level PU
ULICE -GA n°228436 Page 34 of 58
0
20
40
60
80
100
0 20 40 60 80 100 120D [%]
V [%]CTVPTVOpticus RightOpticus LeftChiasmBrainstemBody 2 GyE3 GyE4 GyE
0
20
40
60
80
100
0 20 40 60 80 100 120
V [%]
Figure 15. RBE-weighted Dose (left) and BED (right) profiles (as fraction of target dose) and DVHs for a
cranial tumour (patient B): (α/β)T=2Gy (α/β)N=3Gy, prescribed dose from top to bottom: 2, 3, 4 GyRBE.

D.JRA 5.10 Dissemination level PU
ULICE -GA n°228436 Page 35 of 58
2. Prostate tumours
The prostate tumour cases, being more deep-seated, were planned using the multiple scattering algorithm,
which describes the pencil beam with 2 lateral Gaussian profiles.
In figures 16-18 we plot a test (patient C) similar to the above reported for example A-B, with several dose
fractions (1,2,,3,4 8 GyRBE).
The results are also similar in the trend to the cranial cases, but show sensible differences: In the first case
(fig.16), (α/β)T=2 Gy (α/β)N=1 Gy, the BED in normal tissue (and organs at risk) is more drastically
decreasing with the increase of the fraction size, and the dose to normal tissue is also presenting a slight
decrease, inversely to what seen in the analogous cranial cases. In the iso-sensitive configuration BED is
again almost constant, while the RBE-weighted dose increases. For (α/β)T=2 Gy (α/β)N=3 Gy, finally, also
the BED shows a slight increase with the fraction size.
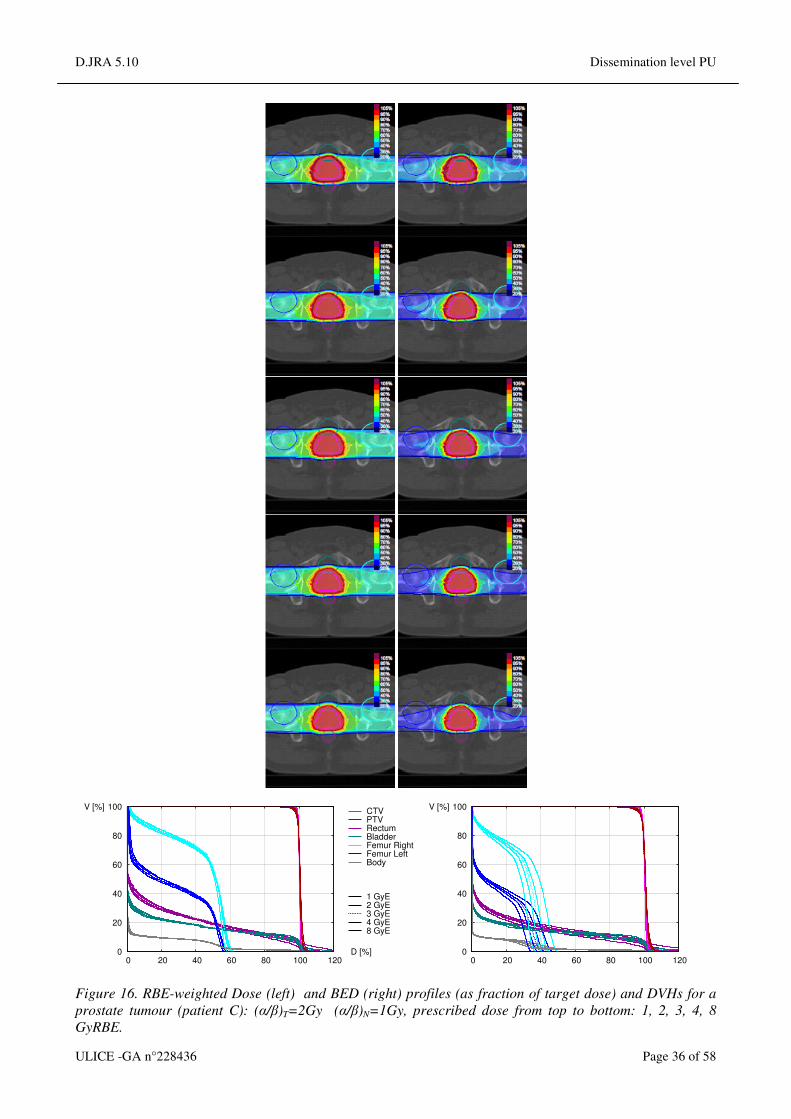
D.JRA 5.10 Dissemination level PU
ULICE -GA n°228436 Page 36 of 58
0
20
40
60
80
100
0 20 40 60 80 100 120D [%]
V [%]CTVPTVRectumBladder Femur RightFemur LeftBody 1 GyE2 GyE3 GyE4 GyE8 GyE
0
20
40
60
80
100
0 20 40 60 80 100 120
V [%]
Figure 16. RBE-weighted Dose (left) and BED (right) profiles (as fraction of target dose) and DVHs for a
prostate tumour (patient C): (α/β)T=2Gy (α/β)N=1Gy, prescribed dose from top to bottom: 1, 2, 3, 4, 8
GyRBE.

D.JRA 5.10 Dissemination level PU
ULICE -GA n°228436 Page 37 of 58
Figure 17. RBE-weighted Dose (left) and BED (right) profiles (as fraction of target dose) and DVHs for a
prostate tumour (patient C): (α/β)T=2Gy (α/β)N=2Gy, prescribed dose from top to bottom: 1, 2, 3, 4, 8
GyRBE.

D.JRA 5.10 Dissemination level PU
ULICE -GA n°228436 Page 38 of 58
0
20
40
60
80
100
0 20 40 60 80 100 120D [%]
V [%]CTVPTVRectumBladder Femur RightFemur LeftBody 1 GyE2 GyE3 GyE4 GyE8 GyE
0
20
40
60
80
100
0 20 40 60 80 100 120
V [%]
Figure 18. RBE-weighted Dose (left) and BED (right) profiles (as fraction of target dose) and DVHs for a
prostate tumour (patient C): (α/β)T=2Gy (α/β)N=3Gy, prescribed dose from top to bottom: 1, 2, 3, 4, 8
GyRBE.
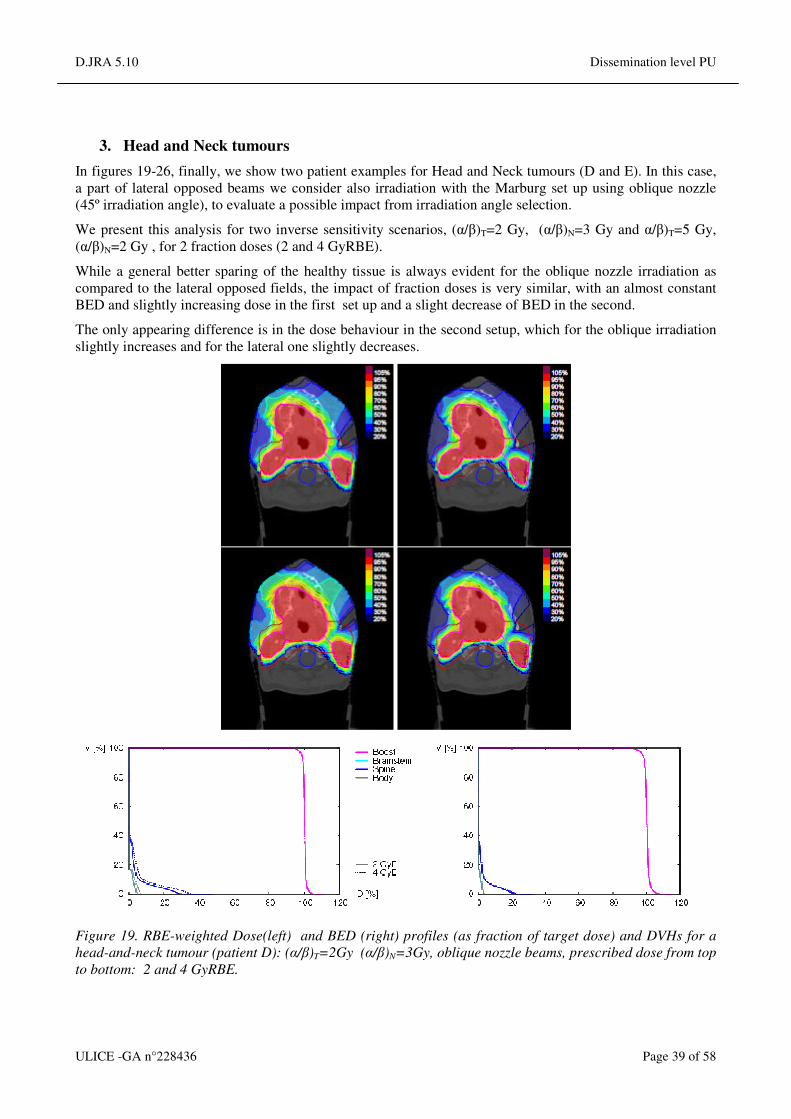
D.JRA 5.10 Dissemination level PU
ULICE -GA n°228436 Page 39 of 58
3. Head and Neck tumours
In figures 19-26, finally, we show two patient examples for Head and Neck tumours (D and E). In this case,
a part of lateral opposed beams we consider also irradiation with the Marburg set up using oblique nozzle
(45º irradiation angle), to evaluate a possible impact from irradiation angle selection.
We present this analysis for two inverse sensitivity scenarios, (α/β)T=2 Gy, (α/β)N=3 Gy and α/β)T=5 Gy,
(α/β)N=2 Gy , for 2 fraction doses (2 and 4 GyRBE).
While a general better sparing of the healthy tissue is always evident for the oblique nozzle irradiation as
compared to the lateral opposed fields, the impact of fraction doses is very similar, with an almost constant
BED and slightly increasing dose in the first set up and a slight decrease of BED in the second.
The only appearing difference is in the dose behaviour in the second setup, which for the oblique irradiation
slightly increases and for the lateral one slightly decreases.
Figure 19. RBE-weighted Dose(left) and BED (right) profiles (as fraction of target dose) and DVHs for a
head-and-neck tumour (patient D): (α/β)T=2Gy (α/β)N=3Gy, oblique nozzle beams, prescribed dose from top
to bottom: 2 and 4 GyRBE.

D.JRA 5.10 Dissemination level PU
ULICE -GA n°228436 Page 40 of 58
Figure 20. RBE-weighted Dose (left) and BED (right) profiles (as fraction of target dose) and DVHs for a
head-and-neck tumour (patient D): (α/β)T=5Gy (α/β)N=2Gy, oblique nozzle beams, prescribed dose from
top to bottom: 2 and 4 GyRBE.

D.JRA 5.10 Dissemination level PU
ULICE -GA n°228436 Page 41 of 58
Figure 21. RBE-weighted Dose (left) and BED (right) profiles (as fraction of target dose) and DVHs for a
head-and-neck tumour (patient D): (α/β)T=2Gy (α/β)N=3Gy, lateral opposed beams, prescribed dose from
top to bottom: 2 and 4 GyRBE.
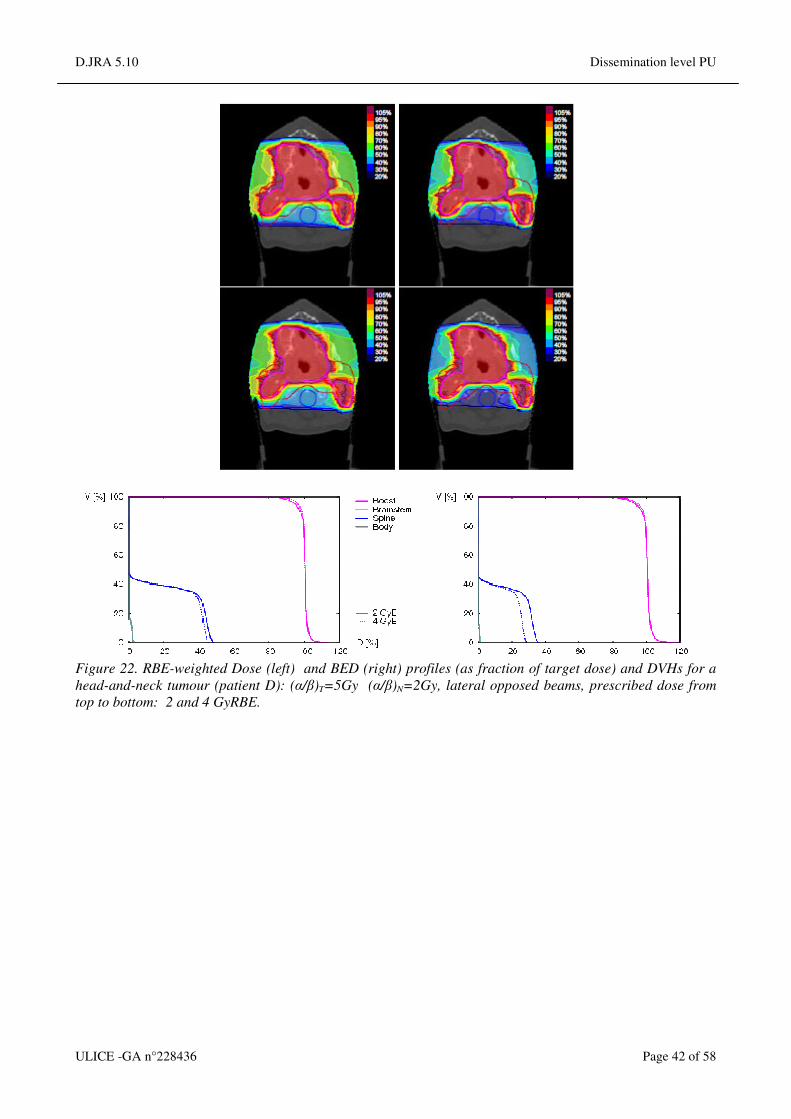
D.JRA 5.10 Dissemination level PU
ULICE -GA n°228436 Page 42 of 58
Figure 22. RBE-weighted Dose (left) and BED (right) profiles (as fraction of target dose) and DVHs for a
head-and-neck tumour (patient D): (α/β)T=5Gy (α/β)N=2Gy, lateral opposed beams, prescribed dose from
top to bottom: 2 and 4 GyRBE.

D.JRA 5.10 Dissemination level PU
ULICE -GA n°228436 Page 43 of 58
Figure 23. RBE-weighted Dose (left) and BED (right) profiles (as fraction of target dose) and DVHs for a
head-and-neck tumour (patient E): (α/β)T=2Gy (α/β)N=3Gy, oblique nozzle beams, prescribed dose from top
to bottom: 2 and 4 GyRBE.

D.JRA 5.10 Dissemination level PU
ULICE -GA n°228436 Page 44 of 58
Figure 24. RBE-weighted Dose (left) and BED (right) profiles (as fraction of target dose) and DVHs for a
head-and-neck tumour (patient E): (α/β)T=5Gy (α/β)N=2Gy, oblique nozzle beams, prescribed dose from
top to bottom: 2 and 4 GyRBE.

D.JRA 5.10 Dissemination level PU
ULICE -GA n°228436 Page 45 of 58
Figure 25. RBE-weighted Dose (left) and BED (right) profiles (as fraction of target dose) and DVHs for a
head-and-neck tumour (patient E: (α/β)T=2Gy (α/β)N=3Gy, lateral opposed beams, prescribed dose from
top to bottom: 2 and 4 GyRBE.

D.JRA 5.10 Dissemination level PU
ULICE -GA n°228436 Page 46 of 58
Figure 26.. RBE-weighted Dose (left) and BED (right) profiles (as fraction of target dose) and DVHs for a
head-and-neck tumour (patient E): (α/β)T=5Gy (α/β)N=2Gy, lateral opposed beams, prescribed dose from
top to bottom: 2 and 4 GyRBE.
4. Impact of fraction dose on plan robustness
We also present here briefly the specific effect of fraction size on different irradiation conditions.
As for robustness, several tests were performed at UNIMAR, partially reported in Jelen et al.2012, to try to
elucidate if the fraction size could have a specific impact on a plan robustness, after different type of
alterations performed to the irradiation geometry.
In a first set of phantom tests it was evaluated the effect for a drastic alteration due to insertion of a bony
heterogeneity (Fig.27). In this case it appear that the lower fraction size has more drastic impact, as a direct
consequence of its steeper dose profile.
A similar effect was also investigated on a patient irradiation (prostate, fig. 28) for alteration due to
misplacement. This was simulated by recalculation in a presence of a posterior shift of the prostate of 1 cm
compensated with isocentre realignment.
In this case the effect of different fraction doses is extremely small, with a very thiny increase in dose to
healthy tissue for larger dose fractions (~1%).
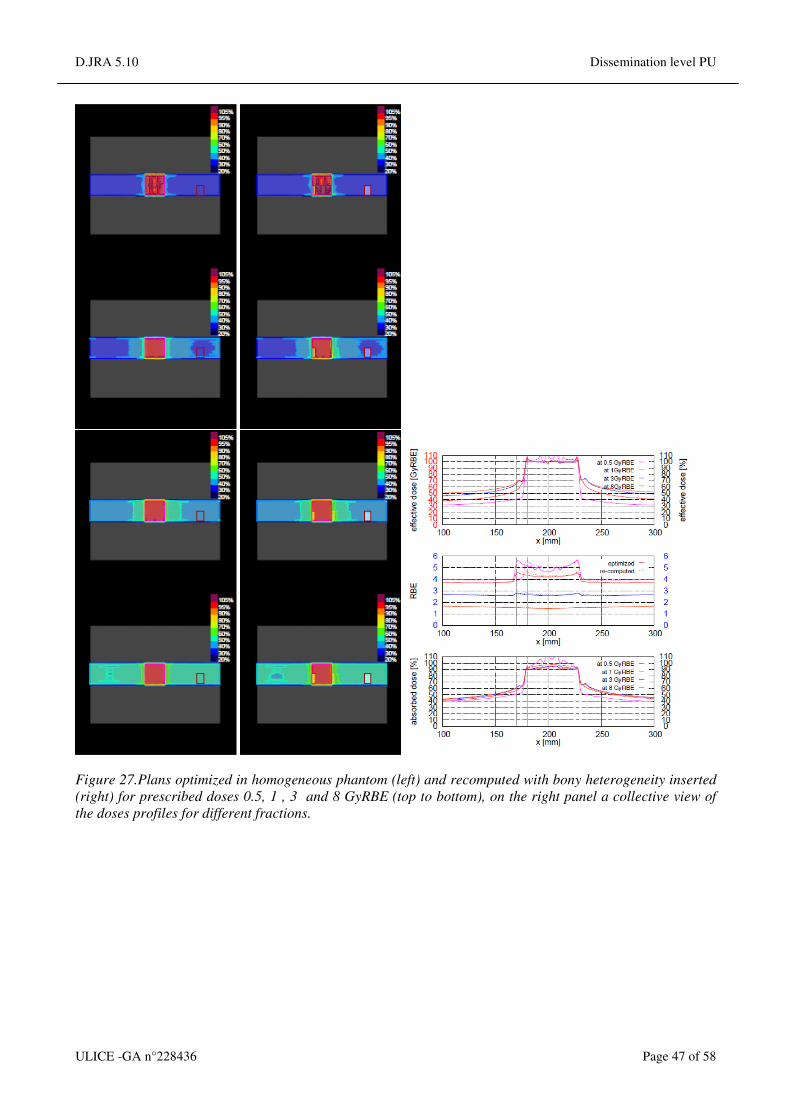
D.JRA 5.10 Dissemination level PU
ULICE -GA n°228436 Page 47 of 58
Figure 27.Plans optimized in homogeneous phantom (left) and recomputed with bony heterogeneity inserted
(right) for prescribed doses 0.5, 1 , 3 and 8 GyRBE (top to bottom), on the right panel a collective view of
the doses profiles for different fractions.

D.JRA 5.10 Dissemination level PU
ULICE -GA n°228436 Page 48 of 58
Figure 28.Plans optimized (left) and recomputed in presence of posterior prostate shift of 10mm and
compensated with isocentre realignment (right), for prescribed doses 1.8 , 3 and 8 GyRBE (top to bottom),
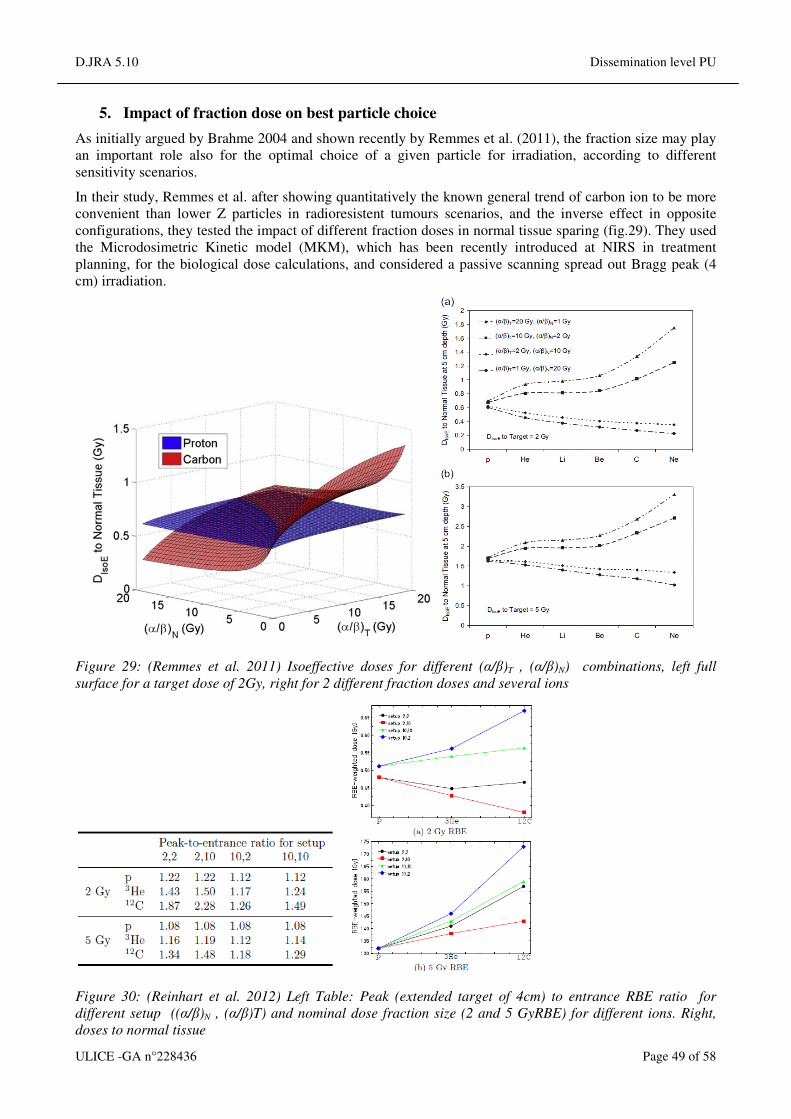
D.JRA 5.10 Dissemination level PU
ULICE -GA n°228436 Page 49 of 58
5. Impact of fraction dose on best particle choice
As initially argued by Brahme 2004 and shown recently by Remmes et al. (2011), the fraction size may play
an important role also for the optimal choice of a given particle for irradiation, according to different
sensitivity scenarios.
In their study, Remmes et al. after showing quantitatively the known general trend of carbon ion to be more
convenient than lower Z particles in radioresistent tumours scenarios, and the inverse effect in opposite
configurations, they tested the impact of different fraction doses in normal tissue sparing (fig.29). They used
the Microdosimetric Kinetic model (MKM), which has been recently introduced at NIRS in treatment
planning, for the biological dose calculations, and considered a passive scanning spread out Bragg peak (4
cm) irradiation.
Figure 29: (Remmes et al. 2011) Isoeffective doses for different (α/β)T , (α/β)N) combinations, left full
surface for a target dose of 2Gy, right for 2 different fraction doses and several ions
Figure 30: (Reinhart et al. 2012) Left Table: Peak (extended target of 4cm) to entrance RBE ratio for
different setup ((α/β)N , (α/β)T) and nominal dose fraction size (2 and 5 GyRBE) for different ions. Right,
doses to normal tissue

D.JRA 5.10 Dissemination level PU
ULICE -GA n°228436 Page 50 of 58
Their finding is that different fraction sizes just change the absolute values and shrink the differences, but
don’t induce any inversion of trend.
However, a similar study was recently initiated also at GSI, for active scanning system and the TRiP98/LEM
approach. The preliminary results, reported in Reinhart et al.2012, for an active irradiation of a target with
the same size of the SOBP used in Remmes, suggest a more complex behaviour, as a function of particle
type, where the lower Z particles may be more advantageous for selected cases even for α/β)T <<(α/β)N)
(fig.30).
6. Impact of fraction dose on hypoxia irradiation.
With the new implementation of TRiP98 called TRiP-OER (Scifoni et al. 2013), also extensively discussed
in D.JRA5.3-4, we recently introduced the specific possibility to irradiate hypoxic tumours by keeping into
account heterogeneous intra-tumour sensitivity, induced by regions of different oxygen concentration (pO2).
In that case we cannot anymore consider the RBE-weighted dose as a relevant quantity, since the full
biological effect in the target is a combination including also the oxygen enhancement ratio (OER). Thus we
focused on an overall effect-based optimization. The new extension, in fact, allows to restore a uniform
survival level in the inhomogeneous target
We now show a simple test of irradiation with different fractionation schemes also in this case.
We considered a phantom composed by 3 different oxygenation levels (see inset of figure 31), irradiated by
two opposite fields. The tissue sensitivities are taken consistent to those used for in vitro biological
dosimetry experiments with CHO-K1 cells: α/β)T =(α/β)N=10. There, a plan optimized disregarding the
intratumour inhomogeneity due to hypoxia, would produce a survival profile such as the dotted line in the
figure. OER optimized plans through TRiP-OER, instead, will deliver in general more dose in the entrance
channels, but will be able to compensate the different increased radioresistences of the different hypoxic
compartments.
By accounting for an iso-effect irradiation, we got that 7 fractions of 1.3 GyRBE would lead to the same
overall survival effect in the target than a single fraction of 6.5 GyRBE (10%). The two OER-optimized
plans are inducing an asymmetric profile in the entrance channels due to the asymmetry of the oxygen
concentration in the target. The application of the smaller fractions improve slightly the effect in the normal
tissue in the more critical channel.
pO2=
21%
pO2=
0.5%
pO2=
0%
pO2=
21%
pO2=
0.5%
pO2=
0%
pO2=
21%
pO2=
0.5%
pO2=
0%
Figure 31: OER optimized plans on a phantom with an heterogeneous tumour, composed by regions at
different oxygen concentration (pO2 in the inset) with different fraction sizes, 2 lateral opposed beam. A plan
optimized disregarding the hypoxia induced heterogeneity and recomputed on the same phantom is also
shown (dotted line).

D.JRA 5.10 Dissemination level PU
ULICE -GA n°228436 Page 51 of 58
7. Impact of fraction dose on moving targets irradiation
For completeness we briefly show also the effect of different fractions on moving target irradiation, an issue
which is of great importance and is discussed in more detail in WP4. In fact, despite initial promising
clinical results on hypofractionation of lung cancer obtained at NIRS (Miyamoto et al. 2007), it was argued
that the latter approach would not be generally suitable in connection to motion mitigation approaches.
This problem was investigated at GSI by Woelfelschneider et al.(2012), who assessed the variation of dose
coverage (mainly on a DVH level analysis for different fractionation schemes of a moving lung tumour.
Calculations were performed with TRiP98, in its 4D extension (Bert et al. 2007). The overall effect was
accounted for by summing all the contribution of the different fractions. It is shown that lower fraction
numbers produce a less steep profile and a larger uncertainty, thus suggesting a less suitability in treatment
of similar tumours (figure 32). On the other hand, while the dose conformity improves substantially, the
uncertainty remains considerable also for a high number of fractions.
Figure32. (Woelfelschneider et al. 2012) Whisker-Box plot of DVHs after 1, 5 and 10 fractions, of scanned
carbon beam irradiation on a moving lung tumour.
CONCLUSIONS
As expected, from the reported tests we did not see, in general, a remarkable effect of fractionation in
particle therapy as it happens for conventional X-ray radiotherapy. Still, significant differences arise for
different sensitivity scenarios, suggesting the possibility to reduce the fraction numbers – and then to exploit
hypofractionation – just in some cases. Moreover, the full assessment of this effect is not complete at the
present time. In particular, the perspective of using a mixed modality irradiation (see DJRA5.5), e.g.
photons plus ion boost, where fractionation effects of photons and ions are collectively playing a role, drive
efforts of further research for treatment planning oriented to BED assessment and optimization.
Further fractionation tests can be performed for different ions and/or different oxygenation levels, keeping
into account more complex processes, resulting in a different target status along the different fractions, such
as shrinkage and reoxygenation.
Summary & Recommendations
Fractionation of high LET PCP therapy imposes challenges and opportunities to improve and optimise
therapeutic index and cost effectiveness, given that hypofractionation, even if applicable in only some
clinical situations, will allow greater patient throughput. This can be achieved by further experimental RBE
and fractionation programmes, eventually leading to carefully constructed and conducted clinical trials that
will compare PCP fairly with low LET radiotherapy alternatives.

D.JRA 5.10 Dissemination level PU
ULICE -GA n°228436 Page 52 of 58
There also needs to be greater understanding of the radiobiological principles and new opportunities to
calculate isoeffective treatments. The numerical tools for such research are already available, using both
bottom up (e.g. micro-dosimetry) and top down (classical radiobiology) modelling techniques. The
computational approach may rely on versatile tools like TRiP98. In fact, the presented formalisms may be
successfully introduced in the above mentioned treatment planning system.
Fractionation, even of photon (x-ray based therapy) is complex and the further inclusion of changes in
radiation quality (RBE), itself dependent on multiple input variables, adds to the complexity. It should also
be considered that the growing understanding of radiosensitivity on mechanistic bases, and ways how to
modify it, promises not only more accurate prediction of RBE, but even to selectively increase a tumour
RBE, e.g. by using radiosensitizers, thus modifying the scenarios presented above. All these will be crucial
steps for a maximally safe use of PCP therapy. In the meantime it is desirable to perform in vivo experiments
(which reflect human tissue tolerances) to determine the full limits of RBE (RBEmax and RBEmin) for a wide
range of different values of LET in late reacting tissues such as brain, spinal cord, kidney, lung, heart, bowel,
bone etc. This is a major task that will require cooperation across Europe and in the world (not only in cancer
therapy, but also in radioprotection etc.).
REFERENCES
Barendsen G.W. & Broerse J.J.(1970).Experimental radiotherapy of rat rhabdomyosarcoma with 15MV
neutrons and 300kV X-rays. Effects of fractionated treatments. Eur.J Cancer 6, 89-109.
Barendsen G.W. (1982). Dose fractionation, dose rate and iso-effect relationships for normal tissue
responses. Int J Radiat Oncol Biol & Physics 8, 1981-1997.
Bates T.D. (1975). A prospective clinical trial of post operative radiotherapy delivered in three fractions per
week versus two fractions per week. Clinical Radiology 26, 297 -304.
Bates T.D. & Peters L.J. (1975). Danger of the use of the NSD formula for small fraction numbers. Brit J
Radiology 48, 773.
Baujat B., Bourhis J., Blanchard P., Overgaard J., Ang K.K., Saunders M. et al (2010) Hyperfractionated or
accelerated radiotherapy for head and neck cancer. Cochrane Database Syst Rev. 2010 Dec
8;(12):CD002026.
Bewley D.K. p113 in: The Physics and Radiobiology of fast neutron beams. Pubs. Adam Hilger (Bristol &
New York), 1989.
Bert Ch., Rietzel E. (2007). 4D treatment planning for scanned ion beams . Rad. Oncology 2, 24.
Brahme A. (2004). Recent advances in light ion radiation therapy. Int J. Radiat. Oncol. Biol. Phys. 58, 603.
Catterall M. and Bewley D.K. (1979). Fast neutrons in the treatment of cancer. Academic press, London &
New York.[p 93, referring WK Sinclair`s work “Biophysical Aspects of Radiation Quality” second panel
report IAEA, Vienna, p 39.
Carabe-Fernandez A., Dale R.G. and Jones B. (2007). The incorporation of the concept of minimum RBE
(RBEmin) into the linear-quadratic model and the potential for improved radiobiological analysis of high-LET
treatments. International Journal of Radiation Biology, 83, 27-39.
Carabe-Fernandez A., Dale R.G., Hopewell J.W., Jones B., Paganetti H. (2010). Fractionation effects in
particle radiotherapy: implications for hypo-fractionation regimes. Phys Med Biol. 55(19):5685-700.

D.JRA 5.10 Dissemination level PU
ULICE -GA n°228436 Page 53 of 58
Dale R.G. (1985). The application of the linear quadratic theory to fractionated and protracted radiotherapy.
Br.J.Radiol; 58:515-528.
Dale R.G. (1986). The application of the LQ model to fractionated radiotherapy when there is incomplete
normal tissue recovery between fractions and possible implications for treatments involving multiple
fractions per day. Br.J.Radiol; 59: 919 - 927.
Dale R.G. (1989). Time-dependent tumour repopulation factors in the linear quadratic equations -
implications for treatment strategies. Radiotherapy & Oncology 15, 371-382.
Dale R.G. and Jones B. The effect of tumour shrinkage on biologicall effective dose and possible
implications for high dose rate brachytherapy. Radiother & Oncol, 33, 125-132, 1994.
Dale R.G. and Jones B. (Editors): “Radiobiological Modelling in Radiation Oncology” published by The British
Institute of Radiology, London, 2007. Chapters on Fractionation, Hypoxia and High LET radiations.
Daşu A., Toma-Daşu I. (2008). What is the clinically relevant relative biologic effectiveness? A warning for
fractionated treatments with high linear energy transfer radiation. Int J Radiat Oncol Biol Phys. 70(3):867-
74.
Denekamp J., Stewart F.A. And Douglas B.G. (1973). Changes in the proliferation rate of mouse epidermis
after irradiation: continuous labelling studies. Cell Tissue Kinetics, 9, 19-29.
Denekamp J. (1973). Changes in the rate of repopulation during multifraction irradiation of mouse skin. Br. J
Radiology, 46, 381-387.
Douglas B.G. (1982).Implications of the quadratic survival curve and human skin radiation `tolerance doses`
on fractionation and super-fractionation dose selection. Int. J. Rad. Oncol. Biol. Physics, 8, 1135-1142.
Douglas B.G. & Fowler J.F. (1976). The effect of multiple small doses of X-rays on skin reactions in the
mouse and a basic interpretation. Radiation Research 66, 401-426.
Ellis F. (1969). Dose time and fractionation; a clinical hypothesis. Clinical Radiology, 20, 1-7.
Elsässer T. and Scholz M. (2007). Cluster Effects within the Local Effect Model. Radiat. Res. 167, 319–329
Elsässer T. et al. (2010). Quantification of the Relative Biological Effectiveness for Ion Beam Radiotherapy:
Direct Experimental Comparison of Proton and Carbon Ion Beams and a Novel Approach for Treatment
Planning. International Journal of Radiation Oncology Biology Physics 78(4): p. 1177-1183.
Errington R.D., Ashby D., Gore S.M. et al (1991). High energy neutron treatment for pelvic cancers: study
stopped because of increased mortality. Brit Med J, 302, 1045 - 1051.
Fowler J.F., (1971). Experimental animal results relating to time-dose relationships in radiotherapy and the
`ret` concept. Brit. J Radiol. 44, 81-90.
Fowler J.F., Denekamp J., Sheldon P.W., Smith A.M., Begg A.C. et al (1974). Optimum fractionation in X-
ray treatment of C3H mouse mammary tumours. Br J Radiol 47, 781-789.
Fowler J.F., Sheldon P.W., Denekamp J, and Field S.B. (1976). Optimum fractionation of the C3H mouse
mammary carcinoma using x-rays, the hypoxic-cell radiosensitizer Ro-07-0582, or fast neutrons.
International J Radiat Oncol Biol and Physics, 1, 579-592.

D.JRA 5.10 Dissemination level PU
ULICE -GA n°228436 Page 54 of 58
Fowler J.F., Nuclear particles in cancer treatment. Adam Hilger (Bristol, UK) 1981.
Fowler J.F., (1989). The linear quadratic formula and progress in fractionated radiotherapy. Br J Radiol
62:679-694.
Fowler J.F., Harrari PM, Leborgne F, Leborgne JH. Acute radiation reactions in oral and pharyngeal mucosa:
tolerable levels in altered fractionation schedules. Radiother. Oncology 2003, 69, 161-168.
Fowler J.F. 21 years of biologically effective dose. Br J Radiol. 2010 ; 83. 554 -568.
Fu K.K., Pajak T.F., Trotti A., Jones C.U., Spencer S.A., Phillips T.L., Garden A.S., Ridge J.A., Cooper
J.S., Ang K.K. (2000) A Radiation Therapy Oncology Group (RTOG) phase III randomized study to
compare hyperfractionation and two variants of accelerated fractionation to standard fractionation
radiotherapy for head and neck squamous cell carcinomas: first report of RTOG 9003. Int J Radiat Oncol
Biol Phys 48:7-16.
Grassberger C., Trofomov A., Lomax A. & Paganetti H. Variations in energy transfer within clinical proton
therapy fields and the potential for biological treatment planning. In J Radiat Oncol Biol & Physics; 80(5):
1559-66, 2011.
Hendry J.H. & Thames H.D. (1986). The tissue rescuing unit. Brit. J Radiology 59, 628-630.
Hendry J.H. & Thames H.D. (1990). Fractionation sensitivity and the oxygen effect. Brit. J Radiology 63,
79-80.
Hopewell J.W., Nyman J., Turesson I. (2003). Time factor for acute tissue reactions following fractionated
irradiation: a balance between repopulation and enhanced radiosensitivity. Int J Rad Biol 79, 513-524.
Hopwood P., Haviland J.S., Sumo G., Mills J., Bliss J.M., Yarnold J.R. (2010) ; START Trial Management
Group. Comparison of patient-reported breast, arm, and shoulder symptoms and body image after
radiotherapy for early breast cancer: 5-year follow-up in the randomised Standardisation of Breast
Radiotherapy (START) trials. Lancet Oncol.11(3):231-40.
International Commission on Radiation Units & Measurements, (ICRU Report 78): Prescribing, Recording,
and Reporting Proton-Beam Therapy, NIH, Bethesda, (USA), 2010.
Joiner MC. (2004). A simple alpha/beta-independent method to derive fully isoeffective schedules following
changes in dose per fraction. Int J Radiat Oncol Biol Phys. 58(3):871-5.
Jelen U., Ammazzalorso F,. Chanrion M., Graef S., Zink K., Engenhart-Cabillic R. and Wittig A. (2012).
Robustness against interfraction prostate movement in scanned ion beam radiation therapy. Int J Radiat
Oncol Biol & Physics 84, 257.
Jones B., Dale R.G., Deehan C., Hopkins K.I., Morgan D.A.L. (2001). The role of biologically effective dose
(BED) in Clinical Oncology. Clinical Oncology 13:71-81.
Jones B., Dale R.G., Gaya A. (2006). Linear quadratic modelling of increased late normal tissue effects in
special clinical situations. Int J Radiat Oncol Biol & Physics, 64:948-53.
Jones B., Dale R.G., Kakhsar S.J. (2000). Biological Equiv. Dose assessment of the consequences of
hypofractionated radiotherapy. Int J Radiat Oncol Biol & Physics 47, 1379-1384.
Jones B. & Dale R.G. (2000). Estimation of optimum dose per fraction for high LET radiations: implications
for proton radiotherapy, Int J Radiat Oncol Biol & Physics 48, 1549-1557.
D.JRA 5.10 Dissemination level PU
ULICE -GA n°228436 Page 55 of 58
Jones B., Carabe-Fernandez A., Dale R.G. (2006). Calculation of high-LET radiotherapy dose required for
compensation of overall treatment time extensions. British Journal Radiology 79, 254-257.
Jones B. and Dale R.G. (2008). Radiobiological compensation of treatment errors in radiotherapy. British
Journal of Radiology: 81, 323-326, Jones B. (2009) Modelling Carcinogenesis after Radiotherapy using
Poisson statistics: implications for IMRT, protons and ions. J. Radiol. Prot. 29 A143-A157.
Jones B., Underwood T.S.A., Carabe-Fernandez A., Timlin C. & Dale R.G. (2011, a). Further analysis of fast
neutron relative biological effects and implications for charged particle therapy. Brit J Radiol, 84, S11-S18.
Jones B., Underwood T.S.A. and Dale R.G. (2011, b). The potential impact of RBE uncertainty on charged
particle treatment prescriptions. Brit J Radiology, 84, S61-S69, 2011.
Jones B., Wilson P Nagano A, Fenwick J & McKenna G. Dilemmas concerning Dose Distribution and the
influence of Relative Biological Effect (RBE) in Proton Beam Therapy of Medulloblastoma. BJR 2012
Oct;85(1018):e912-8.
Kase Y., Himukai T, Nagano A, Tameshige Y, Minohara S, Matsufuji N et al (2011) Preliminary calculation
of RBE-weighted dose distribution for cerebral radionecrosis in carbon-ion treatment planning. J Radiat Res.
2011;52(6):789-96. Epub 2011 Sep 16.
Kanai T, Endo M, Minohara S, Miyahara N, Koyama-ito H, Tomura H et al (1999) Biophysical
characteristics of HIMAC clinical irradiation system for heavy-ion radiation therapy. Int J Radiat Oncol Biol
Phys 44(1):201-10.
Kraemer, M., E. Scifoni, and M. Durante, Multi-modal treatment planning with TRiP98. GSI Sci. Rep.,
2012. 2011: p. 514.
Kraemer, M., et al. (2000), Treatment planning for heavy-ion radiotherapy: physical beam model and dose
optimization. Phys. Med. Biol. 45: p. 3299-3317.
Kraemer M., Scifoni E., Waelzlein C. and Durante M. (2012). Ion beams in radiotherapy - from tracks to
treatment planning. J Phys Conf Ser 012017, 373.
Kraemer M. and Scholz M. (2000). Treatment planning for heavy-ion radiotherapy: calculation and
optimization of biologically effective dose. Phys. Med. Biol. 45: p. 3319-3330
Kraemer M. and Scholz M. (2006). Rapid calculation of biological effects in ion radiotherapy. Phys. Med.
Biol. 51: p. 1959-1970.
Liversage W.E. (1971). A critical look at the ret. Brit. J Radiol., 44, 91-100.
Maor M.H., Errington R.D. & Caplan R.J. et al (1995). Fast neutron therapy in advanced head & neck
cancer: a collaborative internal randomised trial. Int J Rad Oncol Biol & Physics 32, 99-604.
Mauguen A, Le Péchoux C, Saunders MI, Schild SE, Turrisi AT, Baumann M et al (2012),
Hyperfractionated or accelerated radiotherapy in lung cancer: an individual patient data meta-analysis.J Clin
Oncol. 30(22):2788-97.
Medical Research Council Neutron Therapy Working Party (1986) A comparative review of the
Hammersmith 91971-1975) and Edinburgh (1977-1982) neutron therapy trials of certain cancers of the oral
cavity, oropharynx, larynx and hypopharynx. Brit J Radiol 59, 429 - 440.
Miyamoto, T., et al., Curative treatment of Stage I non-small-cell lung cancer with carbon ion beams using a
hypofractionated regimen. International journal of radiation oncology, biology, physics, 2007. 67(3): p. 750-
8.
D.JRA 5.10 Dissemination level PU
ULICE -GA n°228436 Page 56 of 58
Niemierko A (1997) Reporting and analyzing dose distributions: a concept of equivalent uniform dose. Med
Phys 24:103-10.
Okada T, Kamada T, Tsuji H, Mizoe JE, Baba M, Kato S, Yamada S, Sugahara S, Yasuda S, Yamamoto N,
Imai R, Hasegawa A, Imada H, Kiyohara H, Jingu K, Shinoto M, Tsujii H. (2010). Carbon ion radiotherapy:
clinical experiences at National Institute of Radiological Science (NIRS). J Radiat Res (Tokyo).; 51(4):355-
64.
Paganetti H, Niemierko A, Ancukiewicz M, Gerweck LE, Goitein M, Loeffler JS, Suit HD. (2002). Relative
biological effectiveness (RBE) values for proton beam therapy. Int J Radiat Oncol Biol Phys. 2002, 53:407-
21.
Paganetti H. (2003). Significance and implementation of RBE variations in proton beam therapy. Technol
Cancer Res 2: 413-26.
Pop LA, Millar WT, van der Plas M, van der Kogel AJ (2000). Radiation tolerance of rat spinal cord to
pulsed dose rate (PDR-) brachytherapy: the impact of differences in temporal dose distribution. Radiother
Oncol. 55(3):301-15.
Reinhart M., Gruen R. Friedrich T., Durante M., and Scholz M. Biology based treatment planning with
Helium ions. GSI International Summer School Report Book 2012, 75.
Remmes N.B., Herman M.G. and Kruse J.J. (2011). Optimizing normal tissue sparingin ion therapy using
calculated isoeffective dose for ion selection. Int J Radiat Oncol Biol & Physics 83, 756.
Schardt D, Elsasser T & Schulz-Ertner D. (2010). Heavy-ion tumour therapy: physical and radiobiological
benefits. Reviews of Modern Physics, 82, 383-425.
Scholz M, Matsufuji N, Kanai T (2006). Test of the local effect model using clinical data: tumour control
probability for lung tumours after treatment with carbon ion beams. Radiat Prot Dosimetry. 2006;122(1-
4):478-9.
Scholz M., Kraft G. (1994). Calculation of heavy ion inactivation probabilities based on track structure, X-
ray sensitivity and target size Rad. Prot. Dosim., 52 (1) :29-33.
Schulz-Ertner D, Tsujii H (2007). Particle radiation Therapy using proton and heavier ion beams. J Clinical
Oncol. ; 25:953-964.
Sheline GE, Wara WM,Smith V (1980). Therapeutic irradiation and brain injury. Int. J Radiat. Oncol Biol
Phys, 6, 1215-1228.
Scifoni E., Tinganelli W., Kraft-Weyrather W., Durante M., Maier A. and Kraemer M. (2013). Including
oxygen enhancement ratio in ion beam treatnment planning: model implementation and experimental
verification. Phys Med Biol, submitted.
Strandqvist M (1944). Studien uber die kumalative Wirkung der Rontgenstrahlen bei Fraktionierung. Acta
Radiologica 55, (suppl) 1-300.
Suit HD, Howes AE & Hunter N (1977). Dependence of response of a C3H mammary carcinoma to
fractionated irradiation on fraction number and intertreatment interval. Radiat Research 72, 440-454.
Thames HD AND Hendry JH (1987). Pp 148-163 in :Fractionation in Radiotherapy. Taylor and Francis,
London.

D.JRA 5.10 Dissemination level PU
ULICE -GA n°228436 Page 57 of 58
Thames HD, Bentzen SM, Turreson I, Overgaard M & Van den Bogaert W (1990). Time - dose factors in
radiotherapy: a review of the human data. Radiotherapy & Oncology , 19, 219-236.
Timlin C, Houston M & Jones B (2011), Malignant Induction Probability Maps for Radiotherapy using X-
ray and Proton Beams. Brit J Radiology, 84, S70-S78, 2011.
Trott N (1978). Radionuclides in Brachytherapy. Supplement 21, British Journal of Radiology.
Tucker SL & Travis EL (1990). Comments on a time dependent version of the linear quadratic model.
Radiotherapy & Oncology, 18, 155-163.
Turresson I & Notter G (1984 a). The influence of fraction size on the late normal tissue reaction.
Comparison of daily and twice-a-week fractionation on human skin. Int J Rad Onc Biol & Physics 10, 599-
606.
Turresson I & Notter G (1984 b). The influence of the overall treatment time in radiotherapy on the acute
skin reaction. Comparison of daily and twice-a-week fractionation on human skin. Int J Rad Onc Biol &
Physics 10, 607-618.
Van de Geijn J. (1989). Incorporating the time factor into the linear quadratic model. Brit J Radiology, 62,
296-297.
Wambersie A, Hendry JH, Andreo P, DeLuca PM, Menzel H and Whitmore G. (2007). The RBE issues in
ion beam therapy: conclusions of a joint IAEA/ICRU working group regarding quantities and units. Radiat
Prot. Dosim., 122, 463-470.
Wara WM, Phillips TL, Margolis LW, Smith V (1973). Radiation pneumonitis-a new approach to the
derivation of time-dose factors. Cancer; 55, 2100-2104.
Withers HR. (1977). Response of tissues to multiple small dose fractions. Radiation Research 71, 24 -33.
Withers HR, Thames HD, Peters LJ (1983). A new isoeffect curve for change in dose per fraction. Radiother
Oncol 1:187-91.
Woelfelschneider J., Friedrich T., Graeff C., Scholz M., Zink K., Durante M. and Bert C. (2012).
Fractionated treatment of moving tumours with scanned carbon ions. GSI Sci.Rep.2011, 543.
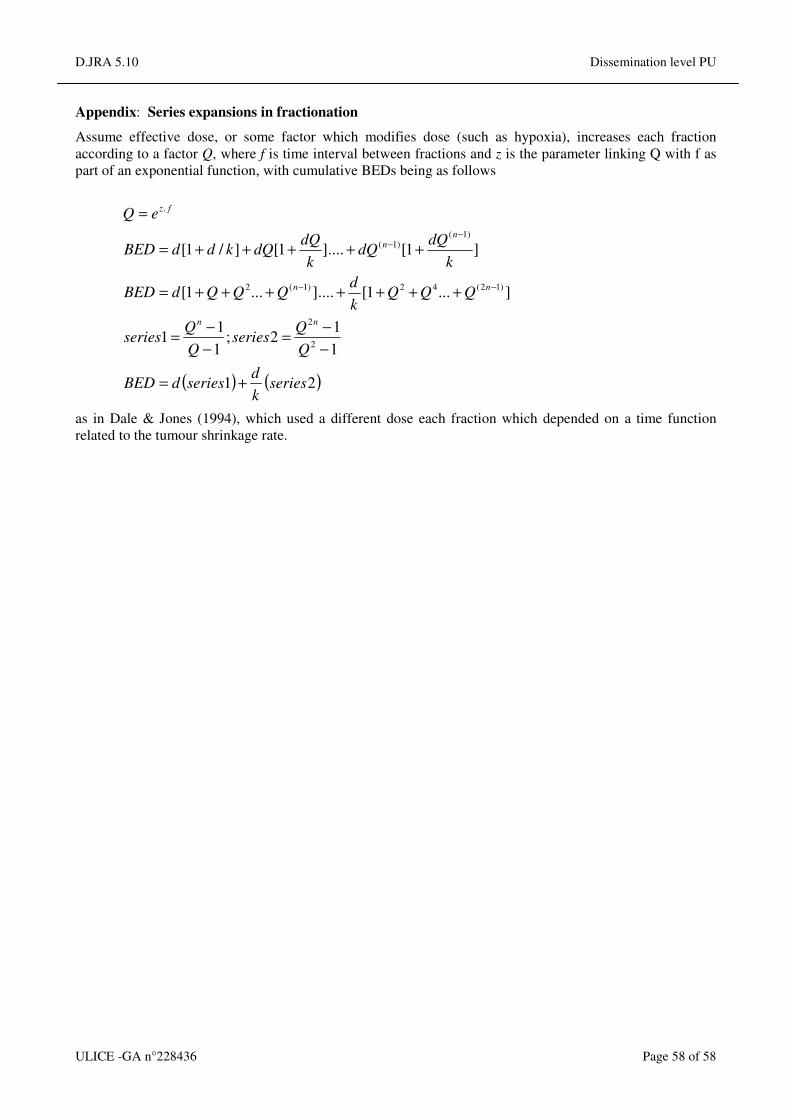
D.JRA 5.10 Dissemination level PU
ULICE -GA n°228436 Page 58 of 58
Appendix: Series expansions in fractionation
Assume effective dose, or some factor which modifies dose (such as hypoxia), increases each fraction
according to a factor Q, where f is time interval between fractions and z is the parameter linking Q with f as
part of an exponential function, with cumulative BEDs being as follows
as in Dale & Jones (1994), which used a different dose each fraction which depended on a time function
related to the tumour shrinkage rate.
( ) ( )21
1
12;
1
11
]...1[].......1[
]1[]....1[]/1[
2
2
)12(42)1(2
)1()1(
.
seriesk
dseriesdBED
Q
Qseries
Q
Qseries
QQQk
dQQQdBED
k
dQdQ
k
dQdQkddBED
eQ
nn
nn
nn
fz
+=
−−
=−−
=
+++++++=
+++++=
=
−−
−−


![ICRU 62[1]](https://img.dokumen.tips/doc/110x75/544b2875b1af9fd3448b4f56/icru-621.jpg)