Embed Size (px)
Citation preview
Grambling State University
Office of Institutional Effectiveness
2017-2018 eFactbook
Dr. Ellen D. Smiley, Provost & Vice President of Academic Affairs
Mr. Richard J. Gallot, Jr., JD, University President
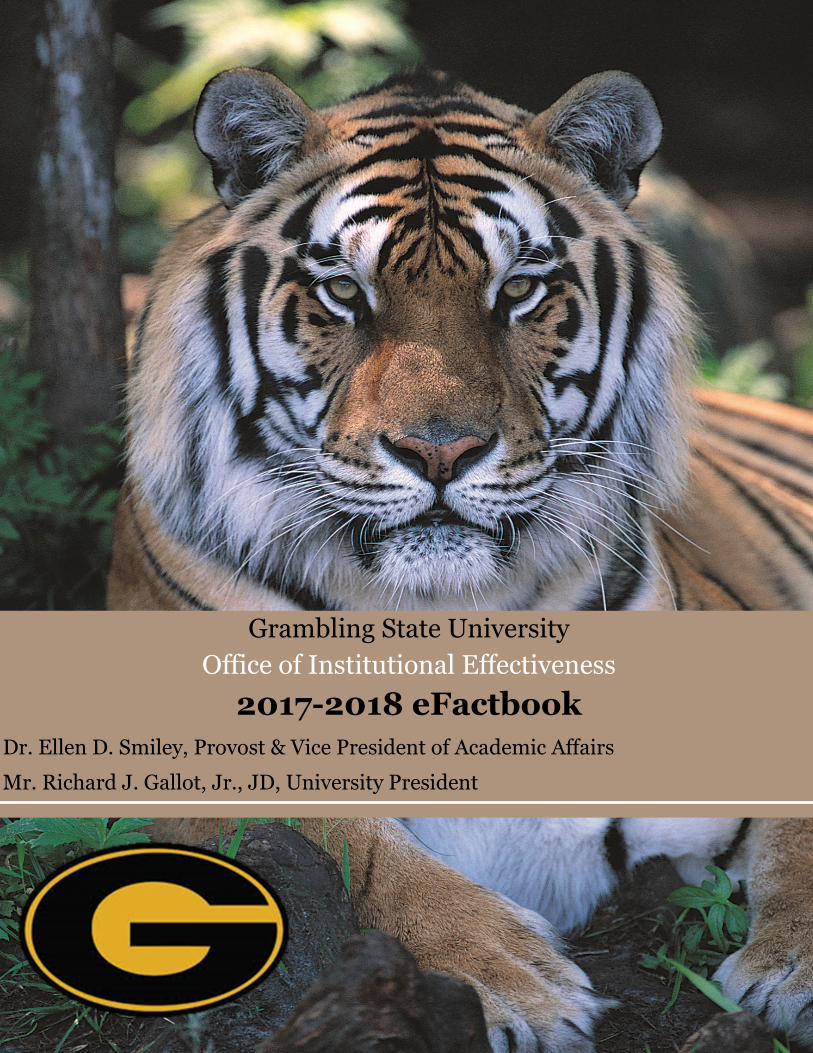
I. INSTITUTIONAL PROFILECurrent Board Members & Grambling State Administration 2Grambling State University Current Administration 3Organizational Chart 4Accrediting Agencies 5Historical Notes 6Peer Institutions 7
II. STUDENT PROFILE
A. First-Time FreshmenFall 2016 First Time Freshman 9Yield of Admitted to Enrolled 10Admission Test Scores 11
B. Enrollment InformationHeadcount Enrollment Trend by Level 12Headcount Enrollment Trend by Ethnicity 13Headcount Enrollment by Gender 14Headcount Enrollment by Classification and Gender 15Headcount Enrollment by Age, Level, and Gender-Fall 2017 16Headcount Enrollment by Status 17Enrollment by Country 18Enrollment by State 19Headcount Enrollment by Louisiana Parish 20Headcount Enrollment Trend by Student Residency 21Headcount Enrollment by Programs 22Headcount Enrollment Trend Comparison of FTE 23
C. Progression and GraduationFirst-to-Second Year Retention Rates 243 yr. Retention By Programs 25Six-Year Graduation Rates 26Degrees Awarded by Level and Gender 27Degrees Awarded by Level of Degree and Race 28Trends of Degrees Awarded by Level and Program 29
III. RESOURCESA. Employees Full-Time Instructional Faculty Trend by Gender 31Full-Time Instructional Faculty Trend by Rank 32Average Salary Trend of Full-Time Faculty by Rank 33Trend in Percentage of Full-Time Instructional Faculty 34Full-Time Staff by Ethnicity and Gender 35
Foreword and Acknowledgement…………………………………...i
GRAMBLING STATE UNIVERSITYTable of Content

B. FinancesTrend of Tuition and Fees for In-state and Out-of-state students 36Revenues by Source of Funds Fiscal Year Ending June, 2015 37Expenditures by Function 38
C. Facilities Assignable Area by Room Use 39
This is the eleventh edition of the Grambling State University eFact Book developed by the Office of Institutional Planning, Assessment, and Effectiveness (formerly the Office of Planning and Institutional Research-PAIR). This document provides five-year statistical trend information presented in tables and charts, as well as other information provided for the most current year available. The Office of Institutional Planning collects, compiles, and disseminates information on all facets of the University on a continuous basis. This publication provides a wealth of information about Grambling State University and is designed to give University constituents and external reporting agencies easy access to statistical data pertaining to the institution.
The concerted effort of the Office of Institutional Planning, Assessment, and Effectiveness staff is to make this publication a useful resource for retrieving University information by utilizing an online medium. The staff wishes to thank all of the offices and individual persons on campus who contributed information and suggestions.
FOREWORD AND ACKNOWLEDGEMENT
i

Section I:
INSTITUTIONALPROFILE
GSU

Alejandro Perkins…………………………………………………………...………………... Chair
Mark Romero……………………………………………………….……..……………...Vice Chair
James Carter……………..…………...……………………………………………. Parliamentarian
Winfred Sibille John CondosEdward Crawford, III Lola DunahoePamela Egan Thomas KitchenJimmie Martin, Jr. Johnny McFerrenShawn Murphy Elizabeth PierreBenjamin Rice (Student) Virgil RobinsonRobert Shreve
Deans of Colleges
Dean, Earl Lester Honors College …………………………………………………..Dr. Ellen D. SmileyDean, College of Education & Graduate Studies ……..…………….….…...........…Dr. Andolyn HarrisonDean, College of Professional Studies ……………...........………………………....Dr. Carolyn Hester
2
University of Louisiana SystemBoard of Supervisors Officers
ULS Board Members
Grambling State UniversityCurrent Administration
COO/Interim Vice President for Finance & Administration………………………..Mr. Martin Lemelle, Jr.
President……………………………………………………………………..Mr. Richard J. Gallot, Jr.
Dean, College of Arts & Science…….………………….……………………….….Dr. Stacey DuhonDean, College of Business……………….……………………..……………………Dr. Donald WhiteDean, College of Education……….…………………………………..…..…………Dr. Andolyn Harrison
Provost and Vice President for Academic Affairs………………………..………...Dr. Ellen SmileyVice President for Student Affairs…………………….…………………..………..Dr. David PontonVice President for Research, Advancement & Economic Development……..…….Mr. Marc Newman

3
Grambling State University Administration
Mr. Richard J. Gallot, Jr.University’s [email protected]
Dr. David PontonVice President for [email protected]
Dr.Ellen SmileyProvost/Vice President Academic & Student [email protected]
Mr. Marc NewmanVice President for Research Advancement & Economic [email protected]
Mr. Martin Lemelle, Jr.Chief Operating Officer/Interim Vice President for Finance & [email protected]
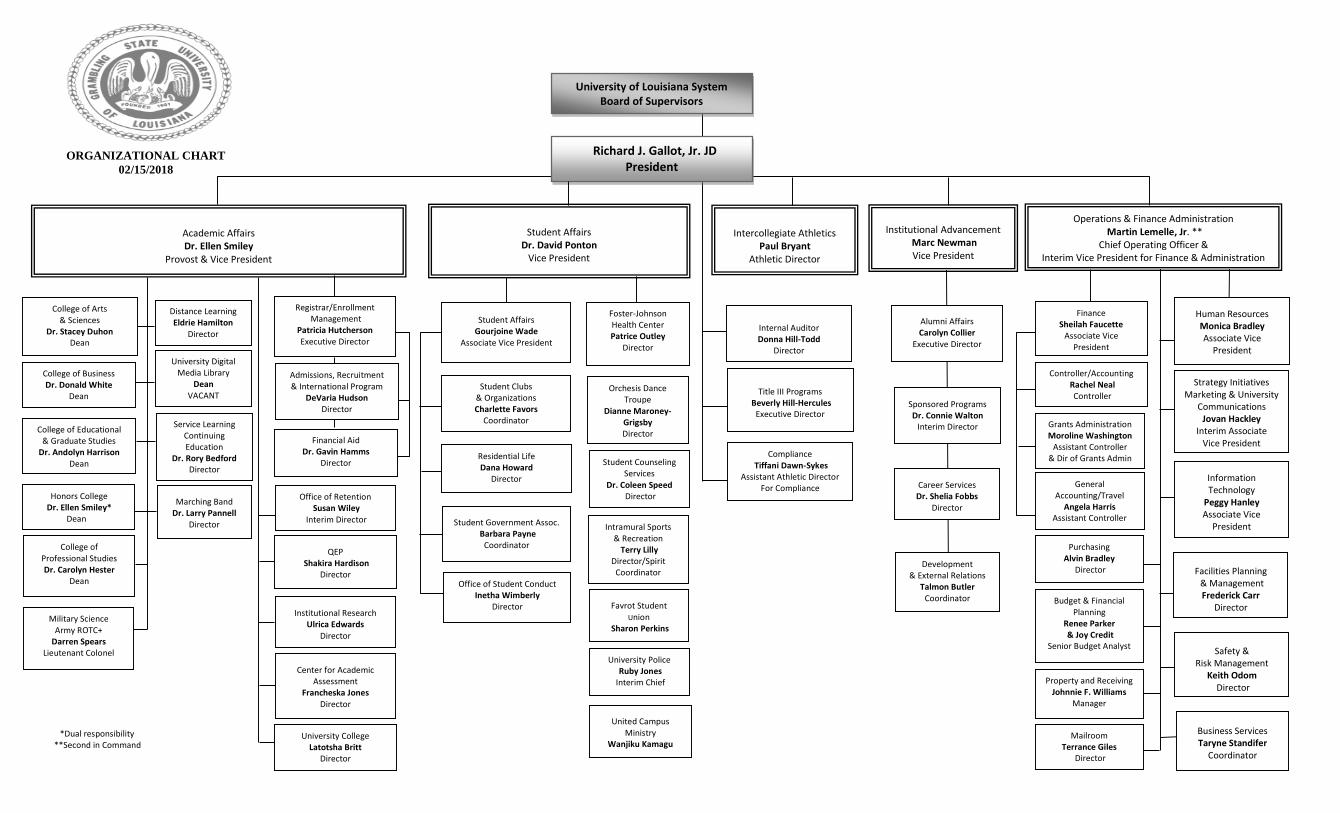
*Dual responsibility **Second in Command
College of Educational & Graduate Studies
Dr. Andolyn Harrison Dean
Foster-Johnson Health Center Patrice Outley
Director
University Digital
Media Library Dean
VACANT
Distance Learning Eldrie Hamilton
Director
University of Louisiana System Board of Supervisors
Academic Affairs Dr. Ellen Smiley
Provost & Vice President
United Campus Ministry
Wanjiku Kamagu
ORGANIZATIONAL CHART
02/15/2018
Institutional Research Ulrica Edwards
Director
Intramural Sports & Recreation
Terry Lilly Director/Spirit
Coordinator
College of Business Dr. Donald White
Dean
Office of Retention Susan Wiley
Interim Director
Safety & Risk Management
Keith Odom Director
Service Learning Continuing Education
Dr. Rory Bedford Director
Alumni Affairs Carolyn Collier
Executive Director
College of Arts & Sciences
Dr. Stacey Duhon Dean
Human Resources Monica Bradley Associate Vice
President
Orchesis Dance Troupe
Dianne Maroney-Grigsby Director
Marching Band Dr. Larry Pannell
Director
Sponsored Programs Dr. Connie Walton
Interim Director
Career Services Dr. Shelia Fobbs
Director
Institutional Advancement Marc Newman Vice President
Favrot Student
Union Sharon Perkins
Director
Development & External Relations
Talmon Butler Coordinator
Student Counseling Services
Dr. Coleen Speed Director
University Police Ruby Jones
Interim Chief
Strategy Initiatives Marketing & University
Communications Jovan Hackley
Interim Associate Vice President
Title III Programs
Beverly Hill-Hercules Executive Director
Facilities Planning & Management Frederick Carr
Director
Compliance Tiffani Dawn-Sykes
Assistant Athletic Director For Compliance
Business Services Taryne Standifer
Coordinator
Information Technology
Peggy Hanley Associate Vice
President
College of Professional Studies Dr. Carolyn Hester
Dean
Honors College Dr. Ellen Smiley*
Dean
Military Science Army ROTC+
Darren Spears Lieutenant Colonel
Intercollegiate Athletics
Paul Bryant Athletic Director
Office of Student Conduct Inetha Wimberly
Director
Financial Aid Dr. Gavin Hamms
Director
QEP Shakira Hardison
Director
Center for Academic Assessment
Francheska Jones Director
University College Latotsha Britt
Director
Admissions, Recruitment & International Program
DeVaria Hudson Director
Registrar/Enrollment Management
Patricia Hutcherson Executive Director
Student Affairs Gourjoine Wade
Associate Vice President
Student Government Assoc. Barbara Payne
Coordinator
Residential Life Dana Howard
Director
Student Clubs & Organizations Charlette Favors
Coordinator
Internal Auditor Donna Hill-Todd
Director
General Accounting/Travel
Angela Harris Assistant Controller
Controller/Accounting Rachel Neal Controller
Grants Administration Moroline Washington
Assistant Controller & Dir of Grants Admin
Finance Sheilah Faucette
Associate Vice President
Mailroom Terrance Giles
Director
Property and Receiving Johnnie F. Williams
Manager
Budget & Financial Planning
Renee Parker & Joy Credit
Senior Budget Analyst
Purchasing Alvin Bradley
Director
Richard J. Gallot, Jr. JD President
Operations & Finance Administration Martin Lemelle, Jr. **
Chief Operating Officer & Interim Vice President for Finance & Administration
Student Affairs
Dr. David Ponton Vice President
Department Accrediting Agencies Accreditation Date
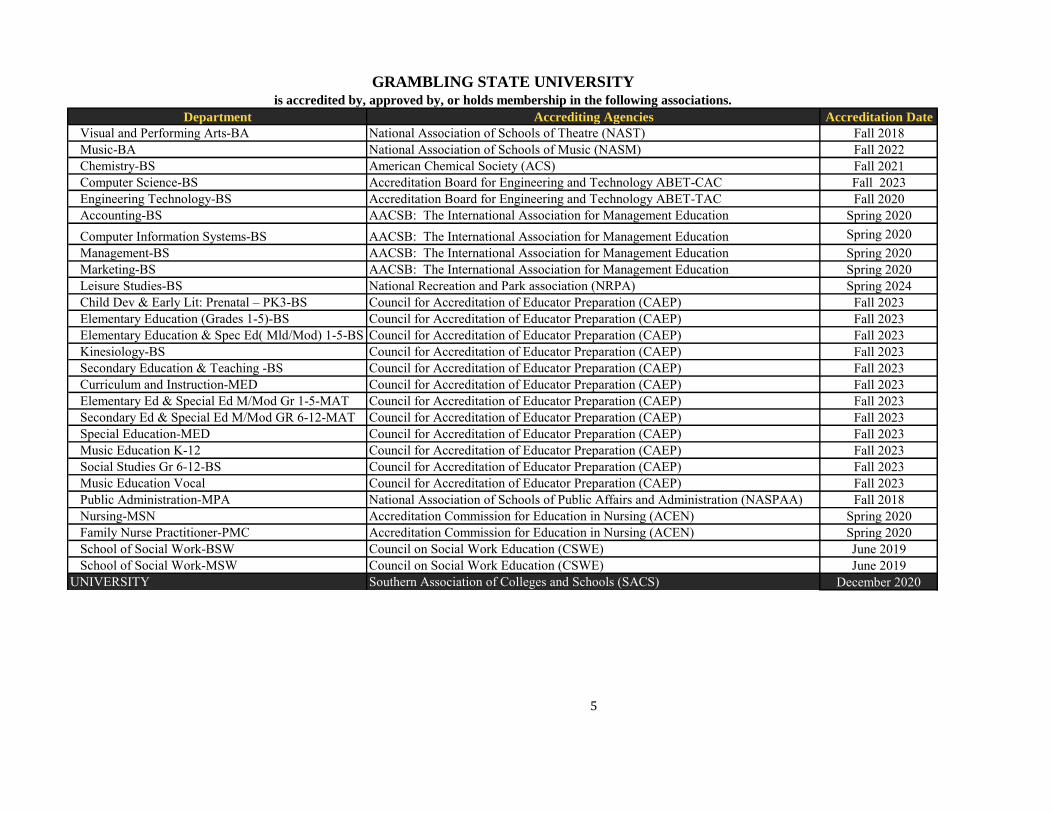
Visual and Performing Arts-BA National Association of Schools of Theatre (NAST) Fall 2018 Music-BA National Association of Schools of Music (NASM) Fall 2022 Chemistry-BS American Chemical Society (ACS) Fall 2021 Computer Science-BS Accreditation Board for Engineering and Technology ABET-CAC Fall 2023 Engineering Technology-BS Accreditation Board for Engineering and Technology ABET-TAC Fall 2020 Accounting-BS AACSB: The International Association for Management Education Spring 2020 Computer Information Systems-BS AACSB: The International Association for Management Education Spring 2020 Management-BS AACSB: The International Association for Management Education Spring 2020 Marketing-BS AACSB: The International Association for Management Education Spring 2020 Leisure Studies-BS National Recreation and Park association (NRPA) Spring 2024 Child Dev & Early Lit: Prenatal – PK3-BS Council for Accreditation of Educator Preparation (CAEP) Fall 2023 Elementary Education (Grades 1-5)-BS Council for Accreditation of Educator Preparation (CAEP) Fall 2023 Elementary Education & Spec Ed( Mld/Mod) 1-5-BS Council for Accreditation of Educator Preparation (CAEP) Fall 2023 Kinesiology-BS Council for Accreditation of Educator Preparation (CAEP) Fall 2023 Secondary Education & Teaching -BS Council for Accreditation of Educator Preparation (CAEP) Fall 2023 Curriculum and Instruction-MED Council for Accreditation of Educator Preparation (CAEP) Fall 2023 Elementary Ed & Special Ed M/Mod Gr 1-5-MAT Council for Accreditation of Educator Preparation (CAEP) Fall 2023 Secondary Ed & Special Ed M/Mod GR 6-12-MAT Council for Accreditation of Educator Preparation (CAEP) Fall 2023 Special Education-MED Council for Accreditation of Educator Preparation (CAEP) Fall 2023 Music Education K-12 Council for Accreditation of Educator Preparation (CAEP) Fall 2023 Social Studies Gr 6-12-BS Council for Accreditation of Educator Preparation (CAEP) Fall 2023 Music Education Vocal Council for Accreditation of Educator Preparation (CAEP) Fall 2023 Public Administration-MPA National Association of Schools of Public Affairs and Administration (NASPAA) Fall 2018 Nursing-MSN Accreditation Commission for Education in Nursing (ACEN) Spring 2020 Family Nurse Practitioner-PMC Accreditation Commission for Education in Nursing (ACEN) Spring 2020 School of Social Work-BSW Council on Social Work Education (CSWE) June 2019 School of Social Work-MSW Council on Social Work Education (CSWE) June 2019UNIVERSITY Southern Association of Colleges and Schools (SACS) December 2020
5
GRAMBLING STATE UNIVERSITYis accredited by, approved by, or holds membership in the following associations.
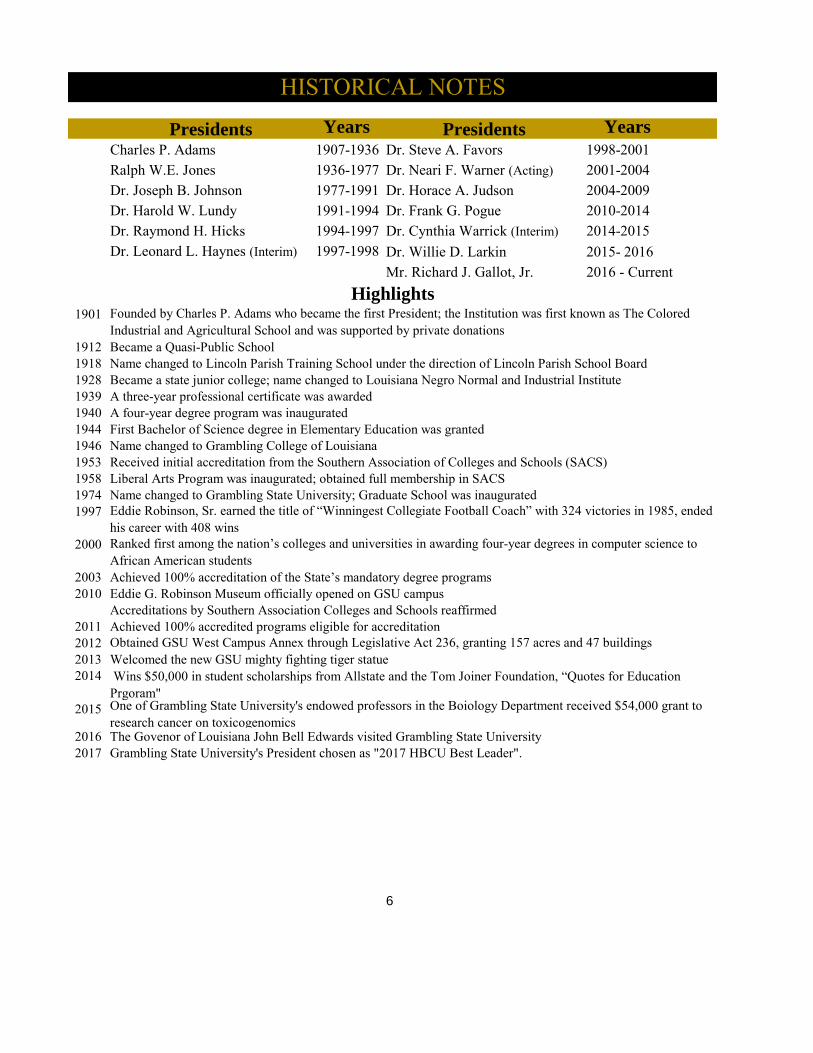
Presidents Years Presidents Years
Charles P. Adams 1907-1936 Dr. Steve A. Favors 1998-2001Ralph W.E. Jones 1936-1977 Dr. Neari F. Warner (Acting) 2001-2004Dr. Joseph B. Johnson 1977-1991 Dr. Horace A. Judson 2004-2009Dr. Harold W. Lundy 1991-1994 Dr. Frank G. Pogue 2010-2014Dr. Raymond H. Hicks 1994-1997 Dr. Cynthia Warrick (Interim) 2014-2015Dr. Leonard L. Haynes (Interim) 1997-1998 Dr. Willie D. Larkin 2015- 2016
Mr. Richard J. Gallot, Jr. 2016 - Current
1901
1912 Became a Quasi-Public School1918 Name changed to Lincoln Parish Training School under the direction of Lincoln Parish School Board1928 Became a state junior college; name changed to Louisiana Negro Normal and Industrial Institute1939 A three-year professional certificate was awarded1940 A four-year degree program was inaugurated1944 First Bachelor of Science degree in Elementary Education was granted1946 Name changed to Grambling College of Louisiana1953 Received initial accreditation from the Southern Association of Colleges and Schools (SACS)1958 Liberal Arts Program was inaugurated; obtained full membership in SACS1974 Name changed to Grambling State University; Graduate School was inaugurated1997
2000
2003 Achieved 100% accreditation of the State’s mandatory degree programs2010 Eddie G. Robinson Museum officially opened on GSU campus
Accreditations by Southern Association Colleges and Schools reaffirmed2011 Achieved 100% accredited programs eligible for accreditation20122013 Welcomed the new GSU mighty fighting tiger statue2014
2015
2016 The Govenor of Louisiana John Bell Edwards visited Grambling State University2017 Grambling State University's President chosen as "2017 HBCU Best Leader".
6
One of Grambling State University's endowed professors in the Boiology Department received $54,000 grant to research cancer on toxicogenomics
Wins $50,000 in student scholarships from Allstate and the Tom Joiner Foundation, “Quotes for Education Prgoram"
HISTORICAL NOTES
Founded by Charles P. Adams who became the first President; the Institution was first known as The Colored Industrial and Agricultural School and was supported by private donations
Eddie Robinson, Sr. earned the title of “Winningest Collegiate Football Coach” with 324 victories in 1985, ended his career with 408 winsRanked first among the nation’s colleges and universities in awarding four-year degrees in computer science to African American students
Highlights
Obtained GSU West Campus Annex through Legislative Act 236, granting 157 acres and 47 buildings
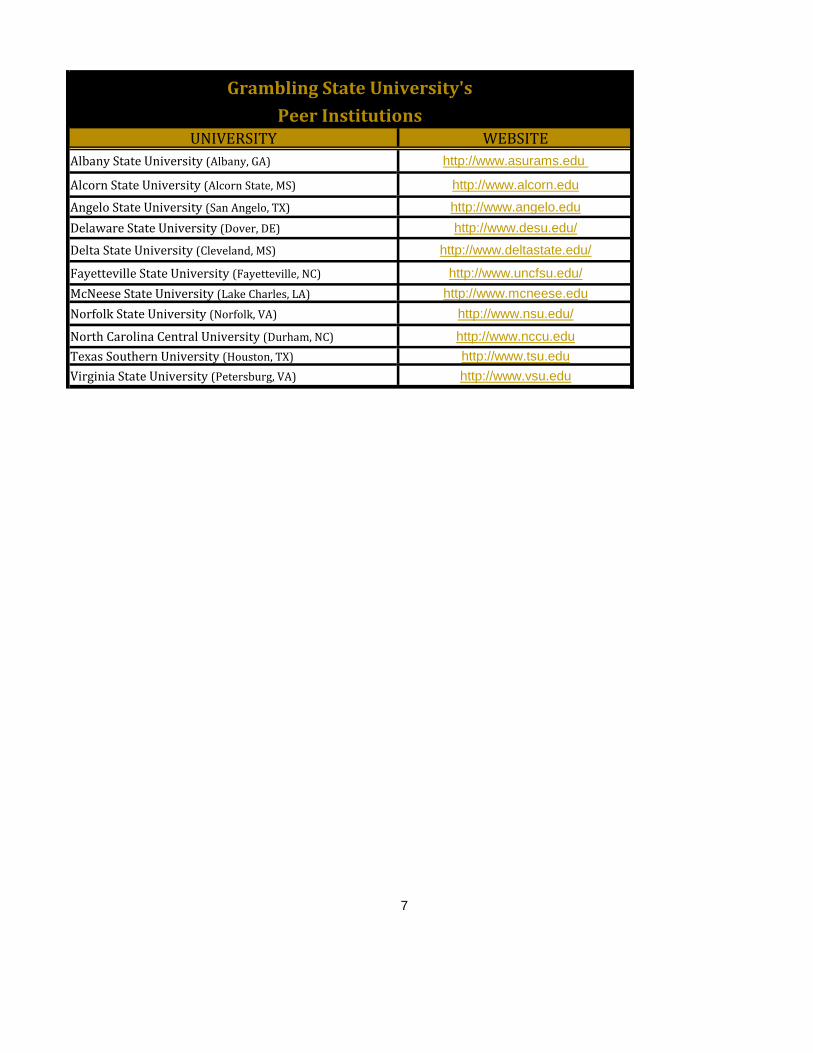
UNIVERSITY WEBSITE
Albany State University (Albany, GA) http://www.asurams.edu
Alcorn State University (Alcorn State, MS) http://www.alcorn.edu
Angelo State University (San Angelo, TX) http://www.angelo.edu
Delaware State University (Dover, DE) http://www.desu.edu/
Delta State University (Cleveland, MS) http://www.deltastate.edu/
Fayetteville State University (Fayetteville, NC) http://www.uncfsu.edu/
McNeese State University (Lake Charles, LA) http://www.mcneese.edu
Norfolk State University (Norfolk, VA) http://www.nsu.edu/
North Carolina Central University (Durham, NC) http://www.nccu.edu
Texas Southern University (Houston, TX) http://www.tsu.edu
Virginia State University (Petersburg, VA) http://www.vsu.edu
7
Grambling State University's
Peer Institutions

GSU
SECTION II: STUDENT PROFILE
A. FIRST-TIME FRESHMAN B. ENROLLMENT INFORMATION C. PROGRESSION AND GRADUATION
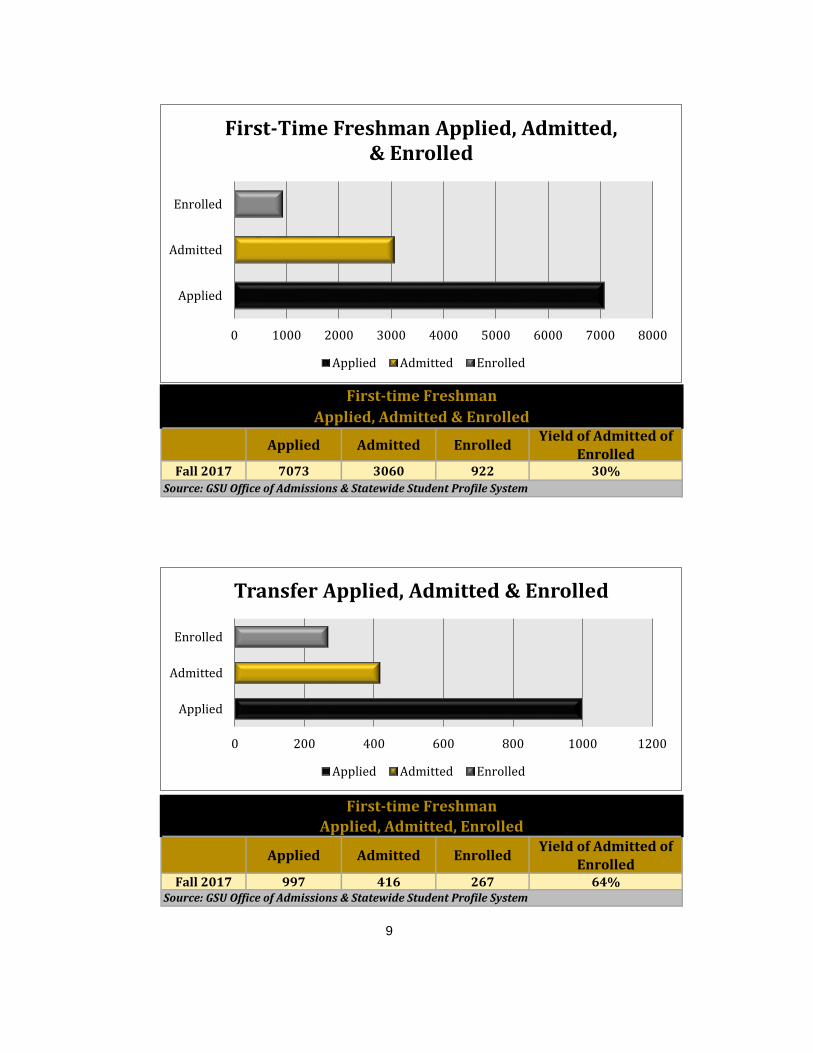
Applied Admitted EnrolledYield of Admitted of
EnrolledFall 2017 7073 3060 922 30%
Applied Admitted EnrolledYield of Admitted of
EnrolledFall 2017 997 416 267 64%
9
First-time Freshman
Applied, Admitted, Enrolled
Source: GSU Office of Admissions & Statewide Student Profile System
First-time Freshman
Applied, Admitted & Enrolled
Source: GSU Office of Admissions & Statewide Student Profile System
0 200 400 600 800 1000 1200
Applied
Admitted
Enrolled
Transfer Applied, Admitted & Enrolled
Applied Admitted Enrolled
0 1000 2000 3000 4000 5000 6000 7000 8000
Applied
Admitted
Enrolled
First-Time Freshman Applied, Admitted, & Enrolled
Applied Admitted Enrolled
First-Time Freshmen Transfers
Semester
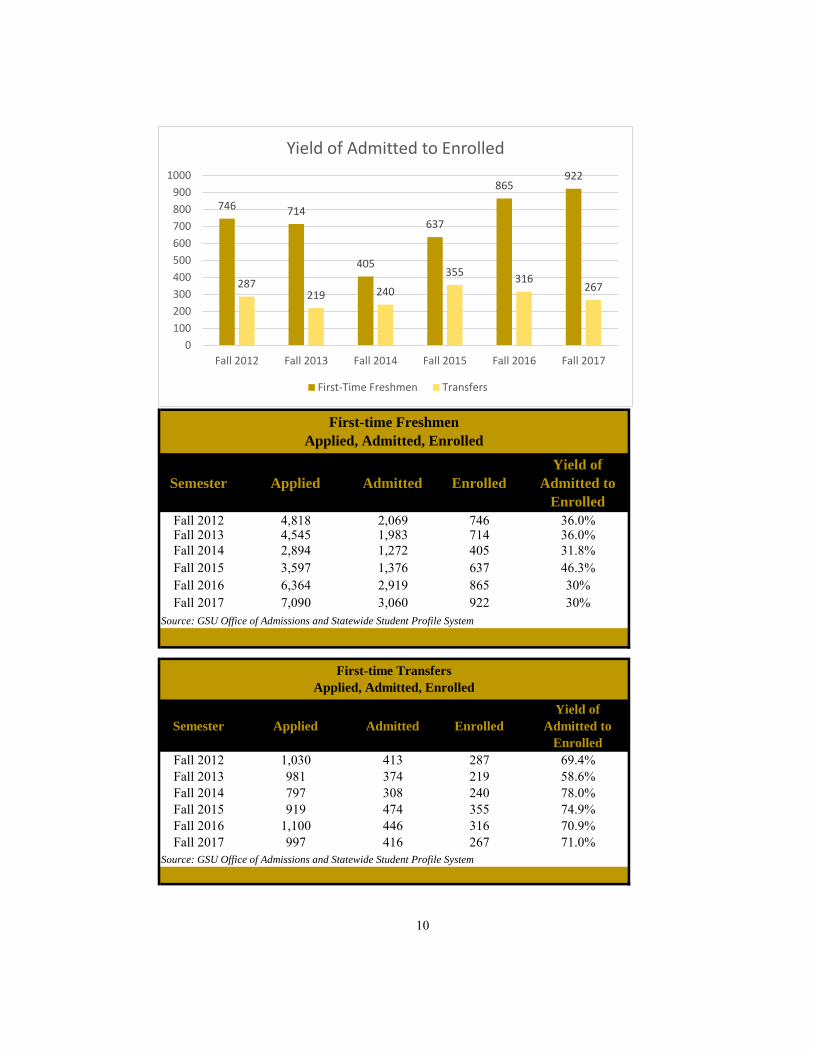
Fall 2012 746 287
Fall 2013 714 219
Fall 2014 405 240
Fall 2015 637 355
Fall 2016 865 316
Fall 2017 922 267
Semester Applied Admitted Enrolled
Yield of
Admitted to
Enrolled
Fall 2012 4,818 2,069 746 36.0%Fall 2013 4,545 1,983 714 36.0%Fall 2014 2,894 1,272 405 31.8%Fall 2015 3,597 1,376 637 46.3%Fall 2016 6,364 2,919 865 30%Fall 2017 7,090 3,060 922 30%
Source: GSU Office of Admissions and Statewide Student Profile System
Semester Applied Admitted Enrolled
Yield of
Admitted to
Enrolled
Fall 2012 1,030 413 287 69.4%Fall 2013 981 374 219 58.6%Fall 2014 797 308 240 78.0%Fall 2015 919 474 355 74.9%Fall 2016 1,100 446 316 70.9%Fall 2017 997 416 267 71.0%
Source: GSU Office of Admissions and Statewide Student Profile System
10
First-time Transfers
Applied, Admitted, Enrolled
First-time Freshmen
Applied, Admitted, Enrolled
746 714
405
637
865922
287219 240
355316
267
0
100
200
300
400
500
600
700
800
900
1000
Fall 2012 Fall 2013 Fall 2014 Fall 2015 Fall 2016 Fall 2017
Yield of Admitted to Enrolled
First-Time Freshmen Transfers
SAT
Fall 2009 866.1
Fall 2010 888.5
Fall 2011 895.0
Fall 2012 862.2
Fall 2013 853.9
Fall 2014 869.0
Fall 2015 899.0
Fall 2016 886.0
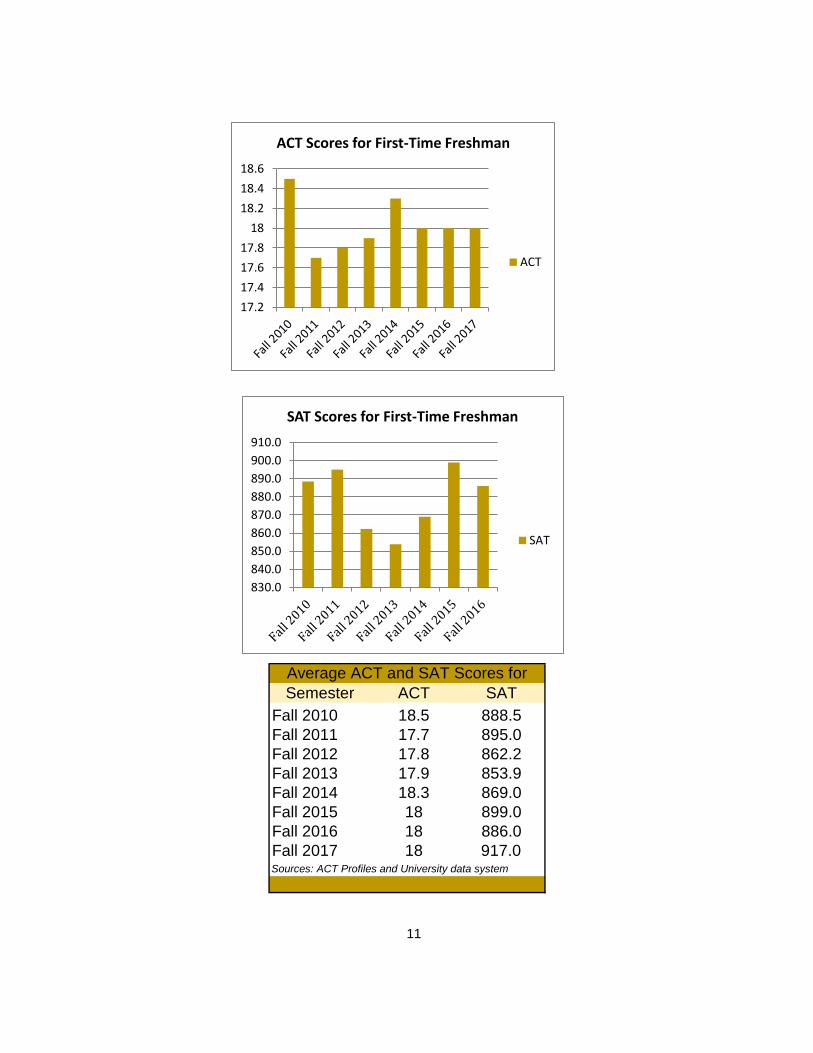
Semester ACT SAT
Fall 2010 18.5 888.5
Fall 2011 17.7 895.0
Fall 2012 17.8 862.2
Fall 2013 17.9 853.9
Fall 2014 18.3 869.0
Fall 2015 18 899.0
Fall 2016 18 886.0
Fall 2017 18 917.0Sources: ACT Profiles and University data system
11
Average ACT and SAT Scores for
17.2
17.4
17.6
17.8
18
18.2
18.4
18.6
ACT Scores for First-Time Freshman
ACT
830.0
840.0
850.0
860.0
870.0
880.0
890.0
900.0
910.0
SAT Scores for First-Time Freshman
SAT
Undergraduate Graduate
Fall 2012 4435 842
Fall 2013 4155 916
Fall 2014 3524 980
Fall 2015 3583 970
Fall 2016 3883 980
Fall 2017 4076 1099
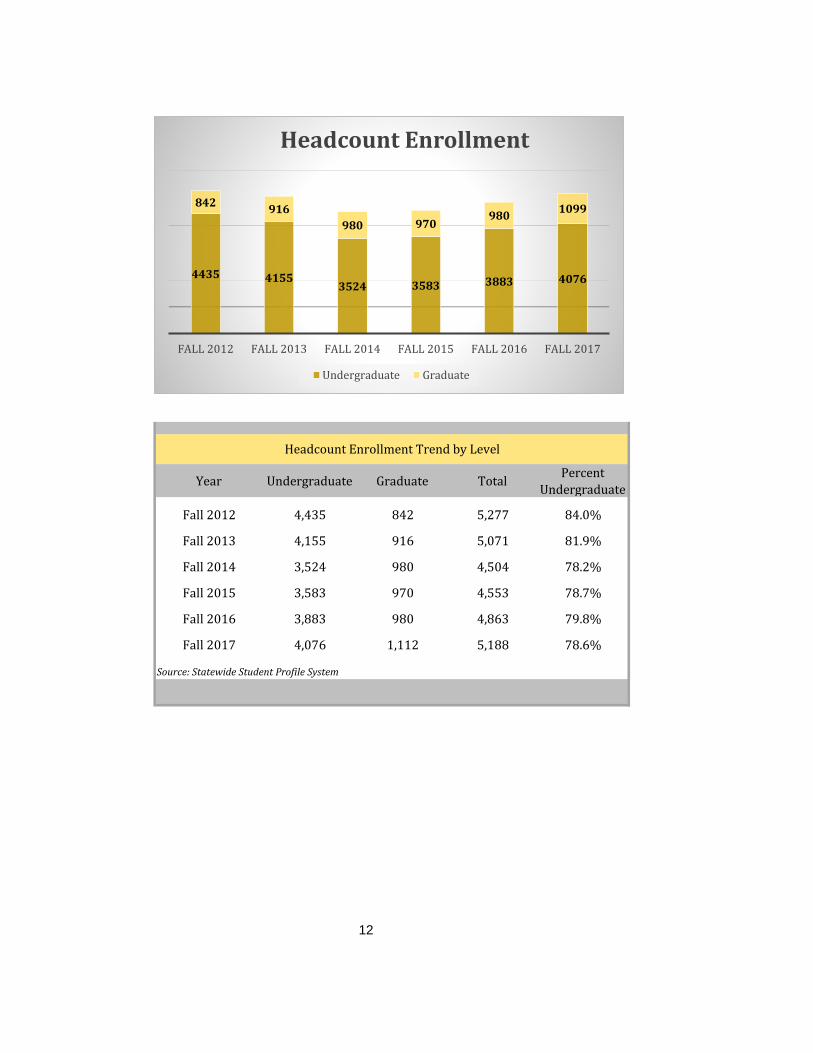
Year Undergraduate Graduate TotalPercent
Undergraduate
Fall 2012 4,435 842 5,277 84.0%
Fall 2013 4,155 916 5,071 81.9%
Fall 2014 3,524 980 4,504 78.2%
Fall 2015 3,583 970 4,553 78.7%
Fall 2016 3,883 980 4,863 79.8%
Fall 2017 4,076 1,112 5,188 78.6%
Source: Statewide Student Profile System
12
Headcount Enrollment Trend by Level
4435 41553524 3583 3883 4076
842916
980 970980
1099
FALL 2012 FALL 2013 FALL 2014 FALL 2015 FALL 2016 FALL 2017
Headcount Enrollment
Undergraduate Graduate
Black White Other
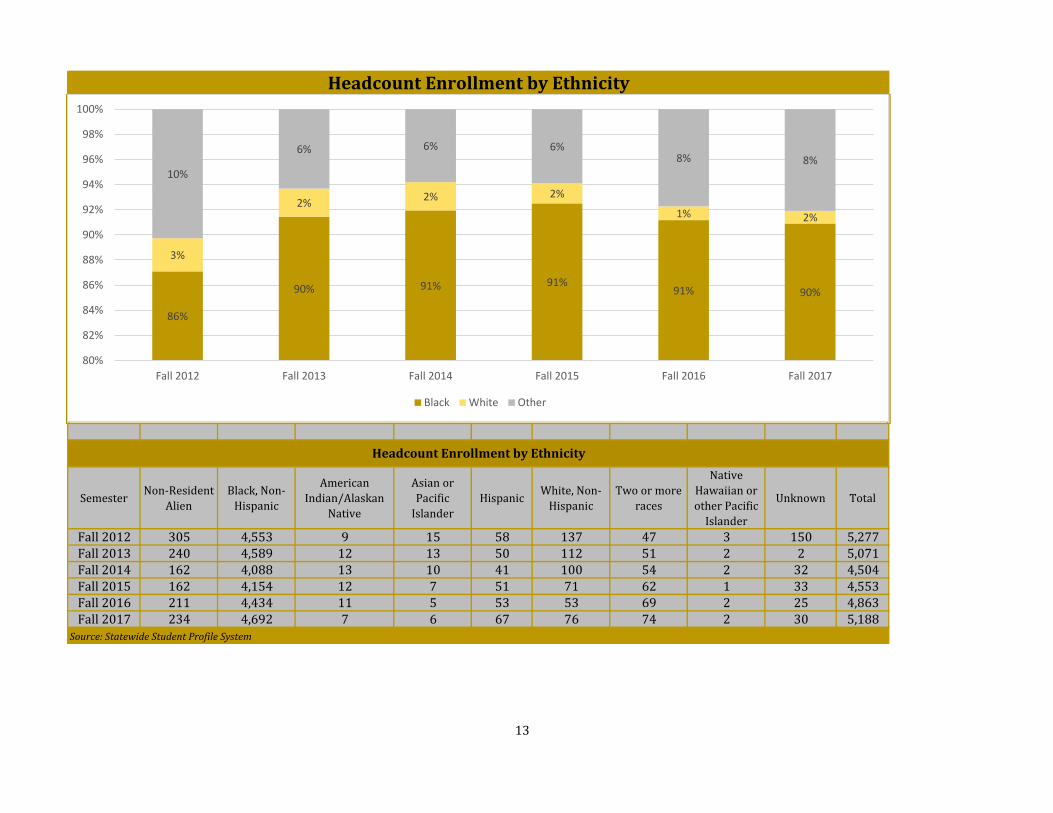
Fall 2012 86% 3% 10%
Fall 2013 90% 2% 6%
Fall 2014 91% 2% 6%
Fall 2015 91% 2% 6%
Fall 2016 91% 1% 8%
Fall 2017 90% 1% 8%
SemesterNon-Resident
Alien
Black, Non-
Hispanic
American
Indian/Alaskan
Native
Asian or
Pacific
Islander
HispanicWhite, Non-
Hispanic
Two or more
races
Native
Hawaiian or
other Pacific
Islander
Unknown Total
Fall 2012 305 4,553 9 15 58 137 47 3 150 5,277Fall 2013 240 4,589 12 13 50 112 51 2 2 5,071Fall 2014 162 4,088 13 10 41 100 54 2 32 4,504Fall 2015 162 4,154 12 7 51 71 62 1 33 4,553Fall 2016 211 4,434 11 5 53 53 69 2 25 4,863Fall 2017 234 4,692 7 6 67 76 74 2 30 5,188
Source: Statewide Student Profile System
13
Headcount Enrollment by Ethnicity
Headcount Enrollment by Ethnicity
86%
90% 91% 91%91% 90%
3%
2%2% 2%
1% 2%
10%
6% 6% 6%8% 8%
80%
82%
84%
86%
88%
90%
92%
94%
96%
98%
100%
Fall 2012 Fall 2013 Fall 2014 Fall 2015 Fall 2016 Fall 2017
Black White Other
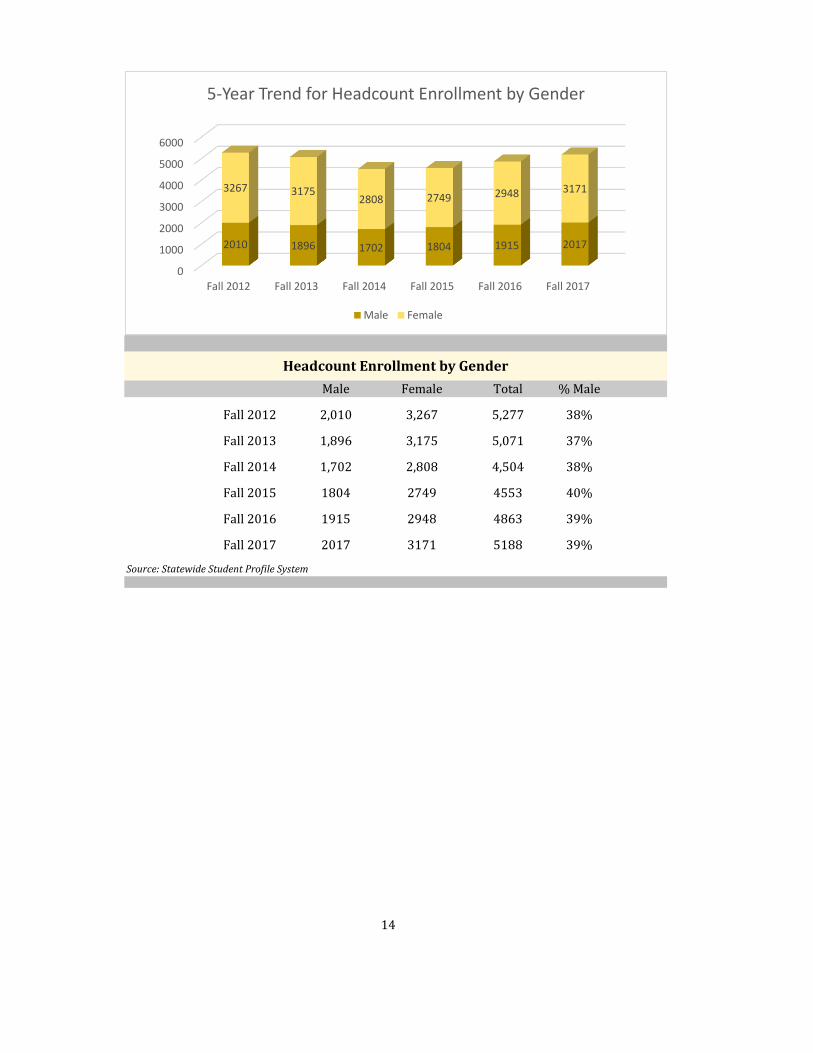
Male FemaleFall 2012 2010 3267Fall 2013 1896 3175Fall 2014 1702 2808Fall 2015 1804 2749Fall 2016 1915 2948Fall 2017 2017 3171
Male Female Total % Male
Fall 2012 2,010 3,267 5,277 38%
Fall 2013 1,896 3,175 5,071 37%
Fall 2014 1,702 2,808 4,504 38%
Fall 2015 1804 2749 4553 40%
Fall 2016 1915 2948 4863 39%
Fall 2017 2017 3171 5188 39%
Source: Statewide Student Profile System
14
Headcount Enrollment by Gender
0
1000
2000
3000
4000
5000
6000
Fall 2012 Fall 2013 Fall 2014 Fall 2015 Fall 2016 Fall 2017
2010 1896 1702 1804 1915 2017
3267 31752808 2749 2948 3171
5-Year Trend for Headcount Enrollment by Gender
Male Female
2013 2014 2015 2016Freshman 1356 1100 1140 1462
Sophomore 792 756 825 721
Junior 689 603 688 684
Senior 1287 1040 912 992
Graduate 916 980 970 980
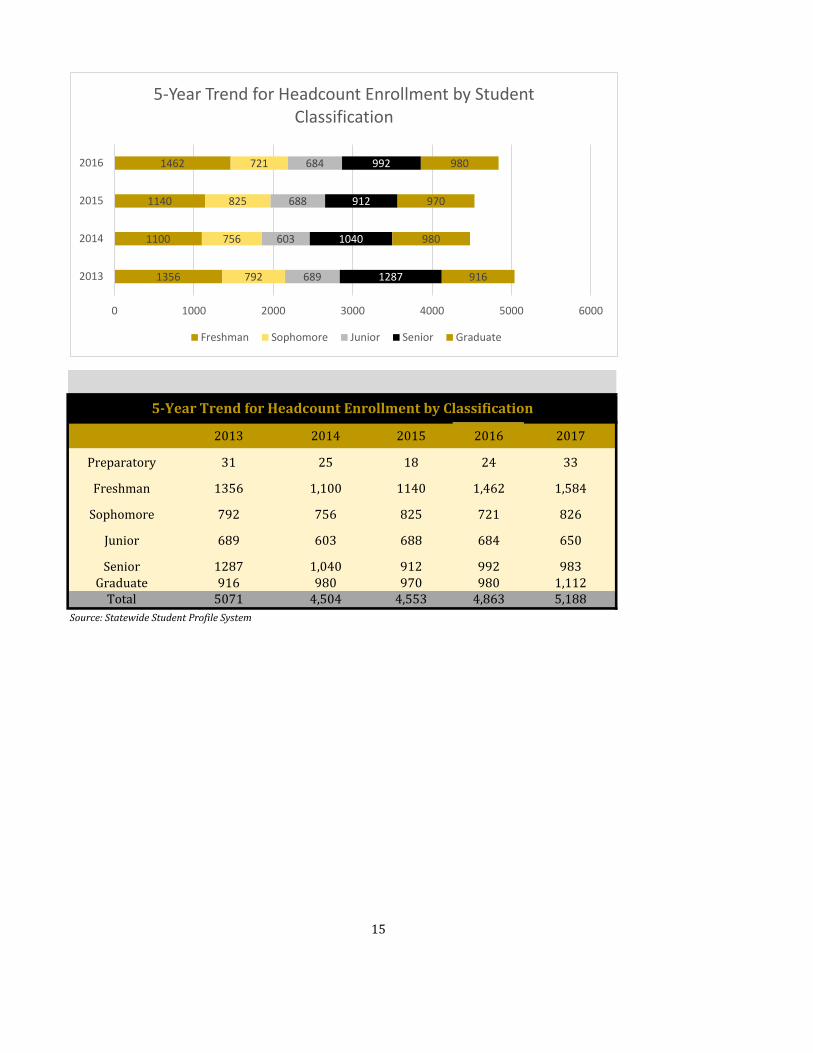
2013 2014 2015 2016 2017
Preparatory 31 25 18 24 33
Freshman 1356 1,100 1140 1,462 1,584
Sophomore 792 756 825 721 826
Junior 689 603 688 684 650
Senior 1287 1,040 912 992 983Graduate 916 980 970 980 1,112
Total 5071 4,504 4,553 4,863 5,188
Source: Statewide Student Profile System
15
5-Year Trend for Headcount Enrollment by Classification
1356
1100
1140
1462
792
756
825
721
689
603
688
684
1287
1040
912
992
916
980
970
980
0 1000 2000 3000 4000 5000 6000
2013
2014
2015
2016
5-Year Trend for Headcount Enrollment by Student Classification
Freshman Sophomore Junior Senior Graduate
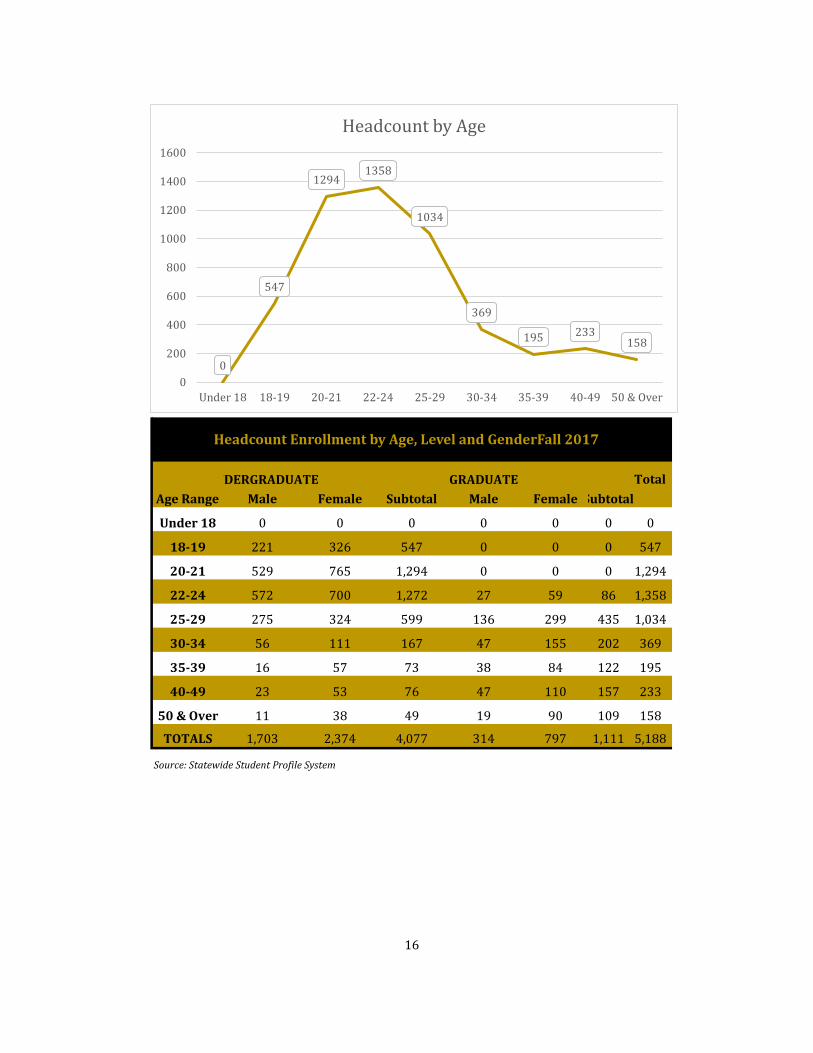
Under 18 018-19 54720-21 129422-24 135825-29 103430-34 36935-39 19540-49 233
50 & Over 158
UNDERGRADUATE GRADUATE Total
Male Female Subtotal Male Female Subtotal
Under 18 0 0 0 0 0 0 0
18-19 221 326 547 0 0 0 547
20-21 529 765 1,294 0 0 0 1,294
22-24 572 700 1,272 27 59 86 1,358
25-29 275 324 599 136 299 435 1,034
30-34 56 111 167 47 155 202 369
35-39 16 57 73 38 84 122 195
40-49 23 53 76 47 110 157 233
50 & Over 11 38 49 19 90 109 158
TOTALS 1,703 2,374 4,077 314 797 1,111 5,188
Source: Statewide Student Profile System
16
Age Range
Headcount Enrollment by Age, Level and GenderFall 2017
0
547
12941358
1034
369
195 233158
0
200
400
600
800
1000
1200
1400
1600
Under 18 18-19 20-21 22-24 25-29 30-34 35-39 40-49 50 & Over
Headcount by Age
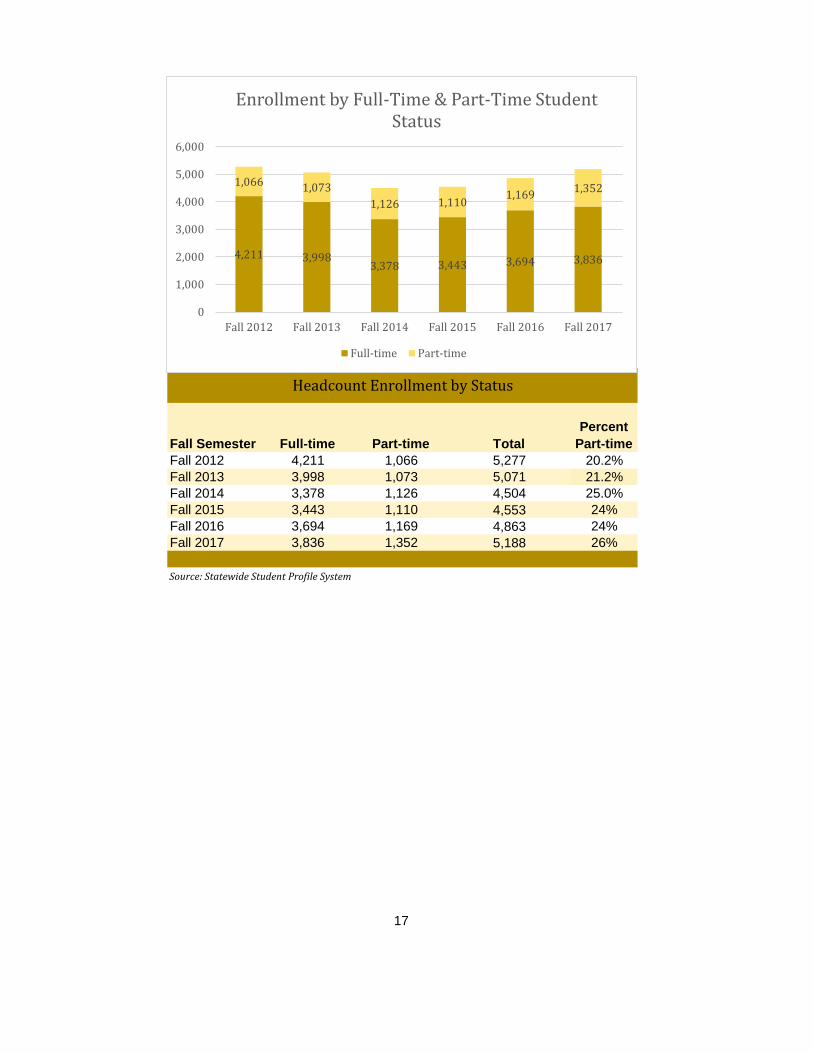
Fall Semester Full-time Part-time Total
Percent
Part-time
Fall 2012 4,211 1,066 5,277 20.2%
Fall 2013 3,998 1,073 5,071 21.2%
Fall 2014 3,378 1,126 4,504 25.0%
Fall 2015 3,443 1,110 4,553 24%
Fall 2016 3,694 1,169 4,863 24%
Fall 2017 3,836 1,352 5,188 26%
Source: Statewide Student Profile System
17
Headcount Enrollment by Status
4,211 3,9983,378 3,443 3,694 3,836
1,066 1,073
1,126 1,1101,169
1,352
0
1,000
2,000
3,000
4,000
5,000
6,000
Fall 2012 Fall 2013 Fall 2014 Fall 2015 Fall 2016 Fall 2017
Enrollment by Full-Time & Part-Time Student Status
Full-time Part-time
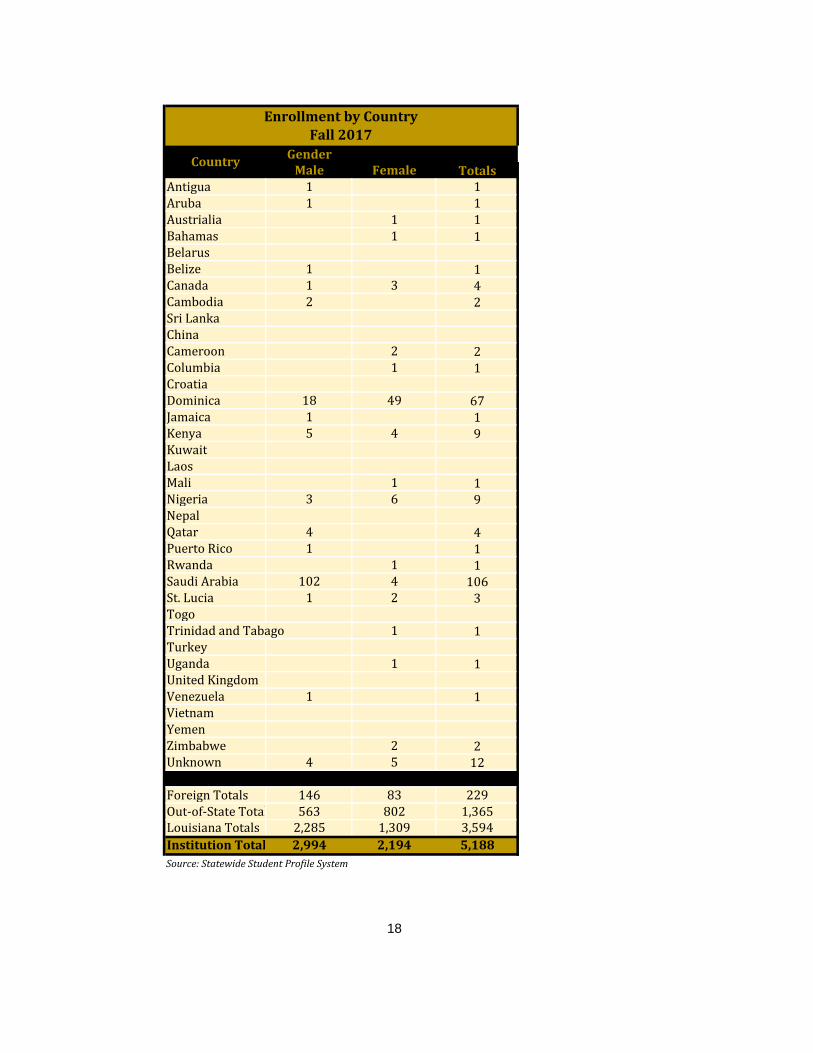
GenderMale Female Totals
AC Antigua 1 1Aruba 1 1
AS Austrialia 1 1BF Bahamas 1 1BO BelarusBH Belize 1 1CA Canada 1 3 4CB Cambodia 2 2CE Sri LankaCH ChinaCM Cameroon 2 2CO Columbia 1 1HR CroatiaDO Dominica 18 49 67JM Jamaica 1 1KE Kenya 5 4 9KU KuwaitLA LaosML Mali 1 1NI Nigeria 3 6 9
NepalQA Qatar 4 4RQ Puerto Rico 1 1RW Rwanda 1 1SA Saudi Arabia 102 4 106ST St. Lucia 1 2 3TO TogoTD Trinidad and Tabago 1 1TU TurkeyUG Uganda 1 1UK United KingdomVE Venezuela 1 1VM VietnamYM YemenZI Zimbabwe 2 2
Unknown 4 5 12
Foreign Totals 146 83 229Out-of-State Totals 563 802 1,365Louisiana Totals 2,285 1,309 3,594
Institution Totals 2,994 2,194 5,188
Source: Statewide Student Profile System
18
Country
Enrollment by CountryFall 2017
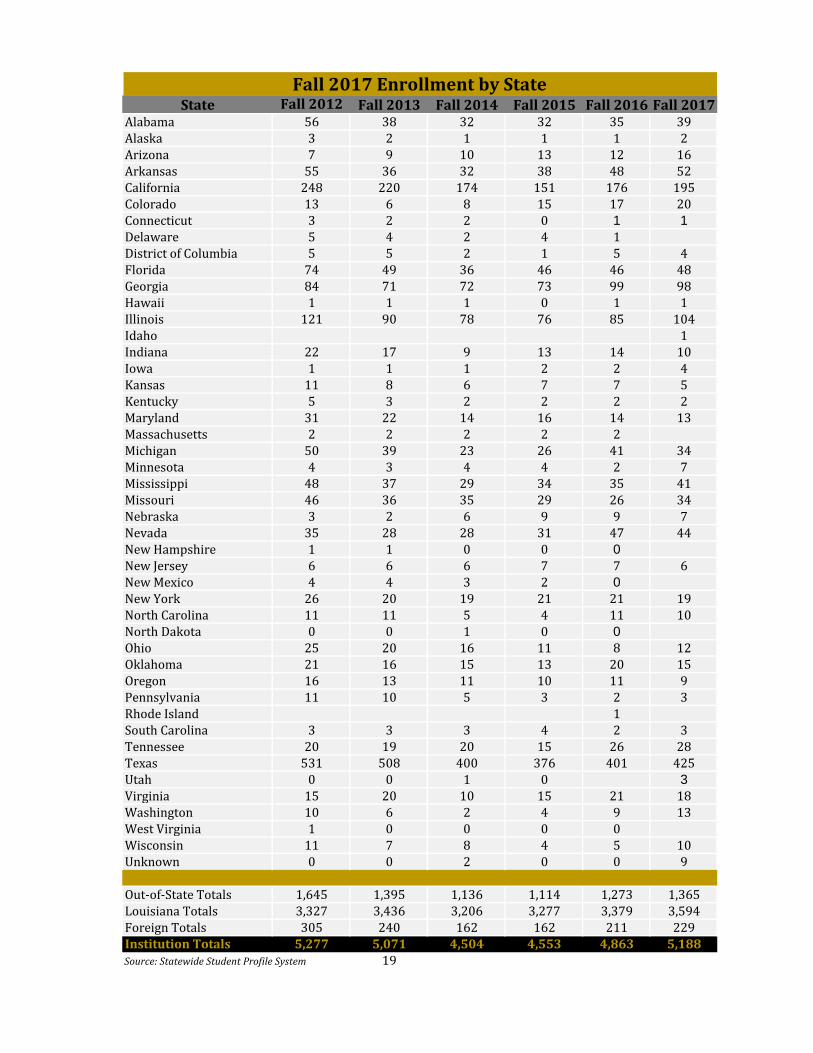
State Fall 2012 Fall 2013 Fall 2014 Fall 2015 Fall 2016 Fall 2017AL Alabama 56 38 32 32 35 39AK Alaska 3 2 1 1 1 2AZ Arizona 7 9 10 13 12 16AR Arkansas 55 36 32 38 48 52CA California 248 220 174 151 176 195CO Colorado 13 6 8 15 17 20CT Connecticut 3 2 2 0 1 1
DE Delaware 5 4 2 4 1DC District of Columbia 5 5 2 1 5 4FL Florida 74 49 36 46 46 48GA Georgia 84 71 72 73 99 98HI Hawaii 1 1 1 0 1 1IL Illinois 121 90 78 76 85 104
Idaho 1IN Indiana 22 17 9 13 14 10IA Iowa 1 1 1 2 2 4KS Kansas 11 8 6 7 7 5KY Kentucky 5 3 2 2 2 2MD Maryland 31 22 14 16 14 13MA Massachusetts 2 2 2 2 2MI Michigan 50 39 23 26 41 34MN Minnesota 4 3 4 4 2 7MS Mississippi 48 37 29 34 35 41MO Missouri 46 36 35 29 26 34NE Nebraska 3 2 6 9 9 7NV Nevada 35 28 28 31 47 44NH New Hampshire 1 1 0 0 0
NJ New Jersey 6 6 6 7 7 6NM New Mexico 4 4 3 2 0
NY New York 26 20 19 21 21 19NC North Carolina 11 11 5 4 11 10ND North Dakota 0 0 1 0 0
OH Ohio 25 20 16 11 8 12OK Oklahoma 21 16 15 13 20 15OR Oregon 16 13 11 10 11 9PA Pennsylvania 11 10 5 3 2 3RI Rhode Island 1SC South Carolina 3 3 3 4 2 3TN Tennessee 20 19 20 15 26 28TX Texas 531 508 400 376 401 425UT Utah 0 0 1 0 3
VA Virginia 15 20 10 15 21 18WA Washington 10 6 2 4 9 13WV West Virginia 1 0 0 0 0WI Wisconsin 11 7 8 4 5 10
Unknown 0 0 2 0 0 9
Out-of-State Totals 1,645 1,395 1,136 1,114 1,273 1,365Louisiana Totals 3,327 3,436 3,206 3,277 3,379 3,594Foreign Totals 305 240 162 162 211 229Institution Totals 5,277 5,071 4,504 4,553 4,863 5,188Source: Statewide Student Profile System 19
Fall 2017 Enrollment by State
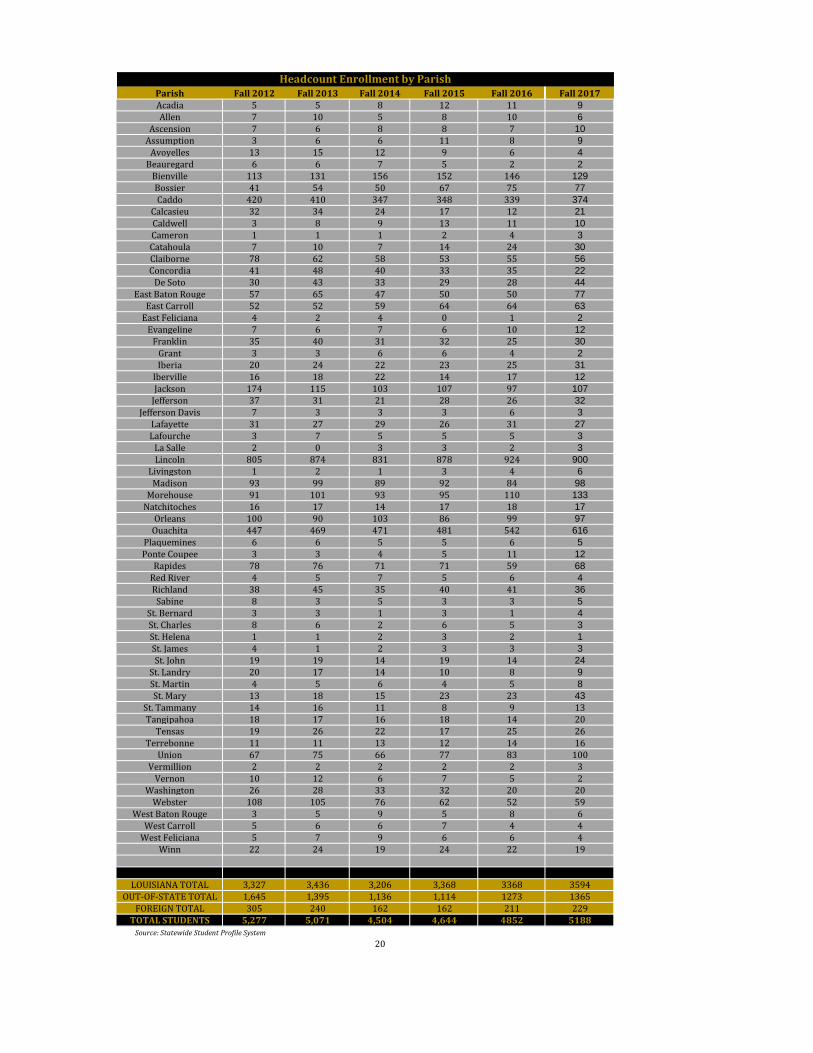
Parish Fall 2012 Fall 2013 Fall 2014 Fall 2015 Fall 2016 Fall 20171 Acadia 5 5 8 12 11 9
2 Allen 7 10 5 8 10 6
3 Ascension 7 6 8 8 7 10
4 Assumption 3 6 6 11 8 9
5 Avoyelles 13 15 12 9 6 4
6 Beauregard 6 6 7 5 2 2
7 Bienville 113 131 156 152 146 129
8 Bossier 41 54 50 67 75 77
9 Caddo 420 410 347 348 339 374
10 Calcasieu 32 34 24 17 12 21
11 Caldwell 3 8 9 13 11 10
12 Cameron 1 1 1 2 4 3
13 Catahoula 7 10 7 14 24 30
14 Claiborne 78 62 58 53 55 56
15 Concordia 41 48 40 33 35 22
16 De Soto 30 43 33 29 28 44
17 East Baton Rouge 57 65 47 50 50 77
18 East Carroll 52 52 59 64 64 63
19 East Feliciana 4 2 4 0 1 2
20 Evangeline 7 6 7 6 10 12
21 Franklin 35 40 31 32 25 30
22 Grant 3 3 6 6 4 2
23 Iberia 20 24 22 23 25 31
24 Iberville 16 18 22 14 17 12
25 Jackson 174 115 103 107 97 107
26 Jefferson 37 31 21 28 26 32
27 Jefferson Davis 7 3 3 3 6 3
28 Lafayette 31 27 29 26 31 27
29 Lafourche 3 7 5 5 5 3
30 La Salle 2 0 3 3 2 3
31 Lincoln 805 874 831 878 924 900
32 Livingston 1 2 1 3 4 6
33 Madison 93 99 89 92 84 98
34 Morehouse 91 101 93 95 110 133
35 Natchitoches 16 17 14 17 18 17
36 Orleans 100 90 103 86 99 97
37 Ouachita 447 469 471 481 542 616
38 Plaquemines 6 6 5 5 6 5
39 Ponte Coupee 3 3 4 5 11 12
40 Rapides 78 76 71 71 59 68
41 Red River 4 5 7 5 6 4
42 Richland 38 45 35 40 41 36
43 Sabine 8 3 5 3 3 5
44 St. Bernard 3 3 1 3 1 4
45 St. Charles 8 6 2 6 5 3
46 St. Helena 1 1 2 3 2 1
47 St. James 4 1 2 3 3 3
48 St. John 19 19 14 19 14 24
49 St. Landry 20 17 14 10 8 9
50 St. Martin 4 5 6 4 5 8
51 St. Mary 13 18 15 23 23 43
52 St. Tammany 14 16 11 8 9 1353 Tangipahoa 18 17 16 18 14 2054 Tensas 19 26 22 17 25 2655 Terrebonne 11 11 13 12 14 1656 Union 67 75 66 77 83 10057 Vermillion 2 2 2 2 2 358 Vernon 10 12 6 7 5 259 Washington 26 28 33 32 20 2060 Webster 108 105 76 62 52 5961 West Baton Rouge 3 5 9 5 8 662 West Carroll 5 6 6 7 4 463 West Feliciana 5 7 9 6 6 464 Winn 22 24 19 24 22 19
LOUISIANA TOTAL 3,327 3,436 3,206 3,368 3368 3594OUT-OF-STATE TOTAL 1,645 1,395 1,136 1,114 1273 1365
FOREIGN TOTAL 305 240 162 162 211 229TOTAL STUDENTS 5,277 5,071 4,504 4,644 4852 5188
20Source: Statewide Student Profile System
Headcount Enrollment by Parish
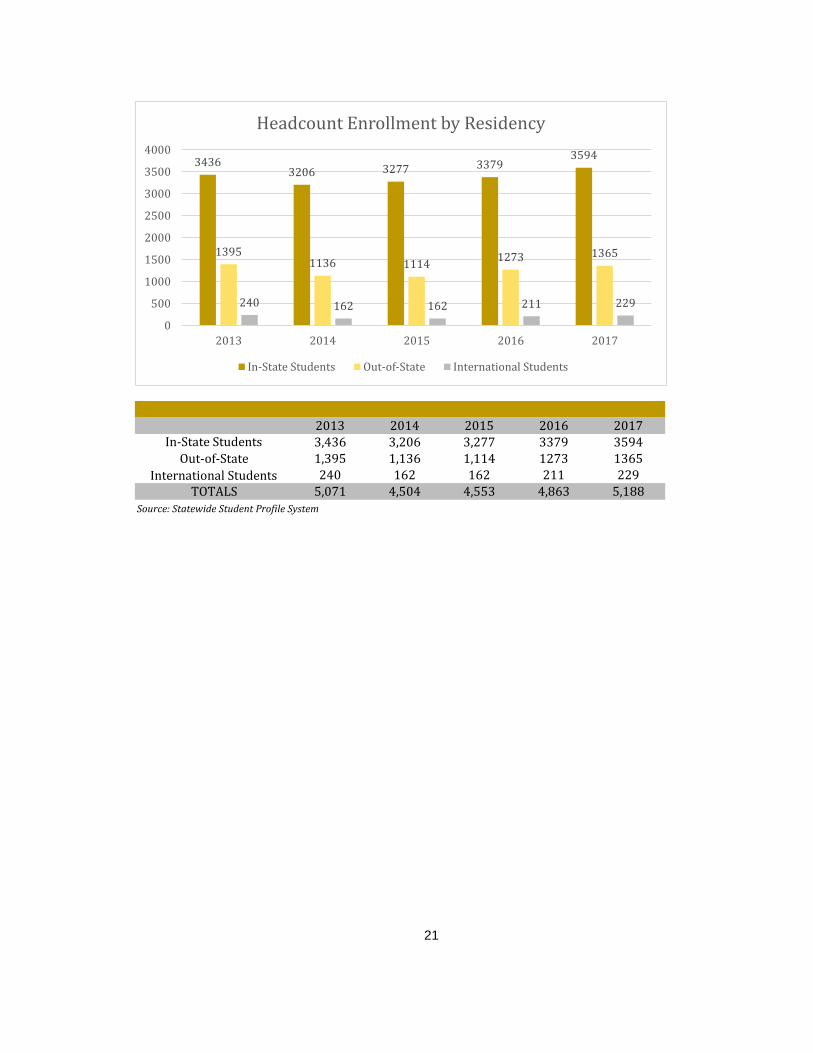
2013 2014 2015 2016 2017
In-State Students 3436 3206 3277 3379 3594
Out-of-State 1395 1136 1114 1273 1365
International Students 240 162 162 211 229
2013 2014 2015 2016 2017In-State Students 3,436 3,206 3,277 3379 3594
Out-of-State 1,395 1,136 1,114 1273 1365
International Students 240 162 162 211 229TOTALS 5,071 4,504 4,553 4,863 5,188
Source: Statewide Student Profile System
21
Headcount Enrollment by Residency
34363206 3277 3379
3594
13951136 1114
1273 1365
240 162 162 211 229
0
500
1000
1500
2000
2500
3000
3500
4000
2013 2014 2015 2016 2017
Headcount Enrollment by Residency
In-State Students Out-of-State International Students
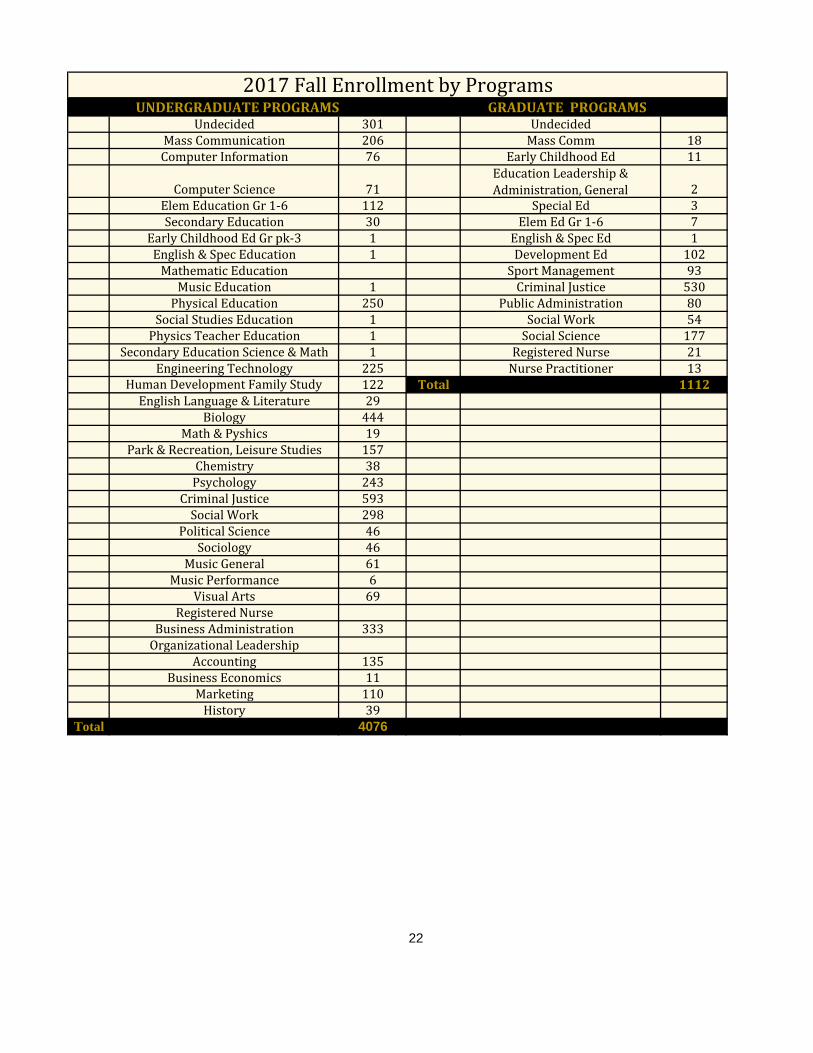
000000 Undecided 301 000000 Undecided090102 Mass Communication 206 090102 Mass Comm 18110401 Computer Information 76 130301 Early Childhood Ed 11
110701 Computer Science 71 130401Education Leadership &
Administration, General 2131202 Elem Education Gr 1-6 112 131001 Special Ed 3131205 Secondary Education 30 131202 Elem Ed Gr 1-6 7131210 Early Childhood Ed Gr pk-3 1 131205 English & Spec Ed 1131305 English & Spec Education 1 139999 Development Ed 102131311 Mathematic Education 310504 Sport Management 93131312 Music Education 1 430104 Criminal Justice 530131314 Physical Education 250 440401 Public Administration 80131318 Social Studies Education 1 440701 Social Work 54131329 Physics Teacher Education 1 450101 Social Science 177
Secondary Education Science & Math 1 513801 Registered Nurse 21150000 Engineering Technology 225 513805 Nurse Practitioner 13190799 Human Development Family Study 122 Total 1112230101 English Language & Literature 29260101 Biology 444270199 Math & Pyshics 19310101 Park & Recreation, Leisure Studies 157400501 Chemistry 38420101 Psychology 243430104 Criminal Justice 593440701 Social Work 298451001 Political Science 46451101 Sociology 46500901 Music General 61500903 Music Performance 6509999 Visual Arts 69513801 Registered Nurse520201 Business Administration 333520213 Organizational Leadership520301 Accounting 135520601 Business Economics 11521401 Marketing 110540101 History 39
Total 4076
22
UNDERGRADUATE PROGRAMS GRADUATE PROGRAMS
2017 Fall Enrollment by Programs
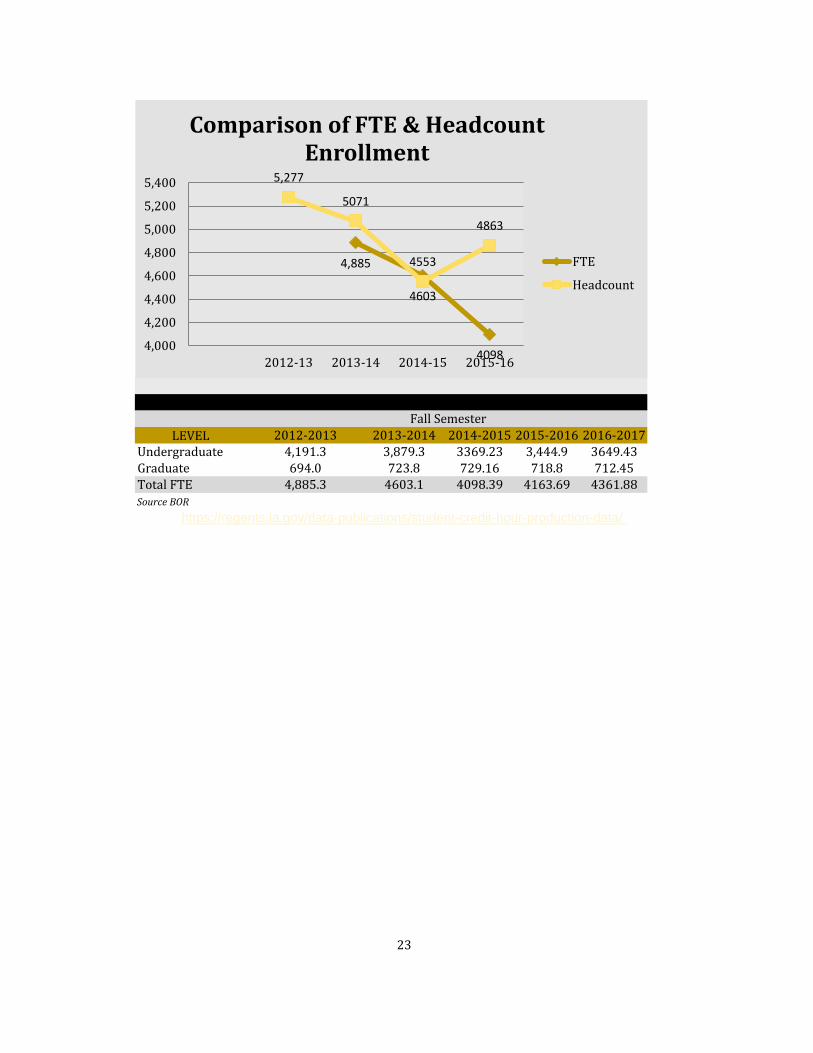
FTE Headcount2007-08
2012-13 4,885 5,2772013-14 4603 50712014-15 4098 45532015-16 4163 48632016-17 4361
LEVEL 2012-2013 2013-2014 2014-2015 2015-2016 2016-2017Undergraduate 4,191.3 3,879.3 3369.23 3,444.9 3649.43Graduate 694.0 723.8 729.16 718.8 712.45Total FTE 4,885.3 4603.1 4098.39 4163.69 4361.88Source BOR
https://regents.la.gov/data-publications/student-credit-hour-production-data/
23
Full-time Equivalent Enrollment (FTE)Fall Semester
4,885
4603
4098
5,277
5071
4553
4863
4,000
4,200
4,400
4,600
4,800
5,000
5,200
5,400
2012-13 2013-14 2014-15 2015-16
Comparison of FTE & Headcount Enrollment
FTE
Headcount
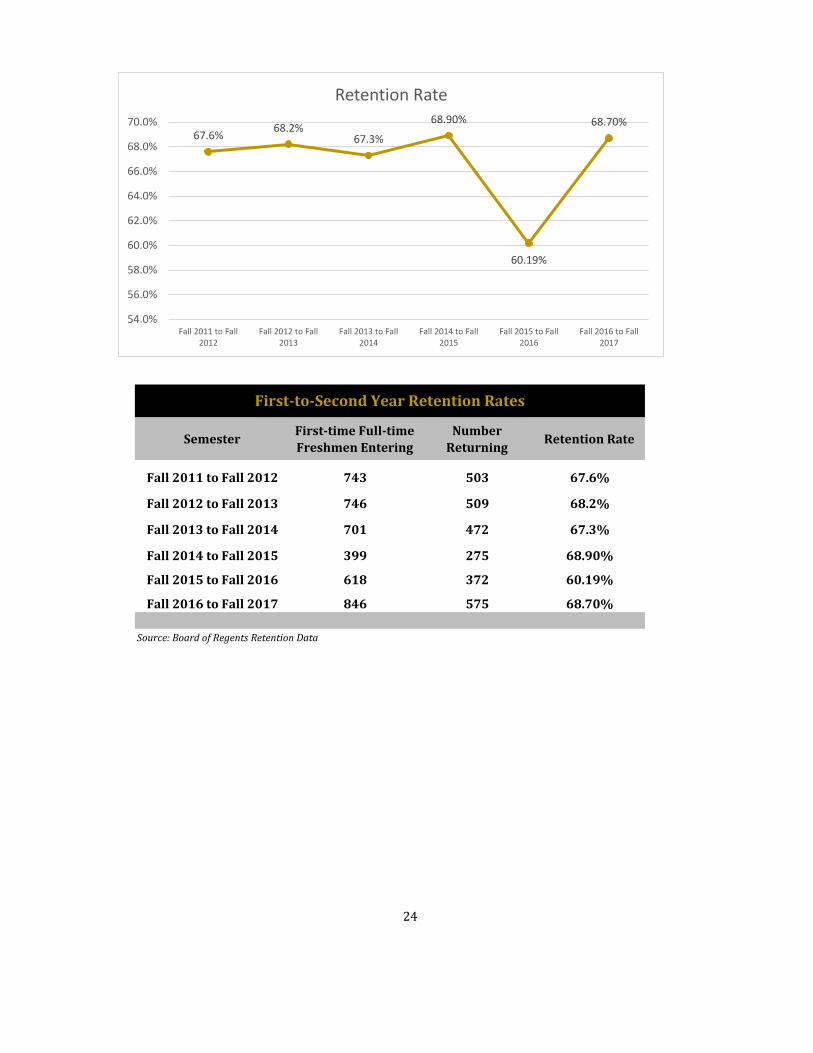
Year Retention Rate2011-12 67.6%2012-13 68.2%2013-14 67.3%2014-15 68.90%2015-16 60%
2016-2017 68.0%
SemesterFirst-time Full-time
Freshmen Entering
Number
ReturningRetention Rate
Fall 2011 to Fall 2012 743 503 67.6%
Fall 2012 to Fall 2013 746 509 68.2%
Fall 2013 to Fall 2014 701 472 67.3%
Fall 2014 to Fall 2015 399 275 68.90%
Fall 2015 to Fall 2016 618 372 60.19%
Fall 2016 to Fall 2017 846 575 68.70%
Source: Board of Regents Retention Data
24
First-to-Second Year Retention Rates
67.6%68.2%
67.3%
68.90%
60.19%
68.70%
54.0%
56.0%
58.0%
60.0%
62.0%
64.0%
66.0%
68.0%
70.0%
Fall 2011 to Fall2012
Fall 2012 to Fall2013
Fall 2013 to Fall2014
Fall 2014 to Fall2015
Fall 2015 to Fall2016
Fall 2016 to Fall2017
Retention Rate
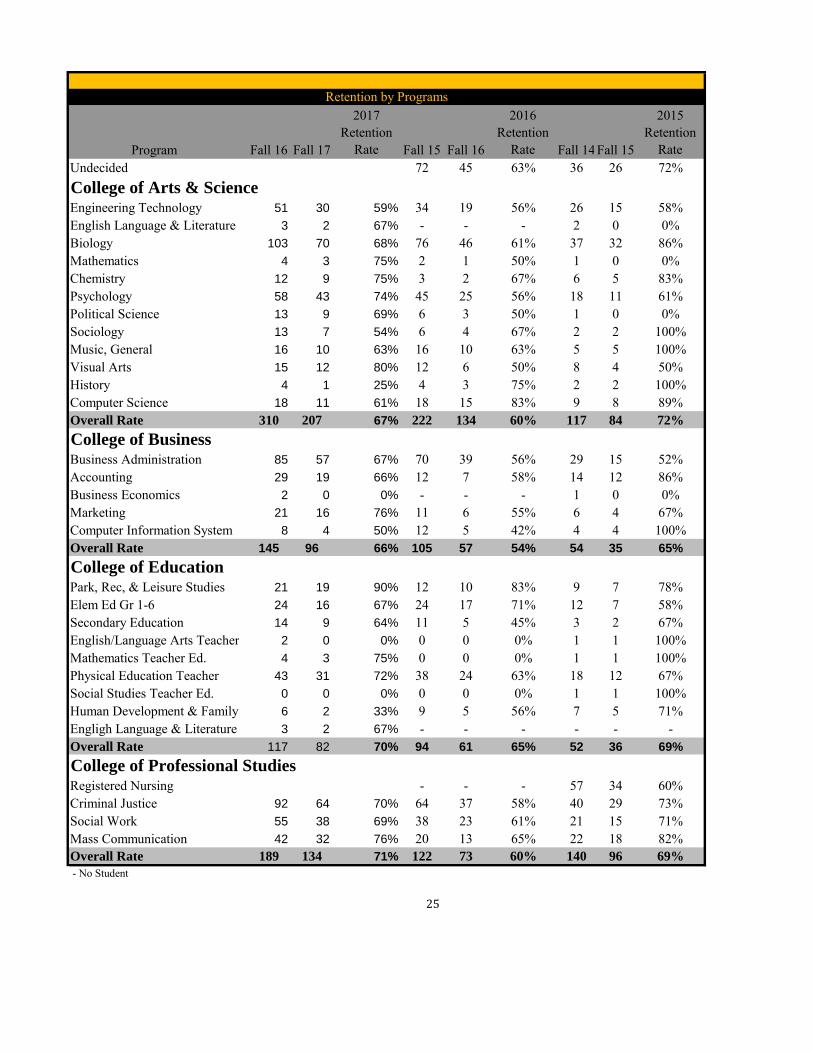
Program CIP CodeFall 16 Fall 17
2017 Retention
Rate Fall 15 Fall 16
2016 Retention
Rate Fall 14Fall 15
2015 Retention
RateUndecided 72 45 63% 36 26 72%College of Arts & ScienceEngineering Technology 51 30 59% 34 19 56% 26 15 58%English Language & Literature 3 2 67% - - - 2 0 0%Biology 103 70 68% 76 46 61% 37 32 86%Mathematics 4 3 75% 2 1 50% 1 0 0%Chemistry 12 9 75% 3 2 67% 6 5 83%Psychology 58 43 74% 45 25 56% 18 11 61%Political Science 13 9 69% 6 3 50% 1 0 0%Sociology 13 7 54% 6 4 67% 2 2 100%Music, General 16 10 63% 16 10 63% 5 5 100%Visual Arts 15 12 80% 12 6 50% 8 4 50%History 4 1 25% 4 3 75% 2 2 100%Computer Science 18 11 61% 18 15 83% 9 8 89%Overall Rate 310 207 67% 222 134 60% 117 84 72%
College of BusinessBusiness Administration 85 57 67% 70 39 56% 29 15 52%Accounting 29 19 66% 12 7 58% 14 12 86%Business Economics 2 0 0% - - - 1 0 0%Marketing 21 16 76% 11 6 55% 6 4 67%Computer Information System 8 4 50% 12 5 42% 4 4 100%Overall Rate 145 96 66% 105 57 54% 54 35 65%
College of EducationPark, Rec, & Leisure Studies 21 19 90% 12 10 83% 9 7 78%Elem Ed Gr 1-6 24 16 67% 24 17 71% 12 7 58%Secondary Education 14 9 64% 11 5 45% 3 2 67%English/Language Arts Teacher Ed. 2 0 0% 0 0 0% 1 1 100%Mathematics Teacher Ed. 4 3 75% 0 0 0% 1 1 100%Physical Education Teacher 43 31 72% 38 24 63% 18 12 67%Social Studies Teacher Ed. 0 0 0% 0 0 0% 1 1 100%Human Development & Family Studies6 2 33% 9 5 56% 7 5 71%Engligh Language & Literature 3 2 67% - - - - - -Overall Rate 117 82 70% 94 61 65% 52 36 69%
College of Professional StudiesRegistered Nursing - - - 57 34 60%Criminal Justice 92 64 70% 64 37 58% 40 29 73%Social Work 55 38 69% 38 23 61% 21 15 71%Mass Communication 42 32 76% 20 13 65% 22 18 82%Overall Rate 189 134 71% 122 73 60% 140 96 69%
- No Student
25
Retention by Programs
Rate
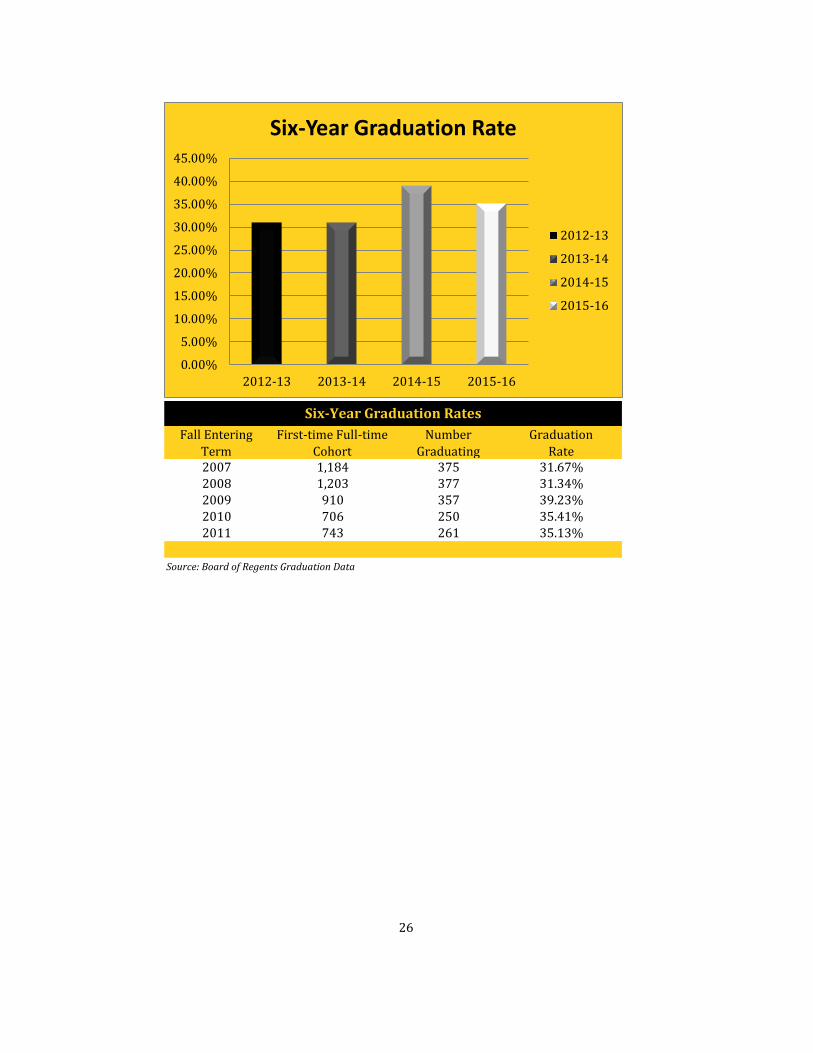
2011-12 31.00%2012-13 31.00%2013-14 31.00%2014-15 39.00%2015-16 35.14%
Fall Entering
Term
First-time Full-time
Cohort
Number
Graduating
Graduation
Rate2007 1,184 375 31.67%2008 1,203 377 31.34%2009 910 357 39.23%2010 706 250 35.41%2011 743 261 35.13%
Source: Board of Regents Graduation Data
26
Six-Year Graduation Rates
0.00%
5.00%
10.00%
15.00%
20.00%
25.00%
30.00%
35.00%
40.00%
45.00%
2012-13 2013-14 2014-15 2015-16
Six-Year Graduation Rate
2012-13
2013-14
2014-15
2015-16
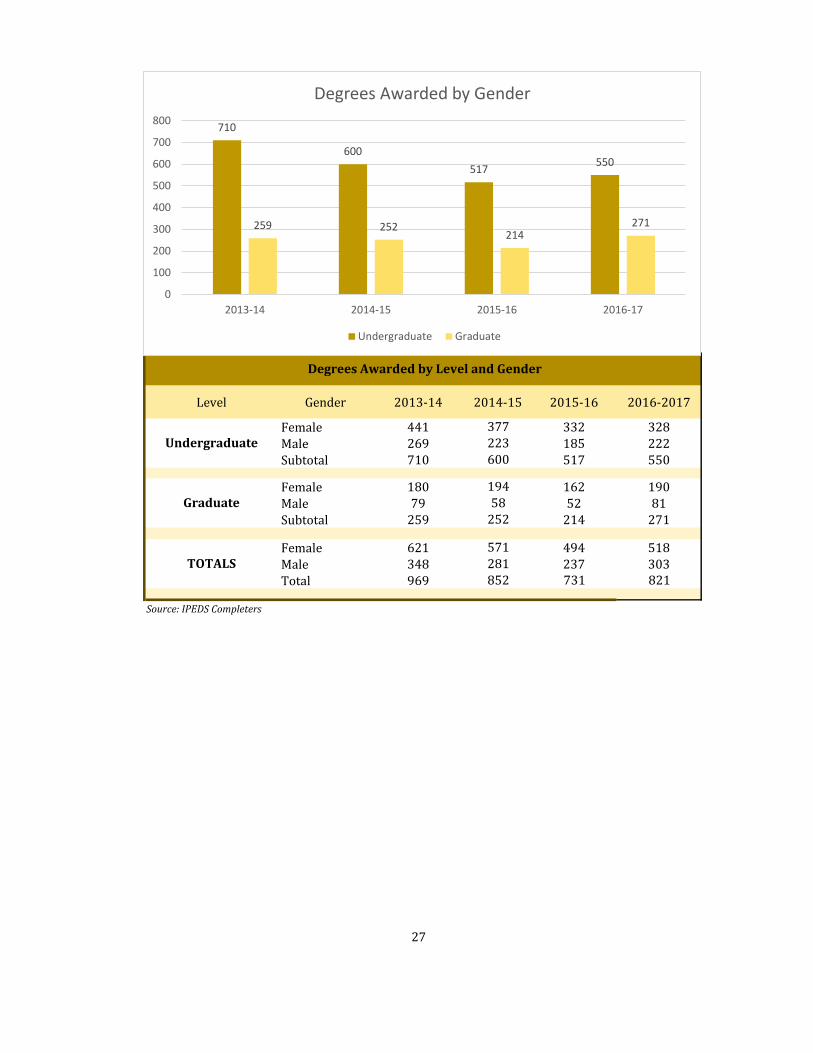
Undergraduate Graduate2013-14 710 2592014-15 600 2522015-16 517 2142016-17 550 271
Level Gender 2013-14 2014-15 2015-16 2016-2017
Female 441 377 332 328
Male 269 223 185 222
Subtotal 710 600 517 550
Female 180 194 162 190
Male 79 58 52 81
Subtotal 259 252 214 271
Female 621 571 494 518
Male 348 281 237 303
Total 969 852 731 821
Source: IPEDS Completers
27
Undergraduate
Graduate
TOTALS
Degrees Awarded by Level and Gender
710
600
517550
259 252214
271
0
100
200
300
400
500
600
700
800
2013-14 2014-15 2015-16 2016-17
Degrees Awarded by Gender
Undergraduate Graduate
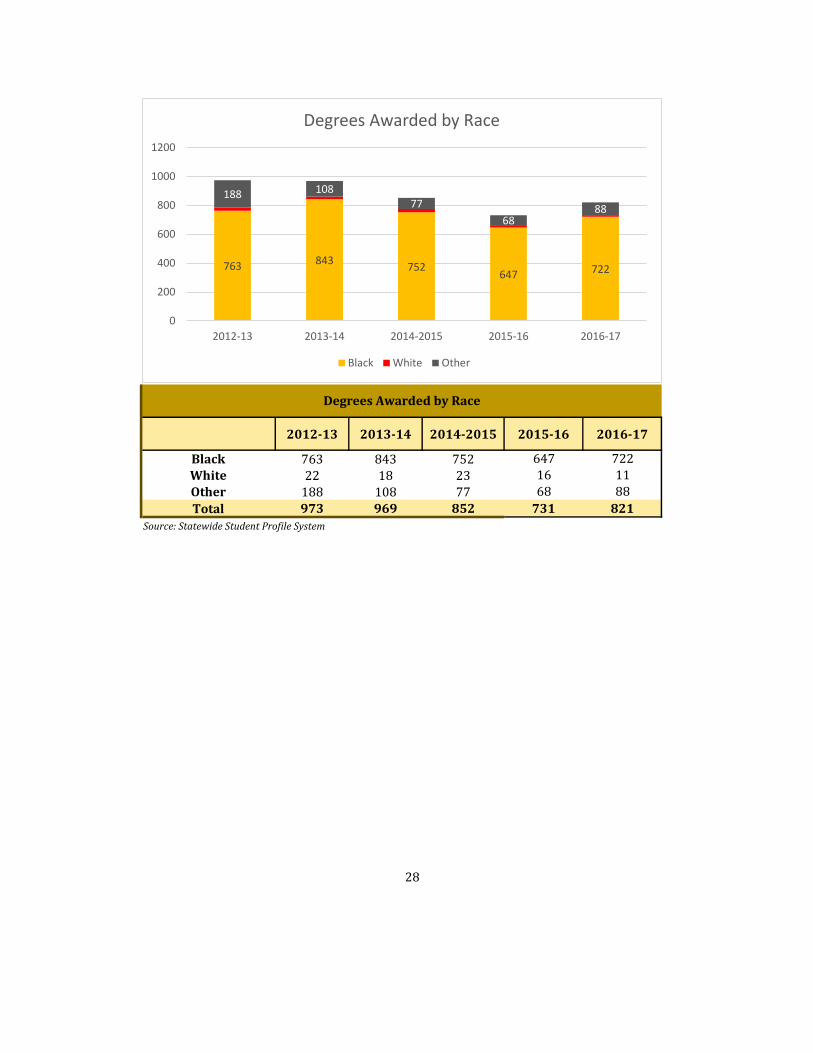
2012-13 2013-14 2014-2015 2015-16 2016-17
Black 763 843 752 647 722
White 22 18 23 16 11
Other 188 108 77 68 88
Total 973 969 852 731 821
Source: Statewide Student Profile System
28
Degrees Awarded by Race
763 843752
647 722
188 10877
6888
0
200
400
600
800
1000
1200
2012-13 2013-14 2014-2015 2015-16 2016-17
Degrees Awarded by Race
Black White Other
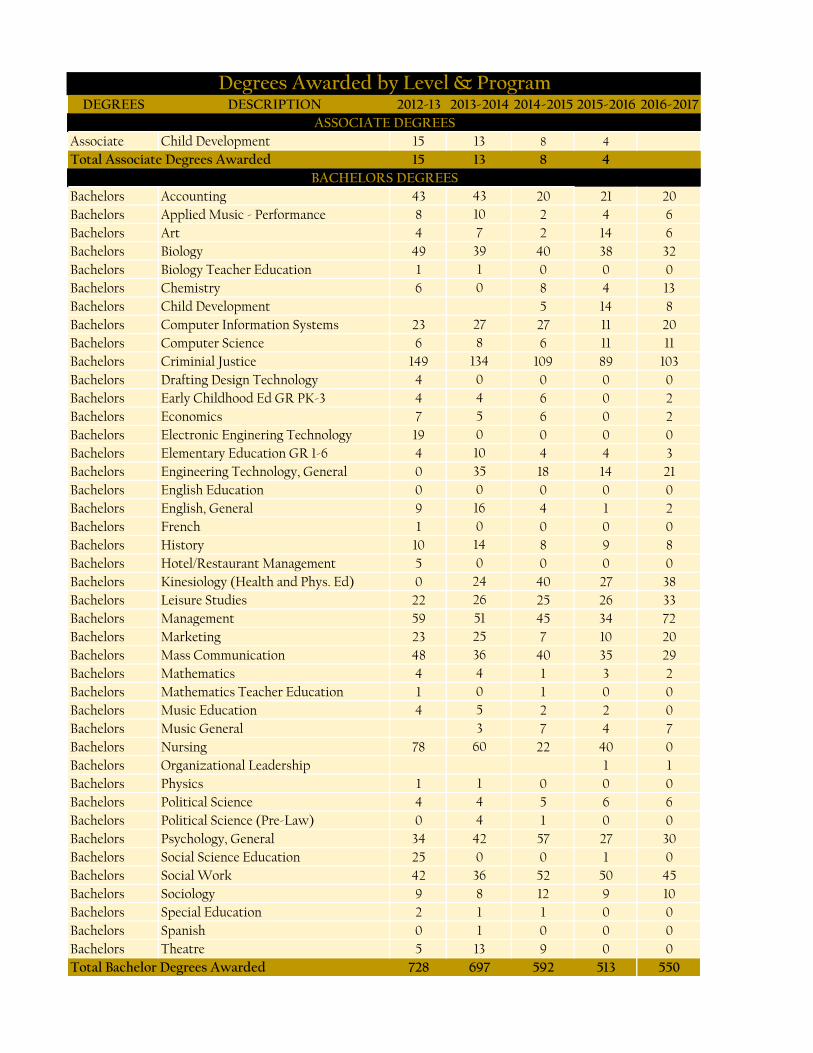
DEGREES DESCRIPTION 2012-13 2013-2014 2014-2015 2015-2016 2016-2017
Associate Child Development 15 13 8 4
15 13 8 4
Bachelors Accounting 43 43 20 21 20
Bachelors Applied Music - Performance 8 10 2 4 6
Bachelors Art 4 7 2 14 6
Bachelors Biology 49 39 40 38 32
Bachelors Biology Teacher Education 1 1 0 0 0
Bachelors Chemistry 6 0 8 4 13
Bachelors Child Development 5 14 8
Bachelors Computer Information Systems 23 27 27 11 20
Bachelors Computer Science 6 8 6 11 11
Bachelors Criminial Justice 149 134 109 89 103
Bachelors Drafting Design Technology 4 0 0 0 0
Bachelors Early Childhood Ed GR PK-3 4 4 6 0 2
Bachelors Economics 7 5 6 0 2
Bachelors Electronic Enginering Technology 19 0 0 0 0
Bachelors Elementary Education GR 1-6 4 10 4 4 3
Bachelors Engineering Technology, General 0 35 18 14 21
Bachelors English Education 0 0 0 0 0
Bachelors English, General 9 16 4 1 2
Bachelors French 1 0 0 0 0
Bachelors History 10 14 8 9 8
Bachelors Hotel/Restaurant Management 5 0 0 0 0
Bachelors Kinesiology (Health and Phys. Ed) 0 24 40 27 38
Bachelors Leisure Studies 22 26 25 26 33
Bachelors Management 59 51 45 34 72
Bachelors Marketing 23 25 7 10 20
Bachelors Mass Communication 48 36 40 35 29
Bachelors Mathematics 4 4 1 3 2
Bachelors Mathematics Teacher Education 1 0 1 0 0
Bachelors Music Education 4 5 2 2 0
Bachelors Music General 3 7 4 7
Bachelors Nursing 78 60 22 40 0
Bachelors Organizational Leadership 1 1
Bachelors Physics 1 1 0 0 0
Bachelors Political Science 4 4 5 6 6
Bachelors Political Science (Pre-Law) 0 4 1 0 0
Bachelors Psychology, General 34 42 57 27 30
Bachelors Social Science Education 25 0 0 1 0
Bachelors Social Work 42 36 52 50 45
Bachelors Sociology 9 8 12 9 10
Bachelors Special Education 2 1 1 0 0
Bachelors Spanish 0 1 0 0 0
Bachelors Theatre 5 13 9 0 0
728 697 592 513 550
Total Associate Degrees Awarded
Total Bachelor Degrees Awarded
Degrees Awarded by Level & Program
ASSOCIATE DEGREES
BACHELORS DEGREES
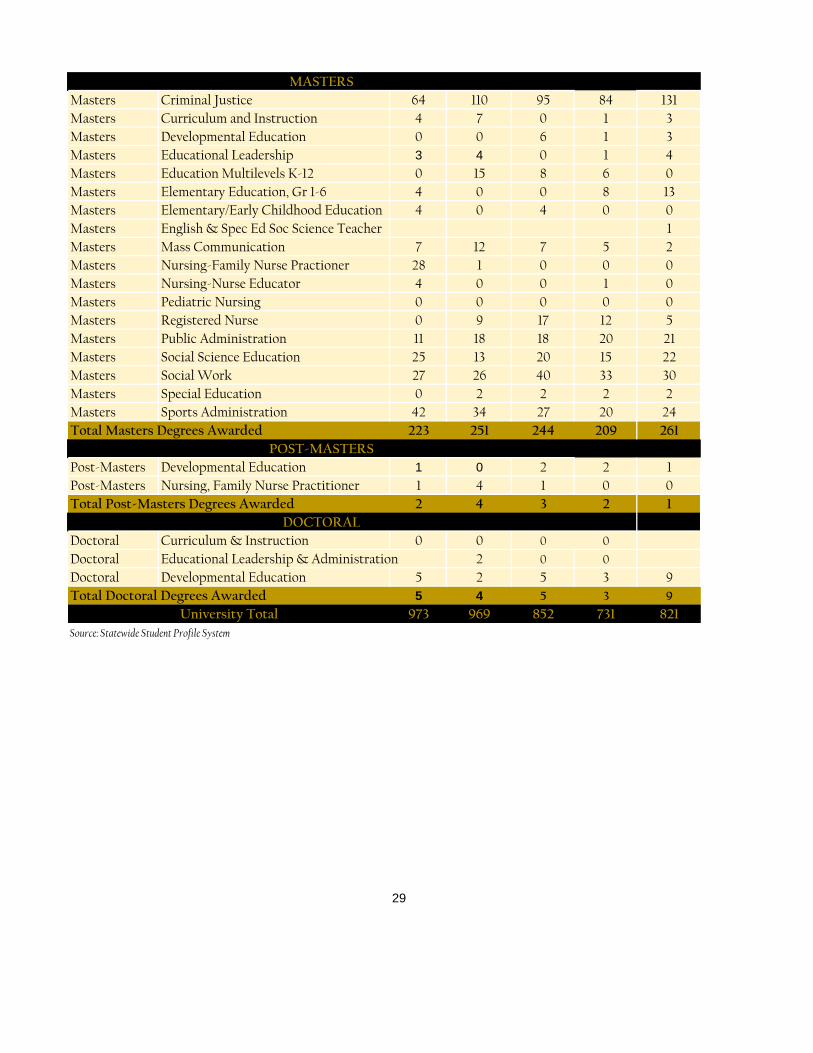
Masters Criminal Justice 64 110 95 84 131
Masters Curriculum and Instruction 4 7 0 1 3
Masters Developmental Education 0 0 6 1 3
Masters Educational Leadership 3 4 0 1 4
Masters Education Multilevels K-12 0 15 8 6 0
Masters Elementary Education, Gr 1-6 4 0 0 8 13
Masters Elementary/Early Childhood Education 4 0 4 0 0
Masters English & Spec Ed Soc Science Teacher 1
Masters Mass Communication 7 12 7 5 2
Masters Nursing-Family Nurse Practioner 28 1 0 0 0
Masters Nursing-Nurse Educator 4 0 0 1 0
Masters Pediatric Nursing 0 0 0 0 0
Masters Registered Nurse 0 9 17 12 5
Masters Public Administration 11 18 18 20 21
Masters Social Science Education 25 13 20 15 22
Masters Social Work 27 26 40 33 30
Masters Special Education 0 2 2 2 2
Masters Sports Administration 42 34 27 20 24
223 251 244 209 261
Post-Masters Developmental Education 1 0 2 2 1
Post-Masters Nursing, Family Nurse Practitioner 1 4 1 0 0
2 4 3 2 1
Doctoral Curriculum & Instruction 0 0 0 0
Doctoral Educational Leadership & Administration 2 0 0
Doctoral Developmental Education 5 2 5 3 9
5 4 5 3 9
973 969 852 731 821
Source: Statewide Student Profile System
29
Total Masters Degrees Awarded
Total Post-Masters Degrees Awarded
Total Doctoral Degrees Awarded
University Total
POST-MASTERS
DOCTORAL
MASTERS

GSU Section III:
A. Employee B. Financial C. Facilities
Male Female
105 114
100 94
95 100
94 106
101 95
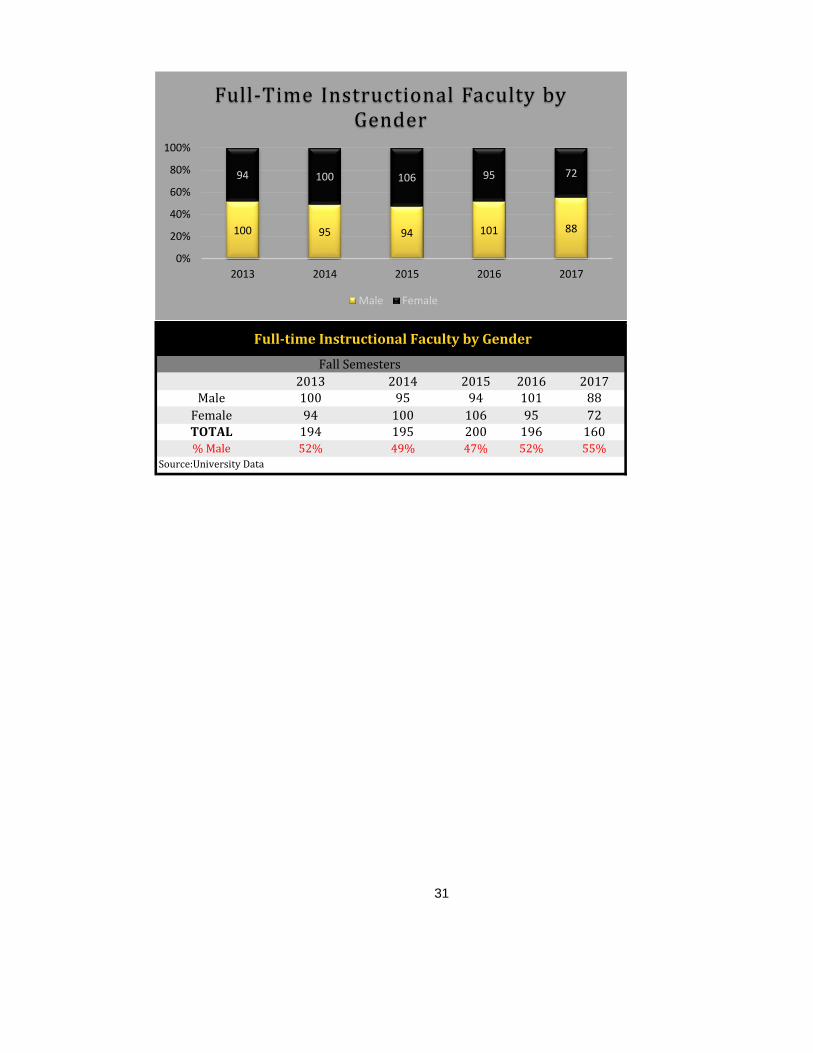
2013 2014 2015 2016 2017Male 100 95 94 101 88
Female 94 100 106 95 72TOTAL 194 195 200 196 160% Male 52% 49% 47% 52% 55%
Source:University Data
System
31
Fall Semesters
Full-time Instructional Faculty by Gender
100 95 94 101 88
94 100 106 95 72
0%
20%
40%
60%
80%
100%
2013 2014 2015 2016 2017
Full-Time Instructional Faculty by Gender
Male Female
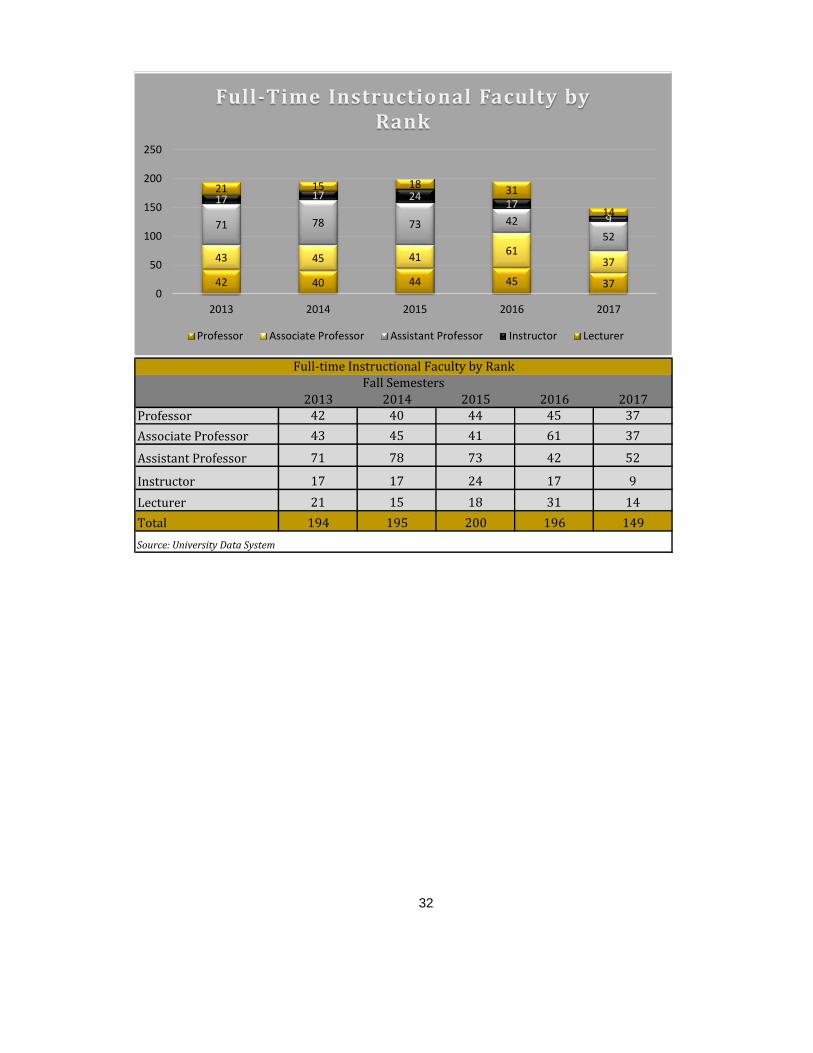
Full-time Instructional Faculty by Rank
Fall Semesters
2014 2015 2016 2017
Professor 42 40 44 45 37
Associate Professor 43 45 41 61 37
Assistant Professor 71 78 73 42 53
Instructor 17 17 24 17 10
Lecturer 21 15 18 31 13
2013 2014 2015 2016 2017Professor 42 40 44 45 37
Associate Professor 43 45 41 61 37
Assistant Professor 71 78 73 42 52
Instructor 17 17 24 17 9
Lecturer 21 15 18 31 14
Total 194 195 200 196 149
32
Source: University Data System
Full-time Instructional Faculty by RankFall Semesters
0
0.2
0.4
0.6
0.8
1
1.2
Faculty Count by Rank
42 40 44 45 37
43 45 4161
37
71 78 73 42
52
17 17 2417
9
21 15 1831
14
0
50
100
150
200
250
2013 2014 2015 2016 2017
Full-Time Instructional Faculty by Rank
Professor Associate Professor Assistant Professor Instructor Lecturer
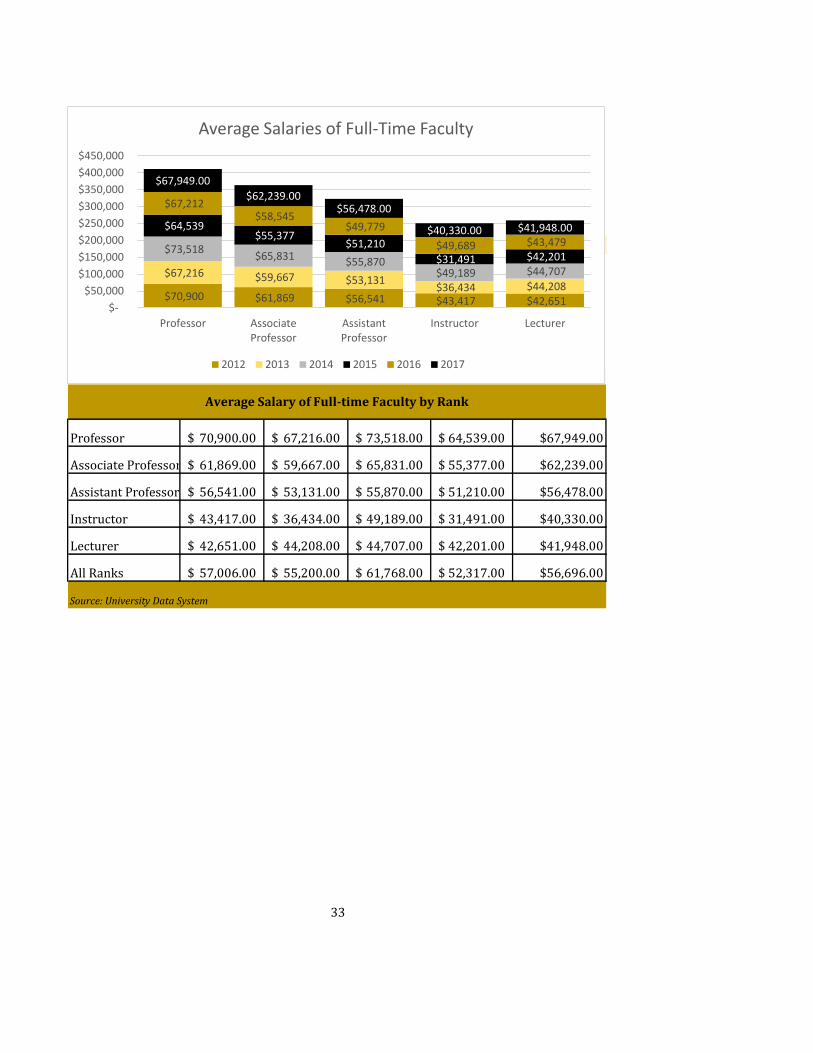
Professor Associate ProfessorAssistant ProfessorInstructor Lecturer2012 70,900$ 61,869$ 56,541$ 43,417$ 42,651$ 2013 67,216$ 59,667$ 53,131$ 36,434$ 44,208$ 2014 73,518$ 65,831$ 55,870$ 49,189$ 44,707$ 2015 64,539$ 55,377$ 51,210$ 31,491$ 42,201$ 2016 67,212$ 58,545$ 49,779$ 49,689$ 43,479$ 2017 67949 62239 56478 40330 41948
Professor 70,900.00$ 67,216.00$ 73,518.00$ 64,539.00$ $67,949.00
Associate Professor 61,869.00$ 59,667.00$ 65,831.00$ 55,377.00$ $62,239.00
Assistant Professor 56,541.00$ 53,131.00$ 55,870.00$ 51,210.00$ $56,478.00
Instructor 43,417.00$ 36,434.00$ 49,189.00$ 31,491.00$ $40,330.00
Lecturer 42,651.00$ 44,208.00$ 44,707.00$ 42,201.00$ $41,948.00
All Ranks 57,006.00$ 55,200.00$ 61,768.00$ 52,317.00$ $56,696.00
Source: University Data System
33
Average Salary of Full-time Faculty by Rank
$70,900 $61,869 $56,541 $43,417 $42,651
$67,216 $59,667 $53,131 $36,434 $44,208
$73,518 $65,831 $55,870
$49,189 $44,707
$64,539 $55,377
$51,210
$31,491 $42,201
$67,212 $58,545
$49,779
$49,689 $43,479
$67,949.00
$62,239.00$56,478.00
$40,330.00 $41,948.00
$-
$50,000
$100,000
$150,000
$200,000
$250,000
$300,000
$350,000
$400,000
$450,000
Professor AssociateProfessor
AssistantProfessor
Instructor Lecturer
Average Salaries of Full-Time Faculty
2012 2013 2014 2015 2016 2017
Percent
Tenured
Fall 2011 51.9%
Fall 2012 49.7%
Fall 2013 58.7%
Fall 2014 55.0%
Fall 2015 59.0%
Fall 2016 59.20%
Fall 2017 56.00%
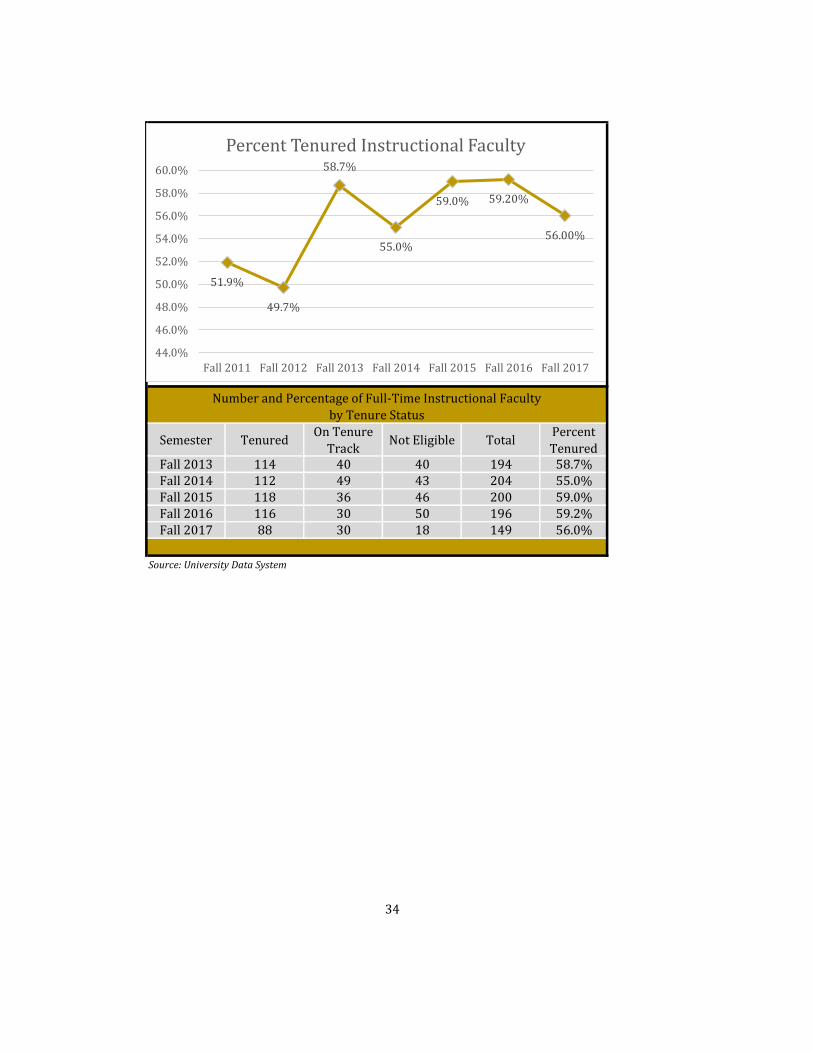
Semester TenuredOn Tenure
TrackNot Eligible Total
Percent
TenuredFall 2013 114 40 40 194 58.7%Fall 2014 112 49 43 204 55.0%Fall 2015 118 36 46 200 59.0%Fall 2016 116 30 50 196 59.2%Fall 2017 88 30 18 149 56.0%
Source: University Data System
34
Number and Percentage of Full-Time Instructional Faculty
by Tenure Status
51.9%
49.7%
58.7%
55.0%
59.0% 59.20%
56.00%
44.0%
46.0%
48.0%
50.0%
52.0%
54.0%
56.0%
58.0%
60.0%
Fall 2011 Fall 2012 Fall 2013 Fall 2014 Fall 2015 Fall 2016 Fall 2017
Percent Tenured Instructional Faculty
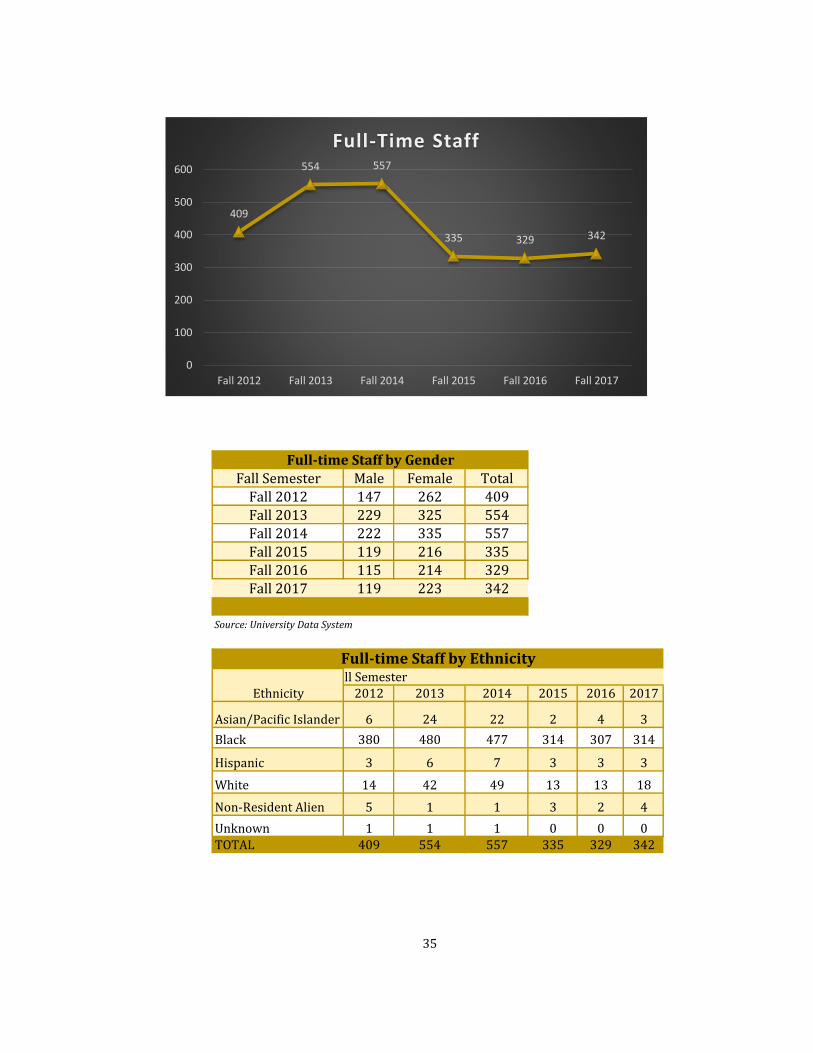
Fall 2012 409
Fall 2013 554
Fall 2014 557Fall 2015 335
Fall 2016 329
Fall 2017 342
Fall Semester Male Female TotalFall 2012 147 262 409
Fall 2013 229 325 554Fall 2014 222 335 557
Fall 2015 119 216 335Fall 2016 115 214 329
Fall 2017 119 223 342
Source: University Data System
Fall Semester2012 2013 2014 2015 2016 2017
Asian/Pacific Islander 6 24 22 2 4 3
Black 380 480 477 314 307 314
Hispanic 3 6 7 3 3 3
White 14 42 49 13 13 18
Non-Resident Alien 5 1 1 3 2 4
Unknown 1 1 1 0 0 0TOTAL 409 554 557 335 329 342
35
Ethnicity
Full-time Staff by Gender
Full-time Staff by Ethnicity
409
554 557
335 329 342
0
100
200
300
400
500
600
Fall 2012 Fall 2013 Fall 2014 Fall 2015 Fall 2016 Fall 2017
Full-Time Staff
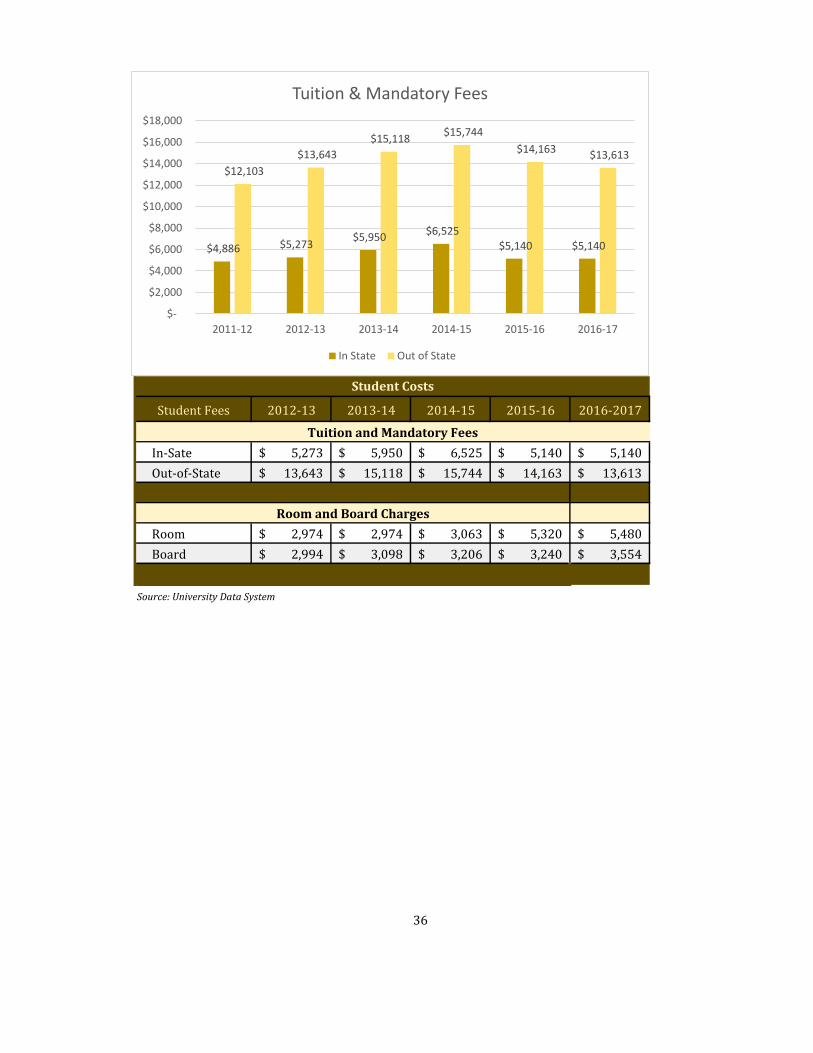
In State Out of State
2011-12 4,886$ 12,103$
2012-13 5,273$ 13,643$
2013-14 5,950$ 15,118$
2014-15 6,525$ 15,744$
2015-16 5,140$ 14,163$
2016-17 5,140$ 13,613$
Student Fees 2012-13 2013-14 2014-15 2015-16 2016-2017
In-Sate 5,273$ 5,950$ 6,525$ 5,140$ 5,140$
Out-of-State 13,643$ 15,118$ 15,744$ 14,163$ 13,613$
Room 2,974$ 2,974$ 3,063$ 5,320$ 5,480$
Board 2,994$ 3,098$ 3,206$ 3,240$ 3,554$
Source: University Data System
36
Tuition and Mandatory Fees
Room and Board Charges
Student Costs
$4,886 $5,273 $5,950
$6,525 $5,140 $5,140
$12,103
$13,643
$15,118 $15,744
$14,163 $13,613
$-
$2,000
$4,000
$6,000
$8,000
$10,000
$12,000
$14,000
$16,000
$18,000
2011-12 2012-13 2013-14 2014-15 2015-16 2016-17
Tuition & Mandatory Fees
In State Out of State
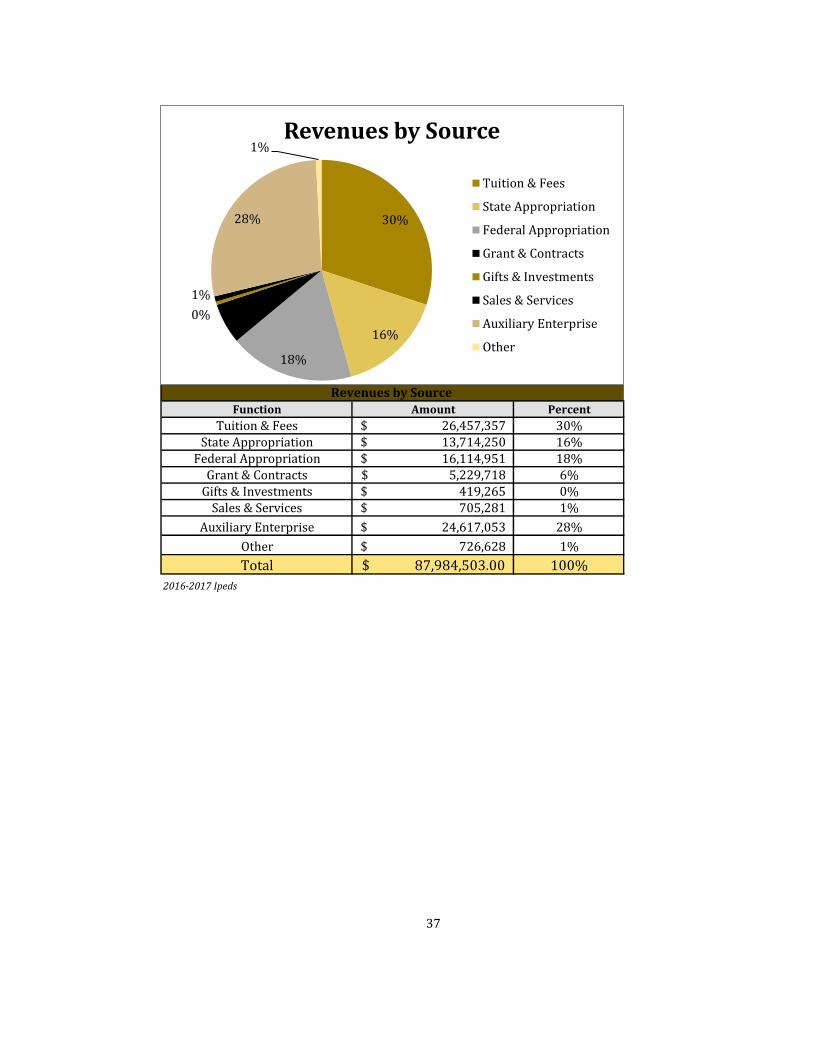
Function Amount Percent
Tuition & Fees 26,457,357$ 30%State Appropriation 13,714,250$ 16%
Federal Appropriation 16,114,951$ 18%Grant & Contracts 5,229,718$ 6%
Gifts & Investments 419,265$ 0%Sales & Services 705,281$ 1%
Auxiliary Enterprise 24,617,053$ 28%
Other 726,628$ 1%
Total 87,984,503.00$ 100%
2016-2017 Ipeds
37
Revenues by Source
30%
16%
18%
6%0%
1%
28%
1%Revenues by Source
Tuition & Fees
State Appropriation
Federal Appropriation
Grant & Contracts
Gifts & Investments
Sales & Services
Auxiliary Enterprise
Other
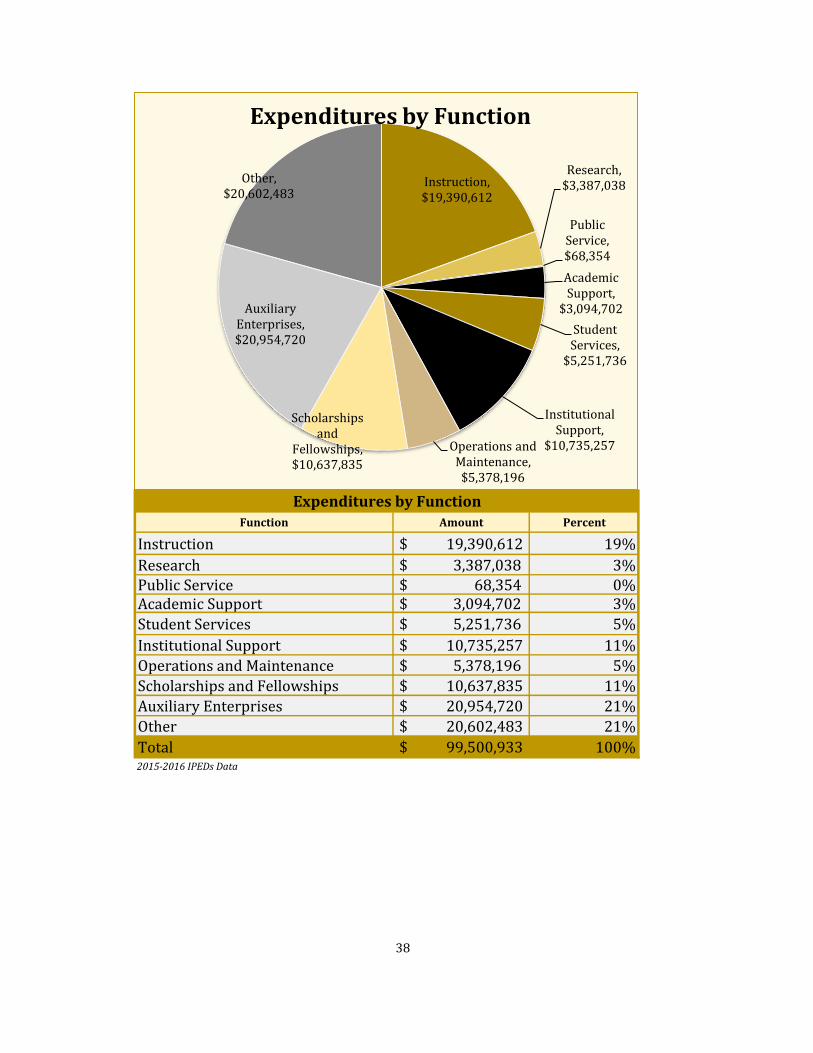
Function Amount Percent
Instruction $ 19,390,612 19%
Research $ 3,387,038 3%Public Service $ 68,354 0%Academic Support $ 3,094,702 3%
Student Services $ 5,251,736 5%
Institutional Support $ 10,735,257 11%
Operations and Maintenance $ 5,378,196 5%
Scholarships and Fellowships $ 10,637,835 11%
Auxiliary Enterprises $ 20,954,720 21%
Other $ 20,602,483 21%
Total $ 99,500,933 100%2015-2016 IPEDs Data
38
Expenditures by Function
Instruction, $19,390,612
Research, $3,387,038
Public Service, $68,354
Academic Support,
$3,094,702
Student Services,
$5,251,736
Institutional Support,
$10,735,257 Operations and Maintenance,
$5,378,196
Scholarships and
Fellowships, $10,637,835
Auxiliary Enterprises, $20,954,720
Other, $20,602,483
Expenditures by Function
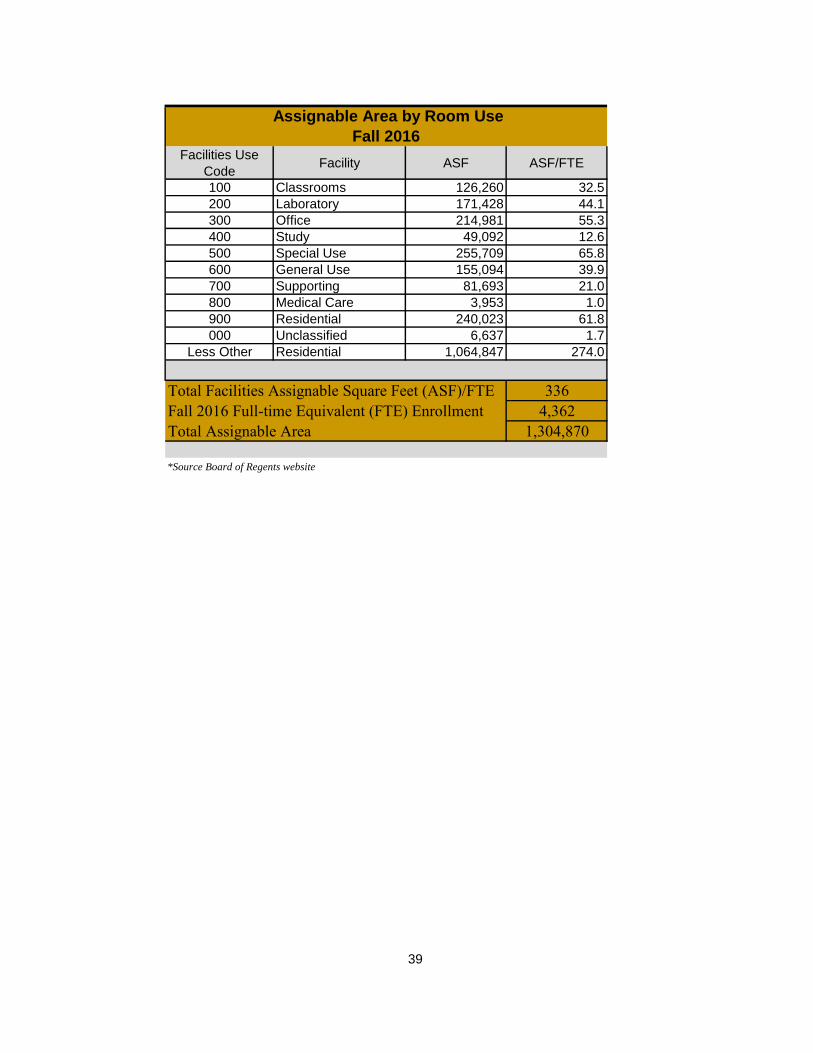
Facilities Use
CodeFacility ASF ASF/FTE
100 Classrooms 126,260 32.5
200 Laboratory 171,428 44.1
300 Office 214,981 55.3
400 Study 49,092 12.6
500 Special Use 255,709 65.8
600 General Use 155,094 39.9
700 Supporting 81,693 21.0
800 Medical Care 3,953 1.0
900 Residential 240,023 61.8
000 Unclassified 6,637 1.7
Less Other Residential 1,064,847 274.0
3364,362
1,304,870
*Source Board of Regents website
39
Total Facilities Assignable Square Feet (ASF)/FTEFall 2016 Full-time Equivalent (FTE) EnrollmentTotal Assignable Area
Assignable Area by Room Use
Fall 2016