Embed Size (px)
Citation preview

1
GRAIP-2 for ArcGIS 10 Installation and Use David Tarboton, Pabitra Dash May 2016
Last updated:5/3/2016
This document describes how to install and use the ArgGIS 10 toolbox developed for GRAIP-2. GRAIP-2
refers to the GRAIP version being developed for ArcGIS 10. This will supersede GRAIP version 1.0.x that
was only compatible with ArcGIS 9. GRAIP-2 functionality is being developed using a combination of
Python and C++ programs.
New Functions Functions in GRAIP Tools Road Surface Erosion Analysis
Road Surface Erosion
Stream Sediment Input Mass Wasting Potential Analysis
Add Stability Index to Database
Mass Wasting Potential
Length Slope Plot
Stability Index with Road Impact New TauDEM functions SINMAP Stability Index
Stability Index
Calibration Parameter Region Grid
Prerequisites and Dependencies GRAIP-2 assumes a Windows Computer with ArcGIS 10.3.1 or higher and Microsoft Office.
These instructions specifically refer to a computer with Windows 7 64 bit, ArcGIS 10.3.1 and Microsoft
office 2010. Adjustments may be needed for different platforms. We have tested on both 32 and 64 bit
Windows 7 operating systems.
ArcGIS 10.3.1 include Python 2.7. A number of Python libraries are required beyond the Python version
installed with ArcGIS. GRAIP depends on numpy-1.8.1 from the ArcGIS 10.3.1 Python installation
TauDEM (version 5.3) is used to provide hydrologic terrain analysis and channel network delineation
functionality. GRAIP depends on GDAL-1.9.2 from the TauDEM installation.
The GRAIP Preprocessor uses ODBC database drivers from Microsoft office to access the GRAIP mdb
database, so a version of Microsoft office needs to be installed.
Installation NOTE: If you have previously installed GRAIP-2, you need to uninstall GRIAP-2 first. From Windows list of
installed programs, uninstall “GRAIP-2 Prerequisites version 2.0”, “GRAIP-2 Python Tools version 1.0”

2
and “GRAIP-2 Preprocessor version 2.0”. Since version number changes as software gets updated, you
may have different versions for these three software packages.
1. Install graip_2_prerequisites_setup.exe. This installs the python libraries used. These include
pyodbc-3.0.7
Click-2.5 (Python command line interface creation kit)
scipy-0.15.1
matplotlib-1.1.0
setuptools-5.4.1
easyinstall-2.7
In case you have multiple versions of Python installed select Python Version 2.7 from ArcGIS
(usually in folder c:\Python27\ArcGIS10.3\). During this install you need to be connected to the
internet as the install script downloads python components that are part of setuptools and
easyinstall.
2. Install graip_2_arcgis_python_tools_setup.exe. This includes
GRAIP Tools.tbx: This is an ArcGIS Toolbox that interfaces to Python Scripts
ArcGISRoadSurfaceErosion.py: ArcGIS Toolbox interface to Road Surface Erosion function
ArcGISStreamSedimentInput.py: ArcGIS Toolbox interface to Stream Sediment Input
function
ArcGISStabilityIndexWithRoadImpact.py: ArcGIS Toolbox Stability Index with Road Impact
interface to Stability Index function
ArcGISMassWastingPotential.py: ArcGIS Toolbox interface to Mass Wasting Potential
function
ArcGISCalibrationRegionTool.py: ArcGIS Toolbox interface to Calibration Region Grid
function
ArcGISLSPlot.py: ArcGIS Toolbox interface to Length Slope Plot function
RoadSurfaceErosion.py: Command line callable Road Surface Erosion function
StreamSedimentInput.py: Command line callable Stream Sediment Input function
StabilityIndex.py: Command line callable Stability Index function
MassWastingPotential.py: Command line callable Mass Wasting Potential function
LSPlot.py: Command line callable Length Slope Plot function
3. Install TauDEM from http://hydrology.usu.edu/taudem. TauDEM534.exe
4. Add the GRAIP ArcGIS Toolbox.
Open ArcMap 10.3.1 or higher.
Open ArcToolbox within ArcMap
Right click in white space to Add Toolbox

3
Navigate to the GRAIP-2 > PythonTools folder and open GRAIP Tools.tbx.
The following tools should be added to your ArcToolbox list
If you wish this toolset to persist when you close and open ArcMap right click in white space
in ArcToolbox and Save Settings > To Default.
5. Add the TauDEM ArcGIS toolbox from C:\Program Files\TauDEM\TauDEM5Arc and save settings to
default if desired.
6. Install graip_2_preprocessor_setup.exe. This includes:
PySide Python GUI library

4
GRAIP Database file (GRAIP.mdb) located under GRAIP_DB folder
GRAIP demo data under the ‘tutorial’ folder
This manual under the ‘tutorial’ folder
GRAIP Icon file (GRAIPIco.ico)
preprocessor.pyw (main script file for the preprocess application)
utils.py (script file that contains utility functions for the preprocessor application)
In this install click Yes to the Folder Exists message
Note: During the Preprocessor install you need to be connected to the internet as the install
script downloads PySide GUI library.
Run GRAIP 1. The GRAIP demo data is in C:\Program Files\GRAIP-2\Preprocessor\tutorial\demo.zip. Move the
folder demo from this file to your working location.
2. Run the GRAIP-2 Preprocessor. Double Click GRAIP-2 Preprocessor shortcut.
Enter inputs

5
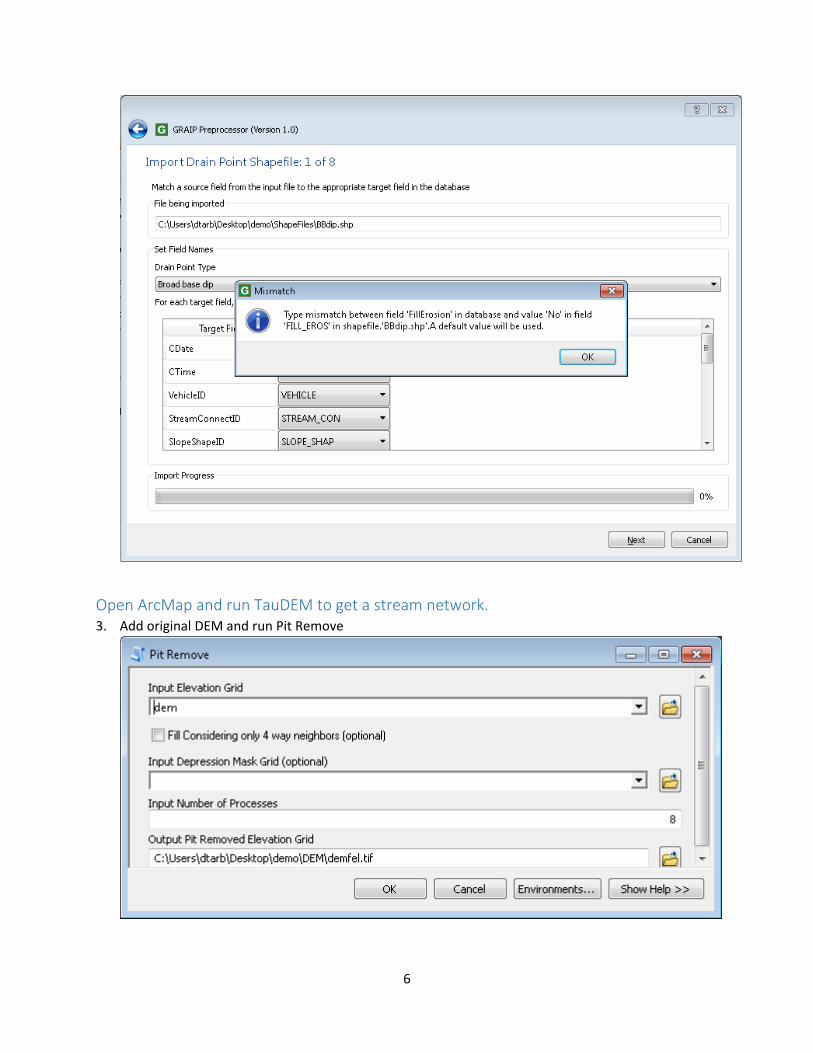
Click Next and OK through all the preprocessor windows that open. [Tom - it may be better to
distribute a more recent example that does not trigger so many errors/warnings]
6
Open ArcMap and run TauDEM to get a stream network. 3. Add original DEM and run Pit Remove
7
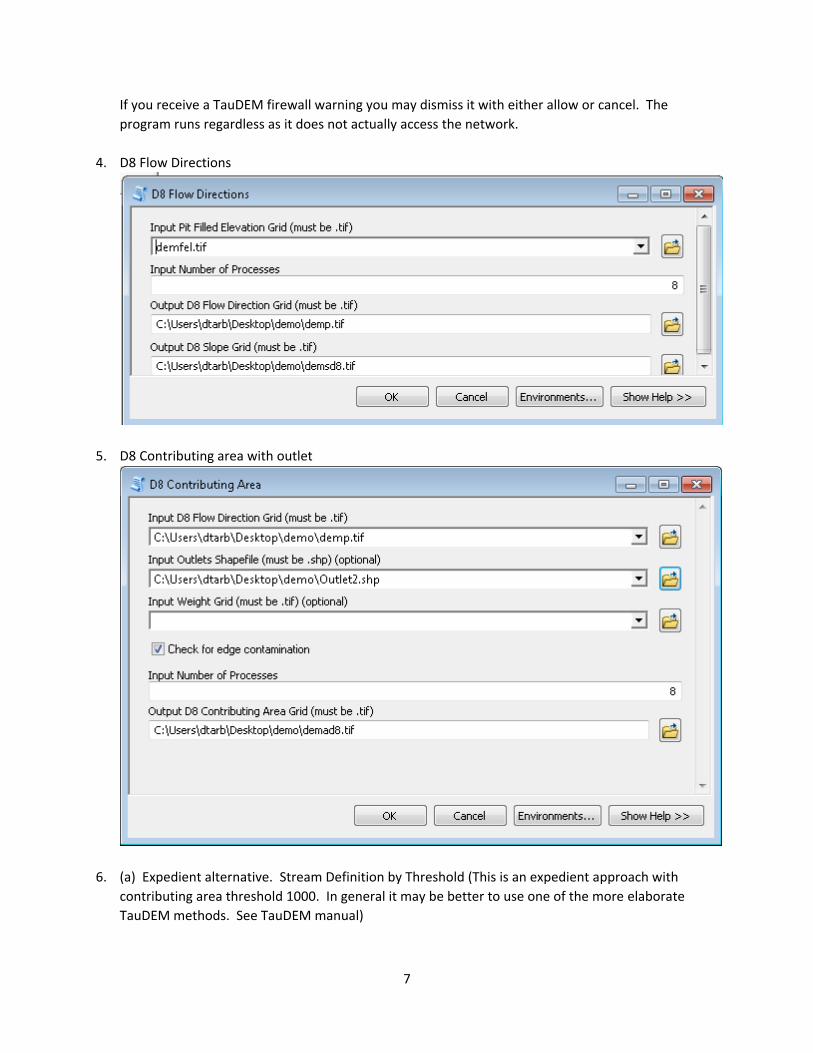
If you receive a TauDEM firewall warning you may dismiss it with either allow or cancel. The
program runs regardless as it does not actually access the network.
4. D8 Flow Directions
5. D8 Contributing area with outlet
6. (a) Expedient alternative. Stream Definition by Threshold (This is an expedient approach with
contributing area threshold 1000. In general it may be better to use one of the more elaborate
TauDEM methods. See TauDEM manual)

8
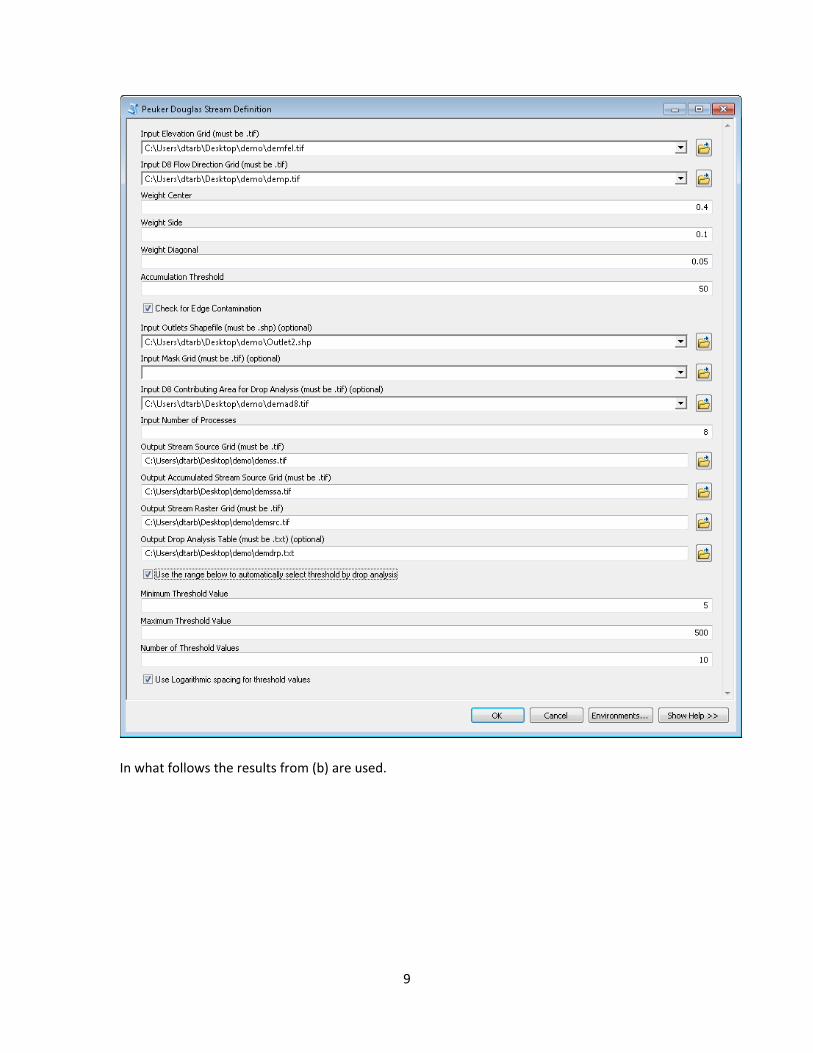
(b) Rigorous Alternative. Peuker Douglas Stream Definition. (This performs a stream drop analysis
to select a channelization threshold that produces a stream network with geomorphologically based
drainage density. This requires an outlet file that has its outlets precisely positioned on the stream
paths.)
9
In what follows the results from (b) are used.

10
7. Stream Reach and Watershed
Now we are ready to run GRAIP functions
8. Add DrainPoints.shp and Roadlines.shp shapefiles to ArcMap.

11
9. Add DrainPoints and Roadlines tables from GRAIP mdb to ArcMap. (Not needed for execution, only
added for visualization)
10. Run the Road Surface Erosion tool with the following inputs.
Note that the DEM raster input has to be at the same scale of the TauDEM flow direction DEM that
will be used in later functions so that the Output Drainpoint Sediment Weight raster is produced at
the same scale as the DEM to use in TauDEM weighted flow accumulation. Earlier versions of GRAIP
used a higher resolution interpolated DEM here to better compute road segment slopes. This is no
longer necessary as we have implemented bilinear interpolation on the given input DEM in the
extraction of road line end point elevations used for the computation of slope.
Note that the units on drainpoint sediment weight raster are kg/yr consistent with the units in
Roadlines and Drainpoints tables.

12
11. Weighted D8 Contributing Area to evaluate drain point sediment accumulation.
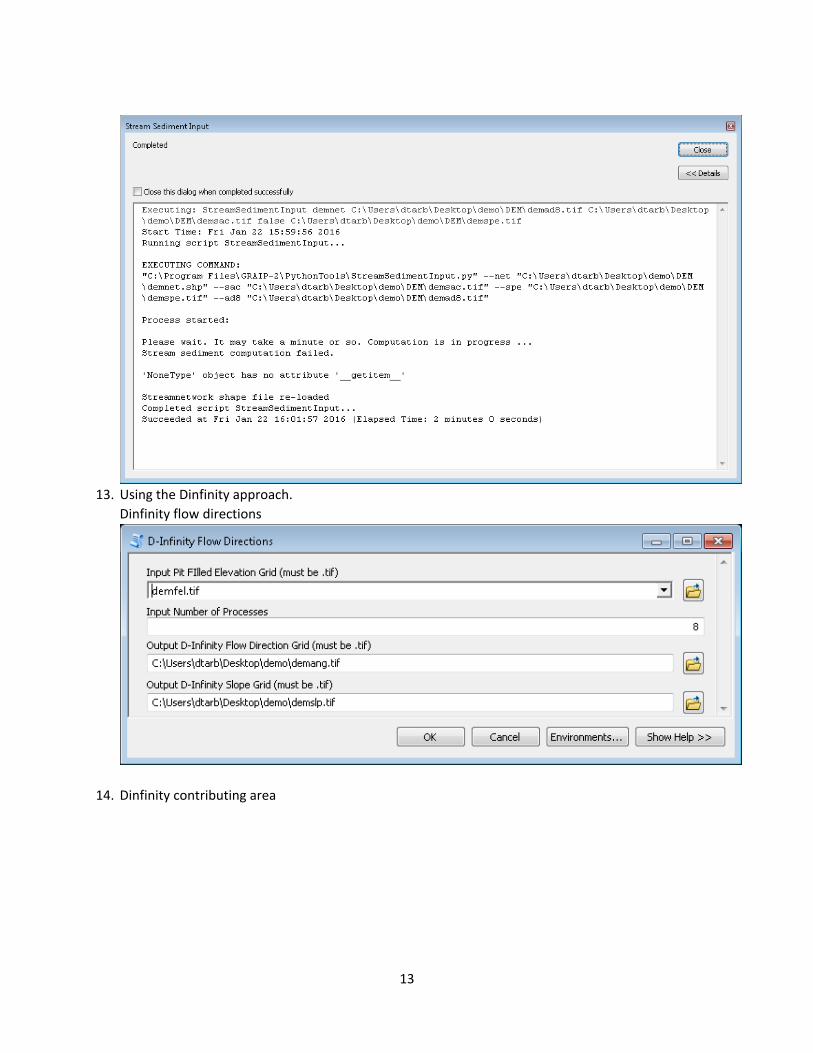
12. Stream Sediment Input
The specific sediment accumulation raster is computed as the ratio of sediment accumulation raster
to contributing area raster, with units adjustments and fields SedAccum, SpecSed, SedDir and
SpecSedDir are added to the stream network shapefile.
Note that the units on sediment accumulation are kg/yr as this inherits from dpsi. The units on the
specific sediment accumulation raster are Mg/km^2/yr. This is evaluated as
(sac/1000)/(ad8*dx*dy/10^6)
13
13. Using the Dinfinity approach.
Dinfinity flow directions
14. Dinfinity contributing area

14
15. Weighted Dinfinty Contributing Area
16. Create copy of stream network onto which to write dinfinty results so as not to clober D8 results
computed earlier: demnetdinf.shp. Delete the last 4 fields in this copy.
17. Stream Sediment Input

15
SINMAP
18. Create Parameter Region Grid.
SINMAP parameters are specified using an integer grid that serves as an index into an attribute
lookup table. This is evaluated using the TauDEM SINMAP Create Parameter Region Grid
The following default SINMAP parameter file is written to dempar.csv.
SiID,tmin,tmax,cmin,cmax,phimin,phimax,SoilDens
1,2.708,2.708,0.0,0.25,30.0,45.0,2000.0

16
If different parameters are desired this file may be edited by hand.
19. Stability index. ( From the TauDEM tools, SINMAP without road impacts)
Note that the previous version of SINMAP used T/R as a single parameter. The new implementation
uses T and R as separate parameters, with Rmin and Rmax input on the dialog above and spatially
uniform, while T is a value lookup by parameter zone as specified in the parameter attribute table.
The values used for testing above were Rmin = 0.0009025 m/hr and Tmax = 2.708 m^2/hr which gives
T/Rmax = 3000.5 m, and Rmax = 0.0013535 m/hr and Tmin = 2.708 m^2/hr which gives T/Rmin =2000.7
m. These are close to the default SINMAP parameters of T/Rmin = 2000 m and T/Rmax = 3000 m, for
checking of results.
20. GRAIP Tools -> Mass Wasting Potential Analysis -> Add Stability Index to Database.

17
This function looks up the Stability Index grid values at each drainpoint and stores them in
the SI field in the Drainpoints table of the GRAIP database.
21. Stability Index with Road Impact. (From GRAIP tools)
18
Once the graip database is selected, drain point types will be automatically loaded from the
DrainTypeDefinitions table of the selected graip database as a list of checkboxes for the user to select
specific drain point types. Changes to the selection of drain point types are saved back to the CCSI
column in the DrainTypeDefinitions table in the database as a record of the drain point types used in the
road impacted stability index calculation.
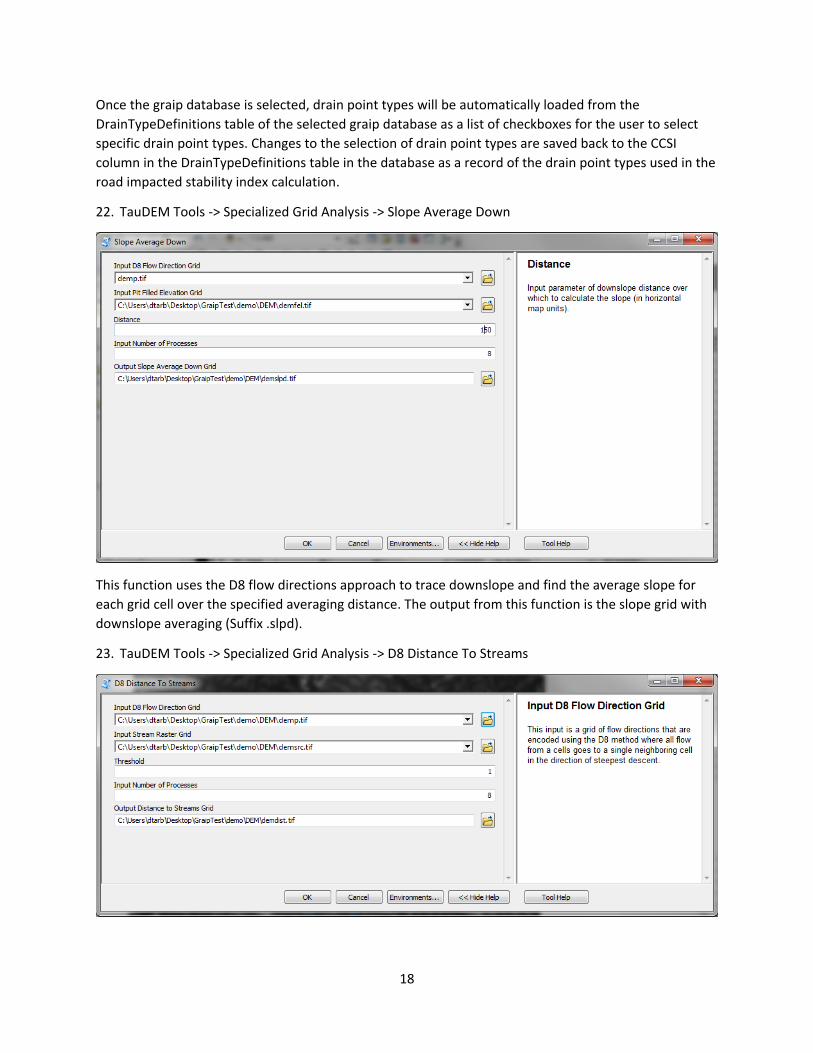
22. TauDEM Tools -> Specialized Grid Analysis -> Slope Average Down
This function uses the D8 flow directions approach to trace downslope and find the average slope for
each grid cell over the specified averaging distance. The output from this function is the slope grid with
downslope averaging (Suffix .slpd).
23. TauDEM Tools -> Specialized Grid Analysis -> D8 Distance To Streams

19
This function uses the D8 flow directions approach to trace downslope and find the distance from each
grid cell to the streams.
24. GRAIP Tools -> Mass Wasting Potential Analysis -> Mass Wasting Potential
This tool evaluates the Erosion Sensitivity Index (ESI) at each drain point and adds the value to the ESI
field in the Drainpoints table. ESI is calculated as L S^(alpha) where S is the slope and L the effective
length of road draining to each drain point.
This tool also optionally adds stability index, combined stability index, and D8 distance to stream values
to the fields SI, SIR, and DistToStream in the Drainpoints table, also used to assess Mass Wasting
Potential at drain points. Stability index should be from SINMAP. Combined stability index should be
from SINMAP stabiity index with road impacts and D8 distance to stream from TauDEM.
25. GRAIP Tools -> Mass Wasting Potential Analysis -> Length Slope Plot
This function generates the Length-Slope plot with Length on the Y-axis and Slope on the X-axis.

20