Embed Size (px)
Citation preview

Grain Size Prediction in AA6060 Profile Extrusion
Lorenzo Donati and Luca Tomesani, University of Bologna, Bologna, Italy Marco Schikorra and A. Erman Tekkaya,
Technische Universität Dortmund, Dortmund, Germany
ABSTRACT --- In the first part of the work, an experimental procedure to investigate the evolution of recrystallization in aluminum alloys is presented and discussed. Several cups, obtained by means of inverse extrusion, were produced at different temperatures and process speeds. The specimens were analyzed in order to examine the grain size distribution. The coefficients for dynamic recrystallization models were obtained by regression analysis after thermo-mechanical Finite Element Method (FEM) simulations of the experiments were realized with the code Deform 3-D. The specimens were then heated in a furnace and cooled, in order to reproduce static recrystallization of the material. The grain distribution was examined, and the coefficients for the equation for static recrystallization prediction were regressed too. In the second part of the work, the extrusion of a round-shaped profile is described, and the grain size distribution on the profile and on the billet rest is analyzed. The developed equations were applied to the rod extrusion, and the simulated grain size distributions were compared with the experimental ones.
INTRODUCTION
In recent years, the interest in microstructure prediction of metal formed products has seen increasing attention, especially in the field of light alloy processing, where the final mechanical properties strongly depend on the microstructure.[1, 2] It is well known that grain size and particle precipitation strongly affect the product characteristics from different points of view: aesthetic appearance; product strength and deformability; fatigue resistance; and corrosion. Usually, fine grain is desired, especially where high fatigue loads are applied, or when the final product is exposed to a corrosive environment.[3, 4] When extruding aluminum alloys, the mechanical properties of the profile are of great interest, particularly strength and deformability of profiles for the transportation industry. The mechanical properties of the profiles are mostly related to the microstructure evolution of the alloy during the whole production cycle, from billet casting to profile aging.[5] Coarse intermetallics precipitation, precipitate free zones (PFZ), grain size distribution, and coarsening[6] are some examples of problems related to the aluminum alloy’s metallurgical evolution that could lead to poor product properties at the end of the production sequence.
Today, the desired microstructure is achieved mainly on the basis of process experience, but the use of process simulation is focusing growing attention on everyday industrial production. Aluminum recrystallization has been one of the most investigated topics over the past years, due to its specific behavior during hot deformation,[7, 8] but no paper provides reliable equations and coefficients for an effective FEM analysis. During the whole thermo-mechanical process, different metallurgical phenomena take place: static recrystallization (SRX); dynamic recrystallization (DRX) (partially); geometric recrystallization (GDRX); grain growth; and particle precipitation.[9,10] In aluminum alloy processing, and in particular in the 6xxx alloys, the grains are strongly deformed to one principal direction, due to the process strains, thus producing a high contraction of the grains in the other direction; when this thinning reaches the dimension of subgrains, each subgrain becomes a new grain. This phenomenon is usually called Geometric Dynamic Recrystallization (GDRX), and its mechanics are quite different from standard dynamic recrystallization, where the nucleation of new grains occurs. Moreover, static recrystallization and grain growth act together when deformation ends (after the die exit), and the contribution of each distinct phenomenon cannot be easily investigated.
With the aim of predicting grain size distribution on AA6060 extruded profiles, the study was divided into three different steps.
271

In the first step, a specially-designed test has been developed, in order to analyze the effect of recrystallization on the section of small cups obtained by a small-scale inverse extrusion experiment. The cups were realized at different temperatures and ram speeds in order to embrace typical process conditions of the industrial extrusion, and then immediately water-quenched. In the second step, the cups were heat-treated, and the grain evolution was analyzed and measured again. The grain size distribution at each step was then used to regress equations for recrystallization prediction, and such equations were implemented in the numerical analysis. In the third step, the model was used in the simulation of an AA6060 rod profile, and simulation results were compared and discussed, with the experimental grain size distribution measured on the extruded rests.
FEM Environment
The recrystallization prediction has been implemented inside the DeformTM 3-D environment, due to the availability of general equations for metallurgical evolution.[11] Deform is a thermo-mechanical coupled FEM code, based on a Lagrangian approach. This method is useful for metallurgical prediction, because it allows monitoring the evolution of strain, strain rate, and temperature during different stages of the process.
In Deform, the recrystallization behavior of metals is classified into three broad categories: [12]
Dynamic recrystallization (DRX): Recrystallization that occurs during deformation, when the strain
exceeds a critical strain. Static recrystallization (SRX): Recrystallization that occurs after deformation, when the imposed strain
is lower than a critical strain. Recrystallization begins in a nuclei-free environment. Grain growth, which occurs before recrystallization begins, or after recrystallization is completed. The
driving force is the reduction of grain boundary energy.
In this work, according to the above classifications and to the mechanisms taking place in aluminum alloy deformation, the adopted DRX model will take into account all recrystallization mechanisms that are present during deformation throughout the experimental procedure. Thus, geometric dynamic recrystallization, dynamic recrystallization, and continuous dynamic recrystallization will be modeled as a unique effect composed by different contributions. Moreover, as it will be explained below, the analytical models for the recrystallization prediction (and in particular static recrystallization) available inside the FEM environment are actually upper limited to the initial grain dimension. In order to overcome such limitations, only the grain growth model (coupled with the dynamic recrystallization model) will be considered in this study, with the aim of also including the static recrystallization effect. Dynamic Recrystallization (DRX). This mechanism occurs during deformation, when the strain exceeds a critical strain, the driving force being the removal of dislocations. Experimental data must be collected under various strain, strain rate, and temperature conditions. The critical strain εc is usually a fraction of the strain εp, at which the flow stress reaches its maximum (and flow softening due to dynamic recrystallization starts):
pc a εε 2= (1) The value of εp is determined experimentally, and is usually a function of strain rate, temperature, and initial grain size:
1101 )/exp(11 cRTQda mnp += εε & (2)
272

An Avrami equation is also used to describe the relation between the DRX volume fraction and the effective strain:
⎥⎥⎦
⎤
⎢⎢⎣
⎡⎟⎟⎠
⎞⎜⎜⎝
⎛ −−−=
dkp
ddrx
aX
5.0
10exp1ε
εεβ , (3)
in which ε0.5 denotes the strain for 50 percent recrystallization:
55055.0 )/exp(55 cRTQda mn += εε & (4) The DRX grain size is expressed as:
8808 )/exp(888 cRTQdad mnhdrx += εε & , (5)
where if drex>d0, then drex=d0. Grain Growth. Grain-growth modeling is performed for the material in the strain-free state, i.e., before hot working, or after recrystallization is completed. For this purpose, the classic phenomenological grain growth relation is employed. The kinetics are described by the equation:
99
1
99 exp
mmaveggave RT
Qtadd ⎥⎦
⎤⎢⎣
⎡⎟⎠⎞
⎜⎝⎛−+= , (6)
where dggave denotes the average grain size after growth, a9 and m are material constants, and Q9 is the activation energy. Temperature Limit. The temperature limit is the lower boundary of all grain evolution mechanisms. Below this temperature, no grain evolution is computed. Average Grain Size. The mixture law is employed to calculate the recrystallized grain size for incomplete recrystallization:
0)1( dXdXd rexrexrexave −+= (7) The nomenclature of the above formulation is: T – Temperature (°K); R - Gas constant (8.314472 J/(K · mol)); t – Time (seconds); d0 - Initial grain size (μm); d - Current grain size (μm); drex - Recrystallized grain size (μm); dave - Average grain size (μm); X –Volume fraction of recrystallization (Xdrx dynamic, if X=0, no recrystallization occurred, if X=1, 100 percent recrystallization occurred); ε - Effective strain; εc - Critical strain (strain above which dynamic recrystallization occurs); εp - Peak strain (strain at peak value of effective stress); ε0.5 - Strain for 50 percent recrystallization; ε& - Effective strain rate (sec-1); t0.5 - Time for 50 percent recrystallization (seconds); a1–10 - Material data (experimental coefficients); h1–8 n1–8 m1–9- Material data (grain-strain-strain rate experimental exponent); Q1–8 - Material data (Activation Energies); βd- Material data experimental coefficient; kd - Material data experimental exponent.
273

RESULTS AND DISCUSSION First Step - Laboratory Test In the first step, a laboratory-scale testing procedure was defined, in order to evaluate the effect of different processing conditions on the evolution of the grain size distribution after deformation of an AA6060 alloy provided in standard industrial homogenization conditions -- chemical composition in weight percentage (wt%): Silicon (Si) 0.43; Iron (Fe) 0.21; Copper (Cu) 0.02; Manganese (Mn) 0.03; Magnesium (Mg) 0.48; Zinc (Zn) 0.02; Chromium (Cr) 0.0012; Titanium (Ti) 0.01; and Aluminum (Al) remaining. Inverse extrusion equipment was designed (Figure 1), thus producing eight cups with decreasing wall thickness at different temperatures (250°C, 350°C, 450°C, and 550°C), and ram speeds (0.1mm/sec and 5mm/sec).
Figure 1. Inverse extrusion equipment. The testing parameter range was chosen in order to obtain local conditions of strain (0-3.88) and strain rate (0-5 s-1). The temperature inside the specimens was typical to industrial extrusion processes. The specimen and the testing tools were placed inside a resistance oven, in order to reach the temperature constant during the press stroke; the specimen temperature was controlled by means of a contact thermocouple. Immediately after deformation, the specimens were water-quenched in order to fix the metallurgical structure. The deformed specimens and an undeformed specimen were then embedded and analyzed by means of polarized optical microscopy, after an electrolytic etching in a Barker’s reagent. Finally, the grain size distributions were measured and recorded. Additionally, the whole testing plan was simulated by means of the Deform code, in order to obtain the distribution of strain and strain rate inside each specimen. By a comparison of the measured grain size with local forming conditions, the experimental coefficients of the dynamic recrystallization model were regressed as follows: a2=0.05, ε0.5=0.15, a5=0.15, βd=1 kd=1, a10=1, n8, m8, a8 (table 1), h5=n5=m5=Q5=0. A more detailed description of the experimental procedure, FEM simulations, and coefficient regression is reported.[13]
Table 1. Dynamic recrystallization regressed coefficient. Alloy Temperature n8 m8 a8
250°C -0.364 -0.213 1.93E+15 350°C -0.985 -0.105 7.22E+12 450°C -0.722 -0.084 1.34E+11
AA
6060
550°C -0.420 0.046 8.26E+09 In the base material, the microstructure consisted of well-developed and equiaxed coarse grains, with an average size of approximately 137 μm with large constituent particles along the grain boundaries, while other intermetallic compounds are observed inside the grains. Instead, in Figure 2a, the typical grain size distribution inside the deformed specimens is shown. Widely elongated grain formations (only deformed) were found in proximity of the punch, where a maximum strain of 2.5 to 3.88 was estimated, while more
274

equiaxed grains (hardly deformed at all) were observed near to the die surface, where a strain below 0.8 was found. A general decrease of grain thickness was noticed moving from the die to the punch: a thickness of 20 to 50 μm was observed in proximity of the punch, depending on the testing conditions, while a thickness of 80 to 110 μm was observed next to the die. This decrease can be explained by the deformation of material in the axial direction, while only in a few locations the geometric dynamic recrystallization effect (GDRX) produced new grains without any nucleation of new grains. In fact, the grains are strongly deformed along the extrusion direction, and when the thickness of the grain reaches the subgrain dimension, a new grain is formed.
Figures 2a-2d. Temperature = 350°C, speed = 0.1mm/sec: 2a) Optical micrograph; 2b) Simulated grain size, Temperature = 550°C, speed = 0.1mm/sec; 2c) Optical micrograph; 2d) Simulated grain size. By comparing the experimental measurements with the FEM-predicted grain size distributions (Figure 2b) throughout the whole specimens section, a mean error of 12 percent, with a maximum deviation of 57 percent was found, thus giving an interesting agreement with the experimental results, as reported in detail.[13] The greatest differences are usually found at the lowest temperature and in the upper section of the cups, where a tool misalignment can provide inhomogeneous deformation and consequently, a non-uniform wall thickness distribution in the specimens. Second Step - Heat Treatment
In the second step, the eight specimens were heat treated in a laboratory furnace at 550°C for 30
minutes, then air cooled to room temperature, and finally heated again to 180°C for ten hours. Following
275

the same procedure of the first step, specimens were sectioned, embedded, and the grain dimensions were analyzed. Equiaxed grains were now found inside the entire specimens (Figure 3), thus indicating a complete recrystallization of the material, and a general increase in grain dimension: in particular, the grain sizes were always bigger in the specimens where a lower testing speed was used. Moreover, with the increase of the testing temperature, an increase in grain dimension was found, and in particular when the testing temperature exceeded 450°C, an abnormal peripheral grain growth (PCG) was observed (Figure 3c).
When PCG was absent (i.e. Figure 3a), a grain dimension of 140μm to 170μm was found next to the punch, while next to the die, bigger grains were usually found (180μm to 250μm), again depending on the testing conditions during deformation. On the other hand, when PCG occurred in the area of high strain, an abnormal grain dimension (up to 1500μm) was found; at lower temperatures the abnormal growth is limited to high strain areas (up to two), while with increasing temperature, the PCG area is extended to lower strains (up to 0.6). It is interesting to note that, also when PCG is absent, grain dimensions are bigger than the initial one (137μm).
The same thermal cycle was simulated with FEM, and the parameters of Equation (6) were regressed by comparison with experimental results (a9=14, Q9=47600 and m9=0.8). The simulated grain size distribution obtained with the grain growth model is reported in Figures 3b and 3d. The developed model describes the increases in grain size with testing speed and temperature very well: a mean global error of 14 percent with a peak of 49 percent in the prediction was found, but in the calculation of this error, the locations with PCG were excluded. Some limitations arise with the utilized grain growth model shown in Equation (6). First, the applied model does not consider the amount of energy stored in the material in the form of dislocations, so all grains grow independently from their deformation history. Secondly, PCG could not be computed by such a model, because coarsening is a phenomenon mainly related to the maximum strain reached in the material; in an analytical model formulation, no direct effect of the maximum strain is considered.
Figures 3a-3d. Specimens after heat treatment: 3a) 350°C - 0.1mm/sec; 3b) 350°C - 0.1mm/second simulated; 3c) 550°C - 0.1mm/sec; and 3d) 550°C - 0.1mm/sec simulated.
Third Step - Extrusion of a Rod Profile
The experimental investigations were carried out using a simple axisymmetric die shape, in order to
guarantee a symmetric microstructure distribution. The profile, a round rod of 36mm diameter (extrusion ratio 14.7) made of AA6060 alloy, was produced at 0.3mm/sec ram speed under strict observation of the process conditions.
For the development of a microstructure (recrystallization and grain growth), the temperature is one of the most important influencing parameters. In the experiment, the temperatures were strictly monitored by thermocouples during the whole extrusion process, starting from initial heating to process handling, extrusion, and cooling down. The material temperature history is schematically reported in Figure 4, while the monitored data during the press stroke are shown in Figure 5. As reported in Figure 4, the billet reached a temperature of 550°C inside the oven, and then decreased to an exit temperature of the profile of approximately 400°C. This temperature history, which does not evidence any rise by deformation, is related to both the quite low extrusion ratio, and the low temperatures of container and die (450°C and 380°C respectively) that cooled down the material temperature flowing through the die. At the same time, the die
276

temperature increased. At the end of the extrusion stroke, distinction must be made between temperature of the profile and temperature of the billet. Due to the time needed to extract the billet from the container, the billet did not cool down immediately (approximately 15 minutes were required in order to extract the billet out of the container), while the temperature of the exiting profile started to decrease directly after the die exit. Both were cooled with ambient air to room temperature.
Because an immediate quench of the billet rests after extrusion was not possible, the analysis contains recrystallization during the forming step, as well as static recrystallization and grain growth when the material remains at high temperature in the container and during the cooling down phase.
Figure 4. Billet and profile temperature over process time, schematic.
As it can be seen in the curves of Figure 5, after the initial upsetting of the billet from φ138 to φ146
container diameter, the punch load reached a maximum value of three mega Newtons (MN). For an analysis of the material flow and the grain structure not only in the profile, but also in the press rest, the extrusion was stopped after a punch travel of approximately 40 to 50 percent of the billet’s length (ram stroke = 130mm), in order to have a larger area for the analysis of the material grain size at different strain conditions.
Figure 5. Monitored process conditions during the extrusion of different aluminum alloy billets.
Then, the billet was prepared for metallurgic investigations; it was sawed next to the symmetry plane,
machined and polished, then etched at room temperature for five to eight minutes with 90 milliliters (ml) H2O (water), 15ml HCl (Hydrochloric acid), and 10ml HF (Hydrofluoric acid), based on Flick procedure.
Figure 6 shows the macro and micro sections of the billets after the etching procedure in the symmetry plane. As shown,[14] it can be observed on the macro etching that the microstructure differs significantly regarding the grains’ position in the billet rest. Aiming at a complete analysis of the material deformation path during extrusion, Figure 6 reports both the macro images of the complete billet, and micro images along several deformation paths. Four different zones develop inside the rest, which can be distinguished by their etching response like grain pattern, gray scale level, and reflection. Material flow lines are reported, in order to separate the major zones of the deformation process. Four different zones are marked. Zone I is the dead metal zone (DMZ); in this region the material has almost no movement during the ram stroke. It is exposed to high temperatures and high hydrostatic
277

pressure, but small strain and negligible strain rate occurred (except for the upsetting phase). The microstructure in this area (A1) is dominated by a small reduction in size of the initial microstructure; perfect equiaxed grains are evidenced, and an average grain size equal to 110μm is found. Due to the low level of plastic strain no recrystallization occurred, only small grain elongation took place. Furthermore, no grain growth will appear, according to the lack of recrystallization. Zone II is the shear intensive zone (SIZ) of deformation, and it outlines the DMZ. The grains in this area undergo high shear strain deformation caused by the boundary conditions, where still material is located in the external part due to the friction effect (DMZ), while high speeds (sometimes higher than ram speed) move the material in the inner part of the billet. Strain and strain rates are high, but not the highest yet (see Figure 8), as better described later. The grains (A2) are orientated as the material flows, and elongate to long narrow banded stripes. In relation to this high elongation, the grains of the shear intensive zone have an average length of 320μm, and a width of 54μm. If an equivalent grain (in term of section area) of round shape is computed, a mean diameter of 120μm is found. Due to the high degree of deformation and even high strain rates, this area shows relevant geometric recrystallization, but unexpectedly negligible grain growth is found, probably due to low temperatures. In contrast to the SIZ zone, the material in the main deformation zone (MDZ), Zone III, flows directly into the die orifice. The grains do not deform, or deform only slightly within the billet. They undergo a translation movement that leads to a plastic deformation only near the die opening. The grain structure (A3) is mainly influenced by the initial grain size after homogenization (average grain thickness = 100μm). The material undergoes high temperatures and high hydrostatic pressure, and strain and strain rate increase with decreasing distance to the orifice. A slight geometric dynamic recrystallization effect in this zone usually appears at a short distance from the die exit (A5), as evidenced by Electron Backscatter Diffraction (EBSD) analysis shown in Figure 7: recrystallized grains of 50μm diameter are found inside bigger elongated grains of 80μm to 100μm thickness. Zone IV is the exiting profile zone (EPZ), which is the result of all the above-mentioned influences. In this zone, the microstructure can differ drastically, depending on the recrystallization history in relation to the position in the profile. A complicated mixture of high strains, strain rates, and temperature, but also cooling rates occurs near the surface. Speeds are quite high, so the temperatures rise to their maximum values; the same happens to the strain, reaching the highest values in the bearing.
Figure 6. Macro and micro analysis of the extruded rest (AA6060).
1
A1 A2
2
A1: Dead zoneA2: Shear zoneA3: Material inflowingA4: Grain GrowthA5: Material exiting3
54
A3A4 A5
1
A1 A2
2
A1: Dead zoneA2: Shear zoneA3: Material inflowingA4: Grain GrowthA5: Material exiting3
54
A3A4 A5
278
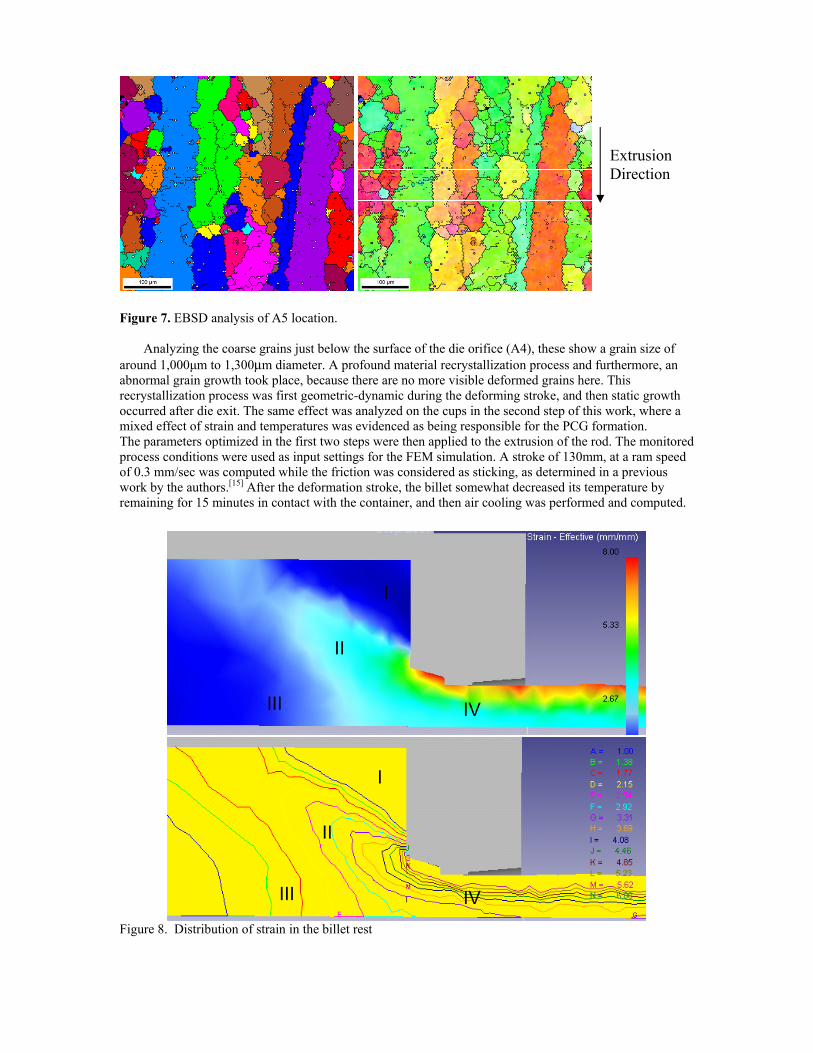
Figure 7. EBSD analysis of A5 location. Analyzing the coarse grains just below the surface of the die orifice (A4), these show a grain size of around 1,000μm to 1,300μm diameter. A profound material recrystallization process and furthermore, an abnormal grain growth took place, because there are no more visible deformed grains here. This recrystallization process was first geometric-dynamic during the deforming stroke, and then static growth occurred after die exit. The same effect was analyzed on the cups in the second step of this work, where a mixed effect of strain and temperatures was evidenced as being responsible for the PCG formation. The parameters optimized in the first two steps were then applied to the extrusion of the rod. The monitored process conditions were used as input settings for the FEM simulation. A stroke of 130mm, at a ram speed of 0.3 mm/sec was computed while the friction was considered as sticking, as determined in a previous work by the authors.[15] After the deformation stroke, the billet somewhat decreased its temperature by remaining for 15 minutes in contact with the container, and then air cooling was performed and computed.
Figure 8. Distribution of strain in the billet rest
IVIII
I
II
IVIII
I
II
Extrusion Direction
279

Figure 9. Distribution of material velocity in the billet rest. In Figures 8 and 9, the distribution of strain and material velocity in proximity to the final deformation stroke are plotted: again, the four different zones can be clearly detected, depending on the amount of strain and speed. In the billet, Zone I (Dead Metal Zone, DMZ) is characterized by strains lower than 1.0, the material is highly hydrostatically compressed, but the material velocity is so low that it can be considered almost still; in Zone II (Intensive Shear Zone, SIZ) a high strain is evidenced (1.7-4.5), but low flow rates (0.2-0.4 mm/sec) are present; in Zone III (main deformation zone, MDZ), the material has low strains (below 1.2), and the material speed is similar to the ram speed (0.3 mm/sec). Finally, in Zone IV (Exiting Profile Zone, EPZ), a homogeneous high speed (4.1 mm/sec) is evidenced, while two regions of strain are present: a superficial region with high strains (around 8.0), and an inner region with lower values (around 2.7). As to the temperature, the billet was preheated to 500°C, and due to the lower die temperature (380°C), the exiting profile temperature results were quite low (380°C to 400°C).
IVIII
I
II
IVIII
I
II
280

Figure 10. Distribution of average grain size in the billet rest. In Figure 10, the simulated average dimension of the grain is plotted: in Zone I (point 1), a grain size around 105μm is computed, in close agreement with the 110μm value of the experimental measurement; in points 2 and 3 (Zones II and III), the same grain size prediction is obtained (116μm). In point 2, the grains are highly distorted, because static recrystallization did not occur and, in this condition, it is difficult to estimate the grain size. If minimum grain thickness is computed, a big difference between computed value (116μm) and experimental value (54μm) is found; otherwise, if we consider the equivalent grain area, the experimental dimension is around 120μm, thus providing good agreement with measurements. In the area on the left of point 3, an unacceptable prediction of grain dimension is made: a grain of 190μm is evaluated, instead of the 120μm (equivalent) measured. This discrepancy can be explained by the adopted definition of a grain growth model, which does not discern points where high deformation occurred from points where small strains are present. In fact, at point 3, the code considers grain growth, whereas only a few dislocations are present in the material, so as to limit grain growth to a minimal extent. Finally, in Zone IV (points 4 and 5), a prediction of 120μm and 70μm is made with respect to the 1000 and 50μm to 100μm of the experimental measurement. According to the observation that at temperatures above 450°C, PCG is formed if the strain exceeds a critical value, and that with decreasing temperatures higher strains are obtained, it is possible to notice that a peripheral coarse grain was formed in the extruded rest, where strains reached a value higher than five. In this direction, the grain growth model has to be modified and adapted to the dependencies of the phenomena on strain and deformation energy.
54
12
3
54
12
3
281

CONCLUSIONS In this work, an experimental methodology to evaluate the prediction of recrystallized structures in aluminum extrusion was presented and validated. 1) Inverse extrusion tests were realized, in order to obtain the widest set of thermal and mechanical
history conditions for microstructure development. In particular, the effects of geometric dynamic recrystallization (GDR) and static recrystallization (SRX)/grain growth were separately analyzed, and the peripheral coarse grain (PCG) phenomenon was investigated.
2) The whole experimental plan was simulated by FEM analysis with Deform 3-D, in order to derive the
local conditions of strain, strain rate, and temperature to be correlated with the evaluated microstructures.
3) A complete set of coefficients was regressed for the available microstructure evolution models inside
the code environment. 4) The obtained models were applied to the real extrusion of a round profile, and a comparison between
experimental measurements and simulation results was performed. The simulated results were in very good agreement with experimental data, except in zones where peripheral coarse grain and grain growth appeared. Here, further investigative efforts and specific modeling equations are required.
ACKNOWLEDGMENTS This work was carried out with the financial support of the MIUR (Italian Ministry for Research and Innovations), and the Transregional Collaborative Research Center/TR30, funded by the German Research Foundation (DFG). The authors would like to thank Dr. Jie Zhou and Dr. Joanna Duszczyk for their cooperation during the extruded cup analysis.
REFERENCES
1. Sheppard, T., “Prediction of structure during shaped extrusion and subsequent static recrystallisation
during the solution soaking operation,” Journal of Materials Processing Technology, vol. 177, 2006, 26–35.
2. Bandar, A.R., S. R. Claves, J. Lu, K. Matous, W. Z. Misiolek, and A. M. Maniatty, “Microstructural Evaluation of 6xxx Aluminum Alloys for Computer-Simulated Texture Prediction,” Proceedings of the Aluminum Extrusion Technology Seminar, ET 2004, Orlando, FL, vol. 1, 169-176.
3. Dixon, B., “Extrusion of 2xxx and 7xxx alloys,” Proceedings of the Aluminum Extrusion Technology Seminar, ET 2000, Chicago, IL, 2000, vol. 1, 281-294.
4. Sheppard, T., “Development of structure recrystallization kinetics and prediction of recrystallised layer thickness in some Al-alloys,” Proceedings of the Aluminum Extrusion Technology Seminar, ET 1996, Chicago, IL, 1996, vol. 1, 163-170.
5. Mol, J.M.C., J. van de Langkruis, J.H.W. de Wit, and S. van der Zwaag, “An integrated study on the effect of pre- and post-extrusion heat treatments and surface treatment on the filiform corrosion properties of an aluminium extrusion alloy,” Corrosion Science, Vol. 47, Issue 11, November 2005, 2711-2730.
6. Humphreys, F.J., and M. Hatherly, “Recrystallization and Related Annealing Phenomena,” Pergamon Press Inc., Oxford, 1995, ISBN 978-0080418841.
7. Gourdet, S., and F. Montheillet, “Experimental study of the recrystallization mechanism during hot deformation of aluminium,” Materials Science and Engineering A: Structural Materials: Properties, Microstructure and Processing, vol. 283, n 1-2, May 2000, 274-288.
8. Byrne, J.G., Recovery, Recrystallization, and Grain Growth, New York: MacMillman, 1965, 93-109. 9. Doherty, R.D., D. A. Hughes, F. J. Humphreys, J. J. Jonas, D. Juul Jensen, M. E. Kassner, W. E. King,
T. R. McNelley, H. J. McQueen, and A. D. Rollett, “Current issues in recrystallization: a review,” Materials Science and Engineering A, Volume 238, Issue 2, 15 November 1997, 219-274.
282

10. Pettersen, T., B. Holmedal, and E. Nes, “Microstructure development during hot deformation of aluminum to large strains,” Metallurgical and Materials Transactions A: Physical Metallurgy and Materials Science, vol. 34, n 12, December 2003, 2737-2744.
11. Fluhrer, J., “DEFORMTM 3D User’s Manual Version 6.0” Scientific Forming Technologies Corporation, 2006.
12. Shen, G., S.L Semiatin, and R. Shivpuri, “Modeling Microstructure Development during the Forging of Waspaloy,” Metallurgical and Materials Transactions A, 26A (1995), 1795-1803.
13. Donati, L., J. Dzwonczyk, J. Zhou, and L. Tomesani, “Microstructure prediction of hot-deformed aluminum alloys” accepted for publication on Key Engineering Materials Proceedings of Extrusion Workshop and Benchmark 2007, Trans Tech 2007.
14. Sheppard, T., “Metallurgical Aspects of Direct and Indirect Extrusion,” Proc. of the 3rd Aluminum Extrusion Technology Seminar, 1984, 107-124.
15. Schikorra, M., L. Donati, L. Tomesani, and M. Kleiner, “The role of friction in the extrusion of AA6060 aluminum alloy, process analysis and monitoring,” Journal of Materials Processing Technology, 191 2007, 288–292.
283