Embed Size (px)
Citation preview


Page | 1
GRADING FLORIDA PUBLIC SCHOOLS 2016-17
School grades provide an easily understandable metric to measure the performance of a school. Parents and the general public can use the school grade and its associated components to understand how well each school is serving its students. The school grades calculation was revised substantially for the 2014-15 school year to implement statutory changes made by the 2014 Legislature and incorporate the new Florida Standards Assessments (FSA). The 2016-17 school grades model uses the school grades model adopted for 2014-15.
The school grading system focuses the school grading formula on student success measures:
• Achievement • Learning gains • Graduation • Acceleration success • Maintaining a focus on students who need the most support
The 2016-17 School Grades Model
English Language Arts
(FSA)
Mathematics (FSA, EOCs,)
Science (NGSSS, EOC,)
Social Studies (EOCs)
Graduation Rate
Acceleration Success
Achievement (0% to 100%)
Achievement (0% to 100%)
Achievement (0% to 100%)
Achievement (0% to 100%)
4-year Graduation
Rate (0% to 100%)
High School (AP, IB, AICE,
Dual Enrollment or
Learning Gains (0% to 100%)
Learning Gains (0% to 100%)
Blank Blank
Blank
Industry Certification) (0% to 100%)
Learning Gains of the Lowest
25% (0% to 100%)
Learning Gains of the Lowest
25% (0% to 100%)
Blank Blank Blank
Middle School (EOCs or Industry
Certifications) (0% to 100%)
Components
In 2016-17, a school’s grade may include up to 11 components. There are four achievement components, as well as components for learning gains, learning gains of the lowest 25% of students, middle school acceleration, graduation rate and college and career acceleration. Each component is worth up to 100 points in the overall calculation.
Four Achievement Components – The four achievement components are English Language Arts, Mathematics, Science and Social Studies. These components include student performance on statewide standardized assessments, including the comprehensive assessments and end-of-course (EOC) assessments. The components measure the percentage of full-year enrolled students who achieved a passing score.

Page | 2
Four Learning Gains Components – These components are learning gains in English Language Arts and Mathematics, as well as learning gains for the lowest performing 25% of students in English Language Arts and Mathematics. These components include student performance on statewide standardized assessments, including the comprehensive assessments and EOC assessments for the current year and the prior year. The components measure the percentage of full-year-enrolled students who achieved a learning gain from the prior year to the current year.
Middle School Acceleration – This component is based on the percentage of eligible middle school students who passed a high school level EOC assessment or industry certification.
Graduation Rate – The graduation rate is based on a four-year adjusted cohort of ninth grade students, and the rate measures whether the students graduate within four years.
College and Career Acceleration – This component is based on the percentage of graduates from the graduation rate cohort who earned a score on an acceleration examination (AP, IB, or AICE), a grade in a dual enrollment course that qualified for college credit or earned an industry certification.
School Grades Calculation
The points earned for each component are added together and divided by the total number of possible points to determine the percentage of points earned.
School Grading Percentages
• A = 62% of points or greater • B = 54% to 61% of points • C = 41% to 53% of points • D = 32% to 40% of points • F = 31% of points or less
Percent Tested
Schools must test 95 percent of their students.
Resources
The Florida statute that provides the framework for the school grades calculation is at the following link: Section 1008.34, F.S.
The rule adopted by the State Board of Education at its January 6, 2016, meeting describes more specifically the school grades calculation and can be found at the following link: Rule 6A-1.09981, F.A.C.
The department’s website contains additional information about the school grades, including the results of the calculation for each school and district. This information will be available on the department’s interactive PK-20 Education Information Portal. Additional information describing the calculation and historical information are available at http://schoolgrades.fldoe.org/.
Page | 3
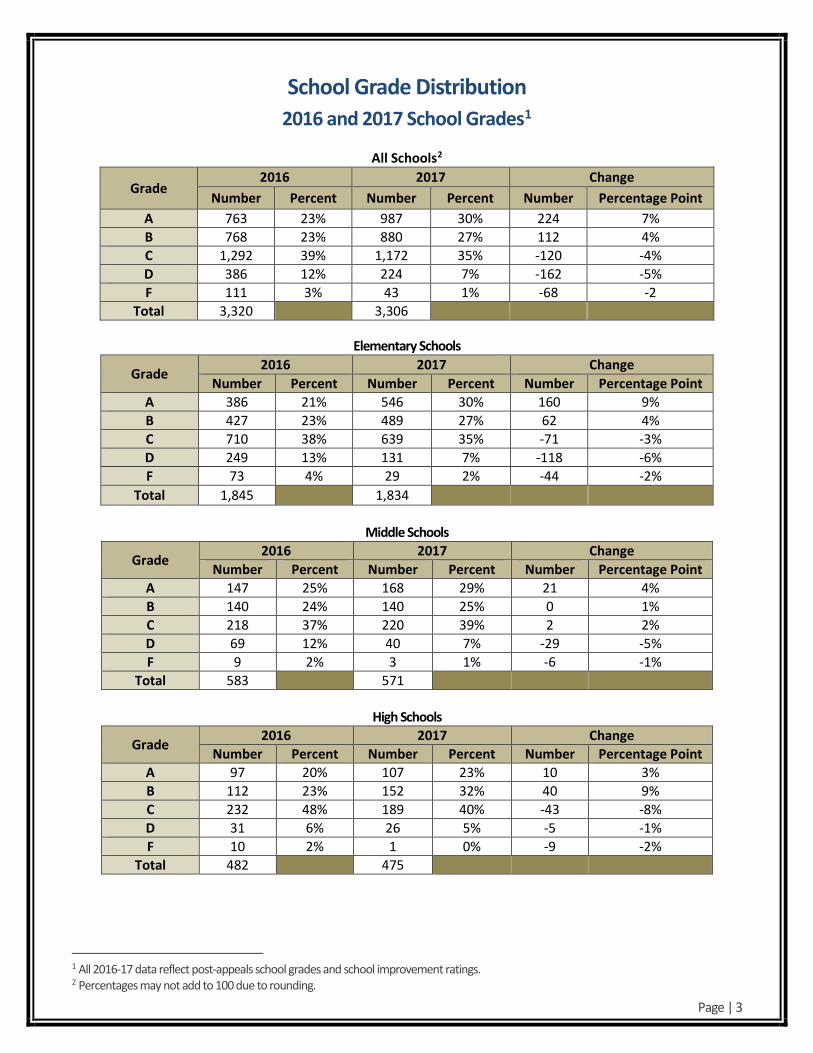
School Grade Distribution 2016 and 2017 School Grades1
All Schools2
Grade 2016 2017 Change
Number Percent Number Percent Number Percentage Point A 763 23% 987 30% 224 7% B 768 23% 880 27% 112 4% C 1,292 39% 1,172 35% -120 -4% D 386 12% 224 7% -162 -5% F 111 3% 43 1% -68 -2
Total 3,320 Blank 3,306 Blank Blank Blank
Elementary Schools
Grade 2016 2017 Change Number Percent Number Percent Number Percentage Point
A 386 21% 546 30% 160 9% B 427 23% 489 27% 62 4% C 710 38% 639 35% -71 -3% D 249 13% 131 7% -118 -6% F 73 4% 29 2% -44 -2%
Total 1,845 Blank 1,834 Blank Blank Blank
Middle Schools
Grade 2016 2017 Change
Number Percent Number Percent Number Percentage Point A 147 25% 168 29% 21 4% B 140 24% 140 25% 0 1% C 218 37% 220 39% 2 2% D 69 12% 40 7% -29 -5% F 9 2% 3 1% -6 -1%
Total 583 Blank 571 Blank Blank Blank
High Schools
Grade 2016 2017 Change Number Percent Number Percent Number Percentage Point
A 97 20% 107 23% 10 3% B 112 23% 152 32% 40 9% C 232 48% 189 40% -43 -8% D 31 6% 26 5% -5 -1% F 10 2% 1 0% -9 -2%
Total 482 Blank 475 Blank Blank Blank
1 All 2016-17 data reflect post-appeals school grades and school improvement ratings. 2 Percentages may not add to 100 due to rounding.

Page | 4
Combination Schools3
Grade 2016 2017 Change Number Percent Number Percent Number Percentage Point
A 133 32% 166 39% 33 7% B 89 22% 99 23% 10 1% C 132 32% 124 29% -8 -3% D 37 9% 27 6% -10 -3% F 19 5% 10 2% -9 -3%
Total 410 Blank 426 Blank Blank Blank
Average Percent of Points Earned 2016 and 2017 School Grades
Percent of Points Earned by Letter Grade
Grade Scale Average Percent of
Points Earned Change 2016 2017
A 62% of points or greater 69% 70% 1% B 54% to 61% of points 57% 57% 0% C 41% to 53% of points 47% 48% 1% D 32% to 40% of points 37% 37% 0% F 31% of points or less 24% 24% 0%
All Graded Schools Blank 53% 56% 3%
3 Percentages may not add to 100 due to rounding.

Page | 5
School Grades by School Type in 2017
546
168
107
166
489
140 152
99
639
220189
124131
4026 2729
3 1 100
100
200
300
400
500
600
700
Elementary Middle High Combination
A B C D F
Source: Florida Department of Education

Page | 6
All Schools 2016 Compared to 2017
blank blank 2017 School Grade
blank blank A B C D F Total
2016
Sch
ool G
rade
A 670 77 12 0 0 759
B 232 415 113 2 0 762
C 67 326 791 92 4 1,280
D 5 42 208 107 10 372
F 2 10 36 16 18 82
Total 976 870 1,160 217 32 3,255
The chart above compares the grades schools earned in 2016 with the grades they earned in 2017. Schools in the cells shaded green increased their school grade in 2017. Schools in the cells shaded red had a reduction in their school grade. Schools in the cells shaded yellow had no change in their school grade.
• 944 schools (29%) increased their grade in 2017 • 310 schools (10%) decreased their grade in 2017 • 2,001 schools (61%) had no change in their grade in 2017
Source: Florida Department of Education

Page | 7
70% of Schools Graded “D” or “F” in 2016 Improved Their Grade in 2017
Increased Their Grade70%
Did Not Increase
Their Grade30%
There were 454 “D” or “F” schools in 2016 that received a school grade in 2017. Of these “D” or “F” schools in 2016, 319 improved their grade.
Source: Florida Department of Education

Page | 8
78% of Schools Graded “F” in 2016 Improved Their Grade in 2017
2 Improved to an "A"
10 Improved to a "B"
36 Improved to a "C"
16 Improved to a "D"
18 Remained an "F"
There were 82 “F” schools in 2016 that received a school grade in 2017. Of these “F” schools in 2016, 2 improved to an “A”, 10 improved to a “B”, 36 improved to a “C”, 16 improved to a “D” and 18 remained an “F.”
Source: Florida Department of Education

Page | 9
71% of Low-Performing Schools for which Turnarond Plans were presented before the State Board of Education in July 2016
Improved to a “C” or Greater
1 Improved to an "A"2 Improved to a "B"
27 Improved to a "C"
12 Remained a "D" or "F"
Of the 42 low-performing schools for which turnaround plans were presented before the State Board of Education July 2016 meeting, 1 improved to an “A,” 2 improved to a “B,” 27 improved to a “C” in 2017. Twelve schools remained a “D” or “F” in 2017. Note, an additional 3 schools reconfigured or closed prior to the start of the 2016-17 school year.

Page | 10
Florida’s Focus on Low-Performing Schools is Paying Off The number of “D” or “F” schools has declined 54% since 2015 and the number of “F” schools has declined 79% since 2015.
573
497
267
0
100
200
300
400
500
600
700
2015 2016 2017D F
In 2017, there were a total of 267 “D” or “F” schools, down from 497 in 2016 and 573 in 2015. In 2017, there were a total of 43 “F” schools, down from 111 in 2016 and 205 in 2015.

Page | 11
School Improvement Ratings for Alternative Schools and
Exceptional Student Education Center Schools
School improvement ratings are calculated for alternative schools and exceptional student education (ESE) center schools that choose to receive a school improvement rating in lieu of a school grade, as defined in Rule 6A-1.099822, Florida Administrative Code (F.A.C.), Rule 6A-1.099828, F.A.C., and under the authority of Sections 1008.341 and 1008.3415, Florida Statutes (F.S.). Components Schools that elect a school improvement rating in lieu of a school grade will have the rating based on student learning gains for English language arts and/or mathematics, including retake assessments and concordant scores; schools will be rated on only those components for which they have sufficient data. Sufficient data exists when at least ten students are eligible for inclusion in the calculation for the component; eligibility criteria are described within the guide to calculations, which can be found at http://schoolgrades.fldoe.org/.
English Language Arts Learning Gains – This component includes student performance on statewide standardized English language arts assessments, including retake assessments and concordant scores, and measures student growth from one year to the next year beginning from grade 3 to grade 4.
Mathematics Learning Gains – This component includes student performance on statewide standardized mathematics assessments, including the comprehensive assessments, EOC assessments, retake assessments, and concordant scores. This component measures student growth from one year to the next year beginning from grade 3 to grade 4.
School Improvement Ratings Calculation The points earned for each component for which there are sufficient data are added together and divided by the total number of possible points to determine the percentage of points earned. School Improvement Ratings Percentages
• Commendable = 50% of points or greater • Maintaining = 26% to 49% of points • Unsatisfactory = 25% of points or less
Percent Tested Schools must test at least 80 percent of their students in order to receive a rating. To be eligible for a rating of Commendable, a school must test 90 percent or more of their students. Resources The Florida statutes that provide the framework for the school improvement rating calculations are at the following links: Section 1008.341, F.S. and Section 1008.3415, F.S. The rule State Board of Education rule that more specifically defines the school improvement rating calculation and can be found at the following link: Rule 6A-1.099822, F.A.C.
School Improvement Rating Distribution: All Schools4
Rating 2016 2017 Change Number Percent Number Percent Number Percentage Point
Commendable 5 4% 40 20% 35 16% Maintaining 69 53% 129 65% 60 12%
Unsatisfactory 55 43% 30 15% -25 -28% Total 129 Blank 199 Blank Blank Blank
4 Percentages may not add to 100 due to rounding.

Page | 12
District Grades for 2017 The commissioner assigns a letter grade of A, B, C, D, or F to each school district annually as provided in s. 1008.34(5), F.S., and rule 6A-1.09981 School and District Accountability, F.A.C., based on the components and processes for school grades. The district’s grade is calculated as if the district’s students are enrolled in one large combination school. All students who are full-year enrolled in the district will be included in the district’s grade. This means that students who were not full-year enrolled at an individual school but who were full-year enrolled within the district will be included in the district’s grade.
Detailed information on district grades is available at http://schoolgrades.fldoe.org (see the link “District Grades”).
Source: Florida Department of Education

Page | 13
2017 School Grades by District District Name
School Grades within the District (Counts) A B C D F
ALACHUA 17 17 11 3 0 BAKER 2 1 2 0 0 BAY 11 10 15 2 1 BRADFORD 0 1 6 0 1 BREVARD 36 27 23 6 0 BROWARD 88 62 127 11 5 CALHOUN 1 3 1 0 1 CHARLOTTE 4 10 4 1 0 CITRUS 1 14 4 0 0 CLAY 12 19 11 0 1 COLLIER 25 15 13 1 0 COLUMBIA 5 4 4 1 0 DADE 170 120 126 22 2 DESOTO 0 0 2 3 0 DIXIE 0 1 3 0 0 DUVAL 46 41 65 17 1 ESCAMBIA 9 9 22 9 2 FLAGLER 2 6 3 1 0 FRANKLIN 1 0 1 0 0 GADSDEN 2 1 5 3 2 GILCHRIST 2 2 0 0 0 GLADES 0 2 3 0 0 GULF 0 3 1 0 0 HAMILTON 0 0 0 3 1 HARDEE 1 4 1 1 0 HENDRY 0 1 7 2 0 HERNANDO 5 9 10 1 0 HIGHLANDS 0 5 10 1 0 HILLSBOROUGH 64 44 105 34 4 HOLMES 1 2 4 0 0 INDIAN RIVER 5 6 12 1 0 JACKSON 2 5 4 0 0 JEFFERSON 0 0 0 2 0 LAFAYETTE 0 1 1 0 0 LAKE 6 16 24 0 0 LEE 24 26 39 7 0 LEON 15 9 16 4 0 LEVY 0 3 7 0 0 LIBERTY 0 0 3 0 1 MADISON 2 0 4 1 0 MANATEE 14 13 22 11 0 MARION 5 12 29 5 2

Page | 14
2017 School Grades by District District Name
School Grades within the District (Counts) A B C D F
MARTIN 9 9 3 0 0 MONROE 8 8 0 0 0 NASSAU 7 5 0 0 0 OKALOOSA 25 9 2 0 0 OKEECHOBEE 1 0 7 0 0 ORANGE 66 53 73 15 4 OSCEOLA 11 21 27 1 0 PALM BEACH 72 48 69 9 8 PASCO 21 23 39 3 0 PINELLAS 33 30 56 6 3 POLK 25 23 57 17 3 PUTNAM 3 0 7 10 1 ST. JOHNS 25 7 5 0 0 ST. LUCIE 6 18 14 3 0 SANTA ROSA 12 12 3 0 0 SARASOTA 28 14 7 1 0 SEMINOLE 26 25 9 2 0 SUMTER 3 3 2 0 0 SUWANNEE 1 3 2 0 0 TAYLOR 0 0 4 0 0 UNION 1 2 0 0 0 VOLUSIA 11 30 28 3 0 WAKULLA 3 3 2 0 0 WALTON 7 4 2 1 0 WASHINGTON 0 4 2 0 0 FL VIRTUAL 0 1 1 0 0 FAU LAB SCH 2 0 0 0 0 FSU LAB SCH 2 0 0 0 0 FAMU LAB SCH 0 0 1 0 0 UF LAB SCH 1 0 0 0 0

Page | 15
2017 School Grades by District District Name
School Grades within the District (Percentages)5 A B C D F
ALACHUA 35% 35% 23% 6% 0% BAKER 40% 20% 40% 0% 0% BAY 28% 26% 38% 5% 3% BRADFORD 0% 13% 75% 0% 13% BREVARD 39% 29% 25% 7% 0% BROWARD 30% 21% 43% 4% 2% CALHOUN 17% 50% 17% 0% 17% CHARLOTTE 21% 53% 21% 5% 0% CITRUS 5% 74% 21% 0% 0% CLAY 28% 44% 26% 0% 2% COLLIER 46% 28% 24% 2% 0% COLUMBIA 36% 29% 29% 7% 0% DADE 39% 27% 29% 5% 0% DESOTO 0% 0% 40% 60% 0% DIXIE 0% 25% 75% 0% 0% DUVAL 27% 24% 38% 10% 1% ESCAMBIA 18% 18% 43% 18% 4% FLAGLER 17% 50% 25% 8% 0% FRANKLIN 50% 0% 50% 0% 0% GADSDEN 15% 8% 38% 23% 15% GILCHRIST 50% 50% 0% 0% 0% GLADES 0% 40% 60% 0% 0% GULF 0% 75% 25% 0% 0% HAMILTON 0% 0% 0% 75% 25% HARDEE 14% 57% 14% 14% 0% HENDRY 0% 10% 70% 20% 0% HERNANDO 20% 36% 40% 4% 0% HIGHLANDS 0% 31% 63% 6% 0% HILLSBOROUGH 25% 18% 42% 14% 2% HOLMES 14% 29% 57% 0% 0% INDIAN RIVER 21% 25% 50% 4% 0% JACKSON 18% 45% 36% 0% 0% JEFFERSON 0% 0% 0% 100% 0% LAFAYETTE 0% 50% 50% 0% 0% LAKE 13% 35% 52% 0% 0% LEE 25% 27% 41% 7% 0% LEON 34% 20% 36% 9% 0% LEVY 0% 30% 70% 0% 0% LIBERTY 0% 0% 75% 0% 25% MADISON 29% 0% 57% 14% 0%
5 Percentages may not add to 100 due to rounding.

Page | 16
2017 School Grades by District District Name
School Grades within the District (Percentages)5 A B C D F
MANATEE 23% 22% 37% 18% 0% MARION 9% 23% 55% 9% 4% MARTIN 43% 43% 14% 0% 0% MONROE 50% 50% 0% 0% 0% NASSAU 58% 42% 0% 0% 0% OKALOOSA 69% 25% 6% 0% 0% OKEECHOBEE 13% 0% 88% 0% 0% ORANGE 31% 25% 35% 7% 2% OSCEOLA 18% 35% 45% 2% 0% PALM BEACH 35% 23% 33% 4% 4% PASCO 24% 27% 45% 3% 0% PINELLAS 26% 23% 44% 5% 2% POLK 20% 18% 46% 14% 2% PUTNAM 14% 0% 33% 48% 5% ST. JOHNS 68% 19% 14% 0% 0% ST. LUCIE 15% 44% 34% 7% 0% SANTA ROSA 44% 44% 11% 0% 0% SARASOTA 56% 28% 14% 2% 0% SEMINOLE 42% 40% 15% 3% 0% SUMTER 38% 38% 25% 0% 0% SUWANNEE 17% 50% 33% 0% 0% TAYLOR 0% 0% 100% 0% 0% UNION 33% 67% 0% 0% 0% VOLUSIA 15% 42% 39% 4% 0% WAKULLA 38% 38% 25% 0% 0% WALTON 50% 29% 14% 7% 0% WASHINGTON 0% 67% 33% 0% 0% FL VIRTUAL 0% 50% 50% 0% 0% FAU LAB SCH 100% 0% 0% 0% 0% FSU LAB SCH 100% 0% 0% 0% 0% FAMU LAB SCH 0% 0% 100% 0% 0% UF LAB SCH 100% 0% 0% 0% 0%