Embed Size (px)
Citation preview

GRADING & BASE
MANUAL
Developed by
Geotechnical Section
Grading & Base Unit
March 18, 2016

Foreword
Grading and Base construction utilizes large quantities of materials. The control of the quality
and placement of these materials involves the application of various test procedures and
inspection techniques to ensure the materials and the manner in which they are placed comply
with the specification requirements.
The manual’s procedures help ensure uniformity of methods and that materials are placed as
specified.
Grading and Base Engineer
Minnesota Department of Transportation
Preface
The final control of the quality of materials and their use is accomplished by the Engineer and
Inspectors. Field personnel verify that materials meet the specifications, and procedures are
followed.
This manual specifies: sampling, testing and inspection requirements. Emphasis has been
placed on procedures for field use and the application of the test results in controlling aggregate
production and construction methods. Included is a section on soils classification.

Table of Contents
5-692.000 General ........................................................................................................................1
5-692.001 Duties of the Inspector ................................................................................................1
5-692.002 Grading Construction ..................................................................................................2
5-692.003 Base Construction .......................................................................................................4
5-692.100 Sampling, Random Sampling and Splitting ................................................................5
5-692.101 Sampling, Random Sampling and Splitting - General ................................................5
5-692.102 General Sampling Requirements ................................................................................6
5-692.103 Rate of Sampling (Schedule of Materials Control) ....................................................6
5-692.104 Sampling at the Source (Contractor) ..........................................................................6
5-692.106 Sampling for Embankment Construction ...................................................................6
5-692.107 Sampling from the Road for Base, Surface and Shoulder Aggregates .......................6
5-692.110 Quality Control (QC) Testing, Sampling and Certification ........................................6
5-692.111 Contractor Control Charts and Tables ........................................................................7
5-692.120 Verification Testing (VT): Roadway Materials Sampling and Testing .....................8
5-692.125 Random Sampling Procedures ....................................................................................8
5-692.130 Non-Random Sampling ............................................................................................14
5-692.135 Sampling for Proctor (Moisture Density Test) .........................................................14
5-692.140 Splitting .....................................................................................................................15
5-692.141 Quartering Method of Sample Size Reduction .........................................................15
5-692.142 Ring and Cone Method of Sample Size Reduction ..................................................16
5-692.143 Riffle Splitter Method of Sample Size Reduction ....................................................18
5-692.150 Independent Assurance (IA) Sampling and Testing .................................................18
5-692.160 Sample Identification Card .......................................................................................19
5-692.170 Documentation ..........................................................................................................20
5-692.180 Sampling Bituminous Stabilized Materials ..............................................................21
5-692.181 Sampling for Stabilized Full Depth Reclamation (SFDR) Mix Design ...................22
5-692.182 Sampling for Cold In-Place Recycling (CIR) Mix Design .......................................22
5-692.200 Methods of Testing ...................................................................................................23
5-692.201 Test for Shale in Coarse Aggregate – Pick Method ..................................................23
5-692.202 Test for Shale in Fine Aggregate – Float Method ....................................................23
5-692.203 Field Test to Determine Crushing (%) - Conveyor Belt Method .............................23
5-692.204 Determination of Crushing (%) - By Crushed Particle Count of + No. 4 ................25
5-692.215 Sieve Analysis Test Procedure (Gradation) ..............................................................28
5-692.216 Washing & Drying Gradation Samples Containing Salvaged Bituminous ..............32
5-692.222 Moisture-Density Test Method (Proctor) .................................................................33

5-692.231 Calibration of Sand Cone and Ring ..........................................................................49
5-692.232 Calibration of Standard Sand ....................................................................................49
5-692.245 Moisture Test ............................................................................................................52
5-692.246 Field Density Test: Sand Cone Method ....................................................................63
5-692.247 Sampling and Inspection – Field Density .................................................................63
5-692.248 Field Density Test Procedure ....................................................................................63
5-692.251 Relative Density ........................................................................................................66
5-692.253 Relative Moisture ......................................................................................................68
5-692.255 Dynamic Cone Penetrometer (DCP).........................................................................70
5-692.256 Light Weight Deflectometer Procedure & Target Value Determination ..................77
5-692.260 Pulverization Determination for Binder Soils ..........................................................82
5-692.270 Test Rolling...............................................................................................................83
5-692.280 Moisture-Density Test Using Modified Effort .........................................................85
5-692.281 Moisture Test for Bituminous Stabilized Materials ..................................................90
5-692.282 In-Place Density Using Nuclear Methods ................................................................91
5-692.284 Measuring Grinding Depth in the Field ....................................................................93
5-692.285 Measuring Expansion Ratio and Half-Life of Foamed Asphalt in the Field ............93
5-692.286 Measuring Field Application Rates for Cement or Bituminous Materials ...............95
5-692.288 Soil-Cement Laboratory Design Procedure ..............................................................96
5-692.290 SFDR Mix Design Procedure ...................................................................................98
5-692.291 CIR Mix Design Procedure.....................................................................................104
5-692.293 Field Gradation Procedure for CIR & SFDR..........................................................110
5-692.300 Reports ....................................................................................................................111
5-692.301 Grading and Base Reports ......................................................................................111
5-692.315 Materials Certification ............................................................................................113
5-692.316 Project Compliance Review ...................................................................................115
5-692.400 Field Inspection of Materials ..................................................................................116
5-692.401 Culvert Inspection and Installation .........................................................................116
5-692.430 Grading and Base Conversion Factors (English) ....................................................118
5-692.500 Treatment & Stabilization of Soils/Bases ...............................................................120
5-692.515 Use of Calcium Chloride For Dust Control ............................................................120
5-692.521 Use of Lime to Dry Soil ..........................................................................................120
5-692.600 Soil Classification Introduction ..............................................................................122
5-692.601 Soil Identification ...................................................................................................122
5-692.602 Pedological Classification.......................................................................................122
5-692.603 Primary Classifier (Texture) ...................................................................................123

5-692.604 Secondary Classifiers ..............................................................................................133
5-692.605 Organic Soils...........................................................................................................135
5-692.606 AASHTO Classification .........................................................................................136
5-692.607 Soil Selection Guide for Field Inspectors ...............................................................142
5-692.620 Soil Profile ..............................................................................................................146
5-692.621 Definition (Soil Profile) ..........................................................................................146
5-692.622 Development of Soil Profile ...................................................................................147
5-692.623 Prairie Soils .............................................................................................................148
5-692.624 Forest Soils .............................................................................................................148
5-692.625 Types of Surficial Geological Deposits in Minnesota ............................................148
5-692.630 Soil Selection ..........................................................................................................153
5-692.700 Formulas and Computations ...................................................................................155
5-692.702 Computing Stabilized Gravel Mixture ....................................................................155
5-692.703 Computation of Quantities for Base Construction ..................................................155
5-692.704 Determining Quantities (per mile) for Base Construction Ingredients ...................156
5-692.705 Procedures for “Rounding Off” ..............................................................................157
5-692.706 English-Metric Equivalent Gradation Sieve Sizes..................................................159

1
5-692.000 General
5-692.001 Duties of the Inspector
A. General
1. The primary duty of the Inspector is to observe the materials and procedures to ensure that
the project is constructed in conformance with the plans, specifications and special
provisions.
2. Verify that the materials used meet requirements and are incorporated into the work in
accordance with the specifications. Materials control is accomplished by sampling, testing
and observation. The sampling and testing procedures are part of the contract and are used as
the basis for accepting or rejecting the materials. Any deviations from this manual must be
documented.
3. Tests are a tool to assist the Inspector to evaluate the work. If results do not agree with what
is observed, the Inspector should investigate immediately to determine why. For example, if
the embankment area is hard and firm, but the density test indicates that the density fails to
meet requirements, the Inspector should immediately inspect the test area and re-test.
B. Preliminary Work
Before starting work, the inspector is responsible for reviewing and understanding:
the plans and proposal
sources of materials including borrow and gravel pits
planned limits of select soils
depth and disposition of topsoil
compaction and moisture requirements
disposal of unsuitable soils
preparation of sub-foundation and culverts
details of swamp (muck) excavation
fill and overload
Contact the Engineer regarding any concern, or confusion with these items. The District Soils
Engineer can provide clarification of design intent and the Grading and Base Unit can provide
interpretation of specifications/ special provisions and materials control schedule items. Other
items can be resolved in the Pre-Construction conference with the Contractor.
B.1 Grading Projects
Conduct a preliminary field inspection to gain familiarity with the project.
Examine cut faces on grading projects for soil type information
Examine auger boring information and take additional borings, if needed to determine the
approximate limits of each major soil type

2
Take samples of the major soil types, perform proctor tests and retain samples for reference
during construction.
B.2 Base Projects
Conduct a preliminary field inspection to gain familiarity with the project.
Examine the grade for weak areas. Record the location of these areas and obtain auger
borings
If the borings indicate the need for a possible subgrade correction, consult the soils engineer for
recommendations.
5-692.002 Grading Construction
A. Preparation of Embankment Areas
Prepare the embankment area in accordance with 2105 or 2106, “Excavation and Embankment”
and reserve the topsoil in accordance with the Specifications.
Locate culverts and locations and see that required treatments are staked to provide the required
tapers. See Section “5-692.401, Culvert Inspection and Installation” for culvert inspection and
installation.
B. Excavation Areas
The Contractor should maintain excavation areas in a well-drained condition at all times.
Excavation areas that trap water are in violation of the specifications.
Examine soils being excavated for use in embankment construction. The best materials should
be selected for use in the upper portion of the embankments, and the poorer soils should be
placed in the lower portion. Dispose of unsuitable soils in accordance with the specifications.
Soil selection is one of the most important functions of the grading inspector. The grade is the
foundation for the roadway. The materials selected as a foundation should be the best available.
For most grading projects, a soil survey has been made prior to design to determine what kinds
of soil will be uncovered at or near grade line. Samples of these soils have been tested and their
engineering properties evaluated. This information is applied to the design to make use of the
best soils where they will do the most good and the poorest soils where they will have the least
detrimental effect.
There are several tools available to the inspector to assist in soil selection. They are Soil
Classification and Identification by texture, identification by soils groups and the use of the
Group Index.
Section, “5-692.600, Soil Classifiation Introduction” covers the following:
1. Soil Classification and Identification by texture
2. Identification by soils group
3. Group Index
Items 2 and 3 are determined from tests made in the laboratory. However, those values have
been determined for samples tested in connection with the soils survey. Copies of these test
results should be obtained from the District Soils Engineer and used for reference.

3
Every effort should be made to select soils in such a manner that a roadbed composed of uniform
soils is obtained, particularly in the upper three feet of the grade.
The Contractor's foreman should be advised as to where the inspector wants the soils placed in
the embankment. It is easier to obtain cooperation before the soils are hauled to the embankment
area. In ordering selection or mixing of soils, the inspector should be aware of the restrictions
imposed in 2105 or 2106.
C. Excavation Below Grade
Subcuts should be excavated to the planned dimensions. Prepare the bottom of the subcut in
accordance with Specification 2105.3E or 2106.3E, “Placing Embankment Materials”.
In cases where the bottom of the subcut will not support the equipment and the backfill is placed
in one layer in accordance with the provisions of 2105.3E or 2106.3E, “Placing Embankment
Materials” it is desirable to end dump; then mix and spread thick layers with a dozer. Do not
permit the use of compactive equipment that will distort the bottom of the subcut.
If the open subcut reveals wet conditions, or badly mixed soils and no treatment for these
conditions is provided in the contract, consider providing either granular or a more uniform soil
backfill. Consult the District Soils Engineer and follow the given recommendations.
If unsuitable soils are encountered below the planned subcut, additional excavation may be
required. Contact the Project Engineer and the District Soils Engineer and follow their
recommendations
D. Spreading and Compacting
Embankment Materials, see 2105.3E or 2106.3E, “Placing Embankment Materials” and 2105.3F
or 3106.3F, “Compacting Embankments”.
Make every effort to achieve sufficient mixing in order to prevent large pockets of different
classes of soils from being placed in localized areas. The work should be observed to ensure that
compaction equipment operates uniformly over the entire embankment areas.
E. Control Testing for Embankment Construction
All granular items should be tested by the Contractor and certified on Form G&B-104,
“Certification of Aggregates and Granular Materials” prior to delivery and placement on the
project. The Contractor’s testing rate should be sufficient to guarantee that uniform acceptable
material is being delivered to the project. The Project Engineer is responsible for acceptance
testing in accordance with the Schedule of Materials Control.
The Moisture-Density (Proctor) Test, Field Density Test and Field Moisture Test are used to
determine compliance with the specifications. These tests are tools to be used by the Inspector to
verify visual observations. As far as possible, the Inspector should strive to keep testing at a
minimum and do more visual inspection.
Whenever a moisture-density (Proctor) determination is made, retain a sample in a moist
condition and place it in a glass jar with a screw-on cap. Record the curve number, textural
classification, maximum density and optimum moisture on a label affixed to the jar. See section,
“5-692.600, Soil Classification Introduction”.
The field moisture test, “5-692.245, Moisture Test” is used to determine compliance with the
specification for moisture at the time of compaction. Obtain the sample for this test while the

4
material is being compacted. The sample should represent the work being done. This requires
close observation of the work.
The field density test, “5-692.246, Field Density Test: Sand Cone Method” is used to determine
compliance with the compaction specification. Coordinate this test with close visual inspection.
The Quality compaction specification requires close visual inspection of the entire operation by
an experienced inspector. Continuous observation of uniform compactive effort and moisture
control are crucial to the successful use of this specification.
Much unnecessary testing can be avoided by good visual inspection. Observation of the work to
ensure uniform compaction effort and moisture control will reduce the required number of tests.
Close inspection of a grade meeting requirements plus picking with a sharp tool will give an
inspector a good idea of what the passing grade should be like. Other areas can be checked in
this manner and only a sufficient number of tests should be made to verify the inspector's
judgment. Areas failing or yielding under construction traffic should be investigated and
corrected.
F. Measurement
Measure and document all pay items according to the provisions in Specification 1901 and 5-
591.410, “Documentation of Pay Quantities” of the Contract Administration Manual.
5-692.003 Base Construction
A. Subgrade Preparation (Specification 2112)
Take density tests as required of in-place subgrade and new embankment. Test in areas most
likely to fail. Failing or yielding areas under construction traffic should be investigated and
corrected.
Check the grade for compliance with tolerance requirements. It is not necessary to check all
points. Spot check short sections of 300 - 500 feet. If the Contractor is checking the grade,
observe and record his measurements.
B. Aggregate Gradation
Take samples for gradation when the material is mixed and is ready for compaction, i.e. “after
spreading and before compaction”. Sample and test in accordance with section, “5-692.215,
Sieve Analysis Test Procedure (Gradation) and section “5-692.125, Random Sampling
Procedures”.
Specifications 3138 & 3149 provide crushing requirements for Classes 5, 5Q, 6, drainable bases,
and for Aggregate Bedding and Stabilizing Aggregate, respectively. Determine the percent of
crushing in accordance with section, “5-692.203, Field Test to Determine Crushing (%) -
Conveyor Belt Method”, and section, “5-692.204, Determination of Crushing (%) - By Crushed
Particle Count of + No. 4.
Shale requirements are also specified in 3138. The testing rate is determined by the Engineer
based on past record from that source or preliminary tests.
C. Use of Recycled Materials
The use of recycled materials in 3138, “Aggregate for Surface and Base Courses” may be subject
to added testing requirements and/or restrictions. For example, there may be a maximum
bitumen content.

5
D. Moisture Control
Take moisture control samples from the windrow after water has been applied at the time of
compaction.
E. Spreading and Compacting
The spreading process acts as another mixing step to make the aggregate more uniform.
F. Compaction Control
Maximum lift thickness of base aggregate layers may depend upon the amount of bitumen
content and the type of compactive equipment, see specification.
Perform density and moisture testing per the project’s Schedule of Materials Control.
Materials that contain a high percentage of crushed particles tend to resist consolidation by
normal compaction methods. The inspector should carefully monitor moisture and layer
thickness to assure adequate compaction with minimal damage to the particle size and shape.
Recycled materials may not be as durable or sound as virgin aggregates. Most of these materials
are susceptible to degradation by excessive compactive efforts.
G. Workmanship and Quality
It is not required to check tolerance on each class of material. Only the final layer of base is
required to meet tolerance requirements. Construct intermediate layers in reasonably close
conformity with the cross-section shown in the plans.
H. Measurement
Measure and document all pay items according to the provisions in specification 1901 and
section 5-591.410 of the Contract Administration Manual.
5.692.100 Sampling, Random Sampling and Splitting
5-692.101 Sampling, Random Sampling and Splitting - General
This Section describes the following:
General Sampling Requirements
Rate of Sampling
Contractor Quality Control (QC)
Agency Quality Assurance Testing (QA)
Random Sampling
Non-Random Sampling
Splitting
Sampling for Independent Assurance (IA) Sample
Special Sampling for Individual Tests
Sample Identification
Documentation

6
5-692.102 General Sampling Requirements
Ensure that the sample represents the material being placed. Sample after spreading and
prior to compaction.
Use a square head shovel to obtain samples.
Do not mix underlying material with the sample.
Use a separation fabric (such as a geotextile or a polyethylene sheet) when sampling layers
less than four inches thick. Separation fabric may also be used for thicker layers.
Note: place separation fabric at the bottom of the layer to be sampled. After material is placed,
but before it is compacted, collect the material placed upon the separation fabric, as the test
sample.
Label and store in a sample bag, plastic pail or other suitable container.
Deliver samples as soon as possible.
5-692.103 Rate of Sampling (Schedule of Materials Control)
The Schedule of Materials Control outlines the minimum required sampling and testing rates.
Always use the Schedule included in the contract, as requirements and rates may change.
Take additional samples when there is an unusual variation of material properties. Compute an
average, to determine compliance, using these additional tests results along with your original
testing results.
5-692.104 Sampling at the Source (Contractor)
Obtain samples from a stockpile. Stockpile should be uniformly blended.
5-692.106 Sampling for Embankment Construction
Obtain the samples after spreading, but before compaction. Sample for gradation in areas most
likely to fail and sample for qualities according to the random sampling procedures in section, 5-
692.125, “Random Sampling Procedures”.
5-692.107 Sampling from the Road for Base, Surface and Shoulder Aggregates
Obtain a sample after spreading, and before compaction. Sample according to the random
sampling procedures in section, 5-692.125, “Random Sampling Procedures”.
5-692.110 Quality Control (QC) Testing, Sampling and Certification
The Contractor’s testing agent must be MnDOT certified in Grading and Base I.
Follow all applicable sampling and splitting procedures in this section, and the testing
procedures in section 5-692-200 Methods of Testing
If production test reports are required, attach all results to form G&B-104 (TP 24346),
Certification of Aggregates, either prior to delivery or with the first load of material.
The Contractor’s Authorized Representative must sign the certification.
Provide test reports to the Engineer electronically within 24 hours.

7
5-692.111 Contractor Control Charts and Tables
If required by the Contract, produce and maintain control charts and tables (see example and
Table 2).
A control chart consists of plotting the following information, for each individual sieve,
controlled by a given specification, on one graph:
Percent passing verses sample number and
Moving average using the previous four tests.
A control table summarizes the data plotted in the control chart in a tabular format.
Include the following information on each control chart and table:
class of material,
specification limits and
project number.
Additionally, include the following information on the control table:
date,
moving average,
test number and
tester Full Name and Technical Certification Number.
Round results as follows (Table 1).
Table 1 Control Chart and Table Rounding Method
Sieve Size Rounding Method
Larger than #200 1% (nearest percent)
#200 0.1% (nearest tenth of a percent)
Table 2 Class 5 Control Table Example
Test # 1 2 3 4 5 6 7 8 9 10 11 12 13 14 15 16 17 18 19 20
Result 32 36 39 35 24 27 29 30 28 31 26 25 22 20 19 25 26 25 27 28
Moving
Avg 36 34 31 29 28 28 30 29 28 26 23 22 22 22 24 26 26
Date 5/1 5/1 5/1 5/1 5/1 5/3 5/3 5/3 5/4 5/5 5/5 5/6 5/7 5/8 5/9 5/9 5/9 5/9 5/9 5/9
Tester IJ IJ IJ IJ IJ IJ IJ IJ IJ IJ IJ IJ IJ IJ IJ IJ IJ IJ IJ IJ

8
Figure 1 Example Control Chart
5-692.120 Quality Assurance (QA): Roadway Materials Sampling and Testing
Sample material according to the rate in the Schedule of Materials Control.
Sample material, according to the appropriate method per the specifications, either randomly
per section, 5-692.125, “Random Sampling Procedures”. or non-randomly per section, 5-
692.130, “Non-Random Sampling”.
5-692.125 Random Sampling Procedures
This section covers verification sampling and testing by the Random Sampling Method.
A. General
1. A Lot contains material from one pay item.
2. Lot sizes can be adjusted to allow for year-end cutoffs, lengthy interruption of work, etc., but
cannot exceed the maximum size defined in the schedule of materials control.
3. Sampling should not be done until the Contractor has notified project personnel that they
have completed all road blending and prior to compaction.
4. Lot sizes and the sampling rate are determined by the Schedule of Materials Control. The
Engineer may adjust lot size because of Contractor operations.
5. Each Lot, depending upon its’ size, should be divided into two or four sublots as defined in
the Schedule of Materials Control.
6. Divide Lots into equal quantities. Divide sublots into equal quantities.

9
7. Average the results from each Lot to determine compliance.
8. Sample selection and location is the responsibility of the Engineer.
9. Locate sample sites using GPS, pacing or a measuring device. They do not need to be
surveyed
B. Lot Determination
1. Determine number of Lots by dividing total quantity by maximum Lot size. Round to the
next higher number.
Example: Quantity = 12,000 yards
Maximum Lot size equals 5,500 yards
Number of Lots = 12,000/5,500 = 2.2, round up to 3 Lots
2. Determine Lot Size by Dividing the quantity by the number of Lots
Example: 12,000 yards/3 Lots = 4,000 yards per Lot.
3. Determine Sublot size by dividing the Lot size by two or four, whatever is applicable
(Note in most cases divide by four, see Schedule of Materials Control).
Example: 4,000 Yards/4 = 1,000 yards per sublot.
C. Testing
1. Test according to the procedures in section, “5-692.200. Methods of Testing”.
2. Report results on forms from the Grading and Base website, or on standard laboratory forms.
3. Notify the Contractor, as soon as possible, when a sample fails.
4. The Contractor is required to run new tests at the location of the failing test, when corrective
work is performed.
5. Sample and test using new randomly selected locations, after receiving new passing results
from the Contractor for corrective work.
6. Any monetary price adjustments will be determined by the most recent tests and applied to
the entire Lot.
D. Random Samples
This section describes random sample selection by using random numbers to determine sample
location.
i. Random Number Selection
Document how random numbers are obtained. You may use the method in this section or
another random number generator, but the method must be documented.
1. Chose a random starting number by randomly opening a book. Use the resulting page
number as the starting number.
2. Enter Table 3 at the top left and count vertically by columns or horizontally by rows to the
designated number chosen in step 1 above. Proceed to the next column or row, when the end
of the given column or row is reached. This is the first random number to use. Use the next

10
consecutive number, in either the column or the row, depending on which procedure is used,
as the second number and so on. Again, when reaching the end of the column or row,
proceed to the start of the next column or row, respectively. It does not matter which method
is used, only that one method is used consistently.
3. Continue to use the consecutive numbers for the rest of the project regardless of material
classification or type of test that is being sampled.
Example: Open a book to page 38. Starting at the top left (top of the first column on the left)
count down to the 38th number. The first random number is .84. From this point use
consecutive numbers, i.e., the 39th (.18) the 40th (.79), etc. for the rest of the project regardless
of material classification or type of test for that is being sampled.

11
Table 3 Tabulation of Random Number
ii. Sample Station Location
This section describes the method for determining the station number for each sample location.
This method may be adjusted to locate from one to four samples. Keep a written record of the
computations in the project file. Use the random numbers determined in” section, “C.
Testing”.”.

12
Example: For aggregate base gradations, select four (4) random tests for 10,000 tons. Assume a
6 inch layer, 52 feet in width and 135 pounds per cubic foot maximum density. The four random
numbers selected are the 38th
through the 41st (.84, .18, .79 and .75). The beginning station is
10+50.
Calculate tons per lineal feet and total lineal feet.
Tons per linear foot = (length x width x thickness x maximum density)/2,000
Where: Length, Width and Thickness are in units of feet and
Maximum Density is in units of pounds per cubic foot.
Tons per Linear Foot = (1 x 52 x 6/12 x 135)/2,000 = 1.755
Total Linear Feet = 10,000/1.755 = 5,698 Linear Feet
Calculate length and starting station for each sublot.
Four (4) sublots.
5,698/4 = 1,425 feet = 14 + 25 Stations per sublot
Note: 1,424.75 feet rounds to 1,425 feet (see 5-692.705, “Procedures for “Rounding Off”.
1 Road Station = 100 feet
(Stationing for sublots should be rounded to the nearest foot):
Starting Station for Sublot 1 from 10+50 to 24+75
Starting Station for Sublot 2 from 24+75 to 39+00
Starting Station for Sublot 3 from 39+00 to 53+25
Starting Station for Sublot 4 from 53+25 to 67+50
Calculate stationing for the four samples in each sublot.
Table 4 denotes the distance from starting station to the sample location.
Table 5 denotes station for each sample.
Table 4 Distance from Starting Station to Sample Location
Sample
Number
Random
Number
Length of
Sublot
Distance from
Starting Station
1 .84 × 1,425 feet = 1,197 feet
2 .18 × 1,425 feet = 256 feet
3 .79 × 1,425 feet = 1,126 feet
4 .75 × 1,425 feet = 1,069 feet

13
Table 5 Station for Each Sample
Sample Number Beginning Station Random Distance Sample Location
1 10+50 + 1,197 feet (11+97 Sta) = Station 22+47
2 24+75 + 256 feet (2+56 Sta) = Station 27+31
3 39+00 + 1,126 feet (11+26 Sta) = Station 50+26
4 53+25 + 1,069 feet (10+69 Sta) = Station 63+94
Of the material being placed, obtain approximately one-third (⅓) of the sample from the center,
and one-third (⅓) each of the sample from the ¼ points, and combine into one sample. Then
split for 2 tests, see Figure 2 and Figure 3.
Figure 2 Four (4) Equal Sublots
Figure 3 Cross-Section of Sampling Location
(Note figure shows material being placed across entire roadway width. Obtain sample across the
width of material being placed.)
iii. Truck Load Count Sample Method
Determine lot size and random number per above. Divide Lot size by truck size to obtain total
number of trucks required per Lot. Divide the Lot size by the number of sublots to determine the
sublot size. Apply random numbers to the sublot size to determine, which truck to sample. Take
sample from the road after spreading, but before compaction at the location where the material
from that truck was placed. Not from truck box.
Sublot1 Sublot2 Sublot3 Sublot4
Lot

14
Example: The project is under construction at several locations. Trucks hauling approximately
21 tons each will deliver 8,430 tons (Plan Quantity) of Class 5 aggregate base.
8,430 tons ÷ 21 ton/truckload (average) = 401.4 loads ≈ 401 loads
401 loads/4 ≈ 100 loads/sublot
Take samples from the approximate area these trucks place material. Table 6 denotes the truck
to be sampled.
Table 6 Station for Each Sample
Sample Number Random Number Sublot Quantity Truck Number
1 .84 × 100 Loads = Load # 84
2 .18 × 100 Loads = Load # 100 + 18 = 118
3 .79 × 100 Loads = Load # 200 + 79 = 279
4 .75 × 100 Loads = Load # 300 + 75 = 375
iv. Modifications in the Plan quantity.
Modify testing and sampling protocol for increases in Plan quantities as follows (Table 7):
Table 7 Protocol for overrun quantities
Time Plan Quantity Increased Testing and Sampling
Before Collection of first sample. Reorder sampling to account for additional
quantity.
After Collection of first sample, but before
sampling is complete.
Complete testing of current Lot, and then
reorder the sampling using the remaining
quantity.
After collection of all original Plan quantity
samples.
Order sampling for additional quantity.
5-692.130 Non-Random Sampling
When sampling materials for laboratory or field tests by the non-random sampling method,
locate the sample in the area least likely to meet specifications. Inform the Contractor of any
failure as soon as posible, but no later than 24 hours after obtaining test results. Have the
Contractor remove or modify failing materials, and retest in areas which are least likely to meet
specifications.
5-692.135 Sampling for Proctor (Moisture Density Test)
A. Grading Construction
Samples required for the proctor test should represent the material being placed. Fifty pounds of
material is necessary for a proctor test. Each sample tested should be identified by source (pit
number, pit name or station), depth, soil classification, and test results. Save a portion of each
sample from each major soil type, at about optimum moisture content, in a transparent container
for use as a reference. Use Figure 34 Triaxial Chart, as a guide in soil comparison. Label this
sample with the assocatied soil classification and test results.

15
B. Base, Subbase, and Surfacing Construction
Moisture-Density properties of base and subbase aggregates vary as the gradation of the
aggregate varies.
Record the sample location.
Sample subbase, base or shouldering aggregate from one location on the road after spreading, but
before compaction.
5-692.140 Splitting
5-692.141 Quartering Method of Sample Size Reduction
A. General
The quartering method of sample size reduction works best on damp material. Quarter sample
on a concrete slab, new plywood or sheet metal deck or similar smooth, clean floor area, about 4’
× 4’. Mechanical devices meeting AASHTO R 47 may be used; follow that standard and the
manufacturer’s procedures.
B. Procedures
See Figure 4.
1. Dump the sample onto the clean floor area.
2. By shoveling, move the sample to an adjacent area and form a continuous cone by emptying
the shovel directly over the center (Figure 4, Top Left).
3. Repeat the coning until the sample is thoroughly mixed.
4. With a shovel or other device, make a clean pass bisecting the cone vertically (Figure 4, Top
Right).
5. Draw the halves away from each other.
6. Bisect the halves (Figure 4, Bottom Left).
7. Combine diagonally opposite quarters to form a sample (Figure 4, Bottom Right). If the
sample is still larger than desired repeat Step 1 thru 7. In this case, piles B & D were
combined.

16
Figure 4 Quartering Method of Sample Size Reduction
5-692.142 Ring and Cone Method of Sample Size Reduction
A. General
The ring and cone method is usually used for large quantities of material and requires more
working area than the other sample reduction methods. The radius of the ring is determined by
the weight of the sample and should be equal in feet to 1/40th of the sample weight in pounds.
For instance, a 400 lb. sample requires a radius of 10 ft. (20 feet in diameter).
B. Procedure
Dump the entire sample onto the clean floor area. By shoveling, move the sample to an adjacent
area and form a continuous cone by emptying the shovel directly over the center. Repeat the
coning until the sample is mixed thoroughly (Figure 5 (a))
1. Place a rake or trowel at the top of the cone, push down and pull a portion of sample out to
the required radius (Figure 5 (b)).

17
footperlbs
lbsSampleofWeightfeetRadiusquired
40
)()(Re
2. Move to a position opposite Step 1 and repeat Step 1 (Figure 5 (c)).
3 & 4. Repeat Steps 1 and 2 at 900 (Figure 5 (d & e)) from the original position of Steps 1 & 2.
5. Continue Steps 1, 2, 3 and 4 (Figure 5 (f)) until the entire sample is evenly windrowed
into a ring (Figure 5 (g)).
6 & 7. Collect sample by cutting the ring at opposite points with a shovel (Figure 5 (h)). (A
sample consists of material removed from two or more pairs of opposite sections of the
ring (Figure 5 (i)).
Figure 5 Ring & Cone Method to Reduce Sample Size
a b c
d e f
g h i

18
5-692.143 Riffle Splitter Method of Sample Size Reduction
A. General
A sample splitter consists of a series of chutes running in alternately opposite directions. When a
sample is poured into the chutes, one-half of the sample runs off in each direction into collection
pans. The sample splitter works best with air-dry material. Split the sample when the material is
near optimum moisture, so that material is free flowing, and minimal dusting occurs.
B. Procedure
See Figure 6.
1. Place one collection pan on each side of the splitter allowing the chutes to extend into the
pans.
2. Thoroughly blend the sample prior to splitting to reduce sample segregation.
3. Pour the sample through the chutes (Figure 6, Left), while ensuring that the sample does not
pile up in the hopper.
4. Check sample for uniformity, recombine sample and repeat steps 1-3, if sample is not
uniform.
5. The sample may be split into smaller sizes by re-splitting the material collected on each side
of the splitter, following Steps 1 through 4 above (Figure 6, Right).
.
Figure 6 Riffle Splitter Method to Reduce Sample Size
5-692.150 Independent Assurance (IA) Sampling and Testing
Independent Assurance sampling and testing is required on all State projects that use Federal
Funding. Assurance sampling is the direct responsibility of the District Materials Engineer.

19
The purpose of this sampling is to verify the inspector's sampling, testing procedures and
equipment. The project personnel are required to notify the district materials office when any
work requiring Independent Assurance sampling has begun. The project personnel should
ensure that some scheduling lead time is provided.
Procedure:
The District Independent Assurance Inspector is required to review the tester’s sampling, testing
procedures and equipment; and to obtain laboratory samples. The Independent Assurance
Inspector will record findings.
The following procedures are recommended to obtain the maximum benefit:
1. Any Independent Assurance test or sampling procedures should be performed by the project
personnel assigned to that particular phase of the work.
2. The equipment used and procedures followed during Independent Assurance sampling and
testing should be the same as that used during the routine sampling and testing requirement
on the job.
3. If the procedure followed or equipment used does not conform to the applicable standard,
note the fact on the report and advise the tester of the corrections required for subsequent
tests.
4. Independent Assurance gradation test samples must be split samples from field gradation
samples so that the field and lab results can be compared.
5. Report the test result and the action taken by the tester, when an Independent Assurance test
is observed and the given measurement does not meet requirements.
6. If it becomes evident that a required Independent Assurance test or sample cannot be
obtained, report the type of construction, sample standard involved and the reasons for not
obtaining the test or sample.
Investigate any deviation, between an Independent Assurance test result and a companion test
result, outside the tolerances stated in Table 1003C of the MnDOT Laboratory Manual.
5-692.160 Sample Identification Card
A. General
Samples submitted to the laboratory must contain a sample identification card properly protected
against moisture and soiling. A zip-lock type sandwich bag works well.
B. Procedure for Completing Sample ID Card
1. “Field Identification”
This identifier is generated by the field inspector to assist with tracking the sample.
2. “Spec.”
Include both the specification number and class of material.
3. “S.P.”
Submit all the samples under the primary (state) project number (S.P.).
4. “Submitted by”

20
Enter the name of the submitter. If the sample is an Independent Assurance (IA) Sample, include
the IA’s name, and write “IA Sample” on the card.
5. “Proj. Engr.”
Enter the name of the project engineer.
6. “Type of material and use”
Enter what the material is to be used for and the specification.
Example: Base (3138)
Shouldering (3138)
Subgrade Soil (2105 or 2106)
Granular Material (3149)
7. “Mix Proportions”
Report the composition of virgin and recycled aggregates by type (e.g., % natural gravel, %
quarried carbonates, % quarried class A, % RAP, %RCP, % glass, etc.).
8. “Pit No.”
Give the Pit Number for 3138 samples and the pit number (or owner’s name) for 3149 samples.
9. “Source”
Provide the Pit name.
10. “Location”
Location of pit (i.e., either geographic, as in illustration, or legal description with Section, Town
and Range).
11. “Sample taken from”
Stationing of sample location.
12. “Tests required”
Example: Gradation, Shale, Proctor, LA Rattler, etc.
13. “Remarks”
If it is a split gradation sample, write the field gradation results on the back of the card. Also,
include any observations or information that would assist with evaluating the sample test results.
Include the gradation specification requirements of sample.
5-692.170 Documentation
The Engineer is responsible for maintaining a file with the following items (Table 8):

21
Table 8 Required Documentation
Form Description
G&B-001 [TP 02115] Grading and Base Report (Preliminary and Final)
G&B-104 [TP 24346]
Certification of Aggregates
(include all contractor gradation and quality test reports
required for material on hand)
− Worksheet with computations for sample locations and Lot
sizes.
G&B-101 (English) or
G&B-102 (Metric) [TP 02402]
Sieve Analysis
(for each verification test sample)
G&B-002 [TP 02154] Random Sampling Acceptance (for each Lot)
− Materials Certification Project Compliance Summary
− Documentation of Random Number Selection
5-692.180 Sampling Bituminous Stabilized Materials
A. Sampling Bituminous Materials
Sample bituminous materials per the Minnesota Department of Transportation (MnDOT)
“Bituminous Manual” 5-693.
B. Moisture Samples
1. When asphalt emulsion is used, obtain a sample from the treated material at the time the
mixture is ready for compaction.
2. When other bituminous materials are used, obtain a sample before the bituminous material is
added.
3. Refer to the Schedule of Materials Control (SMC) for required minimum sampling and
testing rates.
C. One Point Density
At each field density test location, sample for the moisture after mixing. Select 10 lbs (5 kg)
samples by direct sampling and place in an air tight container to minimize loss by evaporation.
D. Bituminous Stabilized Base (SFDR) – Proctor Test using Modified Effort
Moisture-Density properties of stabilized bases vary as the gradation of the aggregate varies.
Samples required for the proctor test should represent the material being reclaimed, 50 lbs of
material is necessary for a test.
Record the sample location.
Sample Materials from one location on the road after reclaiming/mixing, before compaction.
For Multi-Point Modified Effort Proctor, obtain samples from one location on the road after the
initial pulverization (“initial-grind”) to the depth of the reclaim layer prior to rolling and store in
a sealed container.

22
For One Point Modified Effort Proctor, obtain samples from one location on the road, after the
bituminous injection pass to the depth of the stabilized reclaim layer, and before rolling. Store in
a sealed container for no more than one hour before Proctor compaction.
5-692.181 Sampling for Stabilized Full Depth Reclamation (SFDR) Mix Design
Review data from auger borings, cores and / or other sources (i.e. pavement records, FWD
deflection data, etc.) to determine if more than one mix design is required. Perform a separate
design for SFDR projects with more than a two inch difference in bituminous surface thickness.
Sample at least 350 lbs for each mix design. Determine the individual and average thickness
values for cores or slabs. Measure the density of four cores or two slabs if the bituminous
materials are the primary component of the mix design.
Crush the bituminous materials to the gradation in Table 9 before blending with the aggregate. If
bituminous materials consist of a chip seal only, then the only requirement is that it is crushed to
100% passing the 1 in. sieve.
Table 9 Requirements for Crushed Bituminous (SFDR)
Sieve Size Percent Passing
1.25 in 100
1 in 90 – 100
¾ in 80 – 97
No. 4 30 – 55
No. 30 5 – 15
Specimens prepared for mix design shall have a maximum size passing the 1.25 in. (31.25 mm)
screen for all material components.
5-692.182 Sampling for Cold In-Place Recycling (CIR) Mix Design
Obtain cores from the areas to be recycled. Perform separate mix designs if cores show
significant differences in the type or thickness of bituminous layers among the core samples.
Sample a minimum of one core per lane mile and sample where there are visual differences in
the pavement. Cut the sampled (field cores) in the laboratory to the depth specified for the CIR
Project. Crush cores in the laboratory and perform a mix design using the medium gradation and
a minimum of one of the fine or coarse gradations using Table 10.
Table 10 Requirements for Crushed Bituminous (CIR)
Fine Medium Coarse
31.5 mm [1.25 inch] 100 100 100
25.0 mm [1.0 inch] 100 100 85-100
19.0 mm [¾ inch] 95-100 85-96 75-92
4.75 mm [No. 4] 55-75 40-55 30-45
600 µm [No. 30] 15-35 4-14 1-7
75 µm [No. 200] 1-7 0.6-3 0.1-3
Perform the mix design on these crushed millings. Determine the gradation of the crushed
millings and dry at a temperature no greater than 104°F.

23
Prepare samples with a sample splitter, otherwise dry, screen and recombine millings to the
target gradation. Suggested screens include: 1/2 inch [12.5 mm], 3/8 inch [9.5 mm], No. 4 [4.75
mm], No. 8 [2.36 mm], No. 30 [600 µm], and pan. Scalp oversize with a 1.0 inch [25.0 mm]
screen when using 3.94 inch [100 mm] diameter compaction molds.
5-692.200 Methods of Testing
5-692.201 Test for Shale in Coarse Aggregate – Pick Method
A. Scope
1. The lithological summary method is used to determine the percentage of various rock types.
This method separates shale by visual and hand sorting.
2. Follow MnDOT Laboratory Manual, Section 1209, “Lithological Count”.
5-692.202 Test for Shale in Fine Aggregate – Float Method
A. Scope
1. Follow MnDOT Laboratory Manual, Section 1207, “Lightweight Pieces in Aggregate”.
5-692.203 Field Test to Determine Crushing (%) - Conveyor Belt Method
A. Scope
Crushing will be required for Classes 5 and 6 Base Aggregate and for Aggregate Bedding and
Stabilizing Aggregate. For these classes of aggregate, crushing will be required for all stones
larger than the maximum size permitted by the gradation requirements and which will pass a
grizzly or bar grate having parallel bars spaced eight inches (200 millimeters) apart. However,
rejection of oversize material will be permitted by the Engineer when excessive crushing results
in an unsatisfactory gradation. This test is used to determine compliance with the crushing
requirements of specification 3138 at the time that the aggregate stockpile is being produced.
In the production of Class 6 aggregate, there shall be at all times not less than 15 percent of
material which shall be crushed. In the production of Class 5, Aggregate Bedding and Stabilizing
Aggregate, there shall be at all times not less than 10 percent of material which shall be crushed.
The percentage of crushing shall be determined by the weight of the material retained on a 3/4-
inch (19-millimeter) sieve.
B. Equipment
1. Containers—Pails suitable for collecting and weighing gravel samples.
2. 60 lbs (27.2 kg) capacity electronic platform scale with decimal graduations in tenths of a lb
(kg) (Interpolate reading to the nearest 0.05 lbs [kg]).
3. Sieve— Nominal Maximum size for the class of aggregate being produced (3/4” [19 mm]
sieve).
4. Square nosed shovel.
C. Test Sample
Sample according to the Schedule of Materials control. If sampling is required, obtain sample
from the belt which conveys the material from the trap to the crusher. The sample shall be taken
at a time when pit operations are normal. Stop the belt. Select a representative section on the

24
belt and remove all of the material from the selected section. This sample should weigh
approximately 30 lbs (15 kg).
D. Procedure
1. Air dry the sample to reduce the amount of fines that cling to the oversize material.
Note: Fines will not usually cling to the oversize material if the moisture content is
approximately 3% or less.
2. Weigh the total sample (should weigh approximately 30 lbs [15 kg]). Record weight (A) on
form G&B-103, “Percent Crushing Report” (Figure 7).
3. Screen the sample over the maximum required sieve size (3/4” [19mm] sieve). Use breaker
sieves as needed.
4. Determine the weight of aggregate retained on the 3/4” (19mm) sieve. Record weight (B).
5. Compute percent of crushing using the following calculations:
A = Weight of Total Sample lbs (kg)
B = Base Aggregate, Weight Retained on 3/4” (19mm) Sieve lbs (kg)
Crushing % = (B/A) x 100%
E. Examples
Note: See Figure 7.
Given:
3138 Class 5 Aggregate
Maximum Aggregate Sieve Size = 3/4” (19 mm) sieve
Minimum Crushing Required = 10%
Sample:
A = Weight of Total Sample = 32.74 lbs. (14.85 kg)
B = Base Aggregate, Weight Retained on 3/4” (19 mm) Sieve = 6.15 lbs. (2.79 kg)
Calculations:
B/A x 100% = 6.15 lbs.(2.79 kg.)/32.74 lbs.(14.85kg) x 100% = 18.8%
Therefore meets requirements.
F. Test Application
Due to the fact that samples for this test are taken before the final mixing of the aggregate,
variations in crushing percent (%) can be anticipated. It can also be anticipated that after final
mixing, has been accomplished to meet the gradation requirements that these variations will have
been eliminated in the final product. For this reason, some variation can be allowed. An
occasional deviation of up to 2% can be allowed. However, the average portion of crushing
(expressed as a percent) of all the material tested for the project shall not be less than that

25
specified. If a test exceeds the allowable tolerance, the contractor should be informed
immediately and adjustments made to obtain the required amount of crushing by possibly adding
stones or crushed rock from another source. After operations have been adjusted, a check test
should be made.
G. Reports
In the remarks field on Form G&B-001 (MnDOT TP-02115-02) “Grading and Base Report”
indicate the number of tests required, the number made and the average crushing (%).
5-692.204 Determination of Crushing (%) - By Crushed Particle Count of + No. 4
A. Scope
This method is intended to be used only when the material has been crushed into a stockpile
before an inspector was assigned to the project. For the purpose of this method, crushed particles
are defined as material that has at least one fractured face.
This method involves counting the particles of plus No. 4 (4.75 mm) material having one or
more fractured faces and computing the percent of crushing in the total sample.
In the production of Class 6 aggregate, there shall be at all times not less than 15 percent of
material which shall be crushed. In the production of Class 5, Aggregate Bedding and Stabilizing
Aggregate, there shall be at all times not less than 10 percent of material which shall be crushed.
B. Procedure
1. Obtain a representative sample weighing approximately 30 lbs. (15 kg) from the prepared
stockpile. Air-dry the sample to reduce the amount of fines that cling to the material.
Note: Usually, fines will not cling to the material if the moisture content is approximately 3%
or less.
2. Determine the Total Weight of Sample, record weight (A) (Figure 7).
3. Determine the sample's gradation in accordance with the method described in section, “5-
692.215, Sieve Analysis Test Procedure (Gradation)” to verify that the aggregate meets
specification requirements. Screen the sample and reserve the material retained on the 3/4”
(19 mm), 3/8” (9.5 mm) and No. 4 (4.75 mm) sieves.
4. Determine the weight of aggregate passing the 1” (25 mm) sieve and retained on the No. 4
(4.75 mm) sieve. Record weight (B).
5. By using the following formula, compute and record the percent of aggregate retained on the
No. 4 (4.75 mm) sieve (C):
%100,4.Re A
BCNoontainedPercent
6. Determine the weight of aggregate passing the 1” (25 mm) sieve and retained on the 3/8”
(9.5 mm) sieve. Record weight (D).
7. Determine the weight of aggregate passing the 3/8” (9.5 mm) sieve and retained on the No. 4
(4.75 mm) sieve. Record weight (E).
Note: (D) + (E) should equal (B)

26
8. By using the following formula, compute and record the percent of aggregate retained on the
3/8” (9.5mm) sieve (F):
Percent Retained on 3/8”-, F = (D/B) x 100%
9. By using the following formula, compute and record the percent of aggregate passing the
3/8” (9.5mm) sieve and retained on the No. 4 (4.75mm) sieve (G):
Percent Retained on 3/8” & retained on the No. 4, G = (E/B) x 100%
Note: (F) + (G) should equal 100.0%
10. Combine the material retained on the 3/4” (19 mm) and 3/8” (9.5 mm) sieves. Quarter the
sample per 5-692.141 “Quartering Method of Sample Size Reduction” to obtain a
representative sample weighing about 1,500 grams. Do not attempt to select an exact
predetermined weight. Record this as the Weight of Sample Passing the 1” (25 mm) sieve
and retained on 3/8” (9.5 mm) (J).
11. From the sample passing 1” (25 mm) sieve and retained on 3/8” (9.5 mm) sieve (I), collect
and weigh all of the particles that have at least one fractured face. Record weight (K).
12. Quarter the material which passes the 3/8” (9.5 mm) sieve and is retained on the No. 4
(4.75mm) sieve to obtain a representative sample weighing between 450 to 550 grams.
Record weight (L).
13. From the sample 3/8” (9.5 mm) to No. 4 (4.75 mm) sieves, collects and weigh all of the
particles that have at least one fractured face. Record weight (M).
14. By using the following formula, compute the Percent of Crushed Particles in the Total
Sample (N):
{(K/J x F) + (M/L x G)} x (C/70)
Note: 70 is a constant because it is assumed that 30% of the crushed material passes a No. 4
(4.75 mm) sieve.
C. Example
See Figure 7 for example.
D. Test Application
Because the samples for this test are usually taken before the final mixing of the aggregate, it can
be anticipated that there will be variations in the percent of crushing.
It can also be anticipated that after final mixing has been accomplished to meet the gradation
requirements that these variations will have been eliminated in the final product. For this reason,
some tolerance can be allowed. An occasional deviation of up to 2% can be allowed. However,
the average percent of crushing of all the material tested for the project shall not be less than the
specified percent. If a test exceeds the allowable tolerance, the contractor should be informed
immediately and adjustments made to obtain the required amount of crushing by possibly adding
stones or crushed rock from another source. After operations have been adjusted, a check test
should be made.

27
E. Reports
In the remarks field on Form G&B-001 (MnDOT TP-02115-02) “Grading and Base Report”
indicate the number of tests required, the number made and the average percent of crushing.
Figure 7 Percent Crushing Report

28
5-692.215 Sieve Analysis Test Procedure (Gradation)
A. Scope
The procedure outlined below is for field laboratory tests and is a modification of AASHTO T
27. Procedures followed in Central and District Laboratories are on file at the Minnesota
Transportation Department Laboratory, Maplewood, MN.
The sieve analysis or gradation test is a method of determining the particle size distribution of
grading materials and base, subbase and surfacing aggregates using sieves with square openings.
The gradation test is an extremely important test because it indicates many qualities of the tested
material. The test results determine the acceptability of the material on the road and may be used
to help control production at the pit.
Note: Gradation Tolerances
All required laboratory gradation samples shall have a field tested companion sample. Both
samples must be split from the same larger sized sample. Both gradation test samples shall be of
nearly equal size. All specified sieves should follow the allowable tolerances in Table 1003C of
the Laboratory Manual. Any sieves exceeding these tolerances will require immediate action to
determine the cause of the “out of tolerance” problem.
B. Equipment
1. 60 lb. (27.2 kg) capacity electronic platform scale with decimal graduations in tenths of a
pound (tenths of a kilogram, interpolate reading to nearest 0.05 kg).
2. Electronic scale with at least 2,500 grams capacity, sensitive and readable to 0.1 g.
3. Box sieves ("coarse sieves") and rocker. The usual sizes are 3” (75 mm), 2” (50 mm), 1” (25
mm), 3/4” (19 mm), 3/8” (9.5 mm) and No. 4 (4.75 mm). A bottom pan is furnished with
each set of sieves.
4. Standard 8” diameter "fine" sieves with a fitted top and a bottom pan; the common sizes are
No. 4 (4.75 mm), No. 10 (2.00 mm), No. 40 (425 m) and No. 200 (75 m). Two No. 200
(75 m) sieves are required; one No. 200 (75 m) should be "full height".
5. Sieve brushes (used on the "fine" sieves) includes one bristle (sash brush is ideal) and one
brass. (Do not use the brass brush on the No. 200 (75 m) sieve.)
6. Miscellaneous bowls, pans, and pails.
7. Stove or oven for drying.
8. Sieve shaker for fine sieves.
C. Sample
1. Obtain a sample of the material according to the procedure described in section, 5-692.100,
“Sampling, Random Sampling and Splitting”. If necessary, reduce the size of the sample
according to one of the procedures described in section, 5-692.100, “Sampling, Random
Sampling and Splitting”. The weight of the gradation sample depends on the amount of
gravel in the sample. Consider 25 lbs. (12,000 g) the minimum size sample needed for a
gradation test on "gravelly" material (base, surfacing and most subbase aggregates).

29
Note: Samples of finer, granular materials with small amounts (less the 10%) of gravel and
no large size rock may be less than 25 lbs. (12,000 g) The recommended sample weights or
minimum sample weights are approximate and No attempt should be made to obtain an exact
predetermined weight for any sample that is to be sieved.
2. Air dry the sample to reduce the amount of fines that cling to the large particles. The sample
may be cautiously dried in an oven or on the stove. Do not allow any clay balls or soil lumps
to bake so hard that crumbling is difficult.
D.1. Coarse Sieve Procedure
The gradation test is divided into two parts; coarse sieve and fine sieve. (Refer to Form G&B-
101 (102), “2402, Sieve Analysis, Figure 8”)
1. Set the coarse sieves on the rocker with the pan on the bottom and the sieves arranged in
order from No. 4 (75 m) to 3” (75 mm) on top.
2. Determine the tare weight of a pail and weigh the sample to the nearest 0.1 lb. (50g) on the
electronic scale. Most electronic scales are equipped with a tare weight dial that can be set at
zero with the pail hanging empty.
3. Record the weight in the "total wt. of sample" box on Form G&B-101 (G&B-102).
4. Pour the sample into the sieves and shake until less than 0.5% by weight passes any sieve
during one minute. Do not attempt to hand fit any rocks through a sieve.
5. Examine each sieve for soil lumps and clay balls. Pulverize this material so that it passes
through the sieves into the bottom pan. Never discard any clay balls from the sample.
Note: If the sample frequently contains many soil lumps or is wet and cannot be dried in a
reasonable length of time, use the 3/8” (9.5 mm) sieve as the final sieve. Combine the portion
of the sample retained on the No. 4 (4.75 mm) sieve with the material in the bottom pan.
6. Weigh separately the portions of the sample retained on each sieve and the material
contained in the bottom pan.
7. Record each weight on Form G&B-101 (G&B-102) in column 1. The total of these weights
must be within 0.2 lbs. (100 g) of the "total wt. of sample". If the "check total" is not within
0.2 lbs. (100 g) of "total wt. of sample", repeat Steps 4, 5, 6, and 7.
8. Calculate the percent of material passing each sieve to the nearest tenth of a percent. Use
Form G&B-101 (G&B-102) and the following formula:
Amount Passing (%) = Total wt. of material passing sieve (size)/Total wt. of sample (lbs or kg)
D.2. Fine Sieve Procedure
1. Check the zero position of the scale. The scale must be on a level, firm base to operate
accurately and reliably.
2. Select a representative sample of the material in the bottom pan by one of the methods
described in section, 5-692.100, “Sampling, Random Sampling and Splitting”. About 450
grams (air dry) of material passing the No. 4 (4.75 mm) sieve or 750 grams of material
passing the 3/8” (9.5 mm) sieve is required for a reliable fine sieve test. Do not attempt to
obtain an exact predetermined weight.

30
Note: If testing materials containing salvaged bituminous, see section, 5-692.216, “Washing
& Drying Gradation Samples Samples Containing Salvaged Bituminous” for proper washing
and drying procedures.
3. Dry the sample to a constant weight. Record the dry weight on line B, Form G&B-101
(G&B-102). The oven temperature may not exceed 230°F (110°C). Some materials bake into
hard clusters that do not break up during washing. Therefore, it is recommended that all
samples be handled as described in following note.
Note: A satisfactory way to prevent the minus No. 200 (75 m) material from baking is to
use the "matched sample" method. After completing Step 2, prepare another sample that
matches the weight and moisture content of the fine sieve sample. Dry this sample and record
the dry weight on line B, Fine Sieve section of Form G&B-101 (G&B-102). While the
matched sample is drying, wash the representative sample; do not dry it first.
4. Place the fine sieve sample into a pan and add enough water to cover the material.
5. Stir the sample until the fine particles are in suspension.
6. Pour the dirty water onto the full height No. 200 (75 m) sieve. Do not allow the sieve to
overflow (tap the side of the sieve sharply a few times if the water does not flow through the
sieve).
7. Add more water to the sample and repeat Step 5 and Step 6 until the water looks clean as it is
poured onto the No. 200 sieve.
8. Rinse the material retained on the No. 200 (75 m) sieve and wash it back into the pan
containing the "clean" sample.
9. Pour off the excess water and dry the sample.
10. Allow the sample to cool, weigh it and record the weight on line C, Form G&B-101 (G&B-
102).
11. Pour sample into the nest of fine sieves.
12. Shake sample until less than 0.5% by weight passes any sieve during a minute. Using a
mechanical shaker, sieving time should be at least 7 minutes. Weigh the material retained on
each sieve and in the bottom pan; record the weights in column 5, Form G&B-101 (G&B-
102).
The check total of the individual weights, including the loss of washing, should be within 0.3%
of the original dry weight (line B).
Note: The maximum weight allowed on an 8” (200 mm) wide sieve is 200 grams. Any sieve
with 200 grams or more is overloaded and requires additional sieving. When it appears that the
gravel being tested will regularly overload a particular sieve, obtain an intermediate size sieve
(No. 8 (2.38 mm), No. 20 (850 m), No. 30 (600 m), or No. 100 (150 m)) and add it to the
nest to intercept part of the material. Remember to combine the material retained on the extra
sieve with material retained on the sieve below it; or, note the extra sieve on the work sheet and
include the material retained on it in the calculations.
13. Calculate the cumulative percent passing each sieve and round to the nearest tenth of a
percent. Follow the procedure on Form G&B-101 (G&B-102) or the formula below:

31
% Passing (any sieve size) = (Total wt. of material passing sieve/Total wt. of sample) x 100%
14. Multiply the percent passing each "fine" sieve by the percent passing the final coarse sieve.
The fine sieve sample is a portion of the total sample; Step. 14 establishes the relationship of
the fine sieve sample to the total sample. Figure 8 shows an example of a completed
gradation worksheet.
E. No. 200 / 1” (75m / 25mm) Ratio
To determine the percent of No. 200 (75 m) material as a percent of the portion passing the 1”
(25 mm) sieve for granular materials, the part passing the 1” (25 mm) and the part passing the
No. 200 (75 m) sieve should be determined and recorded as described above. The No. 200/1”
(75 m / 25 mm) ratio is then calculated as follows:
No. 200/1” = (% passing No. 200/% passing 1”) x 100%
Note: Do not alter the sample by screening the material on the 1” (25 mm) sieve before splitting,
conducting the field test or sending a companion sample to the laboratory. Determine the percent
passing the 1” (25 mm) and the percent passing the No. 200 (75 m) and calculate the No.
200/1” (75 m/25 mm) ratio. Report these calculations on the back of the sample card of the
companion sample.
Example: Given: % Passing 1” (25 mm) sieve = 97.0%
% Passing No. 200 (75 m) sieve = 15.3%
Calculate: No. 200/1” ratio = (15.3/97.0) x 100% = 15.8%

32
Figure 8 Sieve Analysis Work Sheet Example (Form G&B-101)
5-692.216 Washing & Drying Gradation Samples Containing Salvaged Bituminous
A. Scope
The following procedure is to wash and dry samples containing salvaged bituminous material for
gradation testing, “5-692.215, Sieve Analysis Test Procedure (Gradation).
B. Procedure
1. Dry the sample to a constant weight at a temperature not to exceed 140ºF (60ºC) or use the
“matched sample” method described in, “D.2. Fine Sieve Procedure”, in section “5-692.215
Sieve Analysis Test Procedure (Gradation)”. Constant weight is defined as no change greater
than 0.5 grams in 15 minutes.

33
2. If necessary, soak the sample in suitable detergents or dispersants for a time period and at
concentration levels sufficient to remove the oily film from the virgin fraction of the sample.
Note: The concentration of the detergent/dispersant shall not be so harsh so as to break down
the film of asphalt on the particles of salvaged asphalt pavement.
3. Wash the sample through the No. 200 (75 µm) sieve as above or in accordance with section,
“5-692.215 Sieve Analysis Test Procedure (Gradation)”.
4. Dry the sample in accordance with the following methods:
5. In an oven at temperature not to exceed 140ºF (60ºC) overnight.
6. Over a hot plate or stove-top electric burner using a sand bath having a minimum depth of
1.5” (37.5mm). Control the temperature of the sand to prevent the drying sample from
exceeding 140ºF (60ºC). Stir the sample occasionally in the early drying stages and
continuously as the sample approaches a constant weight.
7. Cool and sieve the sample in accordance with the established procedures in section, “5-
692.215 Sieve Analysis Test Procedure (Gradation)”.
5-692.222 Moisture-Density Test Method (Proctor)
Note: Moisture-Density Test (Proctor) Tolerances
All required laboratory Proctor samples shall have a field tested companion sample. Both
samples must be split from the same larger sized sample. The field and laboratory Proctor test
samples shall be of nearly equal size after splitting. Both maximum density tests shall
correspond within 3 lbs./ft.3 (50kg/m
3) from field to laboratory test and both optimum moisture
tests shall correspond within 2%. Any testing exceeding these tolerances requires immediate
action to determine the cause of the “out of tolerance” problem.
A. Scope
This Moisture Density Test (Proctor) is a method of determining the relationship between the
moisture content and the density of the grading soil, base or subbase aggregate when compacted
by following a standard procedure. This method is consistent with AASHTO T 99, Method C.
The Maximum Density is the highest dry density that can be obtained by varying the moisture
contents and compacting the material by following a standard procedure. The Optimum Moisture
content is the moisture content (expressed as percent of dry weight) of the soil, base or subbase
aggregate at the Maximum Density. When compaction is controlled by the Specified Density
Method, the moisture content of the soil or aggregate being placed is compared to the Optimum
Moisture Content (OMC) and the density of the in place compacted material is compared to the
Maximum Density to determine compliance with the specification requirements. The moisture
content of the soil or aggregate compared to the Optimum Moisture content of the same soil
indicates the amount of compactive effort needed to achieve the Specified Density. A soil with a
moisture content lower than the Optimum Moisture requires more compactive effort than the
same soil with a moisture content near “optimum”. Soils with moisture contents higher than
“optimum” tend to be unstable and may be impossible to compact.
When the Quality Compaction Method is required, knowledge of the optimum moisture and
maximum density for the material helps the inspector determine the moisture necessary for
proper compaction.

34
B. Equipment
1. Proctor mold: A cylindrical metal mold having a capacity of 1/30 ft3 (1/1,060th m
3) with an
internal diameter of 4 inches (101.6 ± 0.406 mm) and a height of 4.584 ± 0.006 inches
(116.43 ± 0.1270 mm). The mold shall have a detachable collar assembly and base plate
(Figure 9, a).
2. Rammer Metal rammer having a flat circular face of 2 inch (50.8 ± 0.127 mm) diameter and
weighing 5.5 lbs. (2.495 ± 0.009 kg). The rammer shall be equipped with a guide sleeve to
control the height of drop to a free fall of 12 inches (304.8 ± 1.524 mm) above the soil.
(Figure 9, c).
3. Electronic platform scale: The platform scale shall have a minimum capacity of 30 lbs. (14
kg); it shall be sensitive to 0.01 lb. (one gram) and the minor graduations on the indicator
shall be 0.01 lb. (one gram).
4. Electronic scale shall have a minimum capacity of 2500 g; and it shall be accurate to 0.1 g.
5. Drying oven or stove.
6. Mixing tools (Figure 9, b).
7. Spatula and butcher knife. (Figure 9, b).
8. Box sieves, 2” (50 mm), 3/4” (19 mm), 3/8” (9.5 mm) and No. 4 (4.75 mm) with bottom pan.
9. Concrete compaction base. A block of concrete weighing not less than 100 lbs. (50 kg)
supported on a stable foundation; a sound concrete floor or other solid surface found in
concrete box culverts, bridges and pavement. See Figure 9 for typical test equipment set up.

35
Figure 9 Equipment for Proctor Test
C. Sample Preparation
1. Obtain a sample of the soil or aggregate according to the procedures described in section, 5-
692.135, “Sampling for Proctor (Moisture Density Test)”.
a. Mold & Base Plate b. Tools
c. Hammer & Guide Sleeve d. Typical Equipment Set-Up

36
2. If the soil sample is damp, dry it until it becomes friable under a trowel. The sample may be
air dried or dried in the oven or on the stove such that the temperature does not exceed 140ºF
(60ºC).
3. Sieve an adequate quantity of the sample over the 2” (50 mm), 3/4” (19 mm), 3/8” (9.5 mm)
and No. 4 (4.75 mm) with bottom pan. Break up all soil lumps to pass the sieves.
4. Discard the stones retained on the 2” (50 mm) sieve.
5. Weigh the stones that pass the 2” (50 mm) sieve and are retained on the 19 mm sieve.
6. Discard the stones retained on the 3/4” (19 mm) sieve and replace them with an equal weight
of stones passing the 3/4” (19 mm) sieve and retained on the No. 4 (4.75 mm) sieve.
Note: The replacement material may be obtained from the remaining portion of the sample, a
companion sample or completed gradation sample.
7. If the sample contains soil lumps and clay balls, pulverize them so they pass through the No.
4 (4.75 mm) sieve.
Note: When a large portion of the sample consists of lumps, use a 3/8” (9.5 mm) sieve as
well as the No. 4 (4.75 mm).
8. Recombine any stones retained on the 4.75 mm (and 9.5 mm) sieve(s) with the pulverized
material in the pan.
9. Select about 12 lbs. (5 kg) of the prepared material using a procedure described in section:
5-692.141, “Quartering Method of Sample Size Reduction”, or
5-692.142, “Ring and Cone Method of Smaple Size Reduction”, or
5-692.143, “Riffle Splitter Method of Sample Size Reduction”.
D.1. Procedure: Multi-Point Proctor (Standard Method)
This test consists of compacting a portion of a soil sample in a mold at different moisture
contents ranging from dry to wet. At least 4 samples will be run. The samples will differ in
moisture content by one to two percent with the driest sample being about four percentage points
below optimum moisture. This would result in two of the samples being below optimum, one
near optimum and one over optimum. A valid test will have 2 points below optimum.
1. Thoroughly mix the selected representative sample with sufficient water to dampen it to
approximately 4 percentage points below optimum moisture content.
Note: To estimate the starting point for granular soils (less than 20% passing the No. 200 (75
µm) sieve), moisten and mix the soil until it can be squeezed into a ball or “cast”. The cast
should crumble easily when touched. Soils with more than 20% passing the No. 200 (75 µm)
sieve usually have higher optimum moisture than granular soils and the cast is less easily
crumbled at the starting point.
2. Determine the weight of the mold and base plate. Record the weight as “B Wt. Mold” Figure
10. Do not include the weight of the collar.
3. Place the assembled mold, including collar, on the concrete compaction base.
4. Place enough of the sample into the mold for one layer.

37
Note: The mold is filled with three equal layers of compacted material. After compaction,
the top layer should be about 1/2” (15 mm) over the top of the mold when the collar is
removed.
5. Compact the loose material by 25 uniformly distributed blows from the rammer dropping
freely from a height of 12” (305 mm) above the soil.
6. Repeat Steps 4 and 5 until the three layers are placed and compacted.
7. Remove the collar and carefully trim the compacted soil with the knife until it is even with
the top of the mold (check with the spatula). Remove any stones dislodged by trimming and
fill the holes by carefully pressing finer material into place. Trim around any stones that are
at least half buried and solidly seated.
8. Clean all the loose material from the mold and base plate and weigh it on the platform scale
to the nearest gram. Record the weight as “A Wt. Wet Soil + Mold”.
9. Remove the mold from the base plate and loosen the locking devices so that the compacted
material can be removed from the mold.
10. Quarter the compacted material by slicing twice vertically through the compacted soil.
Select one of the quarters and weigh immediately. Conduct the moisture determination
according to the procedures listed in section, “5-692.245, Moisture Test”.
Note: A representative sample must consist of nearly equal portions of material from all three
layers. When the “Speedy” method is used, take the sample the same way as the burner dry
method and use a representative portion for the moisture determination.
11. Thoroughly break up any remaining portion of the molded specimen and add it to the sample
being tested.
12. Add enough water to increase the moisture content about two percentage points.
Note: 90 cc, mls or grams of water will increase the moisture content of 10 lbs. (4.4 kg) of
material about two percentage points. Additional water may be needed to replace moisture
lost by evaporation during mixing.
Note: In each repetition the material shall be thoroughly mixed before compaction to assure
uniform dispersion of the moisture throughout the sample.
13. Repeat Steps 4 thru 12 until the “Wt. Wet Soil + Mold” determined in Step 8 either decreases
or fails to increase. At this point the compacted material should be soft and spongy; granular
material may not be very spongy but will be extremely wet. The spongy condition indicates
that the moisture content of the sample exceeds optimum.
D.2. Procedure: Multi-Point Proctor (Alternate Method)
The above procedure is satisfactory in most cases. However, if the soil is fine grained, cohesive
and difficult to break up and mix with water or if the material is fragile and will reduce
significantly in grain size due to repeated compaction, use the following procedure:
1. Prepare the sample as outlined in, “C. Sample Preparation”, Steps 1 thru 8.
2. Select about 25 lbs. (11 kg of the prepared material using a procedure described in sections:
5-692.141, “Quartering Method of Sample Size Reduction”, or

38
5-692.142, “Ring and Cone Method of Smaple Size Reduction”, or
5-692.143, “Riffle Splitter Method of Sample Size Reduction”.
3. Moisten or dry the sample to about four percentage points below the estimated optimum
moisture, see “Note”in, “D.1. Procedure: Multi-Point Proctor (Stanadard Method)”.
4. Divide the sample into four or five portions of about 5 lbs. (2.2 kg) each.
5. Place one portion into a water tight container, cover, set aside, and mark as “point No. 1".
6. Add enough water to one of the remaining portions to increase the moisture content about
two percentage points. (45 mls., cc or grams of water added to 5 lbs. (2.2 kg) of material will
increase the moisture content 2.0 percent.) Place this portion in a container and mark as
“point No. 2".
7. Continue this process with the remaining two or three portions and increase the amount of
water each time until there is a series of points at about 2, 4, 6, and 8 percentage points over
“point No. 1". At least one “point” should exceed the estimated optimum moisture.
Example: A clay loam soil is to be tested. It is coming from the cut of about 20% moisture. The
estimated optimum moisture is about 18%. It is necessary to dry the soil to about 8% moisture
before it can be pulverized. After the soil is pulverized, the inspector mixes 25 lbs. (11 kg) of
soils with enough water (450 cc) to bring it to about 12% moisture. The inspector divides the
sample into five samples. weighing about 5 lbs. (2.2 kg) each, and places them into concrete
cylinder molds labeled “point No. 1", ”point No. 2", etc. “Point No. 1" is covered and set aside.
He adds 45 cc of water to No. 2, 90 cc to No. 3, 135 cc to No. 4 and 180 cc to No. 5, mixes,
covers and sets them aside.
8. Allow the covered material to “soak” in the molds overnight (twelve hours minimum) to
permit the moisture to disperse through the soil.
9. Compact each portion following Step 2 through 10 of the Standard Method.
Note: If heavy clay or organic soils exhibiting flat enlongated curves are encountered, the
water content increments may be increased to a maximum of 4 percent.
E. Calculations (Figure 10)
1. Wet Density
A = Wt. Wet Soil + Mold lbs. (kg)
B = Wt. Mold kg
C = Wt. Wet Soil (A B)
Dmetric = Wet Density, kg/m3 (C x 1059.43)
DEnglish = Wet Density, pcf, lbs/ft3 (C x 30)
Note: 1059.43 = Number of Mold Castings per m3, and
30 = Number of Mold Castings per ft3
English Example:
A = 16.44 lbs.

39
B = 12.41 lbs.
C = 16.44 – 12.41 = 4.03 lbs.
D = 4.03 × 30 = 120.9 lbs/ft3
Metric Example:
A = 7.46 kg
B = 5.63 kg
C = 7.46 - 5.63 = 1.83 kg
D = 1.83 x 1059.43 = 1939 kg/m3
2. Percent Moisture (Burner Method)
E = Wt. Wet Soil + Pan grams
F = Wt. Dry Soil + Pan grams
G = Wt. Moisture (E - F)
H = Wt. pan, grams
I = Wt. Dry Soil (F - H)
J = % Moisture Wet Weight = [G/(E – H)] x 100%
K = % Moisture Dry Weight = (G/I) x 100%
Example:
E = 385.6 grams
F = 350.2 grams
G = 385.6 - 350.2 = 35.4 grams
H = 93.8 grams
I = 350.2 - 93.8 = 256.4 grams
K = (35.4/256.4) x 100 = 13.8%
3. Percent Moisture (Speedy Method)
If the % Moisture, Wet Wt. (J) is recorded, determine and record the % Moisture, Dry Wt. (k) by
using Table 11 or the following formula:
K = J/[1 – (J/100)] = 100 x J/(100-J)
Example:
J = 12.3 (gauge reading from Speedy Moisture Meter)
K = (100x12.3)/(100-12.3) = 1230/87.7 = 14.0%
4. Dry Density
L = Dry Density, lbs/ft3 (kg/m
3) = [D/(100 + K)] x 100%

40
Example:
English: L = [120.9/(100 + 13.8)] x 100 = 120.9/113.8 x 100 = 1.062 x 100 = 106.2
Metric: L = [1939/(100 + 13.8)] x 100 = 1939/113.8 x 100 = 17.038 x 100 = 1704
F. The Maximum Density and Optimum Moisture Content
The Maximum density and optimum moisture are determined by graphing the information
obtained by compacting the samples at various moisture contents. Each moisture content relates
to a wet density and to a dry density.
Table 11 English Example
Point
No. 1 No. 2 No. 3 No. 4 No. 5
D. Wet Density 120.9 124.2 126.9 126.9 124.2
K. % Moisture 13.8 15.0 17.0 18.2 19.7
L. Dry Density 106.2 108.0 108.5 107.4 103.8
Table 12 Metric Example
Point
No. 1 No. 2 No. 3 No. 4 No. 5
D. Wet Density 1939 1992 2034 2034 1992
K. % Moisture 13.8 15.0 17.0 18.2 19.7
L. Dry Density 1702 1732 1738 1721 1664
Important Notice: The drawing of the “wet” curve is not required if the laboratory tester has
compacted four adequate points as described previously. But, if the “wet” curve is not drawn,
the “dry” curve must be computer generated. All discrepancies between companion samples
shall be resolved by plotting the “wet” curve by hand and interpolating the “dry” curve points as
shown below.
1. Plot the wet densities against the moisture contents on a Form G&B-901 (2430) (Figure 11).
2. Draw a smooth curve thru the plotted points (Figure 11). This is the “wet curve”.
3. Plot the dry densities against the moisture contents (Figure 11). Additional “dry points” may
be interpolated from the “wet curve”.
Example: In Figure 11, Points P & PP are used to establish points P1 & PP1 on the dry curve.
English:
D. (Wet Density) for Point P = 125.0 lbs/ft3
K. (Moisture) for Point P and P1 = 15.4%.
L. (Dry Density) for point P1 = [125.0/(100 + 15.4)] x 100 =108.3 lbs/ft3
and
D. (Wet Density) for Point PP = 126.2 lbs/ft3
K. (Moisture) for Point PP and PP1 = 16.2%.

41
L. (Dry Density) for point PP1 = [126.2/(100 + 16.2)] x 100 = 108.6 lbs/ft3
4. Draw a smooth curve thru the plotted points. (Figure 11). This is the “dry curve”.
5. Read the maximum density and optimum moisture from the peak of the “dry curve” (Figure
11). Maximum Density = 108.6 lbs/ft3; Optimum Moisture = 16.2%.
Note: Figure 11 is an example of computer generated Proctor curves and does differ slightly
from the hand drawn version of Figure 11.
Metric:
D. (Wet Density) for Point P = 2003 kg/m3
K. (Moisture) for Point P and P1 = 15.4%.
L. (Dry Density) for point P1 = [2003/(100 + 15.4)] x 100 =1736 kg/m3 and
D. (Wet Density) for Point PP = 2022 kg/m3
K. (Moisture) for Point PP and PP1 = 16.2%.
L. (Dry Density) for point PP1 = [2022/(100 + 16.2)] x 100 =1740 kg/m3
4. Draw a smooth curve thru the plotted points. (Figure 11). This is the “dry curve”.
5. Read the maximum density and optimum moisture from the peak of the “dry curve” (Figure
11). Maximum Density = 1740 kg/m3; Optimum Moisture = 16.2%.
G. Procedure: One-Point Proctor
Use this method for determining the standard maximum density and optimum moisture on
grading soils only and never on base or subbase aggregates. Also, this method is for field testing
only. Never use the one-point Proctor method in lieu of a "multi-point" moisture-density test on
a Project’s major grading soil. Use the one-point method to analyze subtle changes occurring
between major grading soils. Slight changes in color, texture, structure, etc., section, “5-
692.600, Soil Classification Introduction”, may indicate these changes. Also, use one-point
Proctors to verify changes in maximum density and optimum moisture indicated by relative
densities (sand cone tests) failing to meet specified density requirements even though operations
have not changed and previous tests have passed. Relative density tests exceeding 106 percent
suggest zero air voids and indicate a possible change in maximum density. Run a one-point
Proctor to confirm the suspected change. Use the "multi-point" moisture density test for the
material closest to the soil with this subtle change to check the testing accuracy of the one-point
Proctor. A reasonable variation should not exceed plus or minus 3 lbs/ft3 (50 kg/m
3). If the
variation exceeds 3 lbs/ft3 (50 kg/m
3), run another "multi-point" Proctor.
1. Obtain a representative sample of soil from the fill area per section, 5-692.135, “Sampling
for Proctor (Moisture Density Test)”.
Note: 3 to 6 lbs. (1.5 to 3 kg) of “minus No. 4 (4.75 mm)” material is usually enough to
complete the test; however, it may be necessary to take much more than 6 lbs. (3 kg) to have
a ”representative" sample.
2. Sieve the sample through a No. 4 (4.75 mm) sieve. If it is necessary to dry the sample, do not
allow it to become “oven” or “stove” dry. Be sure to pulverize all clay lumps.

42
3. Weigh the stones retained on the No. 4 (4.75 mm) sieve, record the weight and discard the
stones.
4. Weigh the portion of the sample passing the No. 4 (4.75 mm) sieve. Record the weight.
5. Calculate the percent of the sample retained on the No. 4 (4.75 mm) sieve as follows:
%100
BA
AC
C = % retained on the 4.75 mm sieve.
A = Wt. of plus 4.75 mm material (Step 3)
B = Wt. of minus 4.75 mm material (Step 4)
English Example:
A = 997.9 g
B = 4422.5 g
Metric Example:
A = 997.9 g
B = 4422.5 g
%1005.44229.997
9.997
C
6. Reduce the size of the minus No. 4 (4.75 mm) portion of the sample to about 6 lbs. (3 kg) per
section, “5-692.140, “Splitting” or section, “5-692.141, Quartering Method of Sample Size
Reduction”.
7. Add water to the reduced sample and mix thoroughly until the material is damp enough to
compact well; do not add so much water that the soil becomes “spongy” when compacted.
8. Determine the weight of the mold and base plate. Record the weight.
9. Place the assembled mold, including the collar, on the compaction base.
10. Scoop enough material into the mold for 1 layer.
Note: The mold is filled with 3 equal layers of compacted material; the top layer, after
compaction, should be about 1/2” (15 mm) over the top of the mold when the collar is
removed.
11. Compact the loose material with 25 evenly distributed blows with the rammer dropped from
12” (300 mm).
12. Repeat Steps 10 and 11 until 3 layers are inplace.
13. Remove the collar and trim the compacted material with a knife until even with the top of the
mold. (Check with a spatula.)
14. Brush all loose material from the mold and base plate and weigh the mold to the nearest gram
on the platform scale. Record the weight.
15.1 Calculate the wet weight per cubic foot of the compacted material.

43
F = 30 (D - E)
F = Wet wt. per ft3
D = Weight of wet soil and mold (Step 14).
E = Weight of the mold (Step 8).
Example:
D = 16.71 lbs., E = 12.50 lbs.
F = 30 (16.71 – 12.50)
F = 126.3 lbs/ft3
15.2 Calculate the wet weight per cubic meter of the compacted material.
F = 1059.43 (D - E)
F = Wet wt. per m3
D = Weight of wet soil and mold (Step 14).
E = Weight of the mold (Step 8).
Example:
D = 7.58 kg, E = 5.67 kg
F = 1059.43 (7.58 - 5.67)
F = 2024 kg/m3
16. Remove the mold from the base plate and loosen the locking devices so the compacted
material can be removed from the mold.
17. Select a representative sample for a moisture test. Conduct the test according to section, “-
692.245, Moisture Test” and record the results.
18. Using the Typical Moisture Density Curves (Figures 13 and 14) determine the optimum
moisture and maximum density of the minus No. 4 (4.75 mm) material.
Example (English):
Given: Wet wt. per ft3 = 126.3 lbs. (Step 15)
Moisture = 14.1% (Step 17).
Example (Metric):
Given: Wet wt. per m3 = 2024 kg (Step 15)
Moisture = 14.1% (Step 17).
Follow the horizontal line representing the wet weight (126.3 lbs., 2024 kg) across the chart
until it intersects the vertical line representing the moisture (14.1%). The Typical Curve lying
nearest the point of intersection (“M”) represents the maximum density and optimum
moisture of the minus 4.75 mm material. For curve M, the maximum dry density is 112.0
lbs/ft3 (1794 kg/m
3) and the optimum moisture is 15.8%.

44
19. If the amount of plus 4.75 mm material determined by Step 5 exceeds 5%, the maximum
density and optimum moisture of the minus 4.75 mm material must be adjusted to account
for the plus 4.75 mm portion of the representative sample. The density is adjusted by the
following calculation:
H = (1.0 - C) G + 2384(C)
H = Maximum Density of the total sample.
G = Maximum Density of the minus No. 4 (4.75 mm) portion.
C = % retained on the No. 4 (4.75 mm) sieve, expressed as a decimal.
Example (English):
Given:
G = 112; C = 18% = 0.18
H = (1.0 - 0.18) 112.0 + 148.8 (0.18)
H = 118.6 lbs/ft3
Example (Metric):
Given:
G = 1794; C = 18% = 0.18
H = (1.0 - 0.18) 1794 + 2384 (0.18)
H = 1900 kg/m3
The Optimum Moisture is adjusted by the following calculation:
J = 2(C) + (1.0 - C) I
J = Optimum Moisture of the total sample.
I = Optimum Moisture of the minus No. 4 (4.75 mm) portion.
C = % retained on the No. 4 (4.75 mm) sieve, expressed as a decimal.
Example:
Given:
I = 15.8%; C = 18% = 0.18
J = 2(0.18) + (1 - 0.18)15.8
J = 13.3
English: The Standard Maximum Density and Optimum Moisture for the sample selected in
Step. 1 is 118.6 lbs/ft3 and 13.3%.
Metric: The Standard Maximum Density and Optimum Moisture for the sample selected in Step.
1 is 1900 kg/m3 and 13.3%.
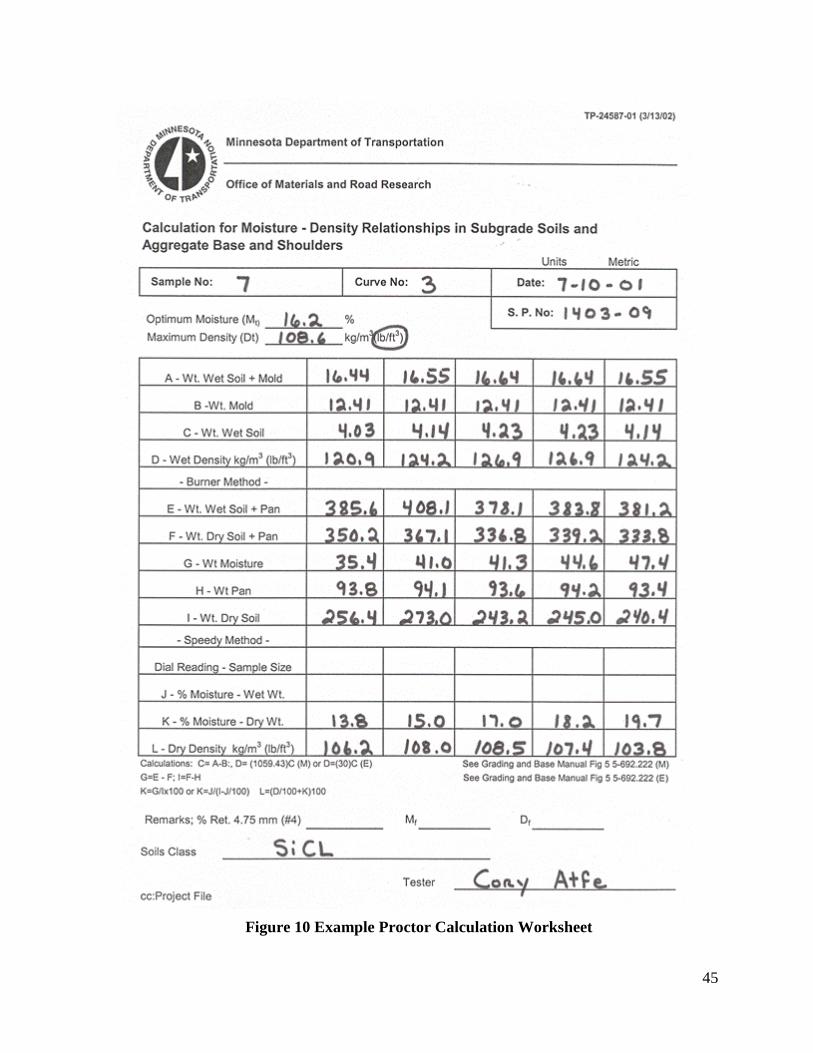
45
Figure 10 Example Proctor Calculation Worksheet

46
Figure 11 Example Proctor Curve (Hand Drawn)
Figure 12 Example Proctor Curve (Computer Generated)
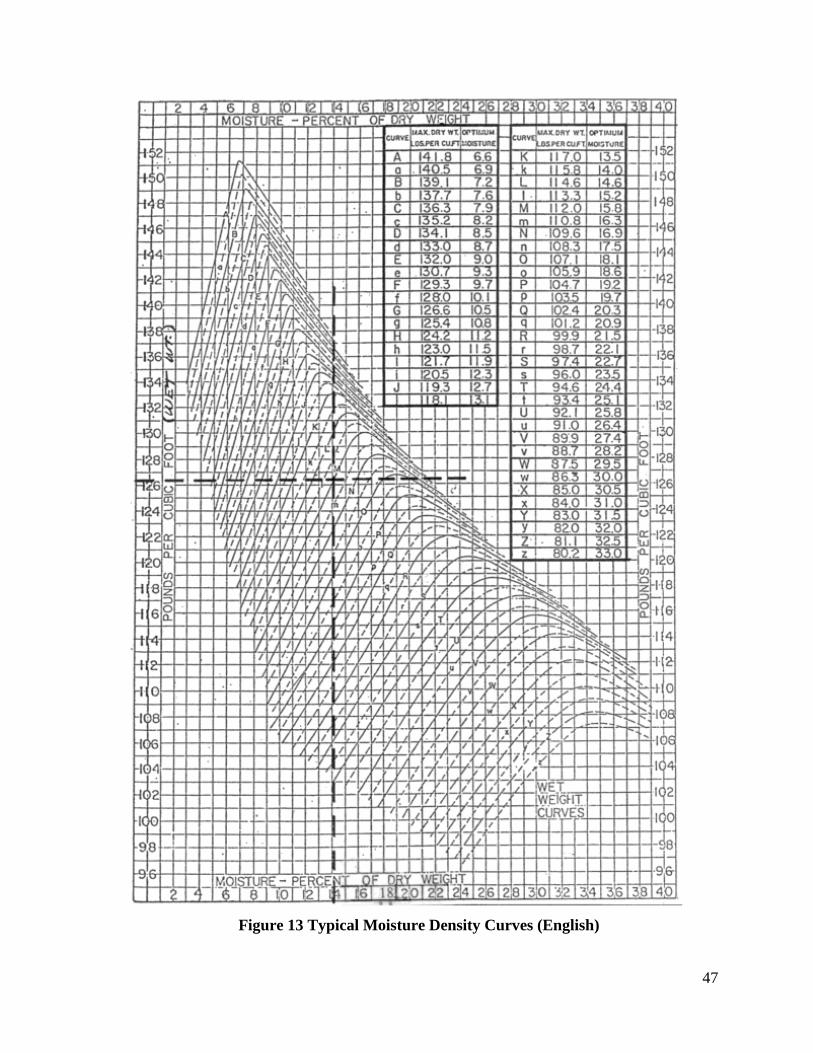
47
Figure 13 Typical Moisture Density Curves (English)

48
Figure 14 Typical Moisture Density Curves (Metric)

49
5-692.231 Calibration of Sand Cone and Ring
A. Calibration Procedure
1. Place the ring on a piece of paper on a level, solid, vibration free table or bench.
2. Put about 2,500 grams of the sand, to be used in the field density test, in the two liter (quart)
jar and attach the sand cone device.
3. Weigh the jar, sand and sand cone and record to the nearest gram.
4. Close the valve in the sand cone and invert the jar and cone over the ring.
Note: Make match marks on the funnel and ring so that each time the sand cone is used it
may be placed in exactly the same position on the ring.
5. Carefully open the valve so that the sand flows freely into the ring and funnel.
6. When the sand stops flowing, close the valve sharply and remove the jar and sand cone.
7. Weigh the jar, sand cone and sand remaining in the jar and subtract this weight from the
weight of the jar, sand and sand cone before filling the ring and funnel. This difference is the
weight of sand required to fill the ring and funnel.
8. Repeat Steps 1 through 7 at least three times and calculate the average weight of the sand in
grams required to fill the ring and funnel. Round off the average weight to the nearest gram
and record. The weight of the sand in the funnel and ring should not vary more than 5 grams
from the other trials.
Example:
Trial 1 Trial 2 Trial 3 Trial 4
Wt. of jar, cone & sand before (g) 3390 3388 3384 3393
Wt. of jar, cone & sand after (g) 2758 2761 2753 2763
Wt. of sand in funnel & ring (g) 632 627 631 630
Average wt. of sand (g) (632 + 627 + 631 + 630)/4 = 630
5-692.232 Calibration of Standard Sand
A. Scope
Calibrate the sand; that is determine the unit weight of the sand lbs/ft3 (kg/m
3) to be used in the
field density test. The unit weight of each new sack of sand should be determined. Used sand
may be re-sieved and a new unit weight determined. The unit weight of the sand will change if
the sand is allowed to become wet or if the gradation of the sand changes. Always protect the
sand from contamination. The unit weight of the sand can be determined by using a moisture
density mold of known volume or by comparison of the weight of the sand to an equal volume of
water.
B. Procedures for Calibrating Standard Sand:
The Density Cone and Ring are first calibrated using the standard MnDOT procedures.

50
B.1. Field Method No. 1 Procedure
1. Weigh the moisture-density mold to the nearest 0.01 lbs. (gram) and record. Do not include
the weight of the collar.
2. Center the mold on a piece of paper placed on a level, solid, vibration free table or bench.
3. Put about 2500 grams of the sand to be calibrated in the two liter jar and attach the sand cone.
4. Close the valve in the sand cone and invert the jar and sand cone over the mold.
5. Carefully open the valve so that the sand flows freely into the mold.
6. When the sand stops flowing, close the valve sharply and remove the jar and cone. Avoid
jarring or vibrating the mold.
7. Carefully strike off the excess sand level with the top of the mold with a straight edge.
8. Tap the mold sharply and brush the loose sand off the outside surface of the mold.
9. Weigh the mold and sand to the nearest 0.01 lbs (gram) and record.
10. Repeat Steps 2 thru 9 at least three times. The weight of the mold and sand should not vary
more than 0.05 lbs. (25 grams).
11. Subtract the weight of the mold (Step 1) from the weight of mold and sand to determine the
weight of the sand in the mold.
12. Calculate and record the unit weight (kg/m3) [lbs/ft
3] of the sand by dividing the average
weight (kg or lb.) of sand in the mold by the volume of the mold (1/1059.43 m3) [1/30 ft
3].
English Example:
Trial 1 Trial 2 Trial 3 Trial 4
Wt. of mold + sand (lbs.) 15.63 15.72 15.65 15.61
Wt. of mold (lbs.) 12.40 12.40 12.40 12.40
Wt. of sand in mold (lbs.) 3.23 3.32 3.25 3.21
Average wt. of sand (lbs.) (3.23 + 3.32 + 3.25 + 3.21)/4 = 3.23 lbs.
Metric Example:
Trial 1 Trial 2 Trial 3 Trial 4
Wt. of mold + sand (kg) 7.093 7.123 7.085 7.104
Wt. of mold (kg) 5.620 5.620 5.620 5.620
Wt. of sand in mold (kg) 1.473 1.503 1.465 1.484
Average wt. of sand (kg) (1.473 + 1.503 + 1.465 +1.484)/4 = 1.474 kg
Note: Trial 3 was not used because it varied more than 5 grams from at least one other unit
weight of sand
../.9.963023.3
30
1
23.3ftculbs

51
3156243.1059474.1
43.1059
1
474.1mperkg
D.2. Field Method No. 2 Procedure
1. The density bottle is filled with a known weight of Standard Sand, usually about 2500 grams.
2. On a clean, level surface place a Proctor Mold (1/30 ft3) [1/1060 m
3] with its’ collar
removed.
3. Place the Density Ring on the top edge of the Proctor Mold, being careful to line up the
inside edge of the ring with the inside of the mold.
4. Place the Density Cone, with bottle and sand, on the Density Ring. Use the same method as
calibrating Cone and Ring.
5. Carefully open the valve on the cone. When the sand stops flowing, close the valve.
6. Weigh the remaining sand in the bottle and record to the nearest gram.
7. Repeat Steps 1 through 6 at least three times. The weight of the sand should not vary more
than 5 grams.
Example:
Trial 1 Trial 2 Trial 3 Trial 4
Final Wt. of sand in bottle (g) 548 550 561 552
Average wt. of sand (kg) (548 + 550 + 552)/3 = 550
Note: Trial 3 was not used because it varied more than 5 grams from at least one other.
8. Subtract the average weight of sand remaining in the bottle and the weight of sand in cone
and ring from the original weight of sand to determine the weight of sand in the mold.
Note: In order to do this procedure, you have to calibrate the Sand Cone and Ring first.
9. Calculate and record the lbs. (kg) of sand in mold by dividing the average weight (g) of sand
in mold by 453.6 gm/lb. (1000 g/kg).
10. Calculate and record the unit weight (lbs/ft3) [kg/m
3] of sand by multiplying the weight (lbs.)
[kg] of sand in mold by 30 (1059.43).
English Example:
Original wt. of sand = 2500.0 grams = A
Average final wt. of sand = 550.0 grams = B
Wt. of sand in cone & ring = 450.0 grams = C
A - B - C = D
Grams of sand in mold = 1500.0 grams = D
D / 453.6 (gms./lb.) = E
1500/453.6 = 3.307 = E

52
lbs. of sand in mold = 3.307 = E
E x 30 = 99.2 lbs/ft3 = F
Metric Example:
Original wt. of sand = 2500.0 grams = A
Average final wt. of sand = 550.0 grams = B
Wt. of sand in cone & ring = 450.0 grams = C
A - B - C = D
Grams of sand in mold = 1500.0 grams = D
D / 1000 = E
kg of sand in mold = 1.500 kg = E
E x 1059.43 = F
kg/m3 of sand = 1589 kg/m
3 = F
5-692.245 Moisture Test
A. Scope
The moisture test is a method of determining the moisture content of soils and aggregates by
either drying the sample using a calcium carbide gas pressure (CCGP) moisture meter or a
nuclear gauge. Moisture tests are taken to determine if the moisture content, expressed as a
percentage of the dry weight, is in compliance with the placement and compaction requirements
of the specifications. Determine the moisture content at the time compaction. Moisture
requirements should be met and maintained for each layer of embankment before the next layer
is placed. If the moisture content of embankment, particularly in plastic soils is not properly
tested and controlled, the subgrade will likely become unstable under the operation of
construction equipment during base and pavement construction. The method used to determine
the moisture content depends on the type of soil aggregate as follows:
1. The burner method is the default method and is the method used to calibrate all other
methods. It may be used to determine the moisture content of any grading, subgrade, base or
shoulder material. Minor variations of the procedure are necessary for reliable results when
testing materials that have been treated, such as with bituminous, see section, “5-692.216,
“Washing & Drying Gradation Samples Samples Containing Salvaged Bituminous”.
2. The calcium carbide gas pressure (CCGP) method may be used to determine the moisture
content of untreated grading soils, subbase and base aggregate except those granular
materials having particles large enough to affect the accuracy of the test. Either a 26 gram
soil sample size “Speedy” or 200 gram soil sample size “Super Speedy” moisture meter is
used.
The 26 gram “Speedy” meter is to be used for non-granular soils, in general no appreciable
amount retained on the No. 4 (4.75 mm) sieve. The 200 gram “Super Speedy” meter is to be
used for granular soils and aggregate base with particle size not to exceed 2” (50 mm). The
CCGP method is as reliable and accurate as the burner method in these cases.

53
Note: Use Form G&B-105 (MnDOT TP 21850) Relative Moisture Test, to record field
moisture determinations, see Figure 21.
B.1. Equipment for Burner Method
1. A electronic scale of at least 2,500 gram capacity sensitive to 0.1 gram and with minor
graduations on the indicator for 0.1 gram.
2. Stove, oven, or other suitable equipment for drying moisture content samples.
3. Frying pan or any suitable container for drying and weighing samples.
B.2.1. Equipment for CCGP Method: 26 gram “Speedy” Moisture Meter
The “Speedy” moisture meter is furnished as a kit containing the CCGP meter, tared scale, two
1-1/4” (32 mm) steel balls, cleaning brush and cloth, and scoop for measuring calcium carbide
reagent.
Calcium carbide reagent is available in one pound cans. The calcium carbide to be used should
be “fresh” and, therefore should not be more than 2 – 3 years old even though the container has
never been opened. After a container has been opened and then resealed properly, its full
strength will probably dissipate within two months to a point at which it will not produce
accurate test results and should be discarded.
Caution: Do not attempt to use the “Speedy” unless the kit is complete. Calcium carbide and
water produces a dangerous, flammable gas. Keep the reagent can closed tightly, avoid
breathing the fumes and use only in a well-ventilated area. Point the opening of the tester away
while removing the cap. Tape the metal handle of the cleaning brush; otherwise, when the metal
handle comes in contact with the chamber a spark could ignite gas trapped in the chamber. Keep
the kit clean; do not allow the instrument to be mishandled.
B.2.2. Transporting Calcium Carbide (Speedy Moisture Tester Reagent)
This material may be transported under an exemption to the strict DOT shipping requirements
for hazardous materials, if all the following procedures are strictly followed:
A. You are carrying no more than one pound or a ½ kilogram in the original manufacturer’s
container.
B. This container is stored in a secured durable box.
C. The durable box is clearly labeled on all sides with (Figure 15):
1. Calcium Carbide, 4, 3
2. UN 1402, P G II
3. Limited Quantity

54
Figure 15 Example Labeling Requirements for Calcium Chloride
D. The shipping manifest is within reach of the driver at all times.
E. The shipping manifest must include the following information (Figure 16):
1. Calcium Carbide, 4, 3
2. UN1402, Packing Group PG II
3. Limited Quantity
4. The weight or volume of material being carried
5. The Emergency Response telephone number
Note: Citations and penalties for failure to comply with DOT shipping requirements for
hazardous materials are the sole responsibility of the motor vehicle drivers.

55
Figure 16 Hazardous Material Shipping Document
B.3.1. Equipment for CCGP Method: 200 gram “Super Speedy” Moisture Meter
The “Super Speedy” 200 kit consists of the moisture meter, counterpoised balance, measuring
scoop, brushes, two steel balls, a 200 gram weight and 100 gram half sample weight, heat shield,
two gauges and gauge removing tool. One gauge for determining the moisture content by wet
weight is calibrated from zero to eleven percent. The other gauge is for determining the moisture
content by dry weight and is calibrated from zero to 12 percent. To change gauges, use the
special tool supplied. The tool is designed to grip the three screws on the outer casing of the
gauge. To remove the gauge turn in a counter-clockwise direction. To replace the gauge, turn in
a clockwise direction.
Caution: See “Caution” in, “B.2.1 “Equipment for CCGP Method: 26 gram “Speedy” Moisture
Meter”.
B.3.2. Transporting Calcium Carbide (Speedy Moisture Tester Reagent)
See “B.2.2. Transporting Calcium Carbide (Speedy Moisture Tester Reagent)” in section, “5-
692.245 Moisture Test”.
C.1. Procedure for Burner Method
1. Select a representative soil sample. The larger the sample used, the more accurate the test
results will be. The minimum size sample should range from 100 grams for fine grained
soils to 1000 grams for 2” (50 mm) maximum particle size. At least 500 grams of base
aggregate should be used.
2. Weigh the pan or container to be used to the nearest gram and record the weight.

56
3. Weigh the wet sample and container to the nearest gram and record the weight.
4. Dry the sample to a constant weight by weighing the sample after it appears dry, reheat it for
a short time and weigh again. Continue drying and weighing the sample until the weight
remains constant. Constant weight is defined as no change greater than 0.5 grams in 15
minutes.
Note: To prevent burning or warping of the scale, the sample should be allowed to cool or a
heat pad should be used to protect the scale.
5. Weigh the sample and container to the nearest gram and record the weight.
6. Determine the weight of moisture in the sample by subtracting the weight of the dry sample
and pan from the weight of the wet sample and pan.
7. Determine the weight of the dry material by subtracting the weight of the pan from the
weight of the dry material and pan.
8. Calculate the percent moisture of the dry weight by dividing the weight of the moisture by
the weight of the dry material and then multiply by 100.
Example:
Wet wt. of sample and pan = 327 g
Dry wt. of sample and pan = 305 g
Weight of pan = 79 g
Wt. of moisture = 327 – 305 = 22 g
Wt. of dry material = 305 – 79 = 226 g
% moisture, dry wt. = 22/226 x 100% = 9.7%
Note: The percent moisture of the wet weight is calculated by dividing the weight of the
moisture by the weight of the wet material.
C.2. Procedure for CCGP Method: 26 gram “Speedy” Moisture Meter
1. Set the “Speedy” carrying case on level ground or a solid, level bench. The tared scale must
be level to be reliable.
2. Select a representative soil sample and weigh out an exact amount on the tared scale. The
tared scale weighs either a 26 or 13 gram sample. The pressure gage indicates up to 20
percent moisture in a 26 gram sample or 40 percent moisture in a 13 gram sample. If the
moisture is expected to be five to 20 percent, use a 26 gram sample; if 20 to 40 percent, a 13
gram sample; and, if over 40 percent, use the burner method. If the soil contains less than
five percent moisture, use two or more 26 gram samples.
3. Calculate and record the Sample Size Factor using the following formula:
Sample Size Factor = 26/weight of sample used.
4. Place the weighed soil sample in the cap of the meter. Be certain the cap is clean.
5. Place three full scoops of reagent and the two steel balls in the body of the meter.

57
6. Hold the body of the meter in an approximately horizontal position, insert the cap into the
body, and seal the unit by positioning and tightening the clamp. The calcium carbide should
not come in contact with the soil until a complete seal is made. (Figure 17, a).
7. Tilt the meter so that the sample falls into the body and begins mixing with the reagent.
8. Return the Speedy to the horizontal position. Shake the tester to pulverize any soil lumps
and to cause mixing so that the reaction between the calcium carbide and all free moisture is
complete. The meter should be shaken with a rotating motion so that the steel balls will not
damage the gauge and soil particles will not become imbedded in the orifice leading to the
pressure diaphragm. Do not allow the balls to hit the gauge end of the meter. Attempt to roll
the balls rather than rattle them. Up to four minutes of shaking may be required on heavy
clay type soils. Allow time for the dissipation of heat generated by the chemical reaction.
(Figure 17, b)
9. Hold the meter horizontal at eye level with the dial facing you (Figure 17, c). When the
needle comes to rest, read the dial to the nearest 0.1 percent and record the dial reading.
Figure 17. Sealing, Shaking, and Reading the Speedy Test Apparatus
10. Calculate and record the percent moisture of the wet weight by multiplying the dial reading
by the sample size factor.
11. Determine and record the percent moisture by dry weight by using Table 13 or the following
formula:
% moisture, dry wt. = (100 x % moisture, wet weight)/(100 - % moisture, wet weight)
Example: % moisture, wet wt. = 12.8%
% moisture , dry wt. = (100 x 12.8)/(100 – 12.8) = 1280/87.2 = 14.7%
12. Point the opening away from you, slowly release the pressure and remove the cap.
a b
c

58
13. Dump the material from the meter and examine. The soil must be completely pulverized.
Lumps indicate an inaccurate test that must be re-run, increasing the shaking time.
14. Brush out the body of the meter. Wipe out the cap and clean off the two steel balls with the
special cleaning rag.
Note: Keep the Speedy kit clean at all times. Never leave the kit out in the rain or allow anyone
to mishandle any part of it.
C.3 Procedure for CCGP Method: 200 gram “Super Speedy” Moisture Meter
1. Set the “Super Speedy” carrying case on level ground or a solid, level bench. The tared scale
must be level to be reliable.
2. Select a representative sample and weigh a 200 gram sample on the scale provided. If the
moisture content is likely to exceed the maximum gauge reading, use a half sample (100 g)
and the wet weight gauge. The half sample method cannot be used with the dry weight
gauge.
3. Calculate and record the sample size factor using the following formula:
Sample size factor = 200/(Weight of sample used)
4. Place the weighed sample in the cap of the meter (Figure 18, a).
5. Place six full measures of regent in the body of the “Super Speedy” (Figure 18, b). Place the
two steel pulverizing balls in the body.
6. Hold the “Super Speedy” in an approximately horizontal position, insert the cap into the
body and seal the unit by tightening the clamp. Care must be taken to prevent the reagent
from coming in contact with the sample before the seal is complete (Figure 18, c).
7. With the dial downward, shake the unit round and round for approximately five seconds.
Hold or stand the “Super Speedy” in a vertical position for one minute (Figure 18, d).
Figure 18 Placing Sample and Reagent into Speedy Apparatus
a b
c d

59
8. Repeat Step 7, shake once more and turn the unit into a horizontal position at eye level with
the dial facing you. When the needle comes to rest, read the dial to the nearest 0.1 percent
and record the dial reading (Figure 19, a).
Figure 19 Reading the Speedy Gauge and Releasing the Pressure
9. Calculate and record the percent moisture by multiplying the dial reading by the sample size
factor.
If the dry weight gauge was used, record the percent moisture of the dry weight. If the wet
weight gauge was used, record the percent moisture of wet weight and determine the percent
moisture of dry weight by using Table 13 or the following formula:
% moisture, dry wt. = (100 x % moisture, wet wt.)/(100 - %moisture, wet wt.)
10. Point the opening away from you, slowly release the pressure and remove the cap (Figure 19,
b).
11. Dump the material from the meter and examine. The soil must be completely pulverized.
Lumps indicate an inaccurate test that must be rerun, increasing the shaking time.
12. Brush out the body of the meter. Wipe out the cap and clean off the two steel balls with the
special cleaning rag.
Note: Keep the Speedy kit clean at all times. Never leave the kit out in the rain or allow anyone
to mishandle any part of it.
D. Alternate Device and Methods
1) A nuclear gauge may be used to determine moisture content per AASHTO T 310 or ASTM
D6938, Direct Transmission Method.
Provide documentation to the Engineer of:
Annual training records of all nuclear device users and
Annual records of calibration of all nuclear devices used.
2) A microwave oven may be used to determine moisture content by following the procedure
below.
Overview
This test method outlines procedures for determining moisture content of soil by incrementally
drying the soil in a microwave oven.
This test method is best suited for minus No. 4 sized material. Larger size particles can be
tested; however, care should be taken because of increased chance of particle shattering.
a b

60
Do not use the sample for another test.
Safety
Recycled materials and aggregate from iron bearing areas may contain metal, use caution.
Highly organic soils and aggregate containing oil or bituminous or other contaminates may ignite
into flames use caution.
Handle container with container holder or gloves.
Use eye protection.
Equipment
Microwave oven ≥700 watts
Digital scale
Glass container
Fiber glass cloth
Stirring tool
Sample size
-No. 4 400-600g
+No 4 800-1,200g
Test
a) Determine the mass of a clean, dry container and record
b) Place the sample in container, and immediately determine and record the mass.
c) Place the sample and container in a microwave oven and turn the oven on for 3 minutes.
d) After the set time has elapsed, remove the container and sample from the oven, weigh and
record weight.
e) Mix the sample taking special precaution not to lose any material.
f) Return the container and sample to the microwave and reheat in the oven for 1 minute.
g) Repeat 4-6, until the change in weight is less than 1g.
Calculations
W = [(mass of water)/(mass of oven dried material)] x 100
W = [(M1 – M2)/(M2 – Mc)] x 100 = Mw/Ms x 100
Where:
W = water content, %
M1 = mass of container and moist sample, g

61
M2 = mass of container and oven dried sample, g
Mc = mass of container, g
Mw = mass of water, g, and
Ms = mass of sample particles, g

62
Table 13 Conversion Table – Percent Moisture

63
5-692.246 Field Density Test: Sand Cone Method
5-692.247 Sampling and Inspection – Field Density
A. Density tests are taken to determine whether embankment or base materials have been
compacted to the specified density. Tests should be made immediately after compaction to
permit corrective work, before drying and hardening occurs, in sections where the specified
density has not been attained. It is also easier, faster and more accurate to perform tests on a
moist, newly compacted surface than on one that has become hard, dry and rough.
B. Before selecting locations for the density test, examine the section to be tested for uniformity.
Where it appears that there is a lack of stability or compaction, the density should be
determined. In sections where there is apparent uniformity of materials and compaction,
such as for granular soils or aggregate base, select locations for density determinations at
random: but avoid traffic wheel tracks, areas where segregation of materials occur, and
locations having pocketed soil conditions.
C. When embankment or base materials being tested contain stones larger than 1” (25 mm), care
must be exercised to avoid areas of marked deviation from average conditions. If large
stones are encountered in digging the hole, select a new location.
D. At all test locations, the material should be closely examined to determine whether a
moisture density curve has been developed from the same class of material. If none of the
available moisture-density curves are representative of the material being tested, additional
material should be obtained from determination of the moisture density relations, see section,
“5-692.222, Moisture Density Test Method (Proctor)”.
5-692.248 Field Density Test Procedures
A. Sandcone Scope
This field density test is a method of determining the in place density of grading soils or
aggregate base, subbase and aggregate surfacing and is a modification of AASHTO T 191. The
test consists of digging a hole about 100 mm (4”) in diameter and as deep as necessary to test the
layer in place. All of the material is carefully removed and weighed. The volume of the hole is
determined by filling the hole with sand of known unit weight. The moisture content is
determined and the dry density of the material is calculated.
B. Sand Cone Equipment
1. Two quart (liter) mason jar with sand cone and valve attachment.
2. Ring or Plate with a 4” to 4.5” (100 mm) diameter center hole, two nails and hammer.
3. Sample containers, such as tin cans with lids, for retaining the density sample.
4. Small pick, chisels and spoons for digging the test hole. Spatula and small brush.
5. An electronic scale of at least 2500 grams capacity sensitive to 0.1 gram and with minor
gradations on the indicator for 0.1 gram.
6. Speedy moisture meter, stove or oven and suitable containers for drying and weighing
moisture content samples.
7. A moisture density mold with a volume of approximately 1/30 ft3 (1/1060 m3), see, “B.1
Equipment of section, “5-692.222, Moisture Density Test Method (Proctor)”.

64
8. A electronic platform scale with a minimum 30 lbs. (14 kg) capacity sensitive to one gram
and with minor gradations on the indicator of one gram (0.01 lb.).
9. Supply of standard sand. The sand used to determine the volume of the hole is a silica sand
graded to pass a No. 20 (850 µm) sieve and be retained on a No. 30 (600 µm) sieve. The
sand is usually supplied in 50 lb. (24 kg) sacks. If standard sand is not available, local sand
may be used if it is free flowing, washed, dried and sieved through a No. 20 (850 µm) and a
No. 30 (600 µm) sieve. Use the sand retained on the No. 30 (600 µm) sieve.
Note: Use Form MnDOT G&B-304, “Relative Density Test” to record field density
determinations (Figure 20).
C. Sand Cone Procedure: Determine the density of in-place soil
1. Select the location of the test (section, “5-692.247, Sampling and Inspection”) and remove
any loose material.
2. Smooth and level the surface of the area until the ring can be evenly seated. Secure with
nails driven through the pre drilled holes on the opposite sides of the ring into the soil.
3. Dig the test hole the size of the inside diameter of the ring being very careful to avoid
disturbing the soil that will bound the hole. Granular soils require extreme care. Cut the
sides of the hole vertical and smooth out rough spots that may develop when small stones are
loosened. If stones larger than 2” (50 mm) are loosened, remove them but do not include
them with the finer material in the sample container. Dig the hole as deep as necessary to
test the layer compacted. Place all loosened soil in a clean container being careful to avoid
losing any material.
Note: Density tests on grading construction usually represents layers 8” (200 mm) or 12”
(300 mm) in thickness (loose measurement). The test hole for grading construction should
be at least 4-1/2” (115 mm) deep and yield from 1200 grams of dry material for fine grained
soils to 1800 grams for gravelly soils. The standard sand cone density testing device with an
approximate cone of 4-1/2” (115 mm) diameter is recommended. 6 ½ (165mm) may be used
also.
Note: Density tests on base aggregate construction usually represent 3” (75 mm) or 6” (150
mm) compacted lifts. When the compacted lift is between 3” (75 mm) and 6” (150 mm), the
test hole should be at least 60 mm (2-1/2”) in depth and yield about 2000 grams of dry
material. The minimum lift that can be accurately tested is 2” (50 mm) in depth. The 2” (50
mm) test hole should yield a minimum of 1650 grams. The larger sand cone testing device
with an approximate cone of 6-1/2” (165 mm) diameter is recommended.
4. Weigh and record a quantity of sand plus container. Place the sand in the two quart (liter) jar
and attach the sand cone.
Note: The amount of sand needed depends on the size of the test hole. When the standard 4-
1/2” (115 mm) diameter sand cone test device is used, 2,500 grams is usually enough for a 3”
(75 mm) to 4-1/2” (115 mm) deep. When the larger 6-1/2” (165 mm) diameter sand cone test
device is used, usually 5,000 grams is enough for aggregate test.
5. Invert the jar and sand cone and place it on the ring. Use the match marks on the ring and
funnel to make sure they are in the same position as when the device was calibrated.

65
Note: Do not allow construction equipment to operate within 30’ (10 m) of test site while
testing is in progress.
6. Open the valve and allow the sand to fill the hole and the sand cone.
Note: If stones larger than 2” (50 mm) were removed from the hole in Step 3, open the valve
and let a small amount of sand flow into the hole; close the valve, remove the sand cone and
place the rocks on the sand bedding in the hole; replace the jar and sand cone, reopen the
valve and complete Step 6.
7. When the sand stops flowing, close the valve and remove the jar and sand cone.
8. Weigh and record the sand remaining plus container.
9. Weigh the wet material removed from the hole.
10. Determine the moisture content of a representative portion of the material from the hole by
the burner method or speedy moisture meter. The procedure for determining the moisture
content is contained in section, “5-692.245, Moisture Test”. The moisture content expressed
as a percent of the wet weight must be used if the procedure outlined on Form G&B- 304,
“Relative Density”. Record the percent moisture.
D. Sand Cone Calculations
1. Calculate and record the weight of the sand used in the test by subtracting the weight of the
container and sand remaining after performing the test (Steps 5 thru 8, above) from the
weight of the container and sand before performing the test (Step 4).
2. Calculate and record the weight of the sand required to fill the hole by subtracting the weight
of the sand required to fill the ring and the funnel from the weight of the sand used in the test
(Step 1, above).
3. Determine the dry weight of the material by calculating the weight of the moisture and
subtracting it from the wet weight of the material from the hole.
Example:
Wet wt. of material = 1368 g
Moisture content = 7.48%
Wt. of moisture = wet wt. x (%moisture/100) = 1368 x 0.0748 = 102 grams
Dry wt. = Wet wt. – wt. of moisture = 1368 – 102 = 1268 g
Note: An alternate method of obtaining the dry weight is to dry all the material removed from
the test hole (minus 2” [50 mm] size) and weigh it to the nearest gram. Record this weight as the
dry weight of the material from the hole.
4. Calculate the dry density of the in place material using the formula:
Dry Density, Kg/m3 = dry wt. of material(g)/wt. of sand in hole(g) x units of sand in hole (kg/m3).
Example:
Dry wt. of material removed from hole = 1266 g

66
Wt. of sand required to fill hole = 958 g
Unit wt. of standard sand (from calibration) = 97.1 lbs/ft3 (English), or 1554 kg/m
3 (Metric)
English Dry Density = (1266/958) x 97.1 = 128.3 lbs./ft3
Metric Dry Density = (1266/958) x 1554 = 2,054 kg/m3
E. Alternate Device and Method
A nuclear gauge may be used to determine density per AASHTO T 310 or ASTM D6938, Direct
Transmission Method. Provide documentation to the Engineer of:
Annual training records of all nuclear device users and
Annual records of calibration of all nuclear devices used.
5-692.251 Relative Density
A. General
Relative density is the ratio, in percent, of the field density of in place embankment, base or
subbase aggregate to the maximum density of the material. The field density of the in place
material is determined by, “5-692.246, Field Density Test: Sand Cone Method”. The maximum
density is determined by, “5-692.222, Moisture Density Test Method (Proctor)”.
The relative density of the in-place compacted embankment, base or subbase is compared to the
percent density specified to determine if the material has been compacted as required.
B. Calculations
Relative density is calculated by using the following formula:
Relative Density (%) = Field Density (lbs/ft3 or kg/m
3)/Maximum Density (lbs/ft
3 or kg/m
3)
Example:
Field Density, Dry Density = 118.6 lbs./ft3 (2091 kg/m
3)
Maximum Density = 116.3 lbs./ft3 (2050 kg/m
3)
Relative Density = [118.6 (2091)/116.3 (2050)] x 100% = 102%
Figure 20, Form G&B-304, combines the field density test and relative density determination.

67
Figure 20 Example Relative Density Determination (Form G&B-304)
68
5-692.253 Relative Moisture
A. General
Relative moisture is the ratio, in percent, of the moisture content of an embankment soil, base or
subbase aggregate to the optimum moisture of the material. Moisture content of the material is
determined by “5-692.245, Moisture Test” and the optimum moisture is determined by, “5-
692.222, Moisture Density Test Method (Proctor)”.
Where the specified density method of compaction is specified or when constructing a control
strip, the moisture content of the soil or aggregate is determined at the time the material is being
compacted.
The relative moisture is compared to the specified moisture content to determine if moisture
content required for compaction of the material is acceptable.
B. Calculations
Relative moisture is calculated by using the following formula:
Relative Moisture (%) = (Moisture Content (%)/Optimum Moisture Content (%)) x 100%
Example:
Moisture Content (% of Dry Wt.) = 15.9%
Optimum Moisture (% of Dry Wt.) = 16.6%
Relative Moisture = 15.9/16.6 x 100% = 96%
Figure 21, Form G&B-105, combines the moisture test and the relative moisture determination.

69
Figure 21 Relative Moisture Determination (Form G&B-105)

70
5-692.255 Dynamic Cone Penetrometer (DCP)
A. General
The Dynamic Cone Penetrometer consists of two 16mm (5/8") diameter shafts coupled near the
midpoint. The lower shaft contains an anvil and a pointed tip which is driven into the aggregate
by dropping a sliding hammer contained on the upper shaft onto the lower anvil. The underlying
aggregate strength (density) is determined by measuring the penetration of the lower shaft into
the aggregate after each series of a predetermined number of drops. This value is recorded in
millimeters (inches) per blow and is known as the Penetration Index (PI).
B. Equipment
The DCP is comprised of the following elements (Figure 22 a and b)
1. Handle: The handle is located at the top of the device. It is used to hold the DCP shafts
plumb and to limit the upward movement of the hammer.
2. Hammer: The 8 kg (17.61 lb.) Hammer is manually raised to the bottom of the handle and
then dropped (allowed to free fall) to transfer energy through the lower shaft to the cone tip.
It is guided by the upper shaft.
3. Upper Shaft: The upper shaft is a 16mm (5/8") diameter steel shaft on which the hammer
moves. The length of the upper shaft allows the hammer to drop a distance of 575mm
(22.6").
4. Anvil: The anvil serves as the lower stopping mechanism for the hammer. It also serves as a
connector between the upper and lower shaft. This allows for disassembly which reduces the
size of the instrument for transport.
5. Lower Shaft: The lower shaft is a 16mm (5/8") diameter steel shaft, 900-1200mm (35 - 47")
long, marked in 5mm (0.2") increments for recording the penetration after each hammer
drop.
6. Cone: The cone measures 20mm (0.787") in diameter. The cone tip should have a 60 degree
angle (Figure 22, b).
Caution:
1. Always use caution to avoid pinching fingers between the hammer and the anvil. During
testing, use the handle to hold shafts plumb. Do not hold the DCP near the anvil area.
2. It is important to lift the hammer slowly and drop it cleanly, allowing at least two seconds to
elapse between drops. Lifting and dropping too rapidly may affect results because the
hammer's full energy may not be allowed to transfer to the lower shaft. This will cause
incorrect test results.

71
Figure 22 Dynamic Cone Penetrometer (DCP) Device
C.1 Procedure – Base Aggregate and Granular materials.
1. Locate a level and undisturbed area (test site) that is representative of the material to be
tested.
2. Place the DCP device on the base aggregate test site. To properly seat the DCP (coned tip),
two hammer blows are required. Therefore, carefully raise the sliding weighted hammer
until it meets the handle, then release the hammer under its own weight. Repeat this process
one more time for a total of two complete blows. If the seating processes cause initial
penetration exceeding 40mm (1.6"), move the test site at least 12” (300 mm) from the
previous test location and reseat the cone. If the second test site still does not meet the
seating criteria, DCP testing for density cannot proceed. The area being tested must be re-
compacted.
3. No seating requirement is used for granular materials.
4. Record the penetration measurement after seating using the graduated rule on the DCP. The
measurement is taken to the nearest mm (0. 1 "). (Use form G&B-204), Figure 23).
5. Carefully raise the hammer until it meets the handle, then release the hammer under its own
weight. Repeat this process two more times for a total of three times.
6. Record the final penetration measurement using the graduated rule on the DCP. The
measurement is taken to the nearest mm (0.1”).
7. Subtract the measurement in step 3 from the measurement in step 5 and then divide the
difference of the measurements by the number of blows (3) required for testing. If necessary,
follow the formula on the test form to convert from inches to mm. Round off all test results
a b (replaceable point tip)

72
to the nearest mm or one tenth of an inch, see section, “5-692.705 “Procedures for “Rounding
Off”.
8. No moisture test required if the hardest penetration requirement is meet.
C.2. Procedure: Edge Drain Trench Filter Aggregate (2502)
1. After the compaction of the first 50” (15 m) of filter aggregate within the edge drain trench
has been completed, determine the location of three test sites that are 10’ (3 m) apart within
that first 50’ (15 m).
2. Calculate the number of hammer drops (blows) necessary to 'properly test the trench filter
aggregate but not damage the edge drain pipe by subtracting 6” (150mm) from the depth of
the trench to be tested and dividing that total by 75 for metric measurements or 3 for English
measurements. If necessary, round this number down to the next whole number, Figure 24.
Example: If the trench depth equals 650mm (26").
then 650mm (26") minus 150mm (6") equals 500mm (20").
then 500mm (20") divided by 75 (for Metric) or 3 (for English) equals 6.7 or 6.
3. Place the DCP on test site #1 and seat the coned tip of the device by slightly taping the lower
anvil with the hammer until the coned tip is just out of sight.
4. After seating, record the penetration measurement using the graduated rule on the DCP. The
measurement is taken to the nearest mm (0. 1"). (Use form G&B-201, Figure 25).
5. Carefully raise the hammer until it meets the handle, then release the hammer under its own
weight. Repeat this process until the total number of hammer drops equals the required
number of blows as calculated in step 2. Also, beware and avoid the chance of penetrating
the edge drain pipe at the bottom of the trench when the compaction of the trench is less than
passing.
6. Record the final penetration measurement from the graduated rule on the DCP. The
measurement is taken to the nearest mm (0.1”)
7. Subtract the measurement in step 4 from the measurement in, step 6 and then divide the
difference of the measurements by the number of blows required for testing. The result is the
penetration index. If necessary, follow the formula on the test form to convert from inches to
mm.
8. Use the same procedures as outlined above for testing sites #2 and #3.
9. Add the three penetration index results from test site #1, #2 and #3 and divide that total by 3
in order to calculate the average of all three tests. Round off the average of the tests to the
nearest mm (0.1") see section, “5-692.705, Procedures for “Rounding Off”.
D. Maintenance and Handling
Due to the fact that the Dynamic Cone Penetrometer (DCP) is driven into the ground, sometimes
into very hard soil layers, regular maintenance and care are required. To ensure that the DCP
operates properly, the following guidelines must be followed.
1. Monitor the condition of the connection bolt. Extra bolts should be kept in the DCP carrying
case because they frequently become stripped or broken and may need to be replaced during
testing.
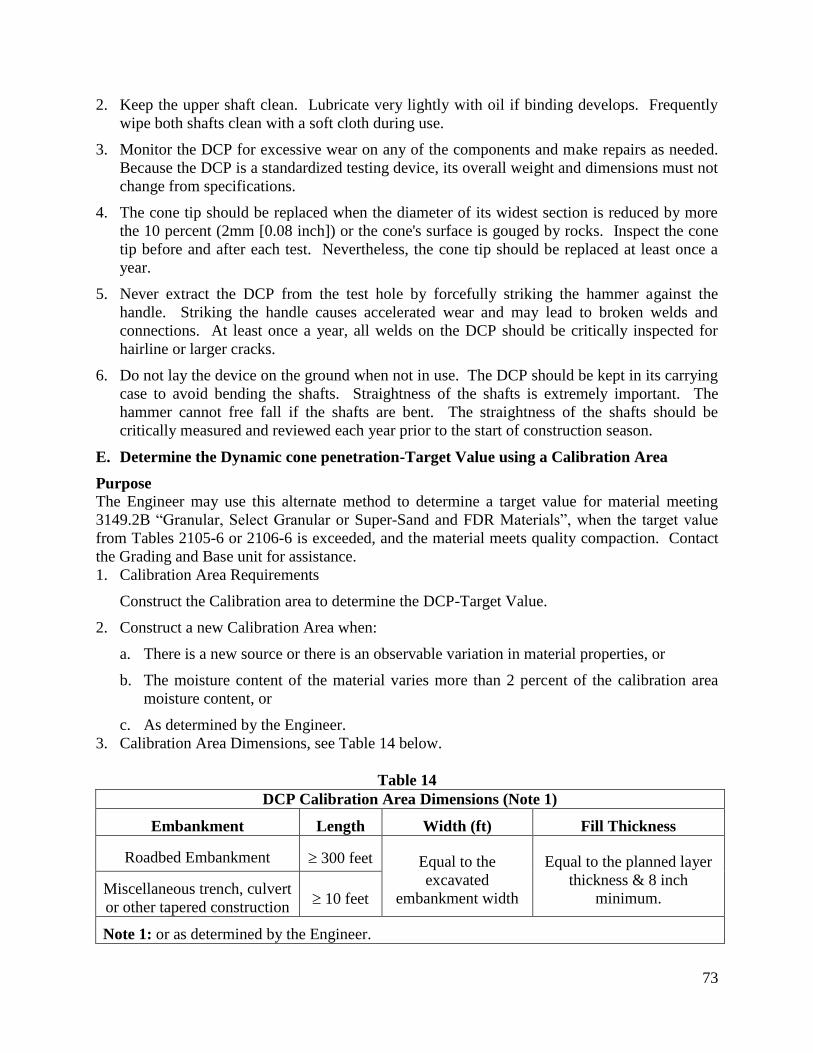
73
2. Keep the upper shaft clean. Lubricate very lightly with oil if binding develops. Frequently
wipe both shafts clean with a soft cloth during use.
3. Monitor the DCP for excessive wear on any of the components and make repairs as needed.
Because the DCP is a standardized testing device, its overall weight and dimensions must not
change from specifications.
4. The cone tip should be replaced when the diameter of its widest section is reduced by more
the 10 percent (2mm [0.08 inch]) or the cone's surface is gouged by rocks. Inspect the cone
tip before and after each test. Nevertheless, the cone tip should be replaced at least once a
year.
5. Never extract the DCP from the test hole by forcefully striking the hammer against the
handle. Striking the handle causes accelerated wear and may lead to broken welds and
connections. At least once a year, all welds on the DCP should be critically inspected for
hairline or larger cracks.
6. Do not lay the device on the ground when not in use. The DCP should be kept in its carrying
case to avoid bending the shafts. Straightness of the shafts is extremely important. The
hammer cannot free fall if the shafts are bent. The straightness of the shafts should be
critically measured and reviewed each year prior to the start of construction season.
E. Determine the Dynamic cone penetration-Target Value using a Calibration Area
Purpose
The Engineer may use this alternate method to determine a target value for material meeting
3149.2B “Granular, Select Granular or Super-Sand and FDR Materials”, when the target value
from Tables 2105-6 or 2106-6 is exceeded, and the material meets quality compaction. Contact
the Grading and Base unit for assistance.
1. Calibration Area Requirements
Construct the Calibration area to determine the DCP-Target Value.
2. Construct a new Calibration Area when:
a. There is a new source or there is an observable variation in material properties, or
b. The moisture content of the material varies more than 2 percent of the calibration area
moisture content, or
c. As determined by the Engineer.
3. Calibration Area Dimensions, see Table 14 below.
Table 14
DCP Calibration Area Dimensions (Note 1)
Embankment Length Width (ft) Fill Thickness
Roadbed Embankment 300 feet Equal to the
excavated
embankment width
Equal to the planned layer
thickness & 8 inch
minimum. Miscellaneous trench, culvert
or other tapered construction 10 feet
Note 1: or as determined by the Engineer.

74
4. Calibration Area construction is incidental to the embankment compaction requirements.
5. Have 3 locations/roller pass spaced out a minimum of 20 feet for embankment or 2
locations/roller pass spaced out a minimum 6 feet minimum for trenches.
6. For each additional rolling pass, space testing locations at least 1 feet from the prior test
location.
7. Continue roller passes and testing to determine the minimum penetration index value.
8. Penetration value should be with in 5mm of each other.
9. When minimum penetration values are reached, average these measurements, for the three
embankment locations or two locations for a trench. The DCP-Target Value is the average
plus 2 mm.
10. DCP-Compaction compliance: Compaction compliance is achieved when each Penetration
Index is no greater than the DCP-Target Value.
11. Document on the DCP form that an alternate DCP-Target value was used based upon a
calibration area.

75
Figure 23 Penetration Index Method Example (Form G&B-204)
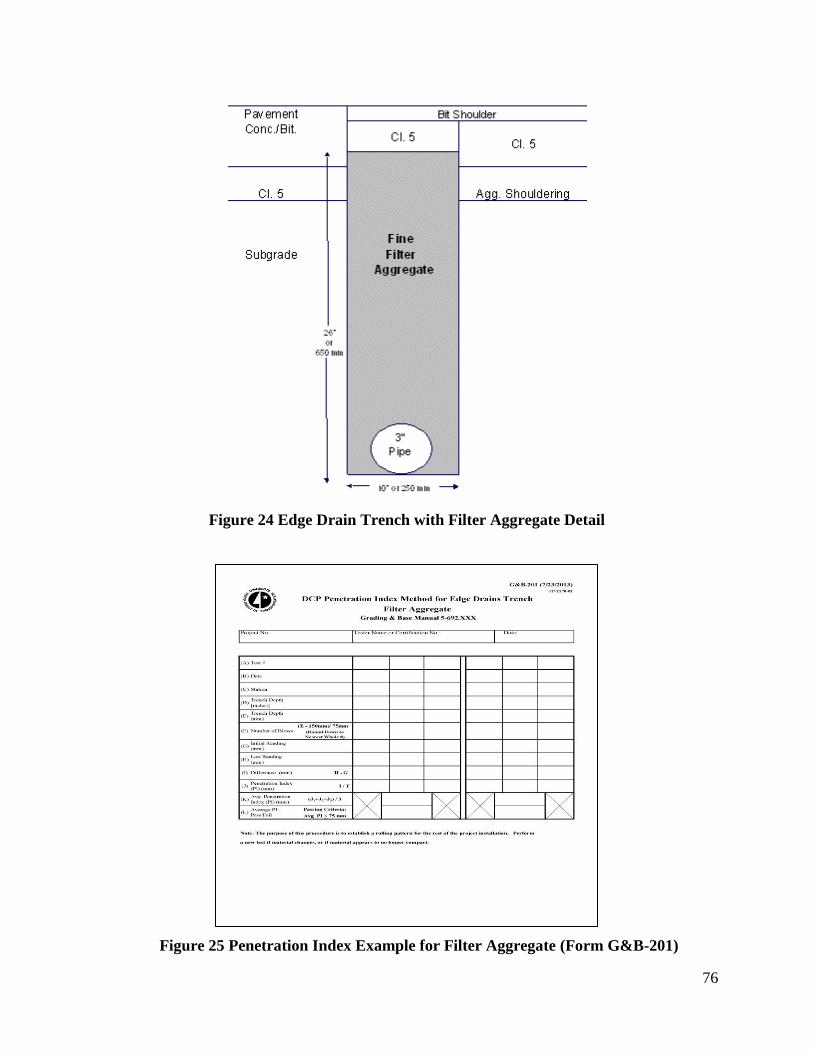
76
Figure 24 Edge Drain Trench with Filter Aggregate Detail
Figure 25 Penetration Index Example for Filter Aggregate (Form G&B-201)

77
5-692.256 Light Weight Deflectometer – LWD Procedure & Target Value Determination
Part 1 – LWD Procedure for Zorn ZFG2000
A. Summary of Test Method
1. This test method is a plate-bearing test. The load is generated by a falling mass dropped onto
a plate that transmits the load pulse on the tested material.
2. The weight is raised to a preset height that when dropped imparts a force pulse, and the
vertical deflection is measured.
3. The peak deflection resulting from the force pulse at each location is recorded.
4. The drop height of the falling weight is fixed and not changeable by the user.
5. If another device is used, follow the manufacturer’s operating manual
B. Equipment
The Zorn LWD is comprised of the following elements (see Figure 26).
1. “Handle Grip” is located at the top of the device. It is used to hold the LWD guide rod
plumb and to limit the upward movement of the falling weight.
2. “Top Fix and Release Mechanism” holds the falling weight at a constant height. The release
mechanism is depressed to allow the falling weight to freely drop and transmit the load pulse
through the plate resting on the tested material.
3. “Guide Rod” allows the falling weight to drop freely the set distance of about 20 inches.
The guide rod and the falling weight together weigh about 33 pounds.
4. “Falling Weight Grip” provides a grip for the operator to raise the falling weight to the top
fix and release mechanism.
5. “10-kg Falling Weight” is manually raised to the bottom of the grip and held in place using
the top fix / release mechanism.
6. “Lock Pin” has two positions (locked and unlocked). Pull the pin to release the falling
weight for measurements.
7. “Steel Spring” provides the buffer system that transmits the load pulse to the plate resting on
the material to be tested.
8. “Anti-Tipping Fixture” prevents the guide rod and falling weight from tipping when these
parts are placed, and standing freely, on the load center ball / loading plate.
9. “Load Center Ball” serves as a connector between the anti-tipping fixture and the loading
plate. It also allows for disassembly, which reduces the size of the instrument for transport.
10. “Carry Grip” provides handles to assist the operator with carrying the loading plate.
11. “Loading Plate” provides an approximate uniform distribution of the impulse load to the
surface. The loading plate weighs about 33 pounds.
12. “Cable” is used to connect the loading plate sensor to the data processing and storage
system.

78
Figure 26 Schematic drawing of light weight deflectometer.
Data Processing and Storage System (see Figure 27):
Deflection data is displayed and recorded on the data processing and storage system.
Figure 27 Sketch of electronic output device.
C. LWD Configuration
The standard LWD configuration is as follows:
Falling Weight: 10 kg
Load Plate Diameter: 200 mm
Drop Height: See calibration plate connected to the LWD device.
79
D. Testing Constraints
1. Perform test immediately after compaction.
2. Test when the air temperature is from 36 to 120 degrees Fahrenheit.
3. Ensure soil is not frozen.
E. Site Selection and Preparation
1. Visually inspect the percentage of gravel in the soil. Ensure the percentage of gravel, larger
than 1 – ½”, is less than 25 percent.
2. Create a relatively smooth and level spot that will allow the LWD guide rod to remain
vertical and prevent sliding of the loading plate during testing.
3. Select the most yielding area.
4. Prepare a test area that is at least 1.5 times wider than the diameter of the plate, i.e. 1 square
foot.
5. Remove loose, dried, cracked or uneven material prior to testing.
6. Perform tests at a uniform depth, representative of the compaction state. Ensure consistent
test depths are used, for each target value determined from Part 2 of this section.
7. The influence depth is approximately 1 to 1.5 times the plate diameter; consequently,
deflection measurements obtained for lifts less than this depth are a composite deflection
measurement.
F. Procedure
1. Position loading plate on test site.
2. Turn loading plate left and right 45 degrees.
3. Perform six falling weight load pulses and use the following procedure for each load pulse:
a. Raise falling weight to calibration height (preset drop height).
b. Snap falling weight into fix and release mechanism.
c. Adjust guide rod to vertical.
d. Release falling weight and allow it to freely fall.
e. Catch falling weight after rebound.
f. Snap weight into fix and release mechanism after rebound.
4. Store resulting deflection measurements from drops 1 through 6 on Smartcard.
5. Record the Smartcard number for seating (drops 1-3) and the Smartcard number and
deflections measurements for the test (drops 4-6) on data collection form.
6. Record supporting information such as location measurements and identification data.
7. Repeat deflection measurements at another location (move at least two feet longitudinally)
when either of the following or similar occurs:
a. Miss catch of falling weight after rebound.

80
b. The load plate slides.
8. Obtain the moisture content on a sample collected 3 to 9 inches below LWD test depth
surface using a test method in the Grading and Base Manual. Record the moisture content
information on the LWD form.
9. Use the first three drops for “seating” and the next three drops for analysis.
10. Make sure the falling weight falls exactly from the calibration height.
11. Ensure the following for LWD equipment constructed using a centering ball: (1) the guide
rod is not removed from the centering ball and (2) the load plate is not displaced during
testing.
G. Safety
1. Keep back straight and lift with leg muscles to help prevent injury when elevating and
dropping the falling weight.
2. Make sure hands or extremities are not positioned beneath the lifted, falling weight or
loading plate to avoid injury.
3. Secure falling weight into the lower position prior to transport to prevent injury from
movement of the falling weight.
H. Maintenance and Handling
1. Inspect equipment for necessary repairs.
2. Store LWD in dry place when not in use.
3. Make sure guide rod is not directly resting on soils.
4. Clean the loading device by removing any dirt with a dry cloth. Do not grease/oil the guide
rod.
5. Check the drop height regularly to ensure that slippage of the release mechanism has not
occurred.
6. Recharge batteries after 3 to 12 hours of use or on 3-month intervals when not in use.
7. Charge or replace the battery when the charging level is less than 50 percent.
8. Ensure rubber bellow is providing a tight seal around the spring for deflectometers with
spring systems.
I. Calibration
Calibrate the force generation device and the deflection sensor once per year per ASTM E 2835.
Have copy of Calibration Certificate available for the Independent Assurance Inspector.
Part 2 Light Weight Deflectometer (LWD) Target Value Determination
A Definitions
“Deflection Test Measurement” is the average deflection measured from the fourth, fifth and
sixth drop in the testing sequence. The first, second and third drop in the testing sequence are
seating drops.
“LWD-TV” is the LWD Target Value determined using a calibration area for a given soil type or
source.

81
B LWD Testing Constraints
The LWD Deflection Method cannot be used when:
1. Embankment thicknesses are less than 1 foot, or
2. base thicknesses are less than 6 inches, or
3. when testing within 3 feet of the water table.
The required surface material thickness to remove prior to LWD testing is presented in Part 1 of
this section under LWD Procedures.
C Determine the LWD-TV using a Calibration Area
1. Calibration Area Requirements
Construct the Calibration area to determine the LWD-TV for each type or source of materials.
4. Construct a new Calibration Area when:
a. There is a new source, or an observable variation in material properties or a proctor is
required,
b. The moisture content of the material varies more than 2 percent of the calibration area
moisture content, or
c. as determined by the Engineer.
5. Calibration Area Dimensions, see Table 15 below.
Table 15
LWD Calibration Area Dimensions (Note 1)
Embankment Length Width (ft) Fill Thickness
Roadbed Embankment Soil
and Base 300 feet Equal to the
excavated
embankment width
Equal to the planned layer
thickness for base & 12 inch
minimum for embankment Miscellaneous trench, culvert
or other tapered construction 10 feet
Note 1: or as determined by the Engineer.
4. Moisture Requirements
a. Determine the Target Moisture Content by one of the following:
i. Standard Proctor
ii. 1-Point Proctor
iii. Estimated Optimum Moisture Content Form G&B-305 (for Granular or base only)
b. The moisture content must be from 65 to 90 percent of the Target Moisture Content for
embankment material and between 5 – 8% for base.
5. Save a material sample from each calibration area for comparison to the embankment
material being compacted.
6. Calibration Area construction is incidental to the embankment compaction requirements.

82
7. Space out calibration test locations a minimum of 20 feet apart for base and embankment and
6 feet minimum for trenches.
8. For each additional rolling pass, space testing locations at least 2 feet from a prior test.
9. Start test curve determination at least two passes before you think maximum compaction will
be achieved.
10. For Roadbed Embankment Soil and Base have 3 Tests locations/roller pass
11. For trench, culvert or other tapered construction have 2 Tests locations/roller Pass
12. Forms are available on the Grading & Base website.
13. Continue roller passes and testing to determine the minimum deflection value.
14. Calibration Area Construction
a. Begin LWD testing on the test layer at least two passes before you believe you will reach the
desired compaction. Start test curve determination will be achieved.
b. LWD-TV Compaction is obtained when:
i. The Moisture content is within the acceptable range.
ii. The average of the Deflection Test Measurements, for three consecutive passes, does not
significantly change with additional compaction. The LWD-TV is the lowest, average
Deflection Test Measurement from these passes.
15. LWD-Compaction compliance
a. Compaction Compliance Requirement
Compaction of the material is achieved when each Deflection Test Measurement is
≤1.30LWD-TV.
b. Obtain new LWD-TV when:
i. More than 20 percent of the Deflection Test Measurements are ≤ 0.60LWD-TV, or
ii. Failing results consistently occur and adequate compaction is observed through quality
compaction.
Testing Rate
Follow Schedule of Materials Control.
5-692.260 Pulverization Determination for Binder Soils
A. Scope
This test method covers a procedure for the field determination of the degree of pulverization of
binder soils.
B. Equipment
1. 30 lb. (27.2 kg) capacity electronic scale with decimal graduations in tenths of a lb. (kg).
Note: Interpolate reading to the nearest 0.05 kg for metric only.
2. Two 12 (quart) liter pails

83
3. 3/4” (19 mm) sieve, No. 4 (4.75 mm) sieve
C. Procedure
1. For rate of testing see section, 5-692.100, “Sampling, Random Sampling and Splitting” and
the Schedule of Materials Control. Always use the testing rates contained within the contract
Schedule of Materials Control, specifications and special provisions.
2. Obtain a representative sample weighing approximately 30 lbs. (15 kg).
3. Use the moist weight for all computations.
4. Record the moist weight of the sample.
5. Pass the sample through the required sieve sizes in such a manner that disintegration of the
soil clods will not occur. The fraction retained on each sieve shall be weighed on the
electronic scale and the weight recorded.
6. Compute the percent of material passing each sieve size as follows:
(Moist weight of material passing sieve size/moist weight of total sample) x 100%
5-692.270 Test Rolling
A. Scope
Test rolling of subgrades, subbases, bases, surfacing, and stabilized full depth reclamation with
heavyequipment is a procedure performed to evaluate the adequacy of the roadbed construction
relative to uniformity and consistency of the support in terms of strength, stiffness, density and
moisture content. Test rollers detect weak /unstable areas due to inadequate compaction (both in
terms of moisture content and density). The detected failed areas will require corrective
measures. These measures may include removing the unstable/unsuitable materials, reducing the
moisture content by aeration and the recompaction.
B. Equipment
See equipment requirements in the special provisions or specifications for 2111.
1. The Department has two test rollers:
a. A 30 ton single axeled trailer (TR30)
b. A tandem truck with a front axel with up to 10 tons (TR 10)
2. Use either test roll 30 (trailer with single 30 ton axel load) or test roller 10 (tandem truck with
front axel up to 10 tons) on embankment materials. Use Test roller 10 on all other materials.
The designated test roller shall comply with the provisions of Specification 2111. The
Inspector should check the equipment for compliance. Use the Table 16 below to determine
when to use each test roller, and specify which test roller to use for each layer in the plans.
3. The test roller shall be weighed. If certified weights are furnished, these may be accepted.
Special care could be taken to measure tire pressure correctly.

84
Table 16 Requirements on when to use Test Roller 30 and 10
Specification Site Conditions
Testing Surface
Test Roller 30
(Standard Test
Roller, 30k axle
Load)
Test Roller 10
(Tandem Truck)
Mainline, passing &
turn lanes and
ramps.
Mainline, passing & turn
lanes, ramps & field
entrances
2105 / 2106
New Construction ≥ 2-lane miles
Layer Thickness is ≥ 30 in.
No utilities within 30 in of testing
surface.
No geotextiles within 60 in of
testing surface.
Top of Subgrade
layers
Top of Subgrade layers
2 feet below Grading
Grade
Grading Grade
(Note 1)
● New Construction < 2-lane miles
in length.
Layer Thickness < 30 in.
Utilities are within 30 in of
testing surface.
Geotextiles are within 60 in of
testing surface.
Roadway segments with
relatively closely spaced bridge
overpasses.
…
Top of Subgrade layers
2 feet below Grading
Grade
Grading Grade
(Note 1)
2211
Layer Thickness ≥ 4 in. …
Top of Aggregate Base
2215
Top of Full Depth
Reclamation (FDR) and
Stabilized Full Depth
Reclamation (SFDR)
2221 Top of Shoulder Base
Aggregate
2118 Top of Aggregate
Surfacing
Note 1: In order to assess the entire layer, test roll at the top of the subgrade and 2 feet below
when using Test Roller 10 on subgrade fill sections greater than 30”.
C. Procedure
The procedure is provided in Specification 2111.

85
D. Record
The roller, weights, tire pressure, and record of failing areas should be recorded in the Inspector's
diary.
E. Test Application
Test rolling failures are generally related to excessive moisture, lack of density, or unsuitable
material. Weak areas disclosed by the test roller should be investigated and the cause determined.
Correct failing areas and re tested as provided for in Specification 2111.
Roadway segments with numerous, closely spaced, shallow, underground structure (culvert,
storm sewers, other utilities, etc.). In all situations where test rolling is utilized, shallow
structures must be protected against damage from the test roller. Structures should have at least
30” (750mm) of soil cover prior to testing the subgrade. This depth may require the temporary
increase in soil cover over the structure (construction of a blister).
5-692.280 Modified Moisture-Density Test
A. General
The modified moisture density (Proctor) test is used to determine the relationship between the
moisture content and the density of soil or aggregate material (including bituminous stabilized
materials) when compacted by following a standard procedure. This method uses a 10-lb
rammer and an 18-inch drop and is consistent with AASHTO T 180, Method D.
This method determines the maximum dry density by varying the moisture content. The
optimum moisture content is the moisture content (expressed as percent of dry weight) of the
material at the maximum density. When compaction is controlled by the specified density
method, the moisture content of the material being placed is compared to the optimum moisture
content and the density of the in place compacted material is compared to the maximum density
to determine specification compliance.
Materials with a moisture content lower than the optimum require more compactive effort than
the same soil with a moisture content near “optimum”. Materials with a moisture content higher
than “optimum” tend to be unstable and may be impossible to compact.
B. Equipment
1. Proctor mold: A cylindrical metal mold having a capacity of 1/13.33 ft3 with an internal
diameter of 6-inches and a height of 4.584 ± .005 inches. The mold shall have a detachable
collar assembly and base plate (Figure 9, a).
2. Rammer: Metal rammer having a flat circular face of 2 inch diameter and weighing 10 lbs.
The rammer shall be equipped with a guide sleeve to control the height of drop to a free fall
of 18 inches above the soil (Figure 9,c).
3. Electronic platform scale: The platform scale shall have a minimum capacity of 30 lbs.; it
shall be sensitive to 0.01 lb. and the minor graduations on the indicator shall be 0.01 lb.
4. Electronic scale: The scale shall have a minimum capacity of 2500 g; it shall be sensitive to
0.1 g and the minor gradations on the indicator shall be for 0.1 g.
5. Drying oven or stove.

86
6. Mixing tools (Figure 9, b).
7. Spatula and butcher knife (Figure 9, b).
8. Box sieves, 2”, 3/4”, 3/8”, No. 4 with bottom pan.
9. Concrete compaction base. A block of concrete weighing not less than 200 lbs. supported on
a stable foundation; a sound concrete floor or other solid surface found in concrete box
culverts, bridges and pavement. Figure 9 shows typical test equipment set up.
C. Sample Preparation
1. Obtain a sample of the reclaimed material according to the procedures described in “D
Bituminous Stabilized Base (SFDR) –Proctor Test using Modified Effort of section, 5-
692.180. Sampling Bituminous Stabilized Materials”.
2. If the soil sample is damp, dry it until it becomes friable under a trowel. The sample may be
air dried or dried in the oven or on the stove such that the temperature does not exceed 140ºF.
3. Sieve an adequate quantity of the sample over the ¾-inch on bottom pan. Break up all lumps
to pass the sieves.
4. Discard the stones retained on the ¾-inch sieve.
Note: Do not replace oversize particles with finer particles, even at the same ratio
(percentage) of coarse material, to compute maximum density.
5. Select about 25 lbs. (11 kg of the prepared material using a procedure described in sections:
5-692.141 Quartering Method of Sample Size Reduction
5-692.142 Ring and Cone Method of Sample Size Reduction
5-692.143 Riffle Splitter Method of Sample Size Reduction
D. Procedure: Multi-Point (Standard Method using modified effort)
This test consists of compacting a portion of a soil sample in a mold at different moisture
contents ranging from dry to wet. At least 4 samples will be run. The samples will differ in
moisture content by one to two percent with the driest sample being about four percentage points
below optimum moisture. This would result in two of the samples being below optimum, one
near optimum and one over optimum. A valid test will have 2 points below optimum.
1. Thoroughly mix the selected representative sample with sufficient water to dampen it to
approximately 4 percentage points below optimum moisture content. A good indication of
the soil being nearly right for the first point is if the soil barely forms a “cast” when
squeezed.
2. Determine the weight of the mold and base plate. Record the weight as “B Wt. Mold” (Figure
10). Do not include the weight of the collar.
3. Place the assembled mold, including collar, on the concrete compaction base.
4. Place enough of the sample into the mold for one layer.
Note: The mold is filled with five equal layers of compacted material.
5. Compact the loose material by 56 uniformly distributed blows from the rammer dropping
freely from a height of 18” above the soil.

87
6. Repeat Steps 4 and 5 until the five layers are placed and compacted.
7. Remove the collar and carefully trim the compacted soil with the knife until it is even with
the top of the mold (check with the spatula). Remove any stones dislodged by trimming and
fill the holes by carefully pressing finer material into place. Trim around any stones that are
at least half buried and solidly seated.
8. Clean all the loose material from the mold and base plate and weigh it on the platform scale
to the nearest gram. Record the weight as “A Wt. Wet Soil + Mold”.
9. Remove the mold from the base plate and loosen the locking devices so that the compacted
material can be removed from the mold.
10. Quarter the compacted material by slicing twice vertically through the compacted soil.
Select one of the quarters and weigh immediately. Conduct the moisture determination per,
“5-692.245, Moisture Test”.
Note: A representative sample must consist of nearly equal portions of material from all three
layers. When the “Speedy” method is used, take the sample the same way as the burner dry
method and use a representative portion for the moisture determination.
11. Thoroughly break up any remaining portion of the molded specimen and add it to the sample
being tested.
12. Add enough water to increase the moisture content about two percentage points.
Note: In each repetition the material shall be thoroughly mixed before compaction to assure
uniform dispersion of the moisture throughout the sample.
13. Repeat Steps 4 thru 12 until the “Wt. Wet Soil + Mold” determined in Step. 8 either
decreases or fails to increase. At this point the compacted material should be soft and
spongy; granular material may not be very spongy but will be extremely wet. The
spongy condition indicates that the moisture content of the sample exceeds optimum.
E. Calculations
1. Wet Density
A = Wt. Wet Soil + Mold lb.
B = Wt. Mold lb.
C = Wt. Wet Soil (A - B)
D = Wet Density, lbs/ft3 (C x 13.33)
Note: 13.33 = Number of “mold castings” per ft3
Example:
A = 24.892 lbs.
B = 15.184 lbs.
C = 24.892 – 15.184 = 9.708 lbs.
D = 9.708 x 13.33 = 129.4 lbs/ft3
2. Percent Moisture Burner Method

88
E = Wt. Wet Soil + Pan grams
F = Wt. Dry Soil + Pan grams
G = Wt. Moisture (E - F)
H = Wt. pan, grams
I = Wt. Dry Soil (F - H)
J = % Moisture, Wet Wt. [G/(E - H)] x 100
K = % Moisture, Dry Wt. = (G/I) x 100 Example:
E = 365.6 grams
F = 350.2 grams
G = 365.6 - 350.2 = 15.4 grams
H = 93.8 grams
I = 350.2 - 93.8 = 256.4 grams
K = (15.4/256.4) x 100 = 6.0%
3. Speedy Method
If the % Moisture, Wet Wt. (J) is recorded, determine and record the % Moisture, Dry Wt. (k) by
using Table 13 or the following formula:
K = 100J/(100-J)
Example: J = 5.6 (gauge reading from Speedy Moisture Meter)
K = (100 x 5.6)/(100 – 5.6) = 560/94.4 = 5.9%
4. Dry Density
L = Dry Density, lbs/ft3 [pcf] (kg/m
3) = D/(100 + K) x 100
Example: English: L = 129.4/(100 + 6.0) x 100 = 122
F. The Maximum Density and Optimum Moisture Content
The Maximum density and optimum moisture are determined by graphing the information
obtained by compacting the samples at various moisture contents. Each moisture content relates
to a wet density and to a dry density.
Point No.
No. 1 No. 2 No. 3 No. 4
D. Wet Density 129.4 134.6 138.8 138.4
K. % Moisture 4.2 6.0 8.4 10.5
L. Dry Density 124.2 127.0 128.0 125.3
Important Notice: The drawing of the “wet” curve is not required if the laboratory tester has
compacted four adequate points as described previously. But, if the “wet” curve is not drawn,
the “dry” curve must be computer generated. All discrepancies between companion samples

89
shall be resolved by plotting the “wet” curve by hand and interpolating the “dry” curve points as
shown below.
1. Plot the wet densities against the moisture contents.
2. Draw a smooth curve thru the plotted points. (Figure 11). This is the “wet curve”.
3. Plot the dry densities against the moisture contents (Figure 11). Additional “dry points” may
be interpolated from the “wet curve”.
Example: In Figure 11, Points P and PP are used to establish points P1 and PP1 on the “dry
curve”.
D. (Wet Density) for Point P = 125.0 lbs/ft3
K. (Moisture) for Point P and P1 = 15.4%.
L. (Dry Density) for point P1 = 125/(100 + 15.4) x 100 = 108.3 lbs./ft3
D. (Wet Density) for Point PP = 126.2 lbs/ft3
K. (Moisture) for Point PP and PP1 = 16.2%.
L. (Dry Density) for point PP1 = 126.2/(100 + 16.2) x 100 = 108.6lbs/ft3
4. Draw a smooth curve thru the plotted points (Figure 11). This is the “dry curve”.
5. Read the maximum density and optimum moisture from the peak of the “dry curve” (Figure
11). Maximum Density = 108.6 lbs/ft3; Optimum Moisture = 16.2%.
Note: Figure 12 is an example of computer generated proctor curves and does differ very
slightly from the hand drawn version of Figure 11.
G. Procedure: One-Point Moisture Density (Proctor) Using Modified Effort
Use this method for determining the standard maximum density and optimum moisture. This
method is for field testing only. Never use the one-point Proctor method in lieu of a "multi-
point" moisture-density test. Use the one-point method to analyze subtle changes, including, but
not limited to changes in: color, texture, structure (i.e. RAP to granular base ratio), etc. Also, use
one-point Proctors to verify changes in maximum density and optimum moisture indicated by
relative densities failing to meet specified density requirements even though operations have not
changed and previous tests have passed. Relative density tests exceeding 106 percent suggest
zero air voids and indicate a possible change in maximum density. Run a one-point Proctor to
confirm the suspected change. Use the "multi-point" moisture density test for the material
closest to the soil with this subtle change to check the testing accuracy of the one-point Proctor.
A reasonable variation should not exceed plus or minus 3 lbs/ft3. If the variation exceeds 3
pounds, run another "multi-point" Proctor.
1. Obtain a representative sample of the reclaim material according to the procedures described
in “D. Bituminous Stabilized Base (SFDR) – Proctor Test using Modified Effort of section,
“5-692.180, Sampling Bituminous Stabilized Materials”.
2. Sieve the sample through the ¾-inch sieve. If it is necessary to dry the sample, do not allow
it to become “oven” or “stove” dry.
3. Weigh the material retained on the ¾-inch sieve, record the weight and discard the material.

90
Note: Do not replace oversize particles with finer particles, even at the same ratio
(percentage) of coarse material, to compute maximum density.
4. Weigh the portion of the sample passing the ¾-inch sieve. Record the weight.
5. Determine the weight of the mold and base plate. Record the weight.
6. Place the assembled mold, including the collar, on the compaction base.
7. Scoop enough material into the mold for 1 layer.
8. Compact the loose material with 56 evenly distributed blows with the rammer dropped from
18 inches.
9. Repeat Steps 10 and 11 until 5 layers are in-place.
10. Remove the collar and trim the compacted material with a knife until even with the top of the
mold (Check with a spatula).
11. Brush all loose material from the mold and base plate and weigh the mold to the nearest 0.01
lb. on the platform scale. Record the weight.
12. Calculate the wet weight per cubic foot of the compacted material.
F = 30 (D - E)
F = Wet wt. per ft3
D = Weight of wet soil and mold (Step 14).
E = Weight of the mold (Step 8).
Example: D = 25.3 lbs., E = 15.2 lbs.
F = 13.33 (25.3 – 15.2)
F = 134.3 lbs/ft3
13. Remove the mold from the base plate and loosen the locking devices so the compacted
material can be removed from the mold.
14. Select a representative sample for a moisture test. Conduct the test according to the
procedures in 5.692.245, Record the results.
5-692.281 Moisture Test for Bituminous Stabilized Materials
When asphalt emulsion is used, determine the total fluid content per section, “5-692.245.
Moisture Test” except that the Calcium Carbide Moisture Tester shall not be used. The sample
shall be dried to a constant weight in an oven or over an open burner at a temperature not to
exceed 230° F (110° C). If the sample is dried over an open burner, a sand bath must be used
and the heat applied cautiously in order to keep the sample under 230° F (110° C). A sand bath
is constructed by placing a 1” (25mm) to1-1/2” (40mm) layer of sand in a metal pan. The
sample, in the drying pan, is then placed on the sand bed to dry. The total fluid content is
compared to the Optimum Moisture of untreated base aggregate or soils to determine the relative
moisture of the mixture at time of compaction. Constant weight is defined as no change greater
than 0.5 grams in 15 minutes.
Example: Total fluid content of the treated base aggregate at time of spreading and
compacting = 10.5%

91
Optimum Moisture of the untreated base aggregate = 11.0%
Relative Moisture of the mixture (%) = (10.5/11.0) x 100% = 95%
5-692.282 In-Place Density Using Nuclear Methods
A. General
This test method is intended to measure the in-place density of compacted bituminous stabilized
base layers (SFDR) and cold in-place recycled bituminous layers (CIR). It is based off of
AASHTO Designation 310.
1. Do not attempt to operate a nuclear gauge before thoroughly reading the Instruction Manual.
2. Do not attempt to operate a nuclear gauge without the proper training, license and
certifications.
B. Equipment
1. A recognized nuclear moisture-density gauge containing a radioisotope, detectors and related
circuitry. The gauge shall be capable of determining densities by either the backscatter or
direct transmission methods.
2. A reference standard for the purpose of taking standard counts, and for checking equipment
operation
3. Calibration curves or tables for the gauge
4. A drill rod and combination guide-scraper plate for preparing the testing site
5. Manufacturer Instructional Manual
C.1 Procedure: Backscatter
Backscatter or Backscatter/Air-Gap Ratio Method of In-Place Nuclear Density and Moisture
Content.
1. Place the reference standard in a position recommended by the manufacturer to obtain
standard counts.
2. Allow the gauge to warm up as suggested by the manufacturer.
Take one automatic four-minute standard count per manufacturer instructions. This count should
be within 1% of the latest standard count established for the gauge. In the event the standard
count varies by more than 1%, take four additional automatic four-minute standard counts. Use
the average of the five four-minute counts to establish a new standard count for the gauge.
3. If the day-to-day shift in the standard count varies more than 2% for moisture or 1% for
density, reset the gauge on the standard and repeat the procedure in 3.
Keep a log of the gauge standard counts.
4. Standard counts should be taken twice a day to detect any shift during daily use.
D. Site Preparation
1. Select a location for test where the gauge will be a least 6 in. (150 mm) away from any
vertical projection. Be sure the vehicle is at least 10 ft. (3 m) away from the test site.

92
2. Remove all loose and disturbed material, and remove additional material as necessary to
reach the top of the compacted lift to be tested.
3. Prepare a horizontal area, sufficient in size to accommodate the gauge, using the scraper plate
supplied with the gauge; by planing to a smooth condition so as to obtain maximum contact
between the gauge and material being tested. Make sure the gauge sits solidly on the site
without rocking.
4. The maximum depressions beneath the gauge shall not exceed 1/8 in. (3 mm). Use native
fines or fine sand to fill voids and level the excess with the scraper plate. The total area thus
filled with native fines or sand should not exceed ten percent of the bottom area of the gauge.
E. Moisture Determination
1. Prepare test site as described in C.
2. Obtain a one-minute moisture count.
3. Determine the moisture content form the calibration data supplied with the gauge.
4. The moisture measurement is based upon the thermalization of fast neutrons by hydrogen
atoms. Because bituminous materials contain hydrogen other than free water or may contain
thermalizing elements other than hydrogen, not less than ten moisture samples should be
oven dried to correct the calibration data. If the gauge reading is higher than the values
obtained by oven dry samples, the error is due to hydrogen containing materials, and the
correction may be made by subtracting a constant value from the gauge reading. If the gauge
reading is lower than that obtained by oven drying, the error is likely due to materials which
absorb thermalized neutrons. In this case, the error is not a constant offset, but varies directly
with the moisture content. The compensation is made by adding the full error at moisture
contents used to obtain the error data and reducing the added value at lower moisture
contents. At zero moisture, the error would be zero.
F. Density Determination - Direct Transmission
1. Place the guide plate on the site for the moisture determination and drive the drive pin
through the guide to a depth at least 4 in. (100 mm) below the depth of material to be
measured. Remove the drive pin by pulling straight up in order to avoid disturbing the
access hole.
2. Place the gauge over the access hole and push the index handle down until the source has
reached the desired depth.
3. With the source at the desired depth, pull the gauge so that the probe is in contact with the
near side of the hole, take and record a one minute density count. Determine the wet density
from the calibration data supplied with the gauge.
G. Calculations
1. When determining the moisture correction described in D4, use the oven dry percent of
moisture and the gauge wet density to calculate the moisture content in kilograms per cubic
meter (lbs/ft3) as follows:
% Moisture + 100
% Moisture x Wet Density

93
Moisture Content [kg/m3 (lbs/ft
3)] =
2. Calculate the dry density as follows:
Dry Density = Wet Density - Moist. Content [kg/m3 (lbs/ft
3)]
3. Calculate the percent moisture as follows:
%Moisture = (Moisture Content x 100)/(Dry Density)
5-692.284 Measuring Grinding Depth in the Field
A. General
Measuring grinding depth in the field is a method of determining the reclamation, recycling or
grinding depth of reclamation equipment for: Full Depth Reclamation (FDR), Stabilized Full
Depth Reclamation (SFDR) and Cold In-Place Recycled (CIR) Bituminous projects. This
method uses a straight edge and a tape measure.
B. Apparatus
1. Tape measure A tape measure of measuring stick accurate to the nearest 0.5-inch.
2. Straight Edge – A straight edge long enough to be placed on level ground and reach the tape
measure.
3. Shovel – A shovel to dig down to the bottom of the reclaim material depth.
C. Procedure
1. Be aware of your surroundings! Always wear the proper safety equipment and never stand
behind a reclaimer while it is in motion, wait until it is a safe distance away before
conducting measurements.
2. Use a shovel to reach the bottom of the reclaim layer, use the adjacent bituminous pavement
as a guide.
3. Place the straight edge on the bituminous pavement and the tape measure on the bottom of
the reclamation cut and measure the cut depth the nearest 0.5-inch. Measure the cut depth on
both sides. Ensure that the reclaiming machine is cutting “square”.
5-692.285 Measuring Expansion Ratio and Half-Life of Foamed Asphalt in the Field
A. General
Foaming properties are indicative of the oil’s viscosity (resistance to flow). Two important
properties to characterize foamed asphalt are: half-life (the amount of time it takes for the
volume of asphalt to decrease to half of the previous value) and the expansion ratio (the
maximum volume, or height of the asphalt relative to an un-foamed state) Proper foaming
properties are necessary to ensure that the foamed oil will disperse and mix well with the base
materials. Foamed asphalt that does not foam properly will not create a uniform mix; but will
create stringers (about the size of spaghetti noodles) and balls in the recycled mixture. This test
method describes a measuring the expansion ratio and half-life of foamed asphalt (foamed AC)
for use on Stabilized Full Depth Reclamation (SFDR), or Cold In-Place Recycled (CIR)
Bituminous projects.

94
B. Equipment
1. Tape Measure: A tape measure or measuring stick accurate to the nearest 0.5-inch.
2. 5-gallon bucket – A 5-gallon bucket, or pail that is white (or light colored) on the inside
3. Stop watch, or other time piece
4. Wooden lath
C. Procedure
1. Be aware of your surroundings! Always wear the proper safety equipment and never stand
behind a Reclaimer while it is in motion, wait until it is a safe distance away before
conducting measurements. Foamed asphalt is HOT (+300ºF)!
2. Use the test nozzle on the reclaimer to foam oil into a white 5-gallon bucket. Measure the
time (in seconds) using a stop watch that it takes for the oil to collapse to half of its’
maximum volume (height). Record this time value as the “Half-Life”
3. Divide the maximum height reached by the foamed oil (on the wall of the bucket) by the
height of the oil in the bottom of the bucket (measured on the lath). Record this value as the
“Expansion Ratio”
Figure 28 Measuring Expansion Ratio for Foamed Asphalt
NOTE: BAD SAFETY PRACTCE. WEAR GLOVES!
The half-life and expansion ratio are related to the foaming water in the reclaimer machine:
The Half-Life decreases (bubbles collapse quicker) with an increase in foaming water
The expansion ratio increases (bubbles get bigger) with an increase in foaming water

95
5-692.286 Measuring Field Application Rates for Cement or Bituminous Materials
A. Apparatus – Not Applicable (N/A)
B. Test Procedure
1. Use this method to verify the application rate established in the mix design. Make periodic
checks of the spread rate by calculating the distance a load should cover.
2. Example with Cement of other Mineral Stabilizing Agent — The printout ticket for a
cement tanker shows it is carrying 50,000 lbs. The application rate established by the mix
design is 1.5% by weight. The spreader is set to cover a width of 12 feet. Cement
application will start at Station 100+00. Determine at what station the tanker should run out.
First, find the cement application rate, in pounds from the mix design for a 6-inch (0.5-ft)
stabilized layer:
136.1 lbs reclaim/(ft3) x 0.015lbs cement/lbs reclaim x 9 ft
2/yd
2 x 6/12 ft. = 9.2 lbs cement/yd
2
Next, determine the area that the tanker should cover at the design rate:
50,000 lbs. cement/9.2 lbs. cement/yd2 = 5,435 yd
2
Now find the length the tanker will cover at a width of 12 feet:
(5,435 yd2 x (9 ft
2/yd
2))/12 ft. = 4,076 ft.
The tanker should run out of cement at approximately Station 140+76. If the tanker runs out
more than ± 2% (80 feet) of the estimated point, the spreader should be readjusted and
recalibrated.
3. Example with Asphalt Emulsion — The printout ticket for an emulsion transport shows it
is carrying 50,800 lbs. (25.40 tons) which corresponds to 6008.99 Gallons. The application
rate established by the mix design is 4.0% by weight, or 3.00 gallons per square yard for a 6
inch thick stabilized section. The reclaimer (which is 8 ft. wide) will make two passes, each
over a width of 6 feet. Injection will start at Station 100+00. Determine at what station the
tanker should run out.
Use the relationship:
L = (9 x E)/(RxW)
L = the length the transport will travel, feet
E = Emulsion contained in the tanker, gallons (reported on the invoice)
R = Recommended Application Rate, gal/yd2 (from Mix Design)
W = Treatment Width, feet (Not the machine width)
L = 9 x 6,008.99 gal./((3.00 gal./yd2 x (6 ft. x 2)) = 1,502 ft.
The transport should run out of emulsion at approximately Station 115+02. To find the accepted
range of the transport, use the following relationship:
LAllow = 9 x E/W x (1/Rlow – 1/R)
Where:
LAllow = Allowable difference (±), feet from L found above

96
RLow = Lower application rate, gal/yd2 (i.e., from Mix Design RLow = 3.00 – 0.2 = 2.8 gsy)
Other variables as defined previously.
LAllow = (9 x 6,008.99 gal/(6 ft x 2)) x (1/2.8 – 1/3.0) = 54,080.91/12 x (0.3571 – 0.3333) =
(4,506.74) x (0.0238) = 107 ft.
If the transport runs out more than (107 feet) from the estimated point, the reclaimer should be
recalibrated according to the manufacturer’s recommendations and re-verified.
5-692.288 Soil-Cement Laboratory Design Procedure
1. Scope
This method is to determine the proportions of soil, water and Type 1 portland cement per
MnDOT 3101, which when incorporated in a mixture with water, will provide durable
support as a stabilized soil.
2. Apparatus
Equipment necessary to perform the following tests.
a. Soil Gradation: MnDOT Lab Manual 1302
b. Liquid Limit: MnDOT Lab Manual 1303
c. Plastic and Plasticity Index MnDOT Lab Manual 1304
d. Soil Organic Content: AASHTO T 267
e. Soil pH: AASHTO T 289
f. Moisture-Density Relations of Soil-Cement Mixtures: AASHTO T 134
g. Wetting and Drying Test of Compacted Soil-Cement Mixtures: AASHTO T 135,
Method A
h. Freezing and Thawing of Soil-Cement Mixtures: AASHTO T 136, Method A
i. Compressive Strength of Cylindrical Concrete Specimens: AASHTO T 22
3. Materials Obtain required cement. Obtain soil samples by taking soil borings from roadway.
4. Procedure a. Determine the soil gradation including hydrometer test results according to MnDOT
Lab Manual 1302.
b. Determine the Liquid Limit per MnDOT Lab Manual 1303.
c. Determine the Plastic Limit and Plasticity Index per MnDOT 1304.
d. Determine the AASHTO soil classification, and MnDOT soil classification per the
Triaxial Chart in the MnDOT Grading and Base Manual.
e. Determine the Soil Organic Content per AASHTO T 267.
f. Determine the pH of the soil per AASHTO T 289
g. Using the estimated cement content given in Table 19, determine the moisture-density
relationship of the soil-cement mixture, according to AASHTO T 134. Note that soils
containing high organic content may deter cement reaction and require higher cement
contents.

97
Table 19 Estimated Required Cement Content
AASHTO Classification Approximate Cement
Requirement by Mass %
Cement contents for wet-dry
and freeze-thaw tests
A-4, A-5, A-6 or A-7 6% 4, 6 & 8%
h. Using the cement content range shown in Table 19, determine the soil-cement loss %
according to AASHTO T 135, Method A and T 136, Method A. The maximum
allowable soil-cement loss percentages must be per Table 20.
Table 20 Maximum Loss per AASHTO T 135
Soil Group Classification
Maximum Allowable
Soil-Cement Loss (%)
AASHTO T 135, Method A &
AASHTO T 136, Method A
A-4 or A-5 10
A-6 or A-7 7
i. Prepare two specimens at each cement content, used in 4.h, according to AASHTO T
134. Compact the specimens to the maximum dry density determined in 4.g. Moist
cure the compacted specimens for 7 days and soak for 4 hours. Perform the
compressive strength according to AASHTO T 22. The 7-day compressive strength (with
no correction for the length-to-diameter ratio) must be from 200 – 350 psi.
5. Report
a. Route Number
b. Project Number
c. Section
d. County
e. Job Number
f. Gradation and Hydrometer Analysis (MnDOT Lab Manual 1302)
g. Liquid Limit (MnDOT Lab Manual 1303)
h. Plastic Limit and Plasticity Index ( MnDOT Lab Manual 1304)
i. AASHTO Group Classification (AASHTO M 145)
j. MnDOT Soil Classification (MnDOT Grading and Base Manual)
k. Organic Content of Soil (AASHTO T 267)
l. pH of Soil (AASHTO T 289)
m. Maximum Dry Density and Optimum Moisture Content (AASHTO T 134)
n. % Soil-Cement Loss % Wet-Dry (AASHTO T 135, Method A)
o. % Soil-Cement Loss % Freeze-Thaw (AASHTO T 136, Method A)
p. Compressive Strength (AASHTO T 22), psi
q. Recommended % Cement by Mass
r. Recommended % Cement by Volume
s. Recommended pounds of cement per yd2 per inch of compacted thickness

98
5-692.290 SFDR Mix Design Procedure
A. General
Emulsions are recommended for urban projects.
For low temperature crack resistance, stability and strength, it is recommended to add
crushed rock, in lieu of cement or other mineral stabilizers. Design using cement, if
stability and strength cannot be obtained with bituminous material and crushed rock.
The recommended PG grade of foam asphalt is 49-34.
The recommended emulsion is an engineered emulsion.
For reclaiming 1” into gravel, use as a first estimate for emulsion of starting amount of
emulsion of 3.5% and 2.4% for foaming. For a 30/70 blend of base to HMA use 4.1 for
emulsion and 2.8 for foaming.
Aim for a minimum of 25% crushing, 40% retained on the #4 sieve and a minimum of 42
for FAA.
B. Aggregate Base and RAP Evaluation - Foam and Emulsion
Wash the aggregate base and perform:
a washed gradation (MnDOT lab Manual 1201, 1202 and 1203),
sand equivalent (MnDOT Lab Manual 1215) and an
Fine aggregate angularity (MnDOT Lab Manual 1206).
Perform the same tests on the RAP samples after first performing an ignition test
(MnDOT Lab Manual 1853).
C.1 Proctor – Emulsion
Perform a modified proctor compaction according to ASTM D 1557, method C to determine
optimum moisture content (OMC) at peak dry density. OMC shall be defined by a best fit curve
from a minimum of four points. Material containing 20% or more passing the No. 200 sieve
shall be mixed with target moisture, sealed, and set aside a minimum of 12 hours. All other
material shall be set aside a minimum of 3 hours. If a material contains less than 4 percent
passing No. 200, then this testing is not required.
C.2 Selection of Water Content for Design - Emulsion
Water content of specimens, not including water in the emulsion, shall be:
• 60 – 75 percent of OMC if SE ≤ 30
• 45 – 65 percent of OMC if SE > 30
Sand equivalent value (SE) is from the combined materials. If a material contains less than 4
percent passing the No. 200 sieve, or if no peak develops with the OMC curve, then fix the
moisture content between 2 and 3 percent. Specimens shall be mixed with the required amount
of water before the addition of emulsion. Specimens shall be mixed with the appropriate amount
of water and allowed to sit sealed according to the same guidelines as used for Modified Proctor
specimens.

99
C.3 Number of Specimens / Mixing - Emulsion
Make samples so that the compacted height is 70 to 80 mm tall (except for IDT testing).
Choose four emulsion contents that will bracket the design emulsion content and make a
minimum of two specimens at each of four emulsion contents for short term strength testing.
Additional make two specimens for maximum specific gravity testing. Produce four specimens
of 120 to 140 mm at the design emulsion content for thermal cracking (IDT) testing.
Use a mechanical mixer with a bowl of 10 to 12 inches in diameter, which rotates on its axis at
50 to 75 revolutions per minute. The mixing paddle needs to make contact with the bottom side
of the bowl and rotate on its axis at twice the bowl rotation rate and in the opposite rotation
direction as the bowl.
Mix aggregate material and emulsion at a temperature of 20 to 260 C. Mix water for 60 seconds.
Mix emulsion for 60 seconds.
If other materials are added, such as lime or cement, introduce them in a similar manner as the
will be on the project. For example, if lime is incorporated a day or more before mixing with
emulsion, then add it to the wet aggregate a day or more before mixing with emulsion. If lime is
incorporated as a slurry, incorporate it as a slurry in the laboratory.
C.4 Curing before Compaction- Emulsion
Cure loose specimens individually in plastic containers of 4 to 7 inches height and 6 inches
diameter. Cure specimens at 1040 F for 30 (± 3) minutes. Perfrom no further mixing or aeration
during this time.
C.5 Compaction - Emulsion
Compact specimens in a Superpave gyratory compactor (SGC) at a vertical pressure of 600 kPa,
an angle of 1.25°, and a mold of 150 mm diameter for 30 gyrations.. After the last gyration,
apply 600 kPa pressure for 10 seconds. Do not heat the mold.
C.6 Short-Term Strength (STS) Test - Emulsion
Use a modified Hveem cohesiometer apparatus to test the early strength (1 hour). Conform to
ASTM D 1560 Section 10 with the following exceptions:
• The capacity for testing 150 mm specimens
• Cure before compaction per 5-692.290.E above, and cure each specimen for 60 ± 5 minutes
at 25°C and 10 to 70 percent humidity after compaction and before testing.
Ensure that the following calibrations have been made:
a. Position the balance so that the hinged plate just barely remains horizontal when the top
brackets and empty bucket are in place. This ensures that there is no force on the sample
until shot begins to flow into the bucket.
b. The gap between the bars of the switch that turns off the flow of shot should be ¾” when
there is 3000 g of shot in the bucket. Ensure that during this adjustment the locking bolt that
prevents the plate from moving is in place.
C.7 Cohesionometer Test Procedure - Emulsion
a. Tare the scale with the empty bucket weight.

100
b. Center the specimen on the unit
c. Place plates on top of sample and press down while adjusting the outer lower nuts up until
they just contact the bottom of the plate.
d. Use a torque wrench or torque-meter to tighten the nuts on the specimen to 20 inch-pounds
(maximum).
e. Gently support the bar so the unit does not move when the pic is pulled releasing the hinged
plate.
f. Pull pin and push open valve to start the flow of shot.
g. After the unit shuts off the flow of shot, immediately put the locking pin in place and then
record the weight of slot.
h. Loosen top nuts to remove plates and rotate specimen 90°.
i. Repeat procedure on the other axis of the specimen.
j. Calculate short-term strength as follows:
Shot weight / (15 * (0.031*height + 0.0027*height2))
k. Obtain two results for each specimen at each emulsion content.
C.8 Curing after Compaction - Emulsion
Cure specimens (except STS specimens) for 72 hours at 40° C. Rest the bottom of the
specimens on racks with slots or holes for air circulation. After curing, cool specimens for
moisture conditioning at ambient temperature or 25°C and test at the same time as moisture-
conditioned specimens. Cure specimens for maximum specific gravity at the same conditions as
the compacted specimens, except they can be tested after cooling to a maximum of 24 hours.
C.9 Marshall Stability - Emulsion
Perform cured marshall stability and Retained Marshall Stability tests for each foamed asphalt
content in accordance with criteria in Table 17. Plot the average cured and retained marshall
stability for each foamed asphalt content.
C.10 Volumetric Measurements - Emulsion
Test for bulk specific gravity per ASTM D 6752. Keep specimens in bags until testing or
vacuum saturation is performed. ASTM D 2726 (one minute soak) can be performed if
absorption is less than 2 percent.
Perform maximum specific gravity measurements per ASTM D 2041 with the supplemental dry-
back procedure. Determine maximum specific gravity at the other emulsion contents, corrected
for the residue of emulsion. Determine air voids at each emulsion content.
C.11 Mechanical Measurements - Emulsion
Perform resilient modulus testing in accordance with ASTM D 7369 on at least two specimens at
each emulsion content after conditioning for at least two hours at 25°C. Test at a frequency of 1
Hz and use a Poisson’s ratio of 0.30 to 0.40 for analysis. This can be performed before the ITS
test on the same (dry) specimens. Perform strength testing according to ASTM D 4867.
Condition specimens at 25°C for two hours before testing. Vacuum saturate half the specimens

101
at each emulsion content to a minimum 55 percent of the voids filled with water. Soak for 24
hours at 25°C before testing.
C.12 Thermal Cracking - Emulsion
Test at -10°C, -20°C and -30°C with the minimum emulsion content required to meet
requirements in Table 17.
Perform the indirect tensile testing (IDT) according to AASHTO T 322 with the following
exceptions:
a. Make specimens 150 mm in diameter and at least 115 mm in height and cure and compacted
as described in the testing procedures. After curing, cut two specimens from each compacted
specimen to 50 mm in height. Perform bulk specific gravity after curing.
b. Two to three specimens are required at each of three temperatures
c. Select two temperatures at 10°C intervals that bracket the required specification. For
example, if the required specification temperature is -25°C, then select testing temperatures
of -20°C and -30°C. Select a temperature of -10°C or -40°C to complete the third required
temperature.
d. Carry out the tensile strength test on each specimen directly after the tensile creep test at the
same temperature as the creep test.
e. Use an environmental chamber capable of temperatures down to -40°C.
f. The critical cracking temperature is defined as the intersection of the calculated pavement
thermal stress curve (derived from creep data) and the tensile strength line (the line
connecting the results of the average tensile strength at the two temperatures).
C.13 Emulsion Content Selection
Select an emulsion content meeting the following requirements (Table 17):
Table 17 Requirements for Emulsion SFDR Mix Design
Test Property Criteria
Superpave Gyratory Compaction, 1.25° angle, 600 kPa, gyrations 30
Short-term strength test, 1 hour – modified cohesiometer, ASTM D 1560-92
(Part 13), g/25mm of width (see “F. Short-Term Strength (STS) Test
175 min.
Cured Marshall Stability*, ASTM D 1559, Part 5, 40°C, min., lb.
Criteria 1,250 lb min. Report
Retained Marshall Stability* after soaking based on cured stability, min., % Report
Indirect Strength Test (ITS), ASTM D 4867, part 8.11.1, 25°C, psi 40 min
Conditioned ITS, ASTM D 4867 (See Note 1), psi 25 min.
Resilient Modulus, ASTM D 7369, 25°C, psi 150 min.
Thermal Cracking (IDT), AASHTO T 322
(Based on LTPPBind for Climate) Report

102
D.1 Mix Design Procedures for Stabilized Full Depth Reclamation (SFDR) with Foamed
Asphalt
All Mix designs will be performed at 30 gyrations.
The primary steps in the mix design process are:
Determine the optimum foaming characteristics of the asphalt binder.
Determine the optimum moisture content of the RAP for compaction.
Prepare, compact, and cure SFDR mixture over a range of foamed asphalt contents.
Determine the optimum foamed asphalt content for the SFDR mixture.
Prepare mix design report
D.2 Determine the optimum foaming characteristics
By foaming the asphalt binder, the viscosity of the asphalt is significantly reduced to permit
uniform mixing with cold RAP material. Foaming is controlled by the asphalt binder
temperature and the amount of water injected into the asphalt. These values generally range
from 300 to 320˚F (149 to 160˚C) and 1.0 to 3.5% injected water. Expansion ratio and half-life
of the foamed asphalt are measured to determine the optimal asphalt-water ratio and asphalt
temperature. These conflicting conditions are merged to select the best foam properties for the
project. An expansion ratio of 10 and half-life of 10 seconds are suitable for most SFDR
projects, in general.
D.3 Determine the optimum compaction moisture
SFDR mixture is compacted to a maximum density through the lubricating effect of the free
moisture in the mixture. The compaction moisture is not the same as the moisture injected into
the asphalt binder to create foam. To determine the optimum compaction moisture, a group of
RAP samples are compacted with different moisture contents. The resulting dry densities are
plotted to determine the optimum moisture required for compaction. The moisture required to
achieve maximum density is approximately 4%. Once the optimum moisture content is
determined, adjust the value down slightly to account for the foamed asphalt added to the
mixture.
D.4 Prepare mixture
Take a bulk sample of RAP from approximately forty 6” diameter cores. Process to achieve a
gradation that passes the 1 inch sieve. Dry the RAP in open pans at room temperature, sieved
into 3 size fractions, +3/8 inch, +1/8 inch and pan), and re-blended to achieve uniform samples.
Prepare a blending chart to determine what amounts of foamed asphalt to add to the RAP. Select
a minimum of three of the following foamed asphalt contents, 0.75%, 1.0% and 1.5% and 2%.
Produce a each batch to compact three 4 inch (100 mm) gyratory samples. Mix dry RAP and
compaction water to the mixing bowl and mix for 45 to 60 seconds. Spray the foamed asphalt
into the damp RAP while the mixer continues to mix the sample. Continue mixing for an
additional 60 seconds.

103
D.5 Compact and Cure Mixtures
Use a gyratory compactor to compact each sample to 30 gyrations. Extrude the specimen and
place it in the oven and cure at 105˚F (40˚C) for 72 hours. Remove the specimens from the
oven and allow them to cool to room temperature.
D.6 Test Mixtures
Measure the volume and mass of each specimen and determine the density. Sort the specimens
into equal sublots based on height and density for further testing. Dry condition the samples of
one sublot in an oven at 77˚F (25˚C) for 2 hours. Place the other sublot of specimens in a 77˚F
(25˚C) water bath for 20 minutes, and vacuum saturate (50 mm Hg) for 50 minutes, and then
allow to rest in the 77˚F (25˚C) bath for an additional 10 minutes. Perform the indirect tensile
test (IDT) and calculate the average IDT strength for each sublot. Plot the average IDT wet and
dry strength for each foamed asphalt content. In addition, perform cured marshall stability and
Retained marshall Stability tests for each foamed asphalt content in accordance with criteria in
Table 18. Plot the average cured and retained marshall stability for each foamed asphalt content.
Table 18 Thirty Gyration Marshall Design - SFDR
Property Criteria
Cured Marshall Stability*, ASTM D 1559, Part 5, 40°C, min., lb.
Criteria 1,250 lb min.
Report
Retained Marshall Stability* after soaking based on cured stability, min., % Report
*Cured stability determined on 60°C curing to constant weight (<72 hours). Retained stability
determined after 23-hour water soak at 25°C followed by 40°C soak for one hour.
E Mix design report
Report the following mix design values at a minimum:
Type (Foam or Emulsion), grade (i.e PG grade or engineered emulsion) and percentage of
asphalt recommended.
Depth of base to reclaim on initial pass
Depth of stabilizing reclaimation pass
Asphalt binder temperature for foaming (˚F or ˚C).
Percent injection water for foaming (% of asphalt by weight).
Optimum foam characteristics (Expansion Ratio and Half Life)
Optimum compaction moisture content (% of dry RAP by weight).
Optimum asphalt foam content (% of dry RAP by weight).
Average Wet and Dry IDT Strengths
% Voids
Maximum Density
Resilient Modulus, ASTM D 7369, 25°C, psi

104
Indirect Strength Test (ITS), ASTM D 4867, part 8.11.1, 25°C, psi
Conditioned ITS, ASTM D 4867 (See Note 1), psi
Short-term strength test, 1 hour – modified cohesiometer
Gradation
FAA
Sand Equivalent
Cured Marshall Stability*, ASTM D 1559, Part 5, 40°C, min., lb.
Retained Marshall Stability* after soaking based on cured stability, min., %
Density, ASTM D 2726 or equivalent
Retained stability based on cured stability
Indirect Tensile Test, AASHTO T 322, Modified
5-692.291 CIR Mix Design Procedure
A. General
Emulsions are recommended for urban projects.
For low temperature crack resistance, stability and strength, it is recommended to add
crushed rock, in lieu of cement or other mineral stabilizers. Design using cement, if
stability and strength cannot be obtained with bituminous material and crushed rock.
The recommended PG grade of foam asphalt is 49-34.
The recommended emulsion is an engineered emulsion.
Use as a first estimate for emulsion of starting amount of emulsion of 3.0% and 2.0% for
foaming.
Aim for a minimum of 25% crushing, 40% retained on the #4 sieve and a minimum of 42
for FAA.
B RAP Evaluation - Foam and Emulsion
Performing an ignition test (MnDOT Lab Manual 1853) then perform:
a washed gradation (MnDOT lab Manual 1201, 1202 and 1203),
sand equivalent (MnDOT Lab Manual 1215) and an
Fine aggregate angularity (MnDOT Lab Manual 1206).
C.1 Specific Gravity, Air Voids, Marshall and Moisture Susceptability
Perform the mix design on crushed millings. Use ASTM C117 and C136 (dried at no greater
than 40°C [104°F]) to determine the gradation of the crushed millings. Meet the requirements of
the Table 21.
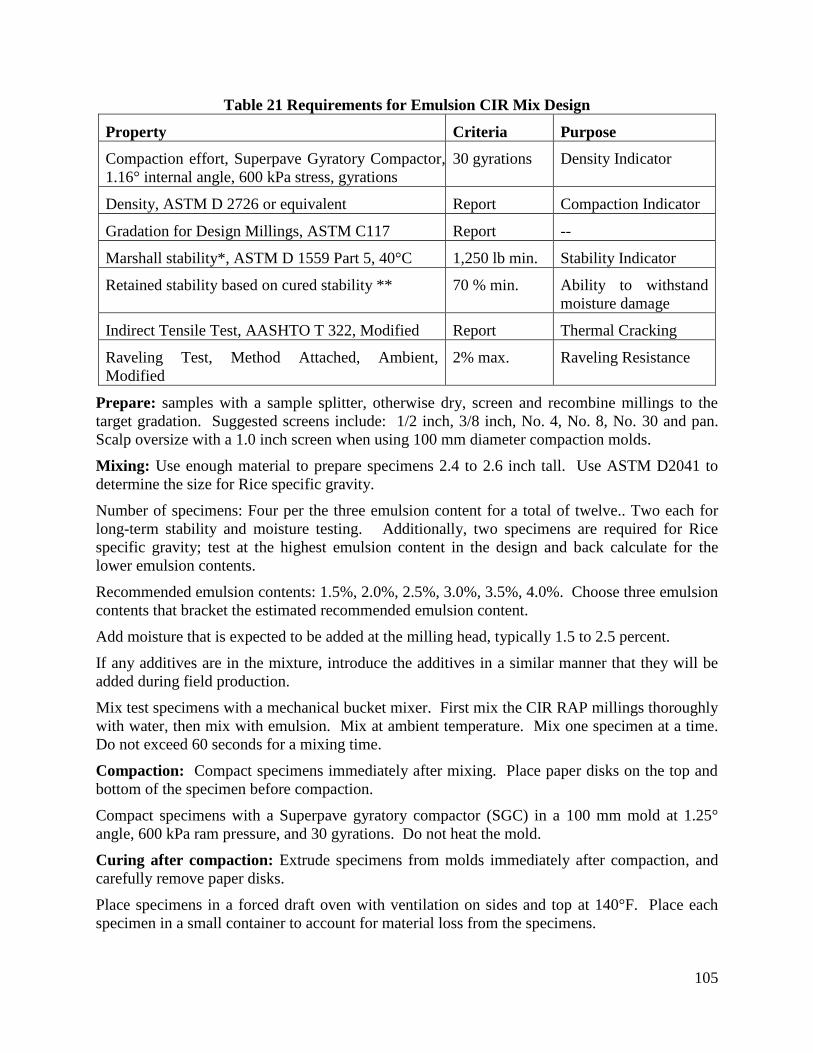
105
Table 21 Requirements for Emulsion CIR Mix Design
Property Criteria Purpose
Compaction effort, Superpave Gyratory Compactor,
1.16° internal angle, 600 kPa stress, gyrations
30 gyrations Density Indicator
Density, ASTM D 2726 or equivalent Report Compaction Indicator
Gradation for Design Millings, ASTM C117 Report --
Marshall stability*, ASTM D 1559 Part 5, 40°C 1,250 lb min. Stability Indicator
Retained stability based on cured stability ** 70 % min. Ability to withstand
moisture damage
Indirect Tensile Test, AASHTO T 322, Modified Report Thermal Cracking
Raveling Test, Method Attached, Ambient,
Modified
2% max. Raveling Resistance
Prepare: samples with a sample splitter, otherwise dry, screen and recombine millings to the
target gradation. Suggested screens include: 1/2 inch, 3/8 inch, No. 4, No. 8, No. 30 and pan.
Scalp oversize with a 1.0 inch screen when using 100 mm diameter compaction molds.
Mixing: Use enough material to prepare specimens 2.4 to 2.6 inch tall. Use ASTM D2041 to
determine the size for Rice specific gravity.
Number of specimens: Four per the three emulsion content for a total of twelve.. Two each for
long-term stability and moisture testing. Additionally, two specimens are required for Rice
specific gravity; test at the highest emulsion content in the design and back calculate for the
lower emulsion contents.
Recommended emulsion contents: 1.5%, 2.0%, 2.5%, 3.0%, 3.5%, 4.0%. Choose three emulsion
contents that bracket the estimated recommended emulsion content.
Add moisture that is expected to be added at the milling head, typically 1.5 to 2.5 percent.
If any additives are in the mixture, introduce the additives in a similar manner that they will be
added during field production.
Mix test specimens with a mechanical bucket mixer. First mix the CIR RAP millings thoroughly
with water, then mix with emulsion. Mix at ambient temperature. Mix one specimen at a time.
Do not exceed 60 seconds for a mixing time.
Compaction: Compact specimens immediately after mixing. Place paper disks on the top and
bottom of the specimen before compaction.
Compact specimens with a Superpave gyratory compactor (SGC) in a 100 mm mold at 1.25°
angle, 600 kPa ram pressure, and 30 gyrations. Do not heat the mold.
Curing after compaction: Extrude specimens from molds immediately after compaction, and
carefully remove paper disks.
Place specimens in a forced draft oven with ventilation on sides and top at 140°F. Place each
specimen in a small container to account for material loss from the specimens.

106
Dry specimens for Rice specific gravity to constant weight (less than 0.05% weight loss in 2
hours). Take care not to over-dry the specimens.
Cure compacted specimens to a constant weight but no more than 48 hours and no less than 16
hours. Constant weight is defined as less than 0.05% change in weight in 2 hours. After curing,
cool specimens at ambient temperature a minimum of 12 hours and a maximum of 24 hours.
Measurements: Determine bulk specific gravity (density) of each compacted (cured and cooled)
specimen according to ASTM D2726; however, record the mass of the specimen in water
(measurement C) after one minute submersion.
Determine specimen heights according to ASTM D3549, or from the SGC readout.
Determine Rice (maximum theoretical) specific gravity, ASTM D2041, except as noted in this
procedure, and do not break any agglomerates which will not easily reduce with a flexible
spatula. It is normally necessary to perform the supplemental dry-back procedure to adjust for
uncoated particles.
Determine air voids at each emulsion content.
Determine corrected Marshall stability by ASTM D1559 at 40°C [104°F] after 2 hour
temperature conditioning in a forced draft oven. Perform this testing at the same time as the
moisture conditioned specimens are tested.
Moisture Susceptibility: Perform the same conditioning and volumetric measurements on
moisture-conditioned specimens as on other specimens. Vacuum saturate to 55 to 75 percent,
soak in a 77°F [25°C] water bath for 23 hours, followed by a one hour soak at 104°F [40°C].
Determine corrected marshall stability. The average moisture conditioned specimen strength
divided by the average dry specimen strength is referred to as retained stability.
C.2 Thermal Cracking - Emulsion
Emulsion Content Selection: Select the minimum emulsion content that satisfies the
requirements of Table 21.
Report: Report the following information: Gradation of RAP; amount and gradation of virgin
aggregate or additional RAP, if any; recommended water content range as a percentage of dry
RAP; optimum emulsion content as a percentage of dry RAP and corresponding density, air void
level, and absorbed water; marshall stability and retained stability at recommended moisture and
emulsion contents, raveling %, and thermal cracking initiation temperature. Include the
emulsion designation, company name, plant location, and residue content.
NOTE: Procedure for critical cold temperature selection
Choose specification temperature using FHWA LTPPBind software (Version 2.1) and the
weather station closest to the project. The required temperature for the specification is the
coldest temperature at the top of the CIR layer in the pavement structure. Use 98 percent
reliability.
C.3 Indirect tensile testing (IDT) Procedure - Emulsion:
Perform testing in accordance to AASHTO T 322 with the following exceptions:
a. Make specimens using the medium gradation 150 mm [6 inches] in diameter and at least 115
mm [4.5 inches] in height and compacted to air voids +/- 1 percent of design air voids at the
design emulsion content. A trial specimen is suggested for this. Cure test specimens at 60ºC

107
for no less than 48 hours and no more than 72 hours. Check specimen mass every 2 hours
after 48-hour cure to check with compliance of no more than 0.05% change in mass in 2
hours. After curing, cut two specimens from each compacted specimen to 50 mm [2 inches]
in height. Perform bulk specific gravity after cutting.
b. Two specimens are the minimum required at each of three temperatures.
c. Select two temperatures at 10ºC intervals that bracket the required specification. For
example, if the required specification temperature is –25ºC, then select testing temperatures
of –20ºC and –30ºC. A temperature of –10ºC or –40ºC should then be selected as the third
required temperature.
d. Perform the tensile strength test on each specimen directly after and at the same temperature
as the tensile creep test.
e. Use an environmental chamber capable of temperatures down to –40°C.
f. The critical cracking temperature is defined as the intersection of the calculated pavement
thermal stress curve (derived from the creep data) and the tensile strength line (the line
connecting the results of the average tensile strength at the two temperatures).
C.4 Raveling Test Procedure on Recycled Asphalt Specimens - Emulsion
For the raveling test use a modified A-120 Hobart mixer with an abrasion head (including hose)
as used in the Wet Track Abrasion of Slurry Surfaces Test (ISSA TB-100). The rotation speed
for the raveling test is not modified from ISSA TB-100. Remove the ring weight from the
abrasion head. The weight of the abrasion head and hose in contact with the specimen should be
600 +/- 15g. Secure the prepared sample under the abrasion head, and centre for accurate result,
allowing for free movement vertically of the abrasion head. The device used for securing and
centering the sample must allow a minimum of 10 mm of the sample to be available for abrasion.
Modify the Hobart mixer to allow the sample to fit properly for abrasion. The modification may
be accomplished by adjusting the abrasion head height, or the height of the secured sample. A
Raveling Test Adapter can be purchased through Precision Machine and Welding, Salina, KS, 1-
877-876-9537. Reference the Hobart Model number A-120 when ordering. The C-100 and N-
50 Models are not acceptable for this test procedure due to differences in size and speed of
rotation.
a. Split out two recycled asphalt samples from the medium gradation, or field sample, to a
quantity of 2700 g. The 2700 g is an approximate weight to give 70 +/- 5 mm of height after
compaction.
b. Place the recycled asphalt sample in an container for mixing.
c. Add field or design moisture contents to each of the samples and mix for 60 seconds.
d. Add the design emulsion content to each of the samples and mix for 60 seconds.
e. Immediately place the samples into a 150 mm gyratory compaction mold and compact to 30
gyrations. If the sample height is not 70 +/- 5 mm, adjust the recycled asphalt weight.
f. After compaction, remove the samples from the compaction mold and place on a flat pan to
cure at ambient lab temperature 65 – 75ºF for 4 hours +/- 5 minutes.
g. Weigh the specimen after curing, and just prior to testing.

108
h. Place the specimens on the raveling test apparatus. Take care that the specimen is centered
and well supported. The area of the hose in contact with the specimen should not have been
previously used. It is allowable to rotate the hose to an unworn section for testing. The
abrasion head (with hose) shall be free to move vertically downward a minimum of 5 mm, if
abrasion allows.
i. Abrade the samples for 15 minutes and immediately weigh them.
j. Determine the % raveling loss as follows: ((Wt. Prior to test – Wt. After abrasion)/Wt. Prior
to test) * 100.
k. Report the average of the two specimens as the % Raveling loss. There should not be a
difference of 0.5% raveling loss between the two test specimens for proper precision. A
difference of >0.5% will require the test to be repeated. If both of the samples have a
Raveling Loss of >10% the numbers shall be averaged and the precision rule will be waived.
Note: Omit Steps b, c and d, if field mix samples are taken.
D.1 Cold In-Place Recycling (CIR) Mix Design Procedures for Foamed Asphalt - General
Perform all mix designs at 30 gyrations.
The primary steps in the mix design process are:
Determine the optimum foaming characteristics of the asphalt binder.
Determine the optimum moisture content of the RAP for compaction.
Prepare, compact, and cure CIR mixture over a range of foamed asphalt contents.
Determine the optimum foamed asphalt content for the CIR mixture.
Prepare mix design report
D.2 Determine the optimum foaming characteristics
Foaming the asphalt binder reduces the viscosity of the asphalt and produces uniform mixing of
cold RAP material. Foaming is controlled by the asphalt temperature and the amount of water
injected into the asphalt. These values generally range from 300 to 320˚F and 1.0 to 3.5%
injected water. Expansion ratio and half-life of the foamed asphalt are measured to determine
the optimal asphalt-water ratio and asphalt temperature. An expansion ratio of 10 and half-life of
10 seconds are suitable for most CIR projects, in general.
D.3 Determine the optimum compaction moisture
CIR mixture is compacted to a maximum density through the lubricating effect of the free
moisture in the mixture. The compaction moisture is not the same as the moisture injected into
the asphalt binder to create foam. Compact RAP samples with different moisture contents to
determine the optimum compaction moisture. Plot the resulting dry densities to determine the
optimum moisture required for compaction. The moisture required to achieve maximum RAP
density is approximately 4 percent. Once the optimum moisture content is determined, the value
is adjusted down slightly to account for the foamed asphalt added to the mixture.
D.4 Prepare mixture
Obtain the bulk sample of RAP from approximately forty 6” dia cores. The sample may require
additional processing to achieve a gradation that passes the 1 inch sieve. The RAP is dried in

109
open pans at room temperature, sieved into 3 size fractions (+3/8 inch, +1/8 inch and pan), and
re-blended to achieve uniform samples. Prepare a blending chart to determine what amounts of
foamed asphalt to add to the RAP. Select a minimum of three foamed asphalt contents. Chose
from 0.75%, 1.0% and 1.5% and 2%. Each batch should have sufficient mixture to compact
three 100 mm gyratory samples. Add the dry RAP sample and compaction water to the mixing
bowl and mix for 45 to 60 seconds. Spray the foamed asphalt into the damp RAP while the
mixer continues to mix the sample. Continue mixing for an additional 60 seconds.
D.5 Compact and Cure Mixtures
Compact using a gyratory compactor for 30 gyrations. Extrude the specimen and place it in the
oven to cure at 40˚C for 72 hours. Remove the specimens from the oven and allow them to cool
to room temperature.
D.6 Test Mixtures
Measure the volume and mass of each specimen and determine the density. Sort the specimens
into equal sublots based on height and density for further testing. Dry condition the samples of
one sublot in an oven at 25˚C for 2 hours. Place the other sublot of specimens in a 25˚C water
bath for 20 minutes, vacuum saturated (50 mm Hg) for 50 minutes, and then allowed to rest in
the 25˚C bath for an additional 10 minutes. Perform the indirect tensile test (IDT) and calculate
the average IDT strength for each sublot. Plot the average IDT wet and dry strength for each
foamed asphalt content. In addition, perform cured marshall stability and retained marshall
stability tests for each foamed asphalt content in accordance with criteria in Table 22 of the CIR
with foamed asphalt specification. Plot the average cured and retained marshall stability for each
foamed asphalt content.
Table 22 Thirty Gyration Marshall Design - CIR
Property Criteria
Cured Marshall Stability*, ASTM D 1559, Part 5, 40°C, min., lb.
Criteria 1,250 lb min.
Report
Retained Marshall Stability* after soaking based on cured stability, min., % Report
*Cured stability determined on 60°C curing to constant weight (<72 hours). Retained stability
determined after 23-hour water soak at 25°C followed by 40°C soak for one hour.
E. Mix design report
Report the following mix design values at a minimum:
Type (Foam or Emulsion), grade (i.e PG grade or engineered emulsion) and percentage of
asphalt recommended.
Asphalt binder temperature for foaming (˚F or ˚C).
Percent injection water for foaming (% of asphalt by weight).
Optimum foam characteristics (Expansion Ratio and Half Life)
Optimum compaction moisture content (% of dry RAP by weight).
Optimum asphalt foam content (% of dry RAP by weight).

110
Average Wet and Dry IDT Strengths
% Voids
Maximum Density
Gradation
FAA
Sand Equivalent
Cured Marshall Stability*, ASTM D 1559, Part 5, 40°C, min., lb.
Retained Marshall Stability* after soaking based on cured stability, min., %
Density, ASTM D 2726 or equivalent
Gradation for Design Millings, ASTM C117
Retained stability based on cured stability
Indirect Tensile Test, AASHTO T 322, Modified
Raveling Test, Method Attached, Ambient, Modified
5-692.293 Gradation Test Procedure for Cold In Place Recycling and Stabilized Full
Depth Reclamation
For Cold In Place Operation where not Material can be obtained prior to bituminous injection.
A) For Testing a Simple Gradation when using equipment where a sample may be obtained
prior to bituminous injection (weight controlled machine).
1. Obtain a 2,000 – 4,000 gram sample after milling but prior to injection.
2. Follow the gradation procedure in the Grading and Base Manual .215
3. Use a 1 ½” sieve with a 1 ¼” sieve below it.
4. Weigh and report the percentage retained on the 1 ½” and 1 ¼” sieves.
B) For Testing a Simple Gradation when using equipment where a sample cannot be obtained
prior to bituminous injection (volume controlled machine).
1. Obtain a 2,000 – 4,000 gram sample immediately after injection, in windrow if possible.
2. Weigh the sample in grams.
3. Use a 1 ½” sieve with a 1 ¼” sieve for CIR and a 2” and 1 ½” sieves for SFDR.
4. Wash the sample through the sieves for two minutes
5. Weigh the amount of material retained on the 1 ½” and 1 ¼” sieves for CIR and the 2” and 1
½” sieves for SFDR.
6. Report the percentage retained on the 1 ½” and 1 ¼” sieves for CIR and the 2” and 1 ½”
sieves for SFDR.
7. Dispose of the wash water in compliance with State of Minnesota Rules and Regulations.

111
C) For Testing the Entire Gradation when using equipment where a sample may be obtained
prior to bituminous injection (weight controlled machine).
1. Obtain a 2,000 – 4,000 gram sample after milling but prior to injection.
2. Follow the gradation procedure in the Grading and Base Manual .215
3. Use the following sieves 2”, 1½”, 1 ¼”, ¾”, 3/8”, #4, #10 & #30
4. Weigh and report the percentage retained on sieves 2”, 1½”, 1¼”, ¾”, 3/8”, #4, #10 & #30.
D) For Testing the Entire Gradation when using equipment where a sample may not be
obtained prior to bituminous injection (volume controlled machine).
1. Obtain a 2,000 – 4,000 gram sample after milling and do not inject bitumen.
2. Follow the gradation procedure in the Grading and Base Manual .215
3. Use the following sieves 2”, 1-½”, 1- ¼”, ¾”, 3/8”, #4, #10 & #30
4. Weigh and report the percentage retained on sieves 2”, 1½”, 1¼”, ¾”, 3/8”, #4, #10 & #30.
5-692.300 Reports
5-692.301 Grading and Base Reports
A. The Preliminary and Final Grading and Base Report (Form G&B-001, Figure 30) is used by
the Project Engineer and Contractor to report information needed by the Grading and Base
Construction Engineer.

112
Figure 30 Grading and Base Report Example (Form G&B-001)
Fill out the preliminary Grading and Base Report within two weeks of project start-up. Send a
copy of this report to the Grading and Base Unit.
Fill out the final Grading and Base Report after all grading and base materials have been placed.
Send a copy of this report to the Grading and Base Unit.
B. Use the following guidelines when preparing the report.
1. Use the lowest S.P. Number.
2. Fill out form completely. In the first column insert the item name.
3. Insert the minimum testing rate for the class of material. This information is contained in the
Schedule of Materials Control (SMC). .

113
4. Under each of the test designations there are two columns headed "Required" and
"Completed".
a. "Required." In this column, enter the number of tests required for the quantity of material
listed.
For projects with pay items for aggregate in cubic meters or cubic yards, the conversions
from metric tons and English tons are as follows:
1 metric ton = 0.6 cubic meter (1 ton = 0.7 cubic yard) (LV)
1 metric ton = 0.46 cubic meter (1 ton = 0.55 cubic yard) (CV)
b. In the column headed "Completed," enter the number of tests completed.
5. Remarks: Use the "Remarks" area to communicate any deviations from the requied tests.
5-692.315 Materials Certification
A. The Materials Certification Exception Summary (TP 02171, Figure 31) is used to certify that
all grading and base materials incorporated into the project have been inspected, tested and
accepted. This document assures conformance with the approved plans, specifications,
special provisions and the Schedule of Materials Control. All nonconforming items
(exceptions) must have a documented resolution. Missing tests and reports, uncorrected
failing tests, lab/field tolerance failures and tests performed by non-certified personnel are
considered exceptions.
This form (Figure 31) is required for Final Certification and must be completed before the
Final Estimate is completed and printed.
** The most current version of this form is available from the Office of Construction
website.

114
Figure 31 Materials Certification Exception Example
B. Use the following guidelines, when preparing the Materials Certification form.
1. Place an “X” by Grading and Base.
2. Use the lowest SP number, Contract No. and Project Description.
3. Fill in the Trunk Highway or CSAH number.
4. Enter the MnDOT District or the County’s or City’s name.
5. Enter the location of the project.

115
6. Enter the Contractor and Project Engineer/Supervisor’s name.
7. Review all Grading and Base items for:
a. Quantities used
b. Change Orders and Supplemental Agreements
c. The number of tests required and performed
d. Resolution of failing test results
e. Resolution of out-of-tolerance field/laboratory companion tests
8. Enter all exceptions. See section, “5-692.316, Requirements for Certification”.
9. Enter the Federal No.
10. District/Metro Materials Engineer must sign form.
11. Resident or Project Engineer must sign form.
5-692.316 Project Compliance Review
Approximately 15-30 projects may be reviewed every year. The projects are picked at random,
although there is an effort to get at least one project audited from each resident office in every
district.
If a project is chosen to be audited, the resident engineer will receive a request for all project
materials inspection and testing records to be sent to the Audit Manager at the Maplewood
Laboratory. The records will be due in Maplewood within two weeks of the request. The
project files will be reviewed by the appropriate Specialist Units (Grading and Base, Bituminous
or Concrete). After the audit has been completed, the resident engineer is encouraged to respond
to the audit at that time with any questions or give further statements to correct any discrepancies
or misunderstandings about the final audit results.
A. Possible tests/samples required for any project as per current Schedule of Materials Control.
(Field and/or Laboratory)
1. Compaction compliance
a. Proctor test
b. Moisture test
c. Sand cone test
d. Nuclear density test
e. Quality compaction
f. Test rolling TR 10 or TR 30
g. DCP test
h. LWD test
2. Gradation tests
3. Crushing tests
4. Quality tests

116
5. Bituminous extraction for aggregate with salvaged bituminous
B. Laboratory and field tests
1. Copies of all laboratory test results/reports on file. (Reports must contain field
companion results.)
2. Copies of all field test results on file.
C. Independent Assurance requirements of file
1. Certification of project personnel
2. Required I.A. inspections - (gradations and/or densities)
D. Other required forms on file
1. Current certification form
2. Grading and Base Reports, form G&B-001.
3. Aggregate Certification, form G&B-104
4. Glass certification letters
5-692.400 Field Inspection of Materials
5-692.401 Culvert Inspection and Installation
The final inspection and acceptance of culvert pipe is made on the projects. A preliminary
inspection is also made at the producing plant by a representative of the Office of Materials. The
culvert should be rejected if the field inspection reveals it to be defective.
A. Concrete Pipe
The plant inspection of concrete pipe includes the sampling and testing of the materials used in
the manufacture of the pipe and a 3 edge bearing test. In lieu of the bearing test, cores are
sometimes drilled from the pipe and tested in the laboratory.
The finished product is also inspected at the plant. Because the pipe are stockpiled at the plant, it
is not always possible to make a close inspection of each length of pipe. For this reason and
because of the possibility of damage in shipping or handling, the pipe should be visually
inspected on the project before it is installed. Visual inspection should include the following
items:
1. Fractures and cracks that extended all the way through the wall of the pipe: Fractures in the
tongue or groove ends are not cause for rejection, provided that they can be satisfactorily
repaired.
2. Honeycombing: Excessive honeycomb can reduce the strength of the pipe.
3. Steel obviously misplaced: This would include exposed steel and wire projecting from the
end of the barrel. (The exposure of the ends of stirrups or spacers that have been used to
position the reinforcing steel during placement of the concrete shall not be considered cause
for rejection.)
4. It is not necessary to measure every pipe. Each lot delivered should be spot checked for
compliance.

117
5. Check each pipe for the class, date and trademark.
B. Metal Pipes
The plant inspection of metal pipes includes the periodic sampling and testing of the materials
used in the manufacture of the pipes.
Pipes are visually inspected at the plant but should be inspected again in the field before being
installed. Pipes should be inspected for the following defects:
1. Major Defects
a. Uneven laps
b. Variation from straight center line
c. Variation from design shape
d. Lack of rigidity
e. Illegible brand
f. Bruised, scaled or broken spelter coating
g. Dents or bends that will affect the use or function of the pipe
2. Minor Defects
a. Ragged or diagonal edges
b. Loose or unevenly spaced rivets
c. Poorly formed rivet heads
d. Unfinished ends
e. Dents or bends in the material that will not affect the use or function of the pipe
In general, a pipe is not rejected unless there is a major defect or five or more minor defects.
C. Culvert Installation
The foundation for the pipe should be constructed in such a manner that it will provide uniform
bearing for the full length of the pipe. It is the inspector’s responsibility of the inspector to verify
that treatments are properly staked and that tapers are properly constructed to the plan
dimensions.
Note: Any changes (even seemingly minor alterations) to the design dimensions should be made
only after consulting the Project Engineer and the District Soils Engineer.
Compaction of the bedding, backfill and embankment adjacent to the pipe shall be in accordance
with the plan sheets, 2105. or 2106.
The inspector should familiarize himself with the requirements of 2501 of the specifications for
the installation of pipe culverts and closely inspect the work to determine compliance with the
specifications.
Note: It is not necessary to make a gradation test of bedding or granular material for each
installation. Tests should be made at the prescribed rate for each class of material. Moisture and
density tests do not have to be made for each layer placed. Take only as many tests as are

118
necessary and practical to document the work. Backfill (B) shall be placed in approximately
equal layers simultaneously on both sides of the pipe (Figure 33).
When the flow line of the pipe is at natural ground line, and the pipe is installed ahead of
embankment construction, tapers of the granular backfill may be reversed.
5-692.430 Grading and Base Conversion Factors (English)
A. Scope
The purpose of this section is to acquaint the inspector with the basic materials measurement
conversions used in grading and base construction work. This section will also provide the
method for calculating these conversions. A table of conversions is shown at the end of this
section.
Note: for metric version of this section, see “MnDOT Grading and Base Manual, ver. 2002”.
B. Conversion Calculation
Conversions have been established for both the Grading and Base items. The Grading
conversions are measurement of materials in cubic yards at the borrow source (Bank Measure),
in the hauling unit (Loose Volume) and the material placed in the embankment (Compacted or
Placed Volume). The base conversions are generally tons, cubic yards (yd3) (Loose Volume -
LV) and cubic yards placed (Compacted Volume - CV).
The standard gravel base conversions are calculated on the proctor density of 135 pounds per
cubic foot. This proctor was chosen as it best represents the statewide average. Variations for
lighter or heavier materials can be calculated on the basis of their proctors. However, this is only
done when there will be significant quantities involved. The Grading and Base Office should be
contacted when the non-standard conversion is going to be used.
Note: When making any conversions for the purposes of measuring pay quantities, a Change
Order must be prepared.
C. Gravel Base Conversion Calculations
1. Tons to Cubic Yards Loose Volume. (This conversion uses the standard weight of sand
Loose Volume which is 105 pounds per cubic foot).
Formula
1 yd3(LV) = 105 lbs/ft
3 x 27 ft
3/yd
3 x tons/2,000 lbs = (105 x 27)/2,000 = 2,835/2,000 = 1.4 tons
Therefore: 1 yd3 (LV) = 1.4 tons
2. Tons to Cubic Yards Compacted Volume. (This conversion uses the average proctor for base
material of 135 pounds per cubic foot.)
Formula:
1 yds3 (CV) = 135/ft
3 x 27 ft
3/yd
3 x 1 ton/2,000 lbs = (135 x 27 x 1)/2,000 =
3,645/2,000 = 1.8 tons
Therefore: 1 yd3 (CV) = 1.8 tons
3. Cubic Yards Compacted Volume to Cubic Yards Loose Volume. (Using the two relations
developed in 1 and 2 of this section.

119
1 yd3 (LV) = 1.4 tons
1 yd3 (CV) = 1.8 tons
1 yd3 (CV)/1 yd
3 (LV) = 1.8 tons/1.4 tons = 1.285 = 1.3
Therefore: 1 yd3 (CV) = 1.3 yd
3 (LV)
D. Grading Conversion Calculations
1. Cubic Yards Loose Volume to Cubic Yards Compacted Volume.
In grading we have retained the same relationship between Loose Volume (LV) and
Compacted Volume (CV) as calculated for base materials.
Therefore: 1 yd3 (CV) = 1.3 yd
3 (LV).
2. Cubic Yards Bank Measure to Cubic Yards Compacted Volume.
The Bank Measure refers to material in the borrow pit in its natural state of compaction. For
general application we have assigned material in the natural compaction state a relative
density of 90% of proctor density.
Formula
1 Cubic Yards (Bank Measure) = 90% x 1 Cubic Yard (CV)
1 yd3 (BM)/0.90 = 1 yd
3 (CV)
1 yd3 (BM)/0.90 = 1/0.9 = 1.1 yd
3 (BM) = 1 yd
3 (CV)
Therefore: 1 yd3 (CV) = 1.1 yd
3 (Bank Measure)
3. Cubic Yards Bank Measure to Cubic Yards Loose Volume.
Relationships established in “1 and 2” of this section are used to make this conversion.
(1) 1 yd3 (CV) = 1.3 yd
3 (LV)
(2) 1 yd3 (CV) = 1.1 yd
3 (BM)
Therefore: 1.1 yd3 (BM) = 1.3 yd
3 (LV)
Therefore: 1 Cubic Yard (BM) = 1.2 Cubic Yards (LV)
Note: The grading conversions from Bank Measure to Compacted Volume and Loose Volume
are based on the 90% relative density assumption for material in natural state of compaction.
Calculations involving materials at a significant depth in the borrow area i.e. material with a
thick layer of material in-place above it, should be made based on field test results. The Grading
and Base Unit should be contacted for assistance in making these determinations.
Conversion Tables:
A. Base Materials: 1 ton = 0.714 yd3 (LV)
1 ton = 0.55 yd3 (CV)
1 yd3 (LV) = 1.4 ton
1 yd3 (LV) = 0.77 yd
3 (CV)
1 yd3 (CV) = 1.8 ton

120
1 yd3 (CV) = 1.3 yd
3 (LV)
B. Grading: 1 yd3 (CV) = 1.3 yd
3 (LV)
1 yd3 (CV) = 1.1 yd
3 (BM)
1 yd3 (LV) = 0.83 yd
3 (BM)
1 yd3 (LV) = 0.77 yd
3 (CV)
1 yd3 (BM) = 0.90 yd
3 (CV)
1 yd3 (BM) = 1.2 yd
3 (LV)
C. Rip Rap and other predominately one sized products: 1.35 Tons per Cubic Yard (CV)
5-692.500 Treatment & Stabilization of Soils/Bases
5-692.515 Use of Calcium Chloride For Dust Control
Calcium chloride (3911) is frequently used for dust control. It is used on roads under
construction, on haul roads used during construction or on unsurfaced roads where heavy dust is
a nuisance or a pollution problem. It “lays dust”.
The calcium chloride is a deliquescent material, holding moisture from evaporation and so
changing the roads’ surface from wind-blown swirling materials to moistened and stable riding
surface.
Calcium Chloride (CaC12) can be applied either in a solid or liquid form. The liquid calcium
chloride shall contain a minimum of 38 percent, by mass (weight), anhydrous CaC12.
Andydrous CaC12 is produced by mixing water and a given amount of solid CaC12.
The solid CaC12 comes in two types:
Type I - Flake = 77% CaC12
Type II - Pellet = 94% CaC12
Table 23 provides approximate application rates for both solid types and liquid type of CaCl2.
Table 23 Application Rates for Dust Control
Type I
lbs/yd2 (kg/m
2)
Type II
lbs/yd2 (kg/m
2)
(*) 38% Solution
gal/yd2 (l/m
2)
Initial Use 1.0 (0.5) 0.8 (0.4) 0.2 (1.0)
Additional Use 0.5 (0.25) 0.4 (0.2) 0.1 (0.5)
(*) add 5.6 lbs/gallon (0.6 kg/liter) of Type I for a 38% solution.
add 4.7 lbs/gallon (0.5 kg/liter) of Type II for a 38% solution.
Note: a 38% solution gallon (liter) will weigh approximately 11.6 lbs. (1.3 kg)
5-692.521 Use of Lime to Dry Soil
Under certain conditions, drying of fine grained soils by treating them with lime is more
economical than by scarifying and aerating by mechanical methods. Lime reacts with clay
particles in the soil to produce decreased plasticity, improved work ability, and increased

121
strength and stability. This process works best when the soils are reactive. Soils with a
minimum clay content (.002 mm) of approximately ten percent and a plasticity Index greater
than ten respond most favorable. Soils with over two percent organic matter will probably show
very little increase in strength.
There are two lime products which may be used:
1. Quicklime is calcined calcium carbonate or calcium oxide (CaO). It is highly reactive,
especially when mixed with water.
2. Hydrated lime is quick lime that has had part of its water demand satisfied by adding water in
the slaking process until it is essentially calcium hydroxide (Ca(OH)2).
Of the two, hydrated lime is the most desirable. The amount of lime required depends on the soil
type and moisture content. In most cases, less than 1% hydrated lime is sufficient if it is properly
spread and mixed with the soil. In no case should more than 2% lime be used. As a rule of
thumb, for most soils and for a 6 inch (150 mm) layer, one percent lime corresponds to about 5
lbs/yd2 (2.7 kg/m
2). Quicklime may be substituted for hydrated lime on the basis of 0.77%
quicklime being equal to 1.0% hydrated lime. However, because of the hazards involved, more
stringent safety precautions will be necessary if the use of quicklime is approved.
Recommendations of the Industry on safety rules and first aid procedures should be followed.
This includes the use of special clothing, protective cream, and eyes, mouth and nose protection.
Hot, humid weather tends to increase the effect of lime on the worker's skin.
The contractor may request using lime at their expense. Lime is not permitted without the
approval of the project engineer. A change order stating the application rate and other conditions
should be prepared.
There may be times when the Department wishes to use hydrated lime. The District Soils or
Materials Engineer should be consulted in making decisions on the use of lime. Lime should be
used only after it is demonstrated that the soil cannot be dried by conventional methods due to
excessive moisture and poor drying weather. A supplemental agreement will have to be
prepared, with the concurrence of the Assistant District Engineer, to pay for the lime and work
involved in accordance with the provisions of the specification pertaining to extra work. In
negotiating the supplemental agreement, it should be realized that the cost of placing and
compacting the soil is already included in the bid price for excavation. The cost of the lime,
spreading and mixing are extra. However, the use of lime should reduce the work normally
required to dry the soil.
The construction involves scarification, lime spreading, mixing and compaction. Scarifying
before spreading the lime helps to prevent loss due to wind and rain, particularly if mixing is not
started immediately. Application of lime should be full width across the grade. Lime should not
be spread under windy conditions because of excessive dusting. To prevent wind loss, the lime
shall be mixed into the soil immediately after spreading. Self unloading bulk tanker trucks are
most efficient for transporting and spreading lime, since re-handling is not necessary. Tailgate
spreading should not be allowed. Thorough mixing is essential to distribute the lime uniformly
throughout the soil to proper depth and width Disc harrows may be adequate for mixing,
although rotary mixers are preferred for heavier soils. After satisfactory moisture and soil
conditions are attained, the material can be compacted as specified. Sheepsfoot rollers should be
used for initial compaction. Final rolling with a pneumatic roller will help to seal the subgrade
and cause it to shed rain water, thereby eliminating construction delays.

122
When lime is used as a drying aid, it will be necessary to establish a new moisture density
relationship for the soil plus the lime. The optimum moisture should be slightly higher and the
maximum density should be slightly lower than for the soil without lime.
5-692.600 Soil Classification Introduction
In present day soil engineering practice as applied to various fields of engineering such as
highways, airports, dams, foundations, and the like, there are several different methods of soil
classification in use. Most of them attempt to classify soils into groups on the basis of their
engineering properties; that is, the manner in which they will perform as part of an engineering
structure under a given set of conditions. The purpose of this is largely to aid the design engineer
in deciding how the soil is apt to behave when it is put into one of these structures or a structure
is placed on top of it. The procedures in classifying soils involves a number of tests which are
mostly made in the Laboratory.
In highway construction, soil is used both in the road structure ( i.e. embankments, cut slopes,
roadbed in both cuts and fills) and as a foundation to support the embankments, culverts, and
bridges. Soil is, therefore, a basic element of the highway, and as such it is necessary that the
persons who work with it and use it be able to identify the soil types.
In this section we will deal with the two classification systems used by Mn/DOT. The textural
classification which is mainly used as a working tool for field soil selection and the AASHTO
classification which is used exclusively for engineering design.
Since we use both systems, a section showing the interrelation of the two systems is also
provided.
5-692.601 Soil Identification
The first objective should be to identify and describe soils in such a way that others will
understand exactly what is meant; that is, if a silt loam is mentioned, that name should convey
essentially the same meaning to each person. Other terms may elaborate on it and describe it
more fully. The complete description would then convey a very definite picture of that particular
soil.
The following sections are devoted to classifying and describing soil materials in detail. An
understanding of the classification procedures will aid the engineer and inspector in the field in
identifying soils, in evaluating the engineering properties, in applying better soil selection and in
performing the field test more accurately.
5-692.602 Pedological Classification
The more common characteristics of soils by which they may be described include the following:
Texture Consistency
Color Compactness
Structure Cementation
These characteristics are discernible in the field, and, except for the exact texture, they do not
have to be determined by laboratory analysis. They do not describe the engineering properties as
such, but they are related to such properties as capillarity, compactability, expansion, elasticity,
density, supporting power, and others.

123
The engineering properties associated with soils have been used for classification and are the
basis of the AASHTO system. The AASHTO system uses the engineering properties of
elasticity, expansion and load bearing capacity based on actual field use along with exact texture
as to basis for classification.
5-692.603 Primary Classifier (Texture)
A. Definition of Textures
Texture is a term used to indicate the size of individual particles in a given soil mass and the
proportions of each size present. Most natural soil masses consist of a combination of many grain
or particle sizes. The distribution of particle sizes and the relative predominance of fine or coarse
grains imparts to the soil a distinctive appearance and “feel”, which is called texture. The textural
terms used to describe soils express the average effect of all the grain sizes or the effect of the
predominant group of particles. Texture is the most common term used to identify soils.
B. Soil Components
The principal particle sizes of soil are:
1. Gravel
2. Sand
3. Silt
4. Clay
All soils are made up of one or all of these distinct components in combination. Each component
has a definite grain size range and characteristic reaction in the soil mass. The soil particle sizes
and their quantity distribution throughout the soil mass are important factors which influence soil
properties and performance.
C. Grain Sizes of Soil
The grain size ranges for the above soil components are described in Table 24:
Table 24 Classifying Soils by Grain Size
Particle Size Diameter [mm] Sieve Sizes
Passing Retained
Gravel 75 to 2.0 3” (75 mm) No. 10 (2 m)
Coarse Sand 20. to 0.425 No. 10 (2 mm) 425m (No. 40)
Fine Sand 0.075 to 0.002 No. 40 (425 m) No. 200 (75 m)
Silt 0.075 to 0.002 Cannot be separated by sieving.
Determined by settling velocity in soil-
water suspension
Clay Smaller than 0.002
Colloidal Clay Smaller than 0.001

124
D. Laboratory Determination of Texture:
Since most all soils are made up of a combination of the above particle sizes, it is necessary to
separate these particles into the different grain size groups to determine the exact classification.
This is done in the laboratory by mechanical analysis.
The percentages of gravel and sand in a representative soil sample are determined by shaking it
through the required sieve sizes. The percentages of smaller size particles, silt and clay, both of
which pass the 75m sieve (No. 200), are determined by hydrometer analysis. This involves
measuring the settling velocity of these particles when the sample is thoroughly dispersed in a
soil water suspension. Since larger, heavier particles settle out of suspension more rapidly, the
time rate of settlement provides a measure of the relative size of fine soil grains. Thus as the soil
grains continue to settle with elapsed time, the specific gravity of the soil water suspension
becomes lighter. A graduated hydrometer immersed in the suspension at increasing time
intervals measures the change in specific gravity. By using the hydrometer readings in the proper
formula, the percentages of silt and clay in the soil sample can be calculated.
Thus knowing the percentages of each grain size group in the sample, the soil can be assigned a
definite textural classification dependent upon the various amount of sand, silt and clay. The
textural classification of soils is determined by using the triaxial chart, (see Figure 34).
The basic concept for this textural classification was originated by the United States Bureau of
Chemistry and Soils. It defines the main soil classes in relation to their percentage of sand, silt,
and clay. Stone and gravel particles larger than the sand size (2mm) [No. 10] sieve ordinarily do
not change the basic soil classification. Soils containing in excess of 25% gravel particles are,
however, generally termed gravelly or stony soils.
The textural names of the soils are designed to tell as much as possible about the soil in one word
or a combination of two or three words. This makes the definitions of soil texture important.
With texture given, approximations and estimates of many soil properties can be made, such as
bearing value, water holding capacity, susceptibility to frost heave, maximum dry density and
optimum moisture content.
The triaxial chart places the soil textures into three main groups on the basis of clay content. The
three main groups are then subdivided further.
1. Soils Containing Less than 20% Clay.
Sand
Loamy Sand
Sandy Loam
Loam
Silt Loam
Silt
2. Soils Containing From 20% to 30% Clay.
Sandy Clay Loam
Clay Loam
Silty Clay Loam

125
3. Soils Containing 30% or More Clay.
Sandy Clay
Clay
Silty Clay
Table 25 shows the soil textures with their gradation limits determined by laboratory mechanical
analysis.
E. Field Determination of Texture:
Engineers and inspectors must be able to determine textural classification of soils within a
reasonable degree of accuracy in the field in order to perform the duties of soil selection and
construction monitoring.
Complete mechanical analysis tests on soil generally cannot be made in the field laboratory.
Only the gradation of the coarse fraction (plus No. 200) (75 µm sieve) of the soil sample can be
determined in the field by sieve analysis. The fine fraction, which consists of silt and clay
particles must be determined in the laboratory by a hydrometer analysis.
Identification of soil texture in the field must therefore be accomplished by the feel and
appearance of the soil mass. This requires training and experience. It is one of the most important
functions of field soils inspection. Soil identification with reasonable accuracy is essential when
performing soil selection and in performing density and moisture control tests on grading.
Soil is classified in the field by using two methods: 1.) forming a cast in the hand, 2.) by pressing
or rubbing a moist sample between the thumb and index finger to form a thin ribbon until it
breaks under its own weight in a horizontal position. The length of the ribbon is relative to the
percent clay in the soil (see Figure 34). These two methods constitute the major field
identification procedure tests used to judge soil texture.
In classifying soils, it is important that the soil contains a normal amount of moisture. A normal
amount in general is when the soil feels moist to the touch and yet have workability. Ribboning
for identification is to be done when the soil moisture is such that the soil sample can be worked
by the fingers but does provide some resistance to ribboning. Ribbons should be about 10mm
(1/2”) wide and about 3mm (1/8”) thick for best results. It may be difficult at times to positively
classify soils by these methods. With practice, experience, and by comparison of soil samples
with specimens classified by laboratory analysis, it is possible to become reasonably proficient.
The following descriptions of the soil textural classes are designed to assist the inspector in
identifying them in the field. The main soil classes shown in the textural chart are described as
well as variations which are likely to be encountered.
Remember that gravel, sand, and pure silt are non plastic materials. Clay is plastic and cohesive.
Sand and silt will become more or less plastic when mixed with various proportions of clay.
1. Gravel (G)
Gravel is a combination of stones between a maximum size of 75mm (3”) and minimum
diameter of a 2mm (No. 10) sieve. Fine Gravel (FG) is a predominance of stones between the
9.5mm (3/8”) screen and the 2mm (No. 10) sieve. Gravel is easily identified by visual inspection.

126
2. Sand (S)
Sand is material which passes the 2mm (No. 10) sieve 100%. It contains less than 10% silt
performing and clay combined (minus 75m [No. 200] sieve size particles). It therefore contains
90% or more of sand size particles.
Sand is loose and granular. The individual grains can readily be seen and felt. It is non plastic
and therefore cannot be pressed into soil ribbons. If squeezed into a cast in the hand when dry, it
will fall apart when the pressure is released. Squeezed when moist, it will form a cast that will
hold its shape when the pressure is released but will crumble when touched or jarred slightly.
Coarse Sand (CrS) is sand in which the predominant particle size is between the 2mm (No. 10)
sieve and the 425m (No. 40) sieve.
Fine Sand (FS) is sand in which the predominant particle size is between the 425m (No. 40)
sieve and the 75m (No. 200) sieve.
Very Fine Sand (VFS) is sand in which practically all particles are close to the 75m (No. 200)
sieve size. Some very fine sand particles will pass the 75m (No. 200) sieve. At times it is
difficult in the field to distinguish between very fine sand and silt.
The plain term Sand (S) is applied when a sample is well graded, containing approximately equal
proportions of coarse sand and fine sand.
3. Sand and Gravel (S&G)
Sand and gravel is a mixture of the sand group and gravel group, and is identified by visual
inspection. Variations might include the following:
Sand and Fine Gravel (S & FG)
Coarse Sand and Gravel (CrS & G)
Coarse Sand and Fine Gravel (CrS & FG)
4. Loamy Sand (LS)
Loamy Sand passes the 2mm (No. 10) sieve 100%. It contains from 10% to 20% of fine grained
silt and clay combined (minus 75m [No. 200] sieve size particles). It therefore contains from
80% to 90% of the particle sizes called sand.
Loamy Sand is loose and granular. The individual grains can readily be seen and felt. It appears
dirty when compared to the classification of sand, due to the higher silt and clay content.
Loamy Sand is non plastic and therefore cannot be pressed into soil ribbons. Squeezed into a
lump in the hand when moist, it will form a cast that will hold its shape when the pressure is
released. The cast will not only withstand careful handling but some jarring as well without
crumbling. This stability of the moist cast differentiates loamy sand from clean sand.
Loamy Sand can be further classed as coarse, fine, or very fine, the proper term depending on the
proportions of different sizes of sand particles present.
Loamy Coarse Sand (LCrS)
Loamy Fine Sand (LFS)
Loamy Very Fine Sand (LVFS)

127
The plain term Loamy Sand (LS) is used when the material is well graded, containing
approximately equal proportions of coarse sand and fine sand. The word “loamy” is placed first
since these soils are predominantly sands.
5. Sandy Loam (SL)
Sandy Loam contains from 20% to 50% silt and clay combined (minus 75m [No. 200] sieve
size particles) but less than 20% clay. It may contain from 0 to 50% silt and 0 to 20% clay. It
must always contain 50% or more sand grains to be classified as Sandy Loam.
Sandy Loam is the first soil of the textural classification which may be termed plastic. When
moist, it therefore may be pressed into thin ribbons between the thumb and index finger. Since it
contains much sand, the individual sand grains can readily be seen and felt. It contains enough
silt and possibly some clay to make it somewhat coherent or stable. Sandy Loam is further
qualified as non-plastic, slightly plastic or plastic. This difference, important in field work, is
explained as follows:
Slightly plastic Sandy Loam (sl.pl.SL) generally contains from 0 to 10% clay. It may form a thin
ribbon from 0 to 19mm (3/4”) in length beyond the tip of the thumb and index finger before
breaking under its own weight. The 0 length is more or less the sticking together of the sand
grains in a pat when pressed in the fingers rather than the forming of any definite ribbon. It
occurs when the clay content approaches zero. As the clay increases to 10%, the ribbon becomes
longer up to approximately 19mm (3/4”).
Plastic Sandy Loam (pl.SL) contains from approximately 10% to 20% clay and thus is more
plastic or cohesive. It will press into ribbons from 19mm (3/4”) to 37.5mm (1-1/2”) in length as
the clay content increases before breaking under its own weight.
Sandy Loam is further classified according to the proportions of different sizes of sand particles
present, such as:
slightly plastic Coarse Sandy Loam (sl pl CrSL)
plastic Fine Sandy Loam (pl FSL)
plastic Very Fine Sandy Loam (pl VFSL)
The word "sandy" is placed first since these soils are predominantly loams.
6. Loam (L)
The term “loam” for engineering purposes generally means a combination of sand, silt, and clay.
However, in the triangular soil chart, it indicates a soil with definite proportions of sand, silt, and
clay.
Loam contains more than 50% silt and clay combined (minus 75µm [No. 200] sieve size
particles). It contains from 30% to 50% sand, 30% to 50% silt, and 0 to 20% clay. It is thus a
relatively even mixture of sand and silt with less than 20% clay.
Loam is a mellow soil. It has a somewhat gritty feel and yet smoother feel than sandy loam,
since most of the sand particles ordinarily consist of fine sand. When moist, it will form a ribbon
approximately 5mm (1/4”) to 37.5mm (1-1/2”) in length and somewhat thinner and stronger than
can be formed with sandy loam. The word “loam” is commonly used in agriculture as a term to
describe topsoil containing black organic matter, which is easily worked and will support plant

128
growth. However, loam, in engineering terminology, means soil of any color as long as it
contains the specified proportions of sand, silt and clay.
7. Silt Loam (SiL) and Silt (Si)
Silt Loam contains from 50% to 80% silt, 0 to 50% sand, and 0 to 20% clay. It must always
contain 50% or more of silt particles to be classified as Silt Loam.
Silt contains from 80% to 100% silt, 0 to 20% sand, and 0 to 20% clay.
Silt Loam and Silt have a very fine grain structure. These materials have little or no plasticity. In
a dry condition these materials may appear quite cloddy, but the lumps can be readily broken up.
The material will feel soft and floury. When in a moist condition, the material will have a
smooth and slippery feel and a velvety appearance. Depending on the clay content, these
materials may be ribboned. Silt loam may ribbon up to 37.5mm (1-1/2”) in length (slightly
plastic, 0-19mm [0-3/4”] and plastic 19mm to 37.5mm [3/4” to 1-1/2”]. Silts will not press into
a continuous unbroken ribbon but rather into shorter, crumbly, dull appearing segments. These
segments may reach lengths up to 10 mm (1/2”).
In its natural state in the ground, silt loam and silt are frequently very wet. This is due to their
capillary affinity for water. In this condition it runs together and puddles easily when shaken.
All of the above soil classes from 1 through 7 are in the same grouping as they all contain less
than 20% clay. They either will not ribbon because of their non-plastic, granular structure or will
ribbon into lengths up to 37.5mm (1-1/2”) due to the clay content.
8. Clay Loam (CL)
Clay Loam contains from 20% to 50% sand, 20% to 50% silt, and 20% to 30% clay. It is a fine
textured soil and uniform in structure as indicated by its percentage composition of sand, silt and
clay.
The dry natural soil breaks up into hard clods or lumps, which are difficult to pulverize. When
moist, it will form a thin ribbon from 37.5mm (1-1/2”) to 62.5mm (2-1/2”) in length before
breaking under its own weight. When it is thus ribboned between the thumb and index finger, it
offers moderate resistance to deformation; that is, it requires considerable pressure to ribbon.
9. Silty Clay Loam (SiCL)
Silty Clay Loam contains from 50% to 80% silt, 0 to 30% sand, and 20% to 30% clay. The
largest percentage of particles are therefore of silt size.
Silty Clay Loam is also a fine textured soil and when dry will form hard clods or lumps. When
moist, it will ribbon into length from 37.5mm (1-1/2”) to 62.5mm (2-1/2”) without breaking.
When it is thus pressed between the thumb and index finger it does not offer as much resistance
to deformation as clay loam. In other words, it feels softer. At normal moisture content, it feels
slippery or “smeary” due to `the high silt content. When smeared in a thin layer on the inside of
the thumb, it presents a dull appearance in comparison to clay or clay loam which is shiny.
Silty Clay Loam is usually found in the form of soil pockets when the natural formation consists
of clay loam glacial till.

129
10. Sandy Clay Loam (SCL)
Sandy Clay Loam contains from 50% to 80% sand, 0 to 30% silt, and 20% to 30% clay. The
largest percentage of particles are therefore sand. This gives it a gritty feel in comparison to the
smooth, slippery feel of Silty Clay Loam.
Due to its high sand content, the sand particles can readily be seen and felt. In spite of its sandy
structure, it is plastic and will form ribbons from 37.5mm (1-1/2”) to 62.5mm (2-1/2”) in length.
Sandy Clay Loam is found in the natural state only occasionally. When soils as plastic as this
were geologically formed, the finer grained particles of silt and clay pre dominated.
The three soil classes above, numbered 8 through 10, are in the second group of soils. They are
similar as they all contain between 20% and 30% clay. Consequently, in field identification,
they will form ribbons from 37.5mm (1-1/2”) to 62.5mm (2-1/2”) in length, and feel silty or
sandy depending on the predominance of silt or sand particles. Clay Loam feels more even
textured, neither silty or sandy, because of fairly equal distribution of silt and sand.
11. Clay(C)
Clay contains from 30% to 100% clay, 0 to 50% silt, and 0 to 50% sand. It is very fine textured
soil and very plastic.
When dry, clay forms very hard clods or lumps which are extremely difficult to pulverize. When
moist, it will form a long, thin, flexible ribbon 62.5mm (2-1/2”) or more in length. When it is
thus pressed between the thumb and index finger, it offers marked resistance to deformation; that
is, it requires a great deal of finger pressure. Clay can be rolled into very thin threads. When
smeared in a thin layer on the inside of the thumb, it presents a smooth, shiny surface.
12. Silty Clay (SiC)
Silty Clay contains from 30% to 50% clay, 50% to 70% silt, and 0 to 20% sand. It is very plastic
and yet feels smooth and slippery. When moist, it will form a long, thin ribbon 62.5mm (2-1/2”)
or more in length. The sand it contains, if any, is usually very fine and cannot easily be detected
in the soil mass. It is stiff like clay and requires a great deal of finger pressure to ribbon out.
Silty Clay in a natural soil condition may be said to have the appearance and smoothness of
butter. It is normally encountered as soil pockets rather than the general soil mass.
13. Sandy Clay (SC)
Sandy Clay contains from 30% to 50% clay, 50% to 70% sand, and 0 to 20% silt. The largest
percentage of particles are of sand size and therefore the sand can readily be seen and felt. It is
very plastic and yet feels gritty because of the high sand content.
When moist, it will form a long, flexible ribbon 62.5mm (2-1/2”) or more in length. It is stiff
like clay and requires a good deal of finger pressure to ribbon out.
Sandy Clay is even rarer than sandy clay loam in the natural state and therefore is very seldom
encountered.
The last three soil classes, numbered 11 through 13, are in the third group of soils. They are
similar as they all contain 30% or more clay. In field identification, they will form ribbons
50mm or more in length because of this similarity. The most common of the three is clay when
found in the natural state.

130
When identifying textural soil classification in the field by ribboning the soil mass between the
thumb and index finger, it should be recognized that the length of ribbon designated in the
foregoing descriptions does not always indicate exact classification. As an example, let us say
that, by laboratory mechanical analysis, a soil contains 28% clay and is classified as clay loam.
When identified in the field, it may ribbon to a length of 75mm (3”) instead of between 37.5mm
(1-1/2”) and 62.5mm (2-1/2”) and thus be called clay. The difference could be in the plasticity
of the clay or other inherent characteristics of the soil. Ribbon lengths are empirical, having
been established from experience and observation, so may not reveal true classification in all
cases. This is most noticeable where soils are border line between one classification and another.
However, when so closely related in texture, they will react similarly when used for construction.
It is fundamentally important for the inspector to be able to distinguish between the main soil
classes when selecting soils and performing road tests. To fulfill this objective, ribboning and
feeling soils provides the most practical means to quickly identify them in the field. For this
reason, the method has merit even though not always exact.
By the triangular chart, soils are established into three main groups on the basis of clay content.
Clay is the most active ingredient of the component parts of soil. The addition of clay changes
the soil characteristics rapidly. The percentage of sand and gradation of the sand particles also
have a marked effect upon soil tests. Thus, when the sand is mostly fine sand, or coarse sand, or
a relatively even mixture of fine and coarse sand with possibly the addition of some gravel sizes,
the results of such tests as maximum dry density and optimum moisture content are changed.
It should be noted that soil must contain 50% or more of sand particles to be classified in the
sandy soil categories at the left side of the chart.
Likewise, soil must contain 50% or more of silt particles to be in the silty soil classes on the right
side. When sand and silt are reasonably even in distribution, the uniform textured clayey soils in
the center of the chart loam, clay loam and clay are obtained.
F. Feel and Appearance of Soil Mass
Clay: marked resistance to ribbon, roll to thin thread, shiny when smeared
Sandy Clay: highly plastic, 50 to 70% sand, gritty, rarely encountered
Silty Clay: less resistance to ribbon than clay loam, slippery and soft
Sandy Clay Loam: gritty feel, sand particles easily seen and felt, uncommon
Clay Loam: fine textures, uniform and structure, moderate resistance to ribbon
Silty Clay Loam: less resistance than clay loam, slippery, smeary, dull when smeared
Sandy Loam: slightly plastic to plastic, sand grains seen and felt
Loam: mellow, somewhat gritty but smoother than sandy loam
Silt Loam: smooth, slippery or velvety, cloddy when dry, easily pulverized
Silt: smooth, powdery, velvety
Loamy Sand: will form a cast when wet, will stand light jarring
Sand: will form a cast when wet, crumbles easily
(See Figure 34)

131
Figure 34 Triaxial Chart

132
Table 25 Gradation Limit of Textural Soils Group
133
5-692.604 Secondary Classifiers
A. Special Term for Describing Soil
Topsoil: Any of the soil classes described above which contain large amounts of decomposed or
partially decomposed organic matter. Top soils are distinguished by their dark brown to black
color.
Quicksand: Defines a condition rather than a textural classification of soil. A “quick” condition
may occur in gravel, sand, or silt because of an upward flow of water which “lifts” the particles
and decreases stability.
Gumbo: A class of peculiar, fine grained soil under poor drainage conditions. When saturated
with water, gumbos are impervious and have a waxy or soapy appearance and feel.
Diatomaceous Earth: An accumulation of siliceous cell walls of minute marine plants called
diatoms. The soil in such deposits is fine grained, is of uniform texture, and is very slippery
when wet.
Marl: A general term applied to any earthy, crumbly deposit containing quantities of calcium
carbonate, clay, fine sand, shell residues and carbonaceous material. It is very unstable when
placed in water.
Residual Soils: A term applied to soils that remain directly above the parent rock from which
they have been derived by physical and chemical disintegration of that bedrock. Residual soils
are more prevalent in older geological areas.
Transported Soils: Those which have been carried from their original position to their present
location by the elements of nature, such as water, wind, gravity and moving ice.
Till: Unstratified glacial drift soil, usually with stones and boulders intermingled. The term 'till'
is normally applied to the lower stratum of soil layers or horizons which are only slightly or not
at all weathered by the elements of nature such as freezing, thawing, percolating water, chemical
changes, and plant organisms. A till soil thus remains very much in its parent state as deposited
by glaciers. A sandy loam soil in the "C" horizon may be called "sandy loam till" (SLT) to
describe it more completely if it is known to be of glacial origin.
Heavy (Textured): Applied to soils of fine texture in which clay predominates, with dense
structure and firm compact consistency. The term is also applied to soils containing a somewhat
higher proportion of the finer particles than is typical of that textural class (as a "heavy sandy
loam").
Light (Textured): Applied to soils of coarse to medium texture, with very low silt and clay
content, incoherent, single grained structure, and loose consistency. The term is also applied to
soils containing somewhat higher proportions of the coarser particles than is typical of that
textural class (as a "light loam").
B. Color
In describing soils, color provides a first and quick means of identifying soil layers and the
occurrence of similar soils in other localities. Color alone is not sufficient for identification, yet
it can serve a useful purpose. To insure uniformity of description, soil colors are determined
only when the soil contains moisture. Colors found in soils vary from tan, yellow or red to

134
brown, dark gray or black. Color combinations are often used to make descriptions more
complete, for example, a brownish gray soil is a gray soil with a brownish cast.
Mottled: Presence of spots, streaks or splotches of one or more colors in a soil mass of another
predominant color. In mottled soils the colors are not mixed and blended, but each is more or
less distinct in the general ground color.
Marbled: Presence of two or more distinct colors in approximately equal amounts but not
blended. In a marbled soil there is no general or predominant color, as is the case of a mottled
soil.
C. Structure
Structure describes the arrangement of individual soil grains into soil aggregations which make
up the soil mass. It may refer to the natural arrangement of the soil when in place and
undisturbed or to the soil at any degree of disturbance. The terms used below indicate the
character of the arrangement and the general shape and size of aggregations.
Cloddy Structure: (Coarse, medium and fine). Aggregates of irregular shape, 37.5mm (1-1/2”)
to 200mm (8”) in diameter, of firm consistency and more or less rounded in shape.
Crumb Structure: (Coarse, medium and fine). Porous aggregates of irregular shape from more
than 19mm (3/4”) to less than 5mm (1/4”) in diameter and of firm to soft consistency.
Hard Pan: A stratum of soil thoroughly cemented to an indurated, “rock like” layer that will not
soften when wet. The term “Hard Pan” is incorrectly applied to hard clay layers that are not
cemented, or to those layers that may seem indurated, when dry, but which soften and lose their
“rock like” character when soaked in water. True hard pan is cemented by materials that are not
readily soluble, and definitely and permanently (in nature) limits downward movement of roots
and water.
Clay Pan: A layer of stiff, compact, and relatively impervious clay. It is not cemented and can
be worked into a soft mass when wet. Often called Gumbo, and many times erroneously called
Hard Pan.
Massive Structure: Single grained. Structureless. Showing no evidence of any distinct
arrangement of soil particles.
Laminated Structure: An arrangement of the soil mass in very thin plates or layers, less than 1
millimeter (0.04”) in thickness, lying horizontal or parallel to the soil surface. Usually medium to
soft consistency.
Mealy Structure: A crumb like structure in which the aggregates are of soft to very soft
consistency and usually less than 5mm (1/4”) in diameter.
Fluffy Structure: A surface condition where the soil particles are loose, of light weight and fine
texture, with no cohesion or evidence of arrangement; floury.
D. Consistency
The strength of cohesive soils is quantified by their consistency. Terms utilized to describe
consistency are very soft, soft, firm (sometimes referred to as medium stiff), stiff, very stiff, and
hard. Consistency is often thought of as relating to plasticity, since in clays short term strength is
based on cohesion; however, it is possible to have a very plastic soil (high cohesion) appear very
soft.

135
The following descriptive terms are offered to make this classification and identification a
uniform system in the State of Minnesota: very soft, soft, firm, stiff, very stiff and hard.
E. Compactness
The strength of granular soils is quantified by their compactness. It is described as very loose,
loose, medium dense (sometimes referred to as medium), dense, or very dense. Again, a sand
with a high internal friction angle (indicative of high strength) may be encountered in a very
loose condition, so associating strength, per se, with compactness is not necessarily correct.
The (SPT) Standard Penetration Test is widely used to evaluate the compactness of granular
soils. This test is performed in accordance with ASTM D-1586.
In the case of silts, it is probably better to associate terms of consistency rather than
compactness, since silts are difficult to compact and behave, under many circumstances,
similarly to low-plasticity clays.
F. Cementation
A condition occurring when the soil grains or aggregates are caused to adhere firmly and are
bound together by some material that acts as a cementing agent (as colloidal clay, iron or
aluminum hydrates, lime carbonate, etc.).
The degree of cementation when the soil is wetted should be stated. Some terms indicate the
permanence as “indurated,” “hardpan,” etc.
Terms used to describe cementation are: Firmly cemented, indurated (rock like), weakly
cemented, softly cemented.
5-692.605 Organic Soils
Soils containing greater than 5 percent organic material by weight are defined as organic soils.
Organic soils include plant material in various stages of decay from a condition where the stem
and leaf structures can still be detected to a state where the plant tissue has lost its identity and an
indefinite mass of organic material exists.
Organic soils can be classified as follows:
Classification Organic Content by Weight %
Non-organic <2
slightly organic* 2 - 5
organic* 6 - 10
highly organic* 11 - 25
Peat-woody, fibrous, decomposed, etc >25
*Insert specific soil type, e.g. slightly organic, Silt Loam, Peaty loam, etc.
Muck is not a soil type and the term is often misused. The term "muck" is correctly used as in
the construction item Muck Excavation. Mn/DOT 2105.2A4 & 2106.2A4 reads:

136
A.4 Muck Excavation
The removal of organic soils as defined in 2105.1.A.10, “Organic Soils,” and other unstable soils
as designated by the plan, and below the natural ground level of marshes, swamps, or bogs,
regardless of the moisture content. Muck excavation is limited to areas over which the roadway
embankment or a structure is to be constructed.
5-692.606 AASHTO Classification
A. General
In 1928, the Bureau of Public Roads developed a system for classifying soils for highway
engineering purposes based upon the observed performance of subgrade soils under highway
pavements. The original system has been revised several times. Today the system is known as
the AASHTO system of classification of Soils and Soil - Aggregate Mixtures for Highway
Construction Purposes (AASHTO Designation M 145.)
The AASHTO system is an engineering property classification based upon field performance of
subgrade soils under highway pavements. Subgrade soil materials are classified into seven major
groups designated A-1 through A-7. The soils of each group have similar broad characteristics
in common and physically react alike when subjected to loads. This system was developed so
that a soil could be given a standard classification, no matter in what locality, county or part of
the world it is found. This enabled engineers anywhere to talk the same language.
The AASHTO classification system has been adopted by the Minnesota Department of
Transportation to correlate soils in Minnesota with standard classification procedures. The
method is therefore included in its entirety in this manual. It is to be remembered that this
classification system has been developed for engineering purposes and is not to be confused
with the soil textural classification system described in the triangular chart, although the two are
related.
B. Scope
Based upon their field performance, soils are classified by this procedure into seven groups
which are designated as A-1, A-2, A-3, A-4, A-5, A-6, and A-7. The results of tests made in
accordance with the methods hereinafter specified indicate the physical properties of the soils
and serve to identify them with respect to grouping. Evaluation of soils within each group is
made by means of a “group index” which is a value calculated by means of an empirical formula
derived from observations of the behavior of soil and soil materials in embankments, subgrades,
and subbases.
C. Test Procedures
The classification is based upon the results of tests made in accordance with the following
standard methods of the AASHTO:
1. Amount of material finer than 75m (No. 200) Sieve in Aggregate T-11
2. Sieve Analysis of Fine and Coarse Aggregate T-27
3. Particle Size Analysis of Soils T-88
4. Liquid Limit of Soils T-89
5. Plastic Limit of Soils and Plastic Index T-90

137
D. GROUP INDEX CALCULATION
1. The group index is calculated from the following formula:
Group index = (F-35) [0.2 + 0.005 (LL-40)] + 0.01 (F-15) (PI-10) in which,
F = percentage passing 75m (No. 200) sieve, expressed as a whole number.
This percentage is based only on the material passing the 75mm (3”) sieve.
LL = liquid limit
PI = plasticity index
a. When the calculated group index is negative, report the group index as zero (0).
b. The group index should be reported to the nearest whole number.
2. Figure 1, AASHTO M 145, also, may be used in estimating the group index, by determining
the partial group index due to liquid limit and that due to plasticity index, then obtaining the
total of the two partial group indexes.
3. When calculating the group index of A-2-6 and A-2-7 subgroups, only the PI portion of the
formula shall be used.
4. The following are examples of calculations of the group index:
a. Assume that an A-6 material has 55 percent passing the 75m (No. 200) sieve,
liquid limit of 40, and plasticity index of 25.
Then, Group index =
(55-35)[0.2 + 0.005 (40-40)] + 0.01 (55-15) (25-10) = 4.0 + 6.0 = 10
b. Assume that an A-7 material has 80 percent passing the 75m (No. 200) sieve,
liquid limit of 90, and plasticity index of 50.
Then, Group index =
(80-35)[0.2 + 0.005(90-40)] + 0.01 (80-15) (50-10) =20.3 + 26.0 = 46.3
c. Assume that an A-4 material has 60 percent passing the 75m (No. 200) sieve,
liquid limit of 25, and plasticity index of 1.
Then, Group index =
(60-35)[0.2 + 0.005 (25-40)] + 0.02 (60-15) (1-10)= 25 X (0.2 - 0.075) +
0.01(45)(-9) = 3.1 - 4.1 = -1.0
Report as 0.
d. Assume that an A-2-7 material has 30 percent passing the 75m (No. 200) sieve,
liquid limit of 50, and plasticity index of 30.
Then, Group index =
0.01(30-15) (30 10) = 3.0 or 3
(Note that only the PI portion of formula was used.)

138
E. Basis for Group Index Formula
1. The empirical group index formula devised for within group evaluation of the “clayey
granular materials” and the “silt clay materials” is based on the following assumptions:
a. Materials falling within Groups A-1-a, A-1-b, A-2-4, A-2-5, and A-3 are satisfactory as
subgrade materials when properly drained and compacted or can be made satisfactory by
addition of small amounts of natural artificial binders.
b. Materials falling within the “clayey granular” Groups A-2-6 and A-2-7 and the “silt clay”
Groups A-4, A-5, A-6, and A-7 will range in quality as subgrade from the approximate
equivalent of good A-2-4 and A-2-5 subgrades to fair and poor subgrades requiring a
layer of subbase material or an increased thickness of base coarse over that: required
under a., in order to furnish the adequate support for traffic loads.
c. The assumed critical minimum percentage passing the 75m (No. 200) sieve is 35
neglecting plasticity, and 15 as affected by plasticity indexes greater than 10.
d. Liquid limits of 40 and above are assumed to be critical.
e. Plasticity indexes of 10 and above are assumed to be critical.
f. For soils that are non-plastic and when the liquid limit cannot be determined, the group
index shall be considered zero (0).
2. There is no upper limit of group index value obtained by use of the formula. The adopted
critical values of percentage passing the 75m (No. 200) sieve, liquid limit and plasticity
index, are based on an evaluation of subgrade, subbase and base course materials by several
highway organizations that use the tests involved in this classification system.
3. Under average conditions of good drainage and thorough compaction, the supporting value of
a material as subgrade may be assumed as an inverse ratio to its group index; that is, a group
index of 0 indicates a “good” subgrade material and group index of 20 or greater indicates a
“very poor” subgrade material.
F. Classification
1. General
The classification is made by using the test limits and group index values shown in Table 26.
Classification Procedure. With required test data available, proceed from left to right in Table
26, and the correct group will be found by process of elimination. The first group from the left
into which the test data will fit is the correct classification. All limiting test values are shown as
whole numbers. If fractional numbers appear on test reports, convert to nearest whole number
for purposes of classification. Group index values should always be shown in parentheses after
group symbol as A-2-6 (3), A-4 (5), A-6 (12), A-7-5 (17), etc.
2. Definition of Gravel, Sand and Silt Clay
The terms “gravel”, “coarse sand”, “fine sand”, and “silt clay”, as determined from the minimum
test data required in this classification arrangement and as used in subsequent word description,
are defined as follows:
a. Gravel Material passing sieve with 75mm (3”) square openings and retained on the
2mm (No. 10) sieve.

139
b. Coarse Sand Material passing the 2mm (No. 10) sieve and retained on the 425μm (No.
40) sieve.
c. μm (No.
200) sieve.
d. Combined Silt and Clay Material passing the 75m (No. 200) sieve.
e. Boulders (retained on 75m (3”) sieve) should be excluded from the portion of the
sample to which the classification is applied, but the percentage of such material, if any,
in the sample should be recorded.
f. The term “silty” is applied to fine material having plasticity index of 10 or less and the
term “clayey” applied to fine material having plasticity index of 11 or greater.
3. AASHTO Classification System (formerly, Highway Research Board Classification)
This classification system divides soils into two major groups. One group which includes the A-
1, A-2 and A-3 classes is composed of soils that have 35% or less passing a 75m (No. 200)
sieve. The second group, A-4, A-5, A-6, A-7, is composed of soils that have more than 35%
passing a 75m (No. 200) sieve.
The two major groups in the soil classification are further divided into additional groups and
subgroups as follows:
a. Granular materials:
Group A-1: Well graded mixtures of stone fragments of gravel ranging from coarse to fine with
a non plastic or slightly plastic soil binder. However, this group also includes coarse materials
without soil binder.
Subgroup A-1-a: Materials consisting predominantly of stone fragments or gravel, either with
or without a well graded soil binder of fine materials.
Subgroup A-1-b: Materials consisting predominantly of coarse sand either with or without a
well graded soil binder.
Group A-3: Materials consisting of sands deficient in coarse material and soil binder. Typical is
fine beach sand or fine desert blow sand, without silt or clay fines or with a very small amount of
non-plastic silt. This group also includes stream deposited mixtures of poorly graded fine sand
and a limited amount of coarse sand and gravel. These soils make suitable subgrades for all
types of pavements when confined and damp. They are subject to erosion and have been known
to pump and blow under rigid pavements. They can be compacted by vibratory, pneumatic tired,
and steel wheel rollers but not with a sheepsfoot roller.
Group A-2: This group includes a wide variety of “granular” materials which are borderline
between the materials falling in Groups A-1 and A-3 and the silt clay materials of Groups A-4,
A-5, A-6, and A-7. It includes all materials containing 35 percent or less passing the 75m (No.
200) sieve which cannot be classified as A-1 or A-3.
Subgroups A-2-4 and A-2-5: include various granular materials containing 35 percent or less
passing the 75m (No. 200) sieve and with a minus 425μm (No. 40) portion having the
characteristics of the A-4 and A-5 groups. These groups include such materials as gravel and
coarse sand with silt contents or plasticity indexes in excess of the limitations of Group A-1, and
fine sand with non-plastic silt content in excess of the limitations of Group A-3. Subgroups A-2-

140
6 and A-2-7 include materials similar to those described under Subgroups A-2-4 and A-2-5,
except that the fine portion contains plastic clay having the characteristics of the A-6 or A-7
group. The approximate combined effects of plasticity indexes in excess of 10 and percentages
passing the 75m (No. 200) sieve in excess of 15 is reflected by group index values of 0 to 4.
A-2 soils are given a poorer rating than A-1 soils because of inferior binder, poor grading, or a
combination of the two. Depending on the character and amount of binder, A-2 soils may
become soft during wet weather and loose and dusty in dry weather when used as a road surface.
If, however, they are protected from these extreme changes in moisture content, they may be
quite stable. The A-2-4 and A-2-5 soils are satisfactory as base materials when properly
compacted and drained, while A-2-6 and A-2-7 soils may lose stability because of capillary
saturation or lack of drainage. A-2-6 and A-2-7 soils with low percentages of minus 75m (No.
200) material are classified as good bases, whereas these same soils with high percentages of
minus 75m (No. 200) and P.I.'s of 10 or higher are questionable as a base material. Frequently
the A-2 soils are employed as a cover material for very plastic subgrades.
b. Silt Clay Materials:
Groups A-4: The typical material of this group is a non-plastic or moderately plastic silty soil
usually having 35 percent or more passing the 75m (No. 200) sieve. The group incudes also
mixtures of fine silty soil and up to 64 percent of sand and gravel retained on the 75m (No.
200) sieve. The group index values range from 1 to 8, with increasing percentages of coarse
material being reflected by decreasing group index values. These predominantly silty soils are
quite common in occurrence. Their texture varies from sandy loams to silty and clayey loams.
With the proper amount of moisture present, they may perform well as a pavement component.
However, they frequently have an affinity for water and will swell and lose much of their
stability unless properly compacted and drained. Moreover, they are subject to frost heave.
Since these soils do not drain readily and may absorb water by capillarity with resulting loss in
strength, the pavement structural design section should be based on the strength of the soils when
saturated. The silty loams are often difficult to compact properly. Careful field control of
moisture content and pneumatic tired rollers are normally required for proper compaction.
Group A-5: The typical material of this group is similar to that described under Group A-4,
except that it is usually of diatomaceous or micaceous character and may be highly elastic as
indicated by the high liquid limit. The group index values range from 1 to 12, with increasing
values indicating the combined effect of increasing liquid limits and decreasing percentages of
coarse material. These soils do not occur as widely as the A-4 soils. They are normally elastic
or resilient in both the damp and semi dry conditions. They are subject to frost heave, erosion,
and loss of stability if not properly drained. Since these soils do not drain readily and may
absorb water by capillarity with resulting loss in strength, the pavement structural design section
should be based on the strength of the soils when saturated. Careful control of moisture content
is normally required for proper compaction.
Group A-6: The typical material of this group is a plastic clay soil usually having 35 percent or
more passing the No. 200 (75µm) sieve. The group includes also mixtures of fine clayey soil
and up to 64 percent of sand and gravel retained on the No. 200 (75µm) sieve. Materials of this
group usually have high volume change between wet and dry states. The group index values
range from 1 to 16, with increasing values indicating the combined effect of increasing plasticity
indexes and decreasing percentages of coarse material. These soils are quite common in
occurrence and are widely used in fills. When moisture content is properly controlled, they

141
compact quite readily with either a sheepsfoot or pneumatic tired roller. They have high dry
strength but lose much of this strength upon absorbing water. The A-6 soils will compress when
wet and shrink and swell with changes in moisture content. When placed in the shoulders
adjacent to the pavement, they tend to shrink away from the pavement edge upon drying and
thereby provide an access route to the underside of the pavement for surface water. The A-6
soils do not drain readily and may absorb water by capillarity with resulting loss in strength.
Therefore, the pavement structure design section should be based on the strength of the soils
when saturated.
Group A-7: The typical materials and problems of this group are similar to those described
under Group A-6, except that they have the high liquid limits characteristic of the A-5 group and
may be elastic as well as subject to high volume change. The range of group index values is 1 to
20 with increasing values indicating the combined effect of increasing liquid limits and plasticity
indexes and decreasing percentages of coarse material.
Subgroup A-7-5: includes those materials with moderate plasticity indexes in relation to liquid
limit and which may be highly elastic as well as subject to considerable volume change.
Subgroup A-7-6: includes those materials with high plasticity indexes in relation to liquid limit
and which are subject to extremely high volume change.
Group A-8: Highly organic soils may be classified in an A-8 group. Classification of these
materials is based on visual inspection, and is not dependent on percentage passing the No. 200
(75µm) sieve, liquid limit or plasticity index. The material is composed primarily of partially
decayed organic matter, generally has a fibrous texture, dark brown or black color and odor of
decay.
These organic materials are unsuitable for use in embankments and subgrades. They are highly
compressible and have low strength.

142
Table 26 Classification of Soil-Aggregate Mixtures
5-692.607 Soil Selection Guide for Field Inspectors
A. General
One of the most important functions of the grading inspector is the selection of soils for
placement in the road structure. The embankment soils are the foundation materials that will
ultimately support the loads imposed on the finished road structure and the soils selected for
placement in the upper portion of the grade should be the best available. This section of the
Manual is designed to assist the inspector to evaluate the soils on his project and to select the
best soils for embankment construction.
In order to intelligently select soils for placement in the grade, it is necessary to understand what
engineering properties are desirable and to be able to identify, in the field, soils having those
properties.
Soils are composed of four components, gravel, sand, silt and clay. All soils are made up of one
or more of these components in varying combination. The influence of each of these
components affects the performance of a foundation soil. Gravel is relatively frost free and is
not as susceptible to moisture changes as silt, sand or clay. Sand, if it is sharp edged and
angular, helps prevent slippage in the soil mass, is not susceptible to frost or minor moisture
changes and contributes to the stability of the embankment. Silt is highly susceptible to moisture
changes, has a fairly large volume change between the wet and dry states and when silt is the
predominant component, the soil is unstable if exposed to moisture. In small quantities, silt fills
voids and helps to provide a well graded, dense soil mass. Clay includes a wide range of
materials from highly stable to unstable soils. In the proper proportion, it provides cohesion and
helps to cement the soil mass together and increase the stability. A well graded soil combining

143
all of the above components in the proper proportions will provide a dense, highly stable
embankment.
Most of the tests made to measure the engineering properties of soils cannot be made in the field.
These tests include the determination of the silt and clay fractions, the liquid limit and plastic
limit tests and the computations to determine the AASHTO group classification. Although, these
tests cannot be made in the field, they have been made for samples submitted to the laboratory by
the Soils Engineer during his soil survey and copies of these tests should be obtained from him
and used by the inspector to compare with his field identifications to help control the work. The
tests are also routinely made on all samples submitted to the laboratory during construction.
The test results of laboratory samples are reduced to 3 significant terms:
1. Textural Classification
2. AASHTO classification system which classifies soils into 7 groups designated A-1 through
A-7.
3. Group Index which is a numerical rating that can range from 0 to 20 or more with the best
soils having a value of 0 and the poorest having values of 20 or greater. The textural
classification can be determined in the field by visual inspection and by “feel”. Comparison
of like textural classifications can provide an estimate of the AASHTO group classification.
With practice, considerable proficiency can be attained.
B. Soil Identification
Table 27 summarizes a quick, simple method of identifying soils in the field.
If the information furnished by the AASHTO Classification System is to be used effectively by
the Inspector, it is necessary to provide a quick, simple method of identifying soils in the field
having the same characteristics as those tested in the laboratory. The laboratory report identifies
the sample by “Textural Class”. The textural class is determined from the proportions of sand,
silt and clay in the sample by means of the triangular chart. The textural classification of soils
can be determined in the field by “feel” and visual inspection. By comparison with the
laboratory samples, an estimate of the AASHTO group classification can be obtained and the
textural classification can be used as a guide in selecting embankment soils. The field method
for determining the textural classification involves determining the effect of sand grains by
“feel” and the effect of plastic soils by forming a cast in the hand and by pressing or rubbing a
moist sample between the thumb and forefinger to form a thin ribbon until it will break under its
own weight when held in a horizontal position.

144
Table 27 AASHTO Soil Identification
1. Gravel (G)
A combination of stones that will pass a 75mm (3”) sieve and be retained on a 2mm (No. .12010)
sieve. Fine Gravel (FG) has a predominance of stones between the 9.5mm (3/8”) and 2mm (No.
10) sieves. These materials can be classified by visual inspection. The AASHTO classification
is A-1-b and the Group Index is 0.
2. Sand (S)
100% of this material will pass a 2mm (No. 10) sieve and will have less than 10% silt and clay
combined. It will not form a ribbon. It will generally fall in the A-1-b group with a Group Index
of 0.
SOIL IDENTIFICATION
TEXTURAL
CLASS
IDENTIFICATION BY
FEEL RIBBON LENGTH
AASHTO
GROUP
(H.R.B.
CLASS)
GROUP
INDEX
RATING
FOR
UPPER
EMB.
Gravel (G) Stones: Pass 75mm (3”) sieve,
Retained on 2mm (No. 10) 0 A-1-a 0 Excellent
Fine Gravel (FG) Stones: Pass 9.5mm (3/8”) sieve,
Retained on 2mm (No. 10) 0 A-1-a 0 Excellent
Sand (S) 100% pass 2mm (No. 10). Less
than 10% silt and clay 0 A-1-b 0 Excellent
Coarse Sand (CrS) Pass 2mm (No. 10), Ret. 425µm
(No. 40). 0 A-1-a or A-1-b 0 Excellent
Fine Sand (FS) Most will pass 425µm (No. 40),
Gritty, non-plastic 0 A-1-b or A-3 0
Excellent to
Good
Loamy Sand (LS) Grains can be felt. Forms a cast. 0 A-2-4 or
A-2-5 0
Excellent to
Good
Sandy Loam (SL)
a. sightly plastic
(slpl) 0-10% clay. Gritty. 0 - 19mm (0-3/4”)
A-2-4, A-2-6
or A-2-7 0 - 4
Excellent to
Good
b. plastic (pl) 10-20% clay. Gritty. 19mm (0-3/4”) -
37.5mm (1 1/2”) A-4 1 - 13
Excellent to
Good
Loam (L) Gritty, but smoother than SL. 5mm (1/4”) -
37.5mm (1 1/2”) A-4 1 - 13
Excellent to
Good
Silt Loam (SiL)
a. sightly plastic
(slpl)
0-10% clay. Smooth, slippery or
velvety. Little Resistance 0 - 19mm (3/4”) A-4 0-13 Fair to Poor
b. plastic (pl) 10-20% clay. Smooth, slippery or
velvety. Little Resistance .
19mm (0-3/4”) -
37.5mm (1 1/2”) A-4 1 - 13 Fair to Poor
Silt (Si) >80% Silt. Small, slippery or
velvety. Little Resitance. 0 - 15mm (0-1/2”) A-4 1 - 13 Poor
Clay Loam (CL) Smooth, shiny, considerable
resistance.
37.5mm (1 1/2”) -
62..5mm (2 1/2”) A-6 1 - 40
Good to
Fair
Silty Clay Loam
(SiCL)
Dull appearance, slippery, less
resistance.
37.5mm (1 1/2”) -
62..5mm (2 1/2”)
A-6 or
A-5 1 - 40 Fair to Poor
Sandy Clay
Loam(SCL)
Somewhat gritty. Considerable
resistance.
37.5mm (1 1/2”) -
62..5mm (2 1/2”)
A-6 or
A-5 1 - 40
Good to
Fair
Clay (C) Smooth, shiny, long thin ribbon. > 62..5mm (2 1/2”) A-7 1 - 40 Fair to Poor
Silty Clay (SiC) Buttery, smooth, slippery. > 62..5mm (2 1/2”) A-7 or
A-7-5 1 - 40 Poor
Sandy Clay (SC) Very plastic but gritty. Long, thin
ribbon. > 62..5mm (2 1/2”)
A-7 or
A-7-6 1 - 40 Fair to Poor

145
Coarse Sand (CrS). The predominant size is material that will pass a 2mm (No. 10) sieve and be
retained on a 425μm (No. 40) sieve. It will not form a ribbon. AASHTO classification, A-1-a.
Group Index 0.
Fine Sand (FS) the predominant size is material that will pass the 425m (No. 40) sieve and be
retained on a 75m (No. 200) sieve. It will not form a ribbon. AASHTO classification, A-1-b or
A-3, Group Index, 0.
3. Loamy Sand (LS)
100% of this material will pass a 2mm (No. 10) sieve and will contain between 10 and 20% of
the fine grained silt and clay. This material is loose and granular when dry and the individual
grains can be seen and felt. When moist, it will form a cast, but because it is non-plastic, it
cannot be pressed into a ribbon. Loamy sand can be further classified as Loamy Coarse Sand
(LCrS). Loamy Fine Sand (LFS) or Loamy Very Fine Sand (LVFS). These soils will be
generally classified as A-2-4 or A-2-5, but may be classified as A-3 or A-1-b. Group Index, 0.
4. Sandy Loam (SL)
This soil contains 20% to 50% silt and clay combined, but less than 20% clay. It must always
contain 50% or more sand grains to be classified as sandy loam. Sandy loam is divided into two
main groups, slightly plastic and plastic sandy loam.
Slightly Plastic Sandy Loam (sl pl SL) generally contains 10% or less clay. It will form a thin
ribbon 0 19mm (0-3/4”) in length before breaking under its own weight. AASHTO
classification, A-2-4, A-2-6 or A-2-7, Group Index 0 to 4.
Plastic Sandy Loam (pl SL) contains about 10% to 20% clay. It will feel gritty and can be
pressed into a ribbon form 19mm (0-3/4”) to 25mm (1”) in length. Generally, the approximate
group index value(s) for AASHTO classifications for A-2-4 and A-2-5 is 0 and for A-2-6 and A-
2-7, the values range from 1-13.
5. Loam (L)
Loam always contains more than 50% silt and clay combined. It is a relatively even mixture of
sand and silt with less than 20% clay. It has a somewhat gritty feel but is smoother than a sandy
loam. It will form a ribbon 5mm (1/4”) to 37.5mm (1-1/2”) in length, but will be thinner and
stronger than can be formed with sandy loam. AASHTO classification A-4. The Group Index
values range from 1 to 13.
6. Silt Loam (SiL) and Silt (Si)
Silt Loam contains more than 50% silt, 0 to 50% sand and less than 20% clay (If the soil contains
more than 80% silt and 0 to 20% sand, it is classified as a silt.) When pressed between the
fingers, it will offer little resistance to pressure and feels smooth, slippery or “velvety”. Silt
Loam is classified as slightly plastic when the ribbon length is between 0 and 19 mm (0 and
3/4”) and is classified as plastic Silt Loam when the ribbon length is between 19mm (3/4”) and
37.5mm (1-1/2”) Pure silt is non plastic and will not press into a continuous ribbon, but it will
press into ribbons of up to 0 -10mm (0-1/2”) in length, depending on the clay content AASHTO
Classification, A-4, Group Index, 0 to 13.

146
7. Clay Loam (CL)
Clay loam contains 20% to 30% clay, 20% to 50% silt and 20% to 50% sand. It is fine textured
and will form a ribbon from 37.5mm (1-1/2”) to 62.5mm (2-1/2”) in length before breaking. It
requires considerable pressure to form a ribbon. AASHTO classification, A-6, Group Index, 1 to
40.
8. Silty Clay Loam (SiCL)
Silty Clay Loam contains 20% to 30% clay, 50% to 80% silt and 0 to 30% sand. This is a fine
textured soil and will form a ribbon 37.5mm (1-1/2”) to 62.5mm (2-1/2”) in length without
breaking. It does not offer as much resistance to pressure as clay loam and has a dull
appearance, but is slippery. AASHTO classification A-6, but may be an A-5, if elastic, Group
Index, 1 to 40.
9. Sandy Clay Loam (SCL)
Sandy Clay Loam contains 20% to 30% clay, 50% to 80% sand and 0 to 30% silt. It has a gritty
feel compared to the more slippery feel of clay loam. It will form a ribbon 37.5mm (1-1/2”) to
62.5mm (2-1/2”) in length. AASHTO classification, A-6 Group Index, 1 to 40.
10. Clay (C)
Clay contains from 30% to 100% clay, 0 to 50% silt and 0 to 50% sand. It is smooth and shiny
and will form a long, thin, flexible ribbon 62.5mm (2-1/2”) or more in length. AASHTO
classification A-7. Group Index, 1 to 40.
11. Silty Clay(SiC)
Silty Clay contains 30% to 50% clay 50% to 70% silt and 0 to 20% sand. It is very plastic but
feels smooth and slippery and will form a ribbon 62.5mm (2-1/2”) or more in length. It is
buttery. AASHTO classification, A-7 or A 7-5, Group Index, 1 to 40.
12. Sandy Clay (SC)
Sandy Clay contains 30% to 50% clay, 50% to 70% sand and 0 to 20% silt. It is very plastic, but
feels gritty. It will form a long, thin ribbon 62.5mm (2-1/2”) or more in length. AASHTO
classification A-7 or A 7-6. Group Index, 1 to 40.
The group index values shown for: Soils No.’s 4, 5 and 6 decrease with increasing percentages
of coarse material. Soils No.’s 7, 8 and 9 increase with increasing percentage of coarse material.
Soils No.’s 10, 11 and 12 increase due to the combined effect of increasing liquid limits and
plasticity indexes and decreasing percentages of coarse material.
5-692.620 Soil Profile
5-692.621 Definition (Soil Profile)
"Soil profile" is the term applied to a vertical section from the ground surface down through the
weathered soil horizons and into the underlying, parent material. This term was originally used
by soil surveyors in the method developed by them for mapping soils for agricultural purposes.
It has since been adapted to use quite commonly by engineers in making soil surveys for
engineering purposes.
The term "soil horizon" refers to a soil condition formed by the process of weathering and should
not be confused with differing soil types, which commonly form in layers as a result of glacial

147
deposition. By the following definitions, there are only four (A through D) soil horizons
possible, while any number of soil types or layers may be present in a highway cut.
5-692.622 Development of Soil Profile
The soil profile is composed of a series of distinct soil layers, or horizons as they are called.
These horizons are the result of weathering action of the elements through centuries of time upon
the parent material or original unweathered geological formation. This parent material when first
deposited by glaciers, by wind, or by water was the same at the surface as down within the
deposit; that is, there were no horizons of weathered soil at the surface. These horizons
developed later through the action of water, wind, sun, freezing and thawing and bacteriological
life which evolved with growing and dying vegetation.
Gradually, in humid regions, these processes resulted in leaching out some of the water soluble
materials in the uppermost or top zone. Percolating water carried with it the soluble matter
together with the fine soil material in suspension as it seeped downward. As the rate of
downward flow slowed with depth, the soluble material and soil in suspension were deposited at
a lower level, resulting in a zone of accumulation. As a consequence, the top soil horizon
became lighter in texture as some of the finer clay particles were carried out of it. The second
zone then became heavier textured due to the clay and other substances added to it. In standard
soil terminology, these soil horizons are designated as:
"A" Horizon
This is the surface or top zone of soil. It is generally “lighter” textured, sandier, and more friable
than the underlying horizons. It is usually distinguished by a darker color than the lower
horizons because of the accumulation of decomposed organic matter. As a result of this high
organic content, “A” horizon soil exhibits undesirable and unsatisfactory engineering
characteristics, such as high compressibility and elasticity, and unfavorable resistance to
compaction.
"B" Horizon
The second soil zone below the surface is known as the “B” horizon. It is sometimes referred to
as the zone of accumulation due to the collection of material leached out of the “A” horizon.
The “B” horizon is fairly uniform in color and of a lighter color than the “A” horizon. It
generally varies from about 0.5m (1-1/2’) to 1m (3’)in thickness. “B” horizon soil is normally
heavier textured than the “A” horizon but is uniform and evenly textured. For this reason, it is
often the most desirable material for highway construction.
"C" Horizon
The "C" horizon is the stratum below the "B" horizon and is the third zone below the surface.
"C" horizon material remains in the same physical and chemical state as when it was first
deposited. It is the unweathered, parent material. It is generally lighter in color than both the "A"
and "B" horizons and thus readily distinguished from the overlying zone. It may be of indefinite
thickness, extending below the elevation of interest to the highway engineer even in the deep
cuts. It is entirely possible that the "C" will be composed of several soil types or layers. If the
overlying soil is inplace weathered bedrock (residuum) then the “C” horizon will be parent
bedrock.

148
"D" Horizon
The stratum of material underlying the "C" horizon is known in geology as the "D" horizon. The
"D" horizon is ordinarily embedded rock which is not the soils parent material and not generally
of importance in soils engineering. Only a few meters or as much as a few hundred meters may
separate the "A" and "B" horizons from the bedrock.
5-692.623 Prairie Soils
In prairie regions, the "A" horizon acquires its dark color because of the accumulation of organic
matter. The growth of vegetation goes on in cycles; it grows, dies, and decomposes. The
decomposed or partly decomposed carbonaceous matter thus produced imparts the dark coloring
to the soil, ranging from gray to dark brown to black. Intensity of coloring and its depth depend
upon the kind of vegetation, climate, topography, and other factors. In Minnesota, the "A"
horizon may be less than 100mm (4”) thick on the tops of knolls in hilly country where erosion
removes it about as fast as it develops. In low lying poorly drained areas, it may be as thick as 1
to 2 meters (3 to 6 feet) and more where vegetation grows abundantly and additional material
may be washed in and deposited. The "B" horizon is frequently more uniform in thickness
within a given area, since it is not affected as much by erosion.
5-692.624 Forest Soils
In forested country, where forest conditions have prevailed, the "A" horizon is usually light gray
in color, sometimes becoming almost a white or ashy color when dry. The soil is also typically
light textured and usually cohesionless. A layer of leaf mold may often occur as a thin cover
only 25 to 50 mm (1-2 inches) thick over the mineral soil. The "B" horizon soil is frequently
quite heavy and plastic. Forest soils having these characteristics are called "Podsols" when the
light colored "A" horizon is strongly developed. When not so strongly developed, they are said
to be "podsolized."
5-692.625 Types of Surficial Geological Deposits in Minnesota
The general terrain through or on which any transportation project will be located will be
composed of one or more individual land forms. The soil materials in each of these land forms is
related to the mode of deposition and subsequent weathering or reworking. Recognition of
typical Minnesota land forms will provide an insight into the general type of soil to be
encountered and thus the anticipated degree of uniformity and engineering characteristics.
Almost all of the topography in Minnesota is related to the Wisconsin glacial period, which is the
name given to the last of six major ice advances into the State (Figure 35).
The last ice remnants of this glacial period retreated from the State 10,000 12,000 years ago.
Soils deposited or formed since that time is referred to as being of recent or modern origin. Most
Minnesota soils are related in some way to a glacial period, but some recent river or swamp
deposits exist, as do residual soils which have weathered in-place on top of the bedrock surface.
It is frequently difficult to distinguish some recent soils from similar older glacial soils.

149
Figure 35 Wisconsin Glaciation Ice Activity (Ojakangas & Matsch, 1982)
Soils in Minnesota can be associated with one of five categories of surficial geologic deposits:
glacial drift, windblown deposits, recent deposits, gravity deposits and residual soils.
A. Glacial Drift
All soil materials derived from or directly related to glacial activity can be collectively referred
to as drift. This would include such diverse soils as glacial lake clays, outwash sands and
gravels, clay loams, sandy loam till, etc. Drift thickness are as great as 150 meters (500 feet) in
parts of northwestern and central Minnesota.
Wisconsin glaciation is characterized by several advances of four major ice lobes protruding
from the main ice sheet in Canada into Minnesota. These four lobes, distinguished by their flow
direction are the Wadena Lobe, Rainy Lobe, Superior Lobe and Des Moines Lobes. The
Wisconsin glaciation is summarized in Figure 35.
The Rainy and Superior lobes advancing from the northeast (Patrician and Labradorean ice
centers) entered the state through the Iron Range and Arrowhead Regions, overriding reddish
colored sandstone, iron formations, and igneous and metamorphic bedrock. Rock picked up by
this ice is therefore very hard usually reddish or gray black in color and the soils deposited have
a reddish to reddish brown cast and are generally sandy in texture. Soils of northeastern origin,
frequently called “red drift,” cover northeastern Minnesota north of the Twin Cities area and
generally west to the Mississippi River. These soils generally have a soil texture of sandy loam.

150
The Wadena and Des Moines lobes advanced into Minnesota from the north and northwest and
deposits formed by this ice are frequently called “gray drift.” Soils associated with this drift
were derived from sedimentary rock such as limestone and shale, therefore rocks included in this
drift are comparatively soft and have a grayish to brown color. These soils typically contain a
high percentage of shale and limestone particles. Generally, soil textures consist of plastic loam,
clay loam and clay, with a brown to yellowish brown color near the surface where the iron in the
soil has been oxidized or rusted. Such soils cover most of western and southern Minnesota.
It should be mentioned that not all deposits are distinctly reddish or gray colored, but may be
complex mixtures of these types with a thin layer of one overlying the other where ice sheets
have met. “Red and gray drift” soils have distinctive engineering characteristics, with the “Red
drift” types being considerably more moisture sensitive and difficult to work at moisture contents
above optimum.
Drift which has not been reworked or sorted in any manner (unstratified) will include a wide
range of particle sizes (from boulders to clay) and is referred to as till. Thus, clay loams or sandy
loams with pebbles and stones, known to be glacial origin may be termed clay loam till or sandy
loam till. On the other hand, glacial soils reworked by water or wind are technically called
stratified drift and this general classification would include the most common soil types such as
clay, sand, clay loam, etc.
B. Glacial Landform Descriptions
Some of the more common types of glacial land forms are described below:
1. Moraines Deposits of unstratified glacial till dropped directly from the margins of the ice
sheet as the ice melts in a relatively stagnant position. Wide ranges of soil types should be
expected, but the most common types would be clay loam till, sandy loam till, etc. Sand,
gravel and silt are frequently found interspersed with the more plastic soils and abrupt lateral
textural changes can be expected. Drainage of such soil types is slow and water volumes are
usually not great. Terminal and recessional moraines mark the farthest advance of an ice
sheet or an intermediate stopping point in its retreat. In an ice sheet that maintains a
relatively stagnant position, the rate of ice melting roughly equals the rate of ice advance and
thus rather large quantities of soil carried by the ice are liberated. Such deposits are usually
characterized by relatively high, rugged topography and lakes are common. Ground
moraines or till plain are rolling to relatively flat features and form as the ice retreats
uniformly or melts in a stagnant position.
2. Drumlins When an ice sheet moves over previously formed ground moraine, the older
moraine may be remodeled into elongate “cigar shaped” ridges called drumlins, with the long
axes paralleling the direction of ice movement. A group of drumlins may frequently be
found clustered together in one area. Soil types will be the same as the parent moraine.
3. Outwash As the ice melted, streams carrying large sediment loads fanned out from the face
of the ice sheet. As stream velocity decreased and coarser particles were dropped out, rather
level to gently undulating outwash plains of stratified sand, gravel and sometimes silt, were
deposited. A pitted outwash plain is formed when blocks of ice break off the main glacier,
are buried and then later melt, forming depressions or kettles in the outwash. (Kettles may
also form similarly in moraines.)
Valley trains are outwashes confined to old drainage valleys. Outwash features will be
primarily granular, with changes in texture taking place rather gradually both horizontally

151
and vertically. Such features may cover broad areas or be confined to narrow bands, but in
either form they are usually good sources of sand, gravel and water. Grades below the water
table will be difficult to dewater because of the quantity of water present and the ease of
recharge. Outwash deposits frequently rest on top of older till and are associated in origin
with adjoining moraines. (Outwash and ice contact deposits that are formed by streams
associated with glaciers are termed glaciofluvial.)
4. Ice Contact Deposits
The following three types of deposits: kames, eskers, and collapse sediments, are frequently
referred to by the general term ice contact deposit, that is, they form on, within or
immediately adjacent to the ice sheet. Such features are usually granular, but can be
distinguished from typical outwash by the following characteristics:
a. extreme range and abrupt changes in grain size,
b. included bodies or zones of till,
c. marked deformation of bedding features and
d. usually of rather limited extent.
i. Kames These are knob like to irregular shaped isolated hills rising above the
general terrain. Soils within the kame are crudely stratified gravel, sand and silt.
Coarser sediments are typically located toward the center of the kame. Kames
form where sediments are deposited by running water at the edge of an ice mass,
in crevasses or in other openings on or in a stagnant or nearly stagnant ice mass.
When the ice later melts away, the accumulated sediment remains in the form of
isolated mounds. Kames and kettles are often found in close association.
ii. Eskers One of the better known glacial topographic forms is the esker, which is a
long, narrow, sinuous ridge, composed mostly of sand and gravel. Like all ice
contact deposits, particle sizes range from boulders to very fine sand are common.
Esker deposits may have formed in surface channels on the ice, but more likely
they originate from filling of long crevasses or channels within or beneath the ice
sheet. These old channels were frequently eroded below the level of the
surrounding till and thus granular soils may likewise extend to some depth.
Steeply inclined stratification on the flanks is not uncommon.
iii. Collapse Sediments These are basically stratified granular soils deposited on the
surface of the ice flow by streams and let down onto the ground surface as the
stagnant ice melted.
5. Glacial Lakes In front of the ice flow, lakes formed in surface depressions and these
stagnant water bodies provided settling points for silts and clays (Sediments deposited in
lakes fed by glacial melt water streams are termed glaciolacustrine.). Some of these lakes
covered many square miles, with the largest and best known being Glacial Lake Agassiz,
which covered a large part of northwestern Minnesota. Most of these lake clays are
troublesome to the engineer because of their poor drainage characteristics, low strength
parameters and associated stability problems.
Clays compacted below optimum moisture may swell excessively. Smaller lake plains may
be difficult to recognize because recent erosion may have significantly altered the originally

152
flat topography. Granular beach ridges are commonly associated with the large glacial lakes
and these beaches are frequently excellent sources of sand and gravel.
C. Wind Blown Deposits
1. Loess Silt size sediments blown about and redeposited by wind. Grains are angular and of
about the same size (uniformly graded.) Cuts may stand vertically for some time; however, if
left exposed they are susceptible to wind and water erosion. Silty soils are frost susceptible.
Loess occurs predominantly in southeastern Minnesota and in a smaller area of extreme
southwestern Minnesota.
2. Dune Sand Fine sand blown about and deposited by the wind. Exhibits a rather uniform
grain size and individual grains have a dull or frosted appearance. As with most clean sands,
stability under equipment may pose construction problem. Such formations are found in
areas of Norman, Polk, Anoka, Chisago, Isanti, and Sherburne Counties and to a lesser
degree in Mille Lacs, Ramsey and Hennepin Counties.
D. Recent Sediments
Modern or recent sediments are those soils deposited or formed since the last glacial period.
These would include such features as flood plain sediments (alluvial), modern lake clays and
beaches (lacustrine), and marl.
1. Alluvial Soils which have been deposited along a stream or river forming flood plains,
terraces, bars, deltas and levees. The kind of material deposited normally depends in part
upon the rate of water flow. When the current is rapid, heavier granular particles such as sand
or gravel settle out forming granular bars or terraces. Finer grained silt and clay eventually
are deposited when the water becomes less turbulent, often forming deltas and levees.
2. Lacustrine Fine grained sediments deposited in fresh water lakes which may or may not
still be in existence. Wave action in lakes carry the finer grained silt and clay sized particles
in suspension towards deeper water. As the water calms, these particles settle out and
accumulate in the lake bed to form what is known as lacustrine soil. (As mentioned earlier,
many lacustrine sediments in Minnesota were formed in glacial lakes.) Old lake plains are
frequently evidenced by a very flat topography.
3. Peat Deposits: Peat is the accumulation of organic debris in various stages of decay. Peat is
considered to be a unsuitable material for road construction and is normally mixed with
variable amounts of mineral soils. Peat normally accumulates in shallow water areas where
drainage is poor.
4. Marl: Soil which is a white to light gray mixture of the mineral calcium carbonate and silt to
clay. It forms in the bottom of lakes and swamps, mostly from calcium carbonate
precipitating out of ground water, but sometimes from accumulations of shell fragments or
chemical action of aquatic plants. Marl will bubble when treated with dilute hydrochloric
acid and care should be taken not to confuse it with the fine, light gray sands sometimes
found in the bottom of swamps. Marl is also an unsuitable material for roadway
construction.
E. Gravity Deposits
These deposits are technically referred to as colluvium and would include such features as
landslides, surface mud slides, talus etc. Although not particularly common in Minnesota and

153
usually of rather limited extent, this type of deposit frequently indicates an unstable area or one
susceptible to rock fall. These problem zones can usually be visually identified in the field, as
they lie at the base of a hill or rock outcrop. Highly variable soil conditions can be expected.
F. Residual Soils
Residual deposits are those soils that develop in-place on top of the underlying bedrock from
hundreds to thousands of years of weathering. In most areas, any residual soils developed on the
rock surface were eroded during glacial time, but south of St. Cloud and in the Central part of the
State, a variable mantle of white to gray to greenish clay and gritty quartz residue has developed
and been preserved on top of the underlying igneous and metamorphic bedrock (This clay may
look a little like marl, but it will not bubble if treated with acid.). Also, a small part of
Southeastern Minnesota is believed to be essentially non glaciated (drift less area) and here a
mantle of dark orange to brown to rusty colored clays been developed on top of the sedimentary
dolostone bedrock. Engineering treatment of these clays would be similar to their glacial
counterparts. In areas underlain by carbonate bedrock, sinkholes may form where the surface
soils erode into solution cavities in the limestone or dolostone. Every effort must be made to seal
the access to the cavity to prevent future roadway settlement.
In summary, geological deposits influence the character of the soils developed upon them. The
history of geological formations is important to the transportation engineer in that it adds to his
understanding of soil characteristics, values, and uses. Glacial drift deposits are usually the most
complicated and troublesome to deal with in road construction. Because of the seemingly
random nature of their deposition by the glaciers, soils can be quite non uniform and
unpredictable. Unweathered parent, or "C" horizon material for instance, may have many abrupt
changes in soil texture such as pocketed gravel, sand and silt clay materials. Such sharp
variations are the most common cause for differential or non uniform frost heaving. On the other
hand, glacial drift furnishes a large percentage of the aggregates needed for construction.
Loessial silts and lacustrine clays are also troublesome materials to work with on road
construction due to their affinity for capillary water and swell characteristics and their potential
for frost heaving and thaw weakening.
Additional information on Minnesota's geology is available in the Geotechnical and Pavement
Manual.
5-692.630 Soil Selection
Soils selection provides the means for utilizing the knowledge of soils and the principles
discussed in the preceding sections. In making preliminary soil surveys for design, the principal
objective is to discover what soil materials and moisture conditions may be encountered along
the proposed grade line. Representative samples are selected and tested in the laboratory to
evaluate the soils on the basis of their engineering properties. That information is then applied to
the project design to provide for a stable and uniform grade.
Stated simply, the purpose behind the application of the soils data to the design of a grading
project is to make use of the better soils where they will do the most good, dispose of the poorer
soils where they will have the least detrimental effect upon the finished road and to blend non
uniform soils into a more uniform mass.
The effectiveness and success of that principle depends to a large extent upon the knowledge and
diligence of the inspector in seeing that the intent of the plans is carried out. To accomplish this
he must have and understand the project soils profile. The soils profile will show the original

154
ground line to which the soils borings will be referenced and the grading profile line to which the
project will be built. Normally soils will be removed (subcut) under all portions of the roadway
under construction so the structure will have a good foundation. The reasons for removals are as
follows:
Topsoil Removal:
To remove organic materials which are moisture susceptible and compressible.
Compaction Subcut:
In-place materials are acceptable for strength but may not have uniformity or adequate density.
Soils removed can be used on the project.
Subgrade Correction or Excavation:
The in-place soils are not acceptable because of a deficiency in engineering properties or because
the soils are non-uniform. Two methods of correction are possible, one is to remove the
unsuitable soils and replace them with suitable materials and second is to upgrade the inplace
soils by blending for more uniformity, reducing or increasing moisture contents to desired levels.
Granular materials are used to replace unsuitable soils in a non-granular soil grade when in
addition to unsuitable soils subgrade moisture problems also exist.
In design a uniform subcut depth should be maintained wherever possible. When subcut depths
have to be varied, 20 to 1 tapers should be provided at both ends. These tapers will allow for
relatively smooth transitions.
Soil borings are normally taken on 30 meter (100 feet) intervals and may be taken many years in
advance of construction. Therefore, soil conditions and water levels found during construction
may differ substantially over short areas from those shown on the profile.
For example, in grading through a cut section, it is entirely possible that pockets of detrimental
silty material may be encountered not shown on the soils profile. These pockets should be
removed during construction and the excavations filled with more suitable material. Poor soil
placed in the upper portion of the embankment may cause premature failure.
The grading inspector’s duty is to insure the actual construction meets the intent of the plan and
specifications. Therefore, if marked differences do occur, materials or construction limits can
and should be altered.

155
5-692.700 Formulas and Computations
5-692.702 Computing Stabilized Gravel Mixture
Table 28 Computing Stabilized Gravel Mixture
% Passing Sieve 1” 3/4” 3/8” No. 4 No. 10 No. 40 No. 200
Original Gravel 85 80 75 60 50 20 2
Screened Gravel
(Oversized Removed)
100 94 88 74 59 24 2.4
Oversize
Gravel Crushed
100 90 70 30 10 2 ---
Recombining:
85%
Screened Gravel
85 80 75 60 50 20 2
15%
Crushed Oversize
15 13 11 5 2 --- ---
Recombined Gravel 100 93 86 65 52 20 2
Binder Soil 100 100 100 100 100 80 50
Computation of Mixture:
90% Gravel 90 84 77 59 47 18 1.8
10% Binder Soil 10 10 10 10 10 8 5.0
Mixture 100 94 87 69 57 26 6.8
Allowable Spec. Range 100 90-100 50-90 35-80 20-65 10-35 3-10
5-692.703 Computation of Quantities for Base Construction
The total quantities of dry base required per mile of roadway may be calculated by multiplying
the cubic yards of compacted dry material required by the dry density (lbs/ft3) of the compacted
base.
Example:
Depth of base = 6 in.
Average width of base = 30 ft.
Dry density of compact base = 140 lbs/ft3
One sq. yd. of base one inch thick requires:
104 lbs/ft3 x 9 ft
2/yd
2 x ft/12 inches = 140 x 9/12 = 1,260/12 = 105 lbs/yd
2 per inch
5,280 ft/mile x 30 ft/1 x yd2/(3 ft)
2 = 5,280 x 30/(3 x 3) = 158,400/9 = 17,600 yd
2/mile

156
One mile of base 6 inches thick requires:
17,600 yd2/1 x 105 lbs/(yd
2 x inch) x 6 inch thick/1 x ton/2,000 lbs = 17,600 x 105 x 6/2,000 =
11,088,000/2,000 = 5,544 tons
To correct for moisture contained in the base multiple the weight of base by percent moisture and
add it to the weight of dry material required.
Example: % moisture of dry weight = 3.5%
Wt. of moist aggregate = 5,544 + (5,544 x 3.5)/100 = 5,738 tons
5-692.704 Determining Quantities (per mile) for Base Construction Ingredients
Assume 90% gravel and 10% binder soil.
1. Gravel
5,544 x 0.9 = 4,990 tons of dry gravel
Average moisture content of gravel from pits is approximately 3.5%.
Weight of moist gravel as taken from pit = 4,900 x 1.035 = 5,164 tons.
One cubic yard (yd3) of moist gravel loaded in truck may be assumed to contain 2,800 lbs. or 1.4
ton of dry gravel.
Volume of gravel = 4,990/1.4 = 3,564 yd3
2. Binder soil
5,544 x 0.10 = 554.4 tons of dry binder. To convert to cubic yards for volumetric measurement:
Average binder soil loaded in truck may be assumed to contain 1,900 lb. or 0.95 tons of dry
material in one cubic yard.
554.4/0.95 = 584 yd3
3. Find water for compaction (gallons).
Assume water weighs 8.3 lbs/gallon, mixture contains 4% water. Optimum moisture content for
mixture is 8%.
Required additional moisture is 4% (0.04).
One ton (2,000 lbs) of dry mixture requires:
(1 ton dry mix/1) x (2,000 lbs/ton) x 0.04 (weight of water)/(weight of dry mix) = 2,000 x 0.04 =
80 lbs water/ton dry mix
80 lbs water/ton dry mix x 1 gallon of water/8.3 lbs of water = 9.6 gallons water/ton dry mix
One mile requires:
9.6 gallons water/ton dry mix x 5,544 ton dry mix/mile = 9.6 x 5,544 = 53,222 gal water/mile
The designed gradation of the stabilized mixture is based upon the average gradation of gravel
and binder soil which are expected to be produced from the designated sources. If, when
production of material for construction has been started, it is found that the actual gradation of
gravel varies from that assumed in design, some adjustment of proportions may be necessary.

157
In making field adjustments of proportions, the following formula may be helpful:
A = (P-C)/(B-C) x 100%
Where: A = percent of binder soil in mix.
B = percent of binder soil which passes certain sieve size.
C = percent of gravel which passes certain sieve size.
P = desired percent of stabilized mixture passing certain sieve size.
Examples:
1. If, in the previous example of design of a stabilized mixture, it is desired to maintain 26%
passing the No. 40 sieve and the gravel has 22% passing the No. 40, the formula could be
applied as follows:
A = (26-22)/(80-22) x 100 = 4/58 x 100 = 0.0698 x 100 = 6.9%
Therefore: Only 6.9% of binder soil would have to be added.
2. This formula, expressed in a different form, may also be used to determine what variation in
gradation of gravel on a certain sieve size is allowable if the percentage of binder soil
remains constant. For this purpose the formula is expressed as follows:
C = ((100 x P) – (A x B))/(100 - A)
If the specifications require from 5% to 10% passing the No. 200 sieve for the stabilized
mixture and 10% of binder soil containing 50% passing the No. 200 sieve were specified,
then the maximum allowable percentage of gravel passing a No. 200 sieve could be
determined as follows:
C = ((100 x 10) – (10 x 50))/(100-10) = (1,000 - 500)/90 = 500/90 = 5.5%
Therefore:
5.5% passing the No. 200 sieve is the maximum allowable for the gravel material.
5-692.705 Procedures for “Rounding Off”
A. General
To "round off" a numerical value is to reduce the number of recorded figures to some
predetermined point by dropping figures or by increasing the value of certain figures. For
example, a computed, observed, or accumulated value such as 4,738,221 can be rounded off to
the nearest million (5,000,000); to the nearest hundred thousand (4,700,000); to the nearest ten
thousand (4,740,000); etc. Similarly, a value such as 47.382 can be rounded off to two decimal
places (47.38); to one decimal place (47.4); to the nearest whole number or units place (47); etc.
B. General Round Off Rules
1. When the figure next beyond the last figure or place to be retained is less than 5, the figure in
the last place retained is unchanged. (4,738,221 rounded off to the nearest hundred thousand
is 4,700,000 and 47.382 rounded to two decimal places is 47.38)
2. When the figure next beyond the last figure or place to be retained is greater than 5, the
figure in the last place retained is increased by 1 (4,738,221 rounded to the nearest million is
5,000,000 and 47.382 rounded to one decimal place is 47.4)

158
3. When the figure next beyond the last figure to be retained is 5 followed by any figures other
than zero(s), the figure in the last place retained is increased by 1 (4,500,001 rounded to the
nearest million is 5,000,000 and 4.6501 rounded to one decimal place is 4.7
4. When the figure next beyond the last figure to be retained is 5 followed by only zeros, the
figure in the last place to be retained is left unchanged if it is even (0,2,4,6 or 8) or is
increased by 1 if it is odd (1,3,5,7 or 9). When rounded to the nearest million 4,500,000 is
4,000,000; 5,500,000 is 6,000,000. When rounded to one decimal point 4.25 is 4.2; 4.15 is
4.2; 47.05 is 47.0 and 47.95 is 48.0.
5. Any number required to be rounded off shall be rounded off in one step, not by a series of
rounding operations. For example, 47.3499 rounded to one decimal place is 47.3 not 47.4,
which is the result if 47.3499 is rounded to 2 decimal places (47.35) and then rounded to 1
decimal place (47.4).
C. Application of Rounding Off Rules
1. Reading indications on graduated scales such as found on balances, gauges and dials.
a. When the indicator is between two graduations, read the value of the closest graduation.
b. When the indicator is midway between graduations, read the value of the “even”
graduation, (if the indicator is midway between 9.8 and 9.9 read 9.8; if the indicator is
midway between 9.9 and 10.0 read 10.0).
c. A special case exists when the graduations of all have even values. When the indicator is
midway between 2 “even” graduations, read the intermediate or “odd” value (if the
pointer on a Speedy moisture dial is midway between 10.6 and 10.8, read 10.7).
2. Rounding off to the nearest 50, 5, 0.5, 0.05, etc.
To round a number to the nearest 50, 5, 0.5, 0.05, etc. double the observed or calculated value,
round the product to the nearest 100, 10, 1.0, 0.10, etc. in accordance with the rules in part B
above and divide the rounded product by 2. (6025 rounded to the nearest 50 is 12,050 rounded
to the nearest 1000 which is 12,000 and 12,000 divided by 2 is 6,000.)
3. Rounding common fractions
When rounding common fractions, the rules are applied to the numerators of the fractions which
are reduced to a common denominator. The observed fraction is compared to the fraction
“rounded to” and the remainder is dropped if it is less than ½ of the fraction “rounded to” and
increased if it is more than ½ of the fraction “rounded to”; if the remainder is exactly ½ of the
fraction “rounded to” the odd even rules are used. Consider the following examples:
4. Rounding to the nearest eighth (4/32):
1 1/32 becomes 1 because 1/32 is less than ½ of 4/32 and is dropped.
1 2/32 becomes 1 because 2/32 is exactly ½ of 4/32, the 2/32 is dropped because the
numerator of the preceding eighth (0/8) is even.
1 3/32 becomes 1 4/32 or 1 1/8 because 3/32 is more than ½ of 4/32, therefore the
fraction is increased or “rounded up” to the next eighth.
1 5/32 becomes 1 4/32 or 1 1/8 because 5/32 is 1/32 more than 4/32, 1/32 is less than ½
of 4/32 and therefore is dropped.

159
1 6/32 becomes 1 2/8 or 1-1/4 because 6/32 is 2/32 more than 4/32 and the numerator of
the preceding eighth (1/8) is odd, therefore the fraction is increased to the next eighth.
1 7/32 becomes 1 2/8 or 1-1/4 because 7/32 is 3/32 more than 4/32 or an exact 1/8 and
3/32 is more than ½ of 4/32, therefore the fraction is increased to 2/8 or “rounded up”.
1 10/32 becomes 1 2/8 or 1-1/4 because 10/32 is 2/32 more than 8/32 or an exact 2/8,
2/32 is ½ of 4/32, the numerator of the preceding eighth (2/8) is even, therefore the 2/32
is dropped or "rounded down".
5-692.706 English-Metric Equivalent Gradation Sieve Sizes
English Metric
3-inch 75 mm
2-inch 50 mm
1-1/2-inch 37.5 mm
1-1/4-inch 31.5 mm
1-inch 25.0 mm
3/4-inch 19.0 mm
5/8-inch 16.0 mm
1/2-inch 12.5 mm
3/8-inch 9.5 mm
#4 4.75 mm
#8 2.38 mm
#10 2.00 mm
#16 1.19 mm
#20 850 μm
#30 600 μm
#40 425 μm
#50 300 μm
#80 180 μm
#100 150 μm
#200 75 μm