Embed Size (px)
Citation preview

Gradients and Active Contour Modelsfor Localization of Cell Membrane
in HER2/neu Images
Marek Wdowiak1(B), Tomasz Markiewicz1,2, Stanislaw Osowski1,3,Janusz Patera2, and Wojciech Kozlowski2
1 Warsaw University of Technology, 1 Politechniki Sq., 00-661 Warsaw, Poland{wdowiakm,markiewt,sto}@iem.pw.edu.pl
2 Military Institute of Medicine, 128 Szaserow Str., 04-141 Warsaw, Poland{jpatera,wkozlowski}@wim.mil.pl3 Military University of Technology,
2 Gen. S. Kaliskiego Str., 00-908 Warsaw, Poland
Abstract. The paper presents an application of the snake model torecognition of the cell membrane in the HER2 breast and kidney cancerimages. It applies the modified snake to build the system recognizing themembrane and associating it with the neighboring cell. We study differ-ent forms of gradient estimation, the core point in the snake model. Theparticle swarm optimization algorithm is used in tuning the parametersof the snake model. On the basis of the applied procedure the estimationof the membrane continuity of cell is made. The experimental results per-formed on 100 cells in breast and 100 cells in kidney cancers have shownhigh accuracy of the membrane localizations and acceptable agreementwith the expert estimations.
Keywords: Image segmentation · Object recognition · HER2/neu ·Snake
1 Introduction
Recognition of the whole cells on the basis of the staining localized in the mem-brane is a complex task, which requires not only segmentation of the specifiedparts of cell, but also assigning them to the individual cells. An example ofsuch task is in image analysis of the breast cancer created using histopathologyHuman Epidermal Growth Factor Receptor 2 (HER2/neu). The histopatholog-ical evaluation of a set of immunohistochemical stains is the most common taskfor pathologists.
The HER2/neu biomarker is recognized as a diagnostic, prognostic and pre-dictive factor mainly in the case of breast cancer [9], but recently also discussedin kidney cancer [6]. It is indicated as an aid in assessment of breast cancer forpatients for whom trastuzumab treatment is being considered. Overexpressions
c© Springer International Publishing Switzerland 2015G. Azzopardi and N. Petkov (Eds.): CAIP 2015, Part I, LNCS 9256, pp. 432–444, 2015.DOI: 10.1007/978-3-319-23192-1 36
Gradients and Active Contour Models for Localization of Cell Membrane 433
of HER2 protein connected with the HER2 gene amplification are diagnosedin approximately 20% of the analyzed breast cancer cases. For such patients,the trastuzumab treatment is recommended. Otherwise, HER2 is frequentlyexpressed in normal renal tissues but rarely expressed in renal cell carcinoma(RCC) tissues [6]. Furthermore, the HER2 status of normal tissue is negativelycorrelated with that of the RCC tissues and the TNM stages, suggesting thatHER2 is involved in RCC oncogenesis. Thus, an appropriate and reliable evalu-ation of HER2 status is necessary.
The HER2/neu stain is regarded as a basic step in pathomorphological eval-uation of the breast cancer. This semiquantitative examination, performed onthe immunestained paraffin section needs determining the presence, intensity,and continuity of membrane staining in the tumor cells. Four categories in gradescale are recognized: 0 (no membrane staining is observed or membrane stain-ing is observed in less than 10% of the tumor cells), 1+ (a barely perceptiblemembrane staining is detected in more than 10% of tumor cells, the cells exhibitincomplete membrane staining), 2+ (a weak to moderate complete membranestaining observed in more than 10% of tumor cells), and 3+ (a strong completemembrane staining observed in more than 10% of tumor cells). The case 0 or1+ indicates no HER2 gene amplification. On the other side grade 3+ indicatesimmediate HER2 gene amplification. The case 2+ needs additional examinationusing the fluorescence in situ hybridization (FISH) [9]. However, in kidney cancerthere are still not clear guidelines as to how to assess HER2 status. Neverthe-less, the main aspect of presented methodology is localizing and assigning theimmunoreactive membrane to the individual cell. Whereas a lot of algorithmsfor the nuclear reactions have been developed [3,7,8], the HER2/neu membranereaction is still treated manually or in a very rough way, not taking into accountthe separate cells.
In the last years some new approaches to solve this problem have been pro-posed. To such methods belong the application of the realtime quantitative poly-merase chain reaction (PCR) using LightCycler [10], application of support vec-tor machine [4], or fuzzy decision tree by using Mamdani and Takagi-Sugenoinference rules [13]. In spite of existing methods the new approaches are needed,because of the problems with high variability of a membrane reaction and itsfrequent overlapping with a cytoplasm. Such methods should deal with thesedifficult image analysis tasks in a more efficient way, providing higher agreementwith an expert assessment.
In this paper we propose solving the problem of recognizing and assigningthe membrane to the particular cell on the basis of the active contour models,called snakes, using different gradient estimations as the input attributes. Weinvestigate the locally adaptive gradient, depending on a special relation betweenthe cell nucleus and membrane. Our propositions are checked in the numericalexperiments concerning two studied cases: the breast cancer and kidney cancer.
434 M. Wdowiak et al.
2 Problem Statement
An automatic evaluation of the HER2/neu membrane staining aims at the recog-nition of tumor cell nuclei and area of positive membrane reaction. It shouldspecify which parts of the recognized membrane come from the specific cells andfinally graduate the reaction from 0 to 3+ scale. Each of these steps requiresdifferent algorithms based on various criteria. The cell nuclei detection can beperformed as a task of segmentation of the blue, rounded and generally non-touching objects. The solution of this problem was proposed by us in [15].
The main problem is a weak staining of the nuclei by the blue hematoxyline.The additional problem is their partial overlapping with the brown chromogenicsubstrate. The important task in this evaluation is recognition of areas with apositive membrane reaction, especially when the brown chromogenic substrate islocated not only in the cell membranes, but also partially in the cell cytoplasm.In such case there is an identification problem of the appropriate membranesections located inside the brown marked regions. Although this problem wassolved by us in [15] using the hourglass shape structuring element combined withwatershed algorithm there is still the problem of association of the discoveredmembrane segments with the proper cell, especially when the segment is touchingfew cells. In this paper we will solve this problem by applying the snake modelof membrane [16]. On the basis of the snake results we are able to assign themembrane to the proper cell and then parametrize the localized membrane.The most important is the estimation of the continuity of the cell membrane.The continuity is defined here as the ratio of the summed lengths of membranesegments to the total length of membrane defined by the snake model.
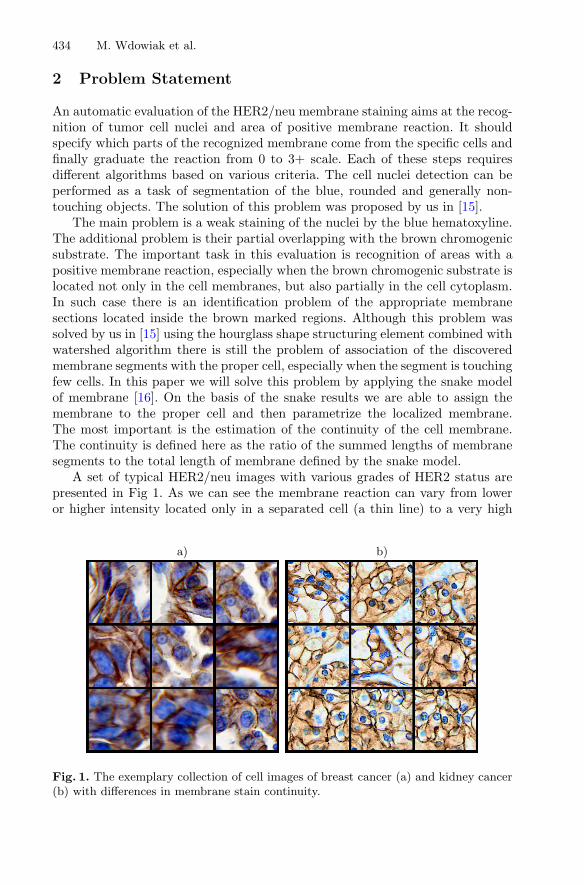
A set of typical HER2/neu images with various grades of HER2 status arepresented in Fig 1. As we can see the membrane reaction can vary from loweror higher intensity located only in a separated cell (a thin line) to a very high
a) b)
Fig. 1. The exemplary collection of cell images of breast cancer (a) and kidney cancer(b) with differences in membrane stain continuity.

Gradients and Active Contour Models for Localization of Cell Membrane 435
intensity of the membrane location surrounded by the slightly colored cytoplasmof few touching cells. The aim of the presented study is to design method that willbe able to identify any membrane positive reaction, irrespective of their intensity,different localization and character of the brown chromogenic substrate.
3 Material and Methods
The materials used in experiments come from the archive of the Pathomorphol-ogy Department in the Military Institute of Medicine in Warsaw, Poland. 125cells of the breast and kidney cancers represented by HER2/neu preparationswithout any artefacts representing 1+, 2+, and 3+ grades were selected. In thecase of breast cancer the analyzed data were represented by 27 cells of grade1+, 46 cells of 2+ and 52 grades of grade 3+. The kidney cancer data wererepresented by 26 cells of grade 1+, 45 cells of 2+ and 54 grades of grade 3+.The paraffin embedded tissues were stained in a standard way according to theVentana PATHWAY anti-HER-2/neu (4B5) Rabbit Monoclonal Primary Anti-body protocol [1]. The specimen images were registered on the Olympus BX-61microscope with the DP-72 colour camera under the magnification 400x andresolution 1024x768 pixels. Cells was divided in to sets: testing set with 100 cellsand learning sets with 25 cells.
The quantitative analysis of the specimen needs the following steps of imageprocessing: a) recognition of the tumor cell nuclei, b) segmentation of theimmunereactive cell membranes, c) the assignment of the membrane segmentsto the individual cell. While the first two steps can be implemented using theset of advanced mathematical morphology transformations [11,12], the last oneis very complicated due to frequent discontinuities in the membrane reaction,high variability of the cell shapes and different localizations of the cell nuclei.The classical watershed method for the individual cell separation is insufficient,as we demonstrate later.
To solve the problem, we propose to apply the snake active contour method,starting from each nucleus outline. We proceed from the nucleus to the cellcontour, which is recognized on the basis of the immunoreactive membrane seg-ments. To implement this procedure we have to select or create the most usefulinput image map on the basis of which we can build the gradient image, andselect the most adequate parameters in the snake adaptation process. The rec-ognized snake will represent the membrane associated with the particular cell.In the next parts of this section we introduce and compare two types of inputimage maps, four types of gradient and Particle Swarm Optimization method[5] for an efficient snakes parameters selection.
3.1 Input Image Map
The input map representation of the original image is crucial for a convergence ofany method to an expected solution. Such map should contain the most impor-tant information about direction and distance of any pixel in the area under

436 M. Wdowiak et al.
interest to the cell membrane. Common approach includes the selection of colorcomponents, which allow to differentiate such area in the best way. The imagemap formed on the basis of these colors is subject to further analysis.
We have taken into account the following color representations: RGB,CMYK, HSV, YCbCr, CIE Lab, CIE Lch, CIE uvL, CIE XYZ [2]. The abilityof different pixel intensity representations to recognize the cell membranes wasevaluated comparing the area (AUC) under Receiver Operating Characteristics(ROC) curve [14]. After evaluating the ability of various color space componentsto differentiate the immunoreactive cell membrane from nonreactive componentswe found that B channel (inverted) from RBG and Y channel from CMYK rep-resentation are the most useful. The input intensity map used in further analysisis created as an element-wise product of these two components.
The alternative image map can be created based on local properties of theimage. Analyzing many images we have noticed that local entropy of the imagereflects very well the direction and distance of any pixel to the immunoreactivemembrane. These areas of the membrane regions are characterized by a higherentropy than the other tissue regions. Based on this observation we have calcu-lated the local entropy for each pixel of the image in the neighborhood size of5×5 pixels. It was calculated for the product of B channel (inverted) of RBGrepresentation and Y channel of CMYK. In medical practice the images are oftenblurred to same degree, so the blurred image map will be also investigated inour numerical experiments.
3.2 Types of Gradient
Based on the input map, the discrete gradient arrays have to be calculated in hor-izontal and vertical directions to implement effectively the snake active contouralgorithm [16]. In this paper we study and compare four cases: 1) directionalgradient, 2) gradient vector flow (GVF) [16], 3) directional gradient radiallyoriented to nuclei, and 4) GVF radially oriented to nuclei. The last two modifi-cations of gradient are proposed by us and combined with an isotropic repulsionof the contour from the nuclei in direction to the immunoreactive cell membrane.
Horizontal and Vertical Directional Gradient. The directional gradient ofthe gray scale image I for any pixel is calculated in both directions (horizontaland vertical) and is defined as a difference between the intensity values of theneighboring pixels in both directions, respectively. If the horizontal and verticalpositions of pixel are indexed by i and j, respectively, the directional gradientvalues are defined by
ρx(i, j) = (Ii,j+1 − Ii,j−1)/2,ρy(i, j) = (Ii+1,j − Ii−1,j)/2 (1)
They are compatible with the definition of the central finite difference. Theirpractical implementation is done using the dilation and erosion of the image by
Gradients and Active Contour Models for Localization of Cell Membrane 437
a structuring element in the form of a horizontal or vertical line segment L. Inthis way
ρα(i, j) = (δLα− εLα
)/2 (2)
where the symbols δ and ε represent the dilation and erosion [12], respectively,and α denotes the horizontal or vertical direction. Although different spacing ofthe bordering pixels can be used in selection of the length L, the value one wasapplied in experiments.
Gradient Vector Flow. The modulus of the directional gradient in imageprocessing is highly dependent on the distance of pixel to the immunoreactive cellmembrane. However, the input image map has nonzero elements mainly in theregions of the immunoreaction, because the cytoplasms area is almost deprivedof stain. This leads to the gradient map values close to zero. Additionally, somedeformations of cells in the form of boundary concavities are also observed,especially when the initial location of the nucleus in the kidney cancer cells isfar from the center. This fact reduces significantly the convergence of the activecontour to the cell membrane, leading in some cases to the wrong results.
For this reason, the gradient vector flow (GVF) proposed by [16], was takeninto account in our investigations. The main advantages of the GVF are itsinsensitivity to initialization and ability of process to move into the concaveboundary regions. The GVF offers higher convergence of the snake model due tobetter orientation of the gradient vectors with respect to edges and also largerarea of attraction. Denoting by ρx(i, j) and ρy(i, j) the directional gradients ofedge map in the point (i, j) of the image, un
i,j and vni,j the GVF components of
this point in nth iteration, the iterative solution of GVF can be written in theform of difference equations [16]:
un+1i,j = un
i,j + Δt[μ∇2uni,j − (ρ2x(i, j) + ρ2y(i, j))(un
i,j − ρx(i, j))],vn+1
i,j = vni,j + Δt[μ∇2vn
i,j − (ρ2x(i, j) + ρ2y(i, j))(vni,j − ρy(i, j))]
(3)
In these expressions ∇2 is the Laplacian operator and μ a regularization param-eter. After some iterations this process leads to the proper values of GVF com-ponents.
Gradient Radially Oriented to Nuclei. The direction of the mentionedabove gradient formulas is related to the local maxima of the snake model.Unfortunately, the experiments have shown, that in not all cases such directionis able to find the cell membrane. The cell nuclei in kidney cancer are frequentlylocated in an acentric position. In this case gradient points to nearest edge, allpoints belonging to initial contour are attracted to that edge and this leads to thewrong results of localisation of the membrane segments(only one edge detected).To solve this problem we propose here the radially oriented gradient direction,which takes into account the pixel orientation toward cell nucleus. The horizontalρR,X and vertical ρR,Y components of radially oriented gradient vector for the
438 M. Wdowiak et al.
pixel in the position (i, j) are described as follows
ρR,X =√
ρ2X + ρ2Y · cos[φi0,j0(i, j)],ρR,Y =
√ρ2X + ρ2Y · sin[φi0,j0(i, j)],
(4)
The symbol “·” denotes the point-wise multiplication of two images, φi0,j0(i, j)the angle direction between the pixel position (i, j) and the central point (i0, j0)of the nucleus. In these expressions the orientation of the vector ρ toward thenucleus of the cell is important. The same modification of the gradient directioncan be applied to the GVF.
After applying this approach to either classical directional gradient or GVFwe achieve two important features of the algorithm: enhancement of the infor-mation of the gradient in the edge map and the direction of the gradient orientedradially to the nuclei.
Parametric Snake Model. Snakes, or active contours, are curves definedwithin an image that can move under the influence of internal forces within thecurve itself and external forces derived from the image data [16]. The internaland external forces are defined so that the snake will conform the desired objectboundary
The internal forces coming from within the curve itself control its tensionand rigidity, whereas the external forces make it fit to objects. The snake curverepresented in the form of vector x(s) = [x(s), y(s)] for the parameter s ∈ [0, 1]is created by minimizing the energy functional in the spatial domain of an image
minE =∫ 1
012 [α |x′(s)|2] + Eext(x(s))ds (5)
where α and β are weighting parameters that control the snakes tension andrigidity, respectively. The first and second derivatives of snake are defined withrespect to the parameter s. The external energy function Eext (associated some-times with the GVF) is taken from the input image map. In the latter case weuse directly any representation of gradient map introduced above.
Particle Swarm Optimization. The proposed model of snakes requires select-ing the set of seven parameters. They include a and from equation (5), the vis-cosity parameter, the weights of internal and external energy in the functional,and parameters corresponded with initial contours(circle) such as the radius anddistance between the subsequent points that form the snakes curve [16]. Findingbest solution in seven dimension space is complex task, thus optimization pro-cess is necessary. We have solved this optimization problem using the ParticleSwarm Optimization (PSO) method.
PSO, originally attributed to Kennedy, Eberhart and Shi [5] and inspired bysocial behavior of bird flocking or fish schooling, is a computational method ofoptimization which applies the population (called a swarm) of candidate solu-tions (called particles). The particles keep track of their coordinates and alsothe coordinates of the entire swarm in the space. The movements of particles are

Gradients and Active Contour Models for Localization of Cell Membrane 439
guided by their own best known position in the searchspace, taking into accountthe entire swarm’s best known position. The particle swarm optimizer tracksthe best value of the objective function, obtained so far by any particle in theneighborhood of it. When better positions are being discovered they will guidethe movements of the entire swarm. The process is repeated and a satisfactorysolution will eventually be discovered, although there is no guarantee of findingthe global optimal solution.
PSO shares many similarities with evolutionary computation techniques. Thesystem uses a population of random solutions and searches for optima by updat-ing generations. However, unlike evolutionary algorithms, PSO has no evolutionoperators such as crossover and mutation. In PSO, the particles fly through theproblem space by following the current optimum particles. The advantages ofPSO over evolutionary algorithm are that PSO is easier to implement and thereare only few parameters to adjust. Similarly to evolutionary algorithms PSOdoes not require that the optimization problem be differentiable, as is requiredby classic optimization methods such as gradient descent or quasi-Newton meth-ods. PSO can therefore be applicable to optimization problems that are partiallyirregular, noisy, change over time, etc.
Final Membrane Localization System. The complete scheme of the finalmembrane localization system applied by us is presented in Fig. 2. It is composedof two main parts: 1) recognition of membrane using the snake and identificationof membrane parts by applying segmentation of the high intensity immunoreac-tive areas and 2) localization of the nucleus in the cell. Both streams are coop-erating together in assigning the recognized membrane to the particular cell andassessing the continuity of the membrane. This work is concerned mainly withthe first task of application of snake to the membrane localization and associationwith the proper cell.
Fig. 2. The general scheme of image processing leading to the evaluation of the mem-brane parameters

440 M. Wdowiak et al.
4 Results
Aim of our work was to creating algorithm that estimates membrane continuityin the same way as an expert. To verify our approach the numerical experimentshave been performed on two sets of data. The first one referred to the breastcancer and the second to the kidney cancer. Both cases required similar opera-tions, described in the previous sections. The experiments have been performedusing 100(testing set) cells representing the breast and kidney sets. The resultswill be presented in the numerical and graphical forms. We compare the statis-tical results of our automatic system (AS) to the results of an expert. The mainpoints of comparison are the estimation of continuity of the identified membraneby AS and by an expert and also the Hausdorff distance. The Hausdorff distancerepresents the longest of all the distances from a point in one set to the closestpoint in the other set.
Table 1. The numerical results of membrane continuity estimation in breast cancermade by an expert and the automatic system
Algorithm Hausdorfdistance
MembranecontinuityExpert
MembranecontinuityAS
Absolutedifference
Standarddeviation
Accuracyof assign-ing mem-brane to acell
CM pl CDG CG 20.90 0.71 0.59 0.14 0.11 100%CM pl CDG RO 20.63 0.71 0.59 0.13 0.11 100%CM pl GVF CG 22.64 0.71 0.72 0.09 0.11 97%CM pl GVF RO 17.95 0.71 0.70 0.08 0.09 98%CM bl CDG CG 22.26 0.71 0.61 0.13 0.12 100%CM bl CDG RO 21.85 0.71 0.59 0.14 0.11 100%CM bl GVF CG 22.00 0.71 0.73 0.10 0.10 98%CM bl GVF RO 19.85 0.71 0.74 0.11 0.16 92%EN pl CDG CG 23.81 0.71 0.43 0.28 0.15 100%EN pl CDG RO 24.60 0.71 0.44 0.27 0.14 100%EN pl GVF CG 22.56 0.71 0.68 0.09 0.08 100%EN pl GVF RO 18.14 0.71 0.71 0.08 0.08 98%EN bl CDG CG 23.21 0.71 0.52 0.20 0.14 100%EN bl CDG RO 22.93 0.71 0.55 0.17 0.14 100%EN bl GVF CG 19.10 0.71 0.74 0.09 0.10 96%EN bl GVF RO 18.48 0.71 0.73 0.09 0.12 98%Direct watershed 17.31 0.71 0.73 0.10 0.07 64%
Table 1 depicts the numerical results of experiments concerning breast cancer.They are given in the form of mean values of Hausdorff distance measure (in pix-els) and membrane continuity, estimated for the set of 100 breast cancer cells atapplication of different versions of the algorithms. The Hausdorff distance depictsthe highest distance between the membrane discovered by snake and membrane
Gradients and Active Contour Models for Localization of Cell Membrane 441
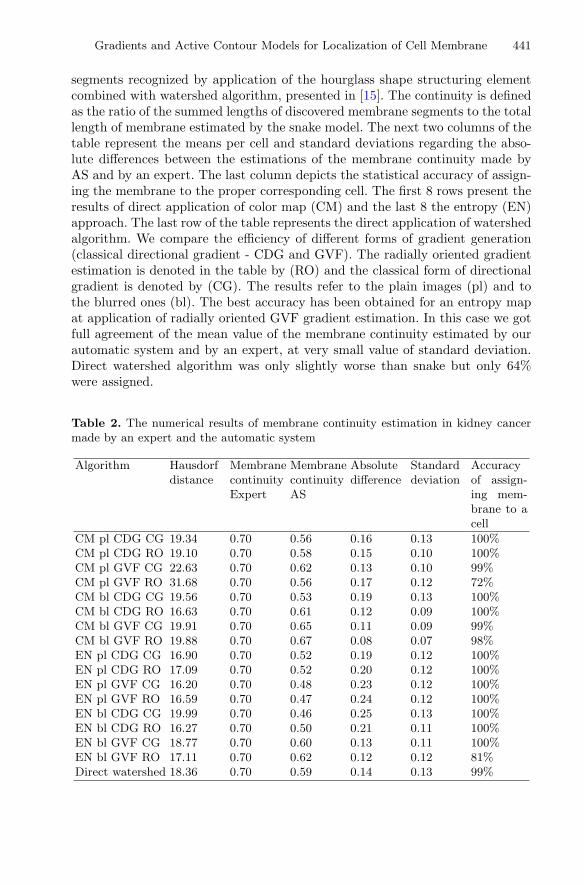
segments recognized by application of the hourglass shape structuring elementcombined with watershed algorithm, presented in [15]. The continuity is definedas the ratio of the summed lengths of discovered membrane segments to the totallength of membrane estimated by the snake model. The next two columns of thetable represent the means per cell and standard deviations regarding the abso-lute differences between the estimations of the membrane continuity made byAS and by an expert. The last column depicts the statistical accuracy of assign-ing the membrane to the proper corresponding cell. The first 8 rows present theresults of direct application of color map (CM) and the last 8 the entropy (EN)approach. The last row of the table represents the direct application of watershedalgorithm. We compare the efficiency of different forms of gradient generation(classical directional gradient - CDG and GVF). The radially oriented gradientestimation is denoted in the table by (RO) and the classical form of directionalgradient is denoted by (CG). The results refer to the plain images (pl) and tothe blurred ones (bl). The best accuracy has been obtained for an entropy mapat application of radially oriented GVF gradient estimation. In this case we gotfull agreement of the mean value of the membrane continuity estimated by ourautomatic system and by an expert, at very small value of standard deviation.Direct watershed algorithm was only slightly worse than snake but only 64%were assigned.
Table 2. The numerical results of membrane continuity estimation in kidney cancermade by an expert and the automatic system
Algorithm Hausdorfdistance
MembranecontinuityExpert
MembranecontinuityAS
Absolutedifference
Standarddeviation
Accuracyof assign-ing mem-brane to acell
CM pl CDG CG 19.34 0.70 0.56 0.16 0.13 100%CM pl CDG RO 19.10 0.70 0.58 0.15 0.10 100%CM pl GVF CG 22.63 0.70 0.62 0.13 0.10 99%CM pl GVF RO 31.68 0.70 0.56 0.17 0.12 72%CM bl CDG CG 19.56 0.70 0.53 0.19 0.13 100%CM bl CDG RO 16.63 0.70 0.61 0.12 0.09 100%CM bl GVF CG 19.91 0.70 0.65 0.11 0.09 99%CM bl GVF RO 19.88 0.70 0.67 0.08 0.07 98%EN pl CDG CG 16.90 0.70 0.52 0.19 0.12 100%EN pl CDG RO 17.09 0.70 0.52 0.20 0.12 100%EN pl GVF CG 16.20 0.70 0.48 0.23 0.12 100%EN pl GVF RO 16.59 0.70 0.47 0.24 0.12 100%EN bl CDG CG 19.99 0.70 0.46 0.25 0.13 100%EN bl CDG RO 16.27 0.70 0.50 0.21 0.11 100%EN bl GVF CG 18.77 0.70 0.60 0.13 0.11 100%EN bl GVF RO 17.11 0.70 0.62 0.12 0.12 81%Direct watershed 18.36 0.70 0.59 0.14 0.13 99%

442 M. Wdowiak et al.
a) b)
Fig. 3. The illustrative results of membrane localization in the cell images of breastcancer (a) and kidney cancer (b). The images correspond to these in Fig.1.
Table 2 presents the results concerning kidney cancer at different variantsof the snake algorithm and image representation. The highest agreement of themembrane continuity (0.67 of AS against 0.70 in expert estimation) has beenachieved in colour map representation of the image and radially oriented GVFgradient estimation. This time the direct application of watershed was highlyinefficient (membrane continuity estimation 0.59 against the value 0.70 of anexpert).
The results of image analysis are also presented in the graphical form. Fig. 3depicts the results of membrane localizations for 9 chosen cells. They have beenmade by using the best snake algorithm (denoted by red color) and the expertestimation (green color) and refer to the original images of cells illustrated inFig. 1. High similarity of the results of membrane localizations obtained by oursystem and expert is visible in the most cases.
5 Conclusion
The paper has presented the modified snake approach to the automatic recogni-tion of the HER2/neu cell membrane and its association with the neighbouringcell. The main effort has been directed toward assigning the snake model of themembrane with the proper cell of the image. The work has been concentratedon comparing different methods of gradient generation and application of swarmoptimization in solving the snake model in the breast and kidney cancer samples.The recognized membrane shape has enabled proposing an automatic method ofthe membrane continuity estimation, an important factor in the pathomorpho-logical evaluation of breast and kidney cancers.
The experimental results have shown high efficiency of this approach to theimage segmentation in the membrane localization task. The best radially ori-ented GVF method applied in snake model was able to generate statistical results
Gradients and Active Contour Models for Localization of Cell Membrane 443
concerning the continuity of membrane with excellent mean value agreement tothe expert results and of the smallest standard deviation.
It should be noted, that our computerized system is fully automatic. Hencethe recognition of the nuclei and membrane associated with the cell is doneaccording to an automatic procedure defined within the algorithm. On the otherhand the human expert selects the nuclei and membrane according to his profes-sional knowledge, blind to the selection results of an automatic system. Thisis the reason of slight differences between the recognized membrane shapesobserved in the segmentation results.
Acknowledgments. This work has been supported by the National Centre forResearch and Development (PBS2/A9/21/2013 grant), Poland.
References
1. PATHWAY HER-2/neu (4B5) – user manual. Ventana Medical Systems, Tucson(2009)
2. Matlab Image Processing Toolbox: users guide. MathWorks, Natick (2012)3. Grala, B., Markiewicz, T., Kozlowski, W., Osowski, S., Slodkowska, J., Papierz,
W.: New automated image analysis method for the assessment of ki-67 labelingindex in meningiomas. Folia Histo. Cyto. 47(4), 587–592 (2009)
4. Kasson, P., Huppa, J., Davis, M., Brunger, A.: A hybrid machine-learningap-proach for segmentation of protein localization data. Bioinformatics 2(19),3778–3786 (2005)
5. Kennedy, J., Eberhart, R.: Swarm Intelligence. Morgan Kaufmann, San Francisco(2001)
6. Latif, Z., Watters, A., Bartlet, J., Underwood, M., Aichison, M.: Gene amplificationand overexpression of her2 in renal cell carcinoma. BJU Intern. 89, 5–9 (2002)
7. Les, T., Markiewicz, T., Osowski, S., Cichowicz, M., Kozlowski, W.: Automaticevaluation system of FISH images in breast cancer. In: Elmoataz, A., Lezoray,O., Nouboud, F., Mammass, D. (eds.) ICISP 2014. LNCS, vol. 8509, pp. 332–339.Springer, Heidelberg (2014)
8. Lezoray, O., Elmoataz, A., Cardot, H., Gougeon, G., Lecluse, M., Elie, H., Revenu,M.: Segmentation of colour images from serous cytology for automated cell classi-fication. Anal. Quant. Cytol. Histol. 22, 311–322 (2000)
9. Littlejohns, P.: Trastuzumab for early breast cancer: evolution or revolution?Lancet Oncology 7(1), 22–33 (2006)
10. Logan, J., Edwards, K., Saunders, N.: Real-Time PCR: Current Technology andApplications. Caister Academic Press, Norfolk (2009)
11. Naegel, B., Passat, N., Ronse, C.: Grey-level hit-or-miss transforms part i:unifiedtheory. Pattern Recogn. 40, 635–647 (2007)
12. Soille, P.: Morphological Image Analysis, Principles and Applications, 2nd edn.Springer, Berlin (2003)
13. Tabakov, M., Kozak, P.: Segmentation of histopathology her2/neu images withfuzzy decision tree and takagi-sugeno reasoning. Comput. Biol. Med. 49, 19–29(2014)

444 M. Wdowiak et al.
14. Tan, P., Steinbach, M., Kumar, V.: Introduction to data mining. Pearson EducationInc., Boston (2006)
15. Wdowiak, M., Markiewicz, T., Osowski, S., Swiderska, Z., Patera, J., Kozlowski,W.: Hourglass shapes in rank grey-level hit-or-miss transform for membrane seg-mentation in HER2/neu images. In: Benediktsson, J.A., Chanussot, J., Najman,L., Talbot, H. (eds.) Mathematical Morphology and Its Applications to Signal andImage Processing. LNCS, vol. 9082, pp. 3–14. Springer, Heidelberg (2015)
16. Xu, C., Prince, J.: Snakes, shapes, and gradient vector flow. IEEE Trans. ImageProcessing 7(3), 359–369 (1998)