Embed Size (px)
Citation preview

Grade 8 At-‐a-‐Glance Last Updated: December 1, 2015
Expanding the Depth and Breadth of Climate Change Common Knowledge: Using Research Gardens as a Common Thread
1
Grade 8: Connecting Research to Outcomes in a Changing Climate
Stage 1 – Desired Results
Outcomes and Indicators:
Continue the study of plant phenology (initiated during grades 6 and 7) by continuing with and augmenting the previous years’ research project.
Explore the variety of microclimates on the school campus by investigating temperature, relative humidity, and light availability across the campus.
Test potential plant habitats using the microclimates identified on the school campus by growing native seeds and examining germination and growth measures.
Understand the importance of research in helping find solutions to future impacts of climate change by interacting with a SEGA researcher from NAU/The Arboretum and designing a SEGA experiment.
Identify how changes in the timing of plant phenology can impact animal populations by analyzing historical data of the pied flycatcher and by making inferences based upon that data.
Explore actions humans can take to minimize their impact on climate change by reviewing a list of steps provided by The Arboretum and by understanding the implications of each step.
Assist The Arboretum at Flagstaff by designing interpretive signs for SEGA research projects or the phenology project to be used for public education.
Understandings: Students will understand that . . .
Scientific research is a complex process that requires careful attention to detail, proven research methodology, and accuracy in collection of data.
Plants and animals adapt to life within an ecosystem but some may not be able to adapt if the environment or climate changes too rapidly.
When studying an issue, scientists interpret data and evaluate evidence using the skills of observation, questioning, inferring, and communicating.
Humans can minimize their carbon footprint through conscious decisions.
Essential Questions: Students will ask such questions as…
How do scientists conduct their research? How do we know their results and conclusions are valid?
What happens to organisms living within a specific ecosystem if that ecosystem changes in response to a changing climate?
What does a scientist do?
How can humans mitigate their carbon footprints?
Knowledge: Skills:
Grade 8 At-‐a-‐Glance Last Updated: December 1, 2015
Expanding the Depth and Breadth of Climate Change Common Knowledge: Using Research Gardens as a Common Thread
2
Students will know . . .
Scientific research is a long-‐term process that requires carefully honed skills.
Plant and animal species generally require many generations to evolve. Individuals may or may not be able to adapt to new and changing environmental conditions.
Scientists must carefully examine their data to ensure reliability and accuracy when investigating an issue or testing a hypothesis.
SEGA is a long-‐term ecological research instrument that can help scientists better understand how plants will respond to a changing climate.
Communicating the results of an investigation is of primary importance to the scientific community.
Students will be able to . . .
Observe and record the phenology of a plant or plants within the Flagstaff area
Examine microclimates on the school campus
Develop questions to guide their research
Organize data into logical tables, columns, charts, graphs, or other visual displays
Identify variables that may impact the timing of a plant’s phenology
Make inferences about how a changing climate in Flagstaff might affect plants or other organisms that depend upon those plants
Hold informed discussions on what it means to mitigate for climate change impacts
Key Vocabulary:
Note for teachers: it will be important that students review vocabulary introduced during grades 6 and 7:
Albedo Effect – Annual – Atmosphere -‐ Biennial -‐ Carbon cycle -‐ Climate – Dendrochronology -‐ Elevation – Greenhouse Effect – Greenhouse Gas – Habitat –Hydrosphere -‐ Lithosphere -‐ Meteorology -‐ Native plant -‐ Perennial -‐ Phenology -‐ Precipitation -‐ Protocol -‐ Qualitative data -‐ Quantitative data – Urban heat island -‐ Weather
Vocabulary for grade 8:
Carbon footprint -‐ A carbon footprint is the measure of the environmental impact of a particular individual or organization's lifestyle or operation, typically measured in units of carbon dioxide (and other greenhouse gases) emitted per year Citizen Science -‐ is a strategy used by scientists to help augment their body of data and evidence through the training and networking of volunteers who use tested protocols for assisting in a scientific data collection Hygrometer – a device for measuring humidity Microclimate -‐ the climate of a very small or restricted area, especially when this differs from the climate of the surrounding area Migration – movement from one place to another (usually to find the best food supply and not to avoid changes in temperature) NDVI (Normalized Difference Vegetation Index) – a measurement of how much photosynthesis is occurring at the Earth’s surface

Grade 8 At-‐a-‐Glance Last Updated: December 1, 2015
Expanding the Depth and Breadth of Climate Change Common Knowledge: Using Research Gardens as a Common Thread
3
Photometer – a device for measuring light availability Relative humidity -‐ the amount of water vapor present in air expressed as a percentage of the amount needed for saturation at the same temperature Variable – something that can vary or change
Stage 2 – Assessment Evidence
Performance Tasks:
The following are continuing from grades 6 and 7:
Student log/journals/graphs kept up to date with accurate data, organized so the student may readily extract information
Established protocols used consistently for gathering and recording data and evidence
Frequent data collection indicated within journal/log
Completion of required elements in the ongoing phenology study (data and evidence in journals).
Additional for grade 8:
Collect, analyze, and chart data from a school campus investigation
Design an interpretive sign for a SEGA research project or the phenology project.
Other Evidence:
On task with questions
Demonstrates enthusiasm for learning
Individual motivation and group cooperation
Active participation in all class activities
Contributes to class discussions individually and as part of a small group
Stage 3 – Action Plan
Learning Activities:
NOTE: Students will continue the long-‐term phenology project launched in grade 6 and continued in grade 7. Project may expand to include additional species, depending upon the enthusiasm and self-‐direction of students.
Engage Guiding question: “How much do microclimates vary across my school campus?”
Students explore microclimates for plant growth within their school campus by mapping and documenting temperature, relative humidity and light availability across their campus.
Extension: Add instruments like an anemometer (wind speed), soil probes (pH, soil moisture) or data loggers to more deeply explore differences in microclimate.
Explore Guiding question: “What microclimate provides the best growing conditions for plants?”
Students analyze their microclimate data and test sites by germinating and growing native seeds.

Grade 8 At-‐a-‐Glance Last Updated: December 1, 2015
Expanding the Depth and Breadth of Climate Change Common Knowledge: Using Research Gardens as a Common Thread
4
Explain Guiding question: “What is SEGA and how is it being used to study climate change?”
Students identify the role of the SEGA Project to the ecological future of northern Arizona and compare their own research with that of the scientists.
Extension: Plan a field trip to The Arboretum to see the SEGA gardens and research projects, the state-‐of-‐the-‐art weather station, the I-‐STEM Learning Center and Climate Change Exhibit.
Elaborate Guiding question: “Right place, wrong time…or right time, wrong place?”
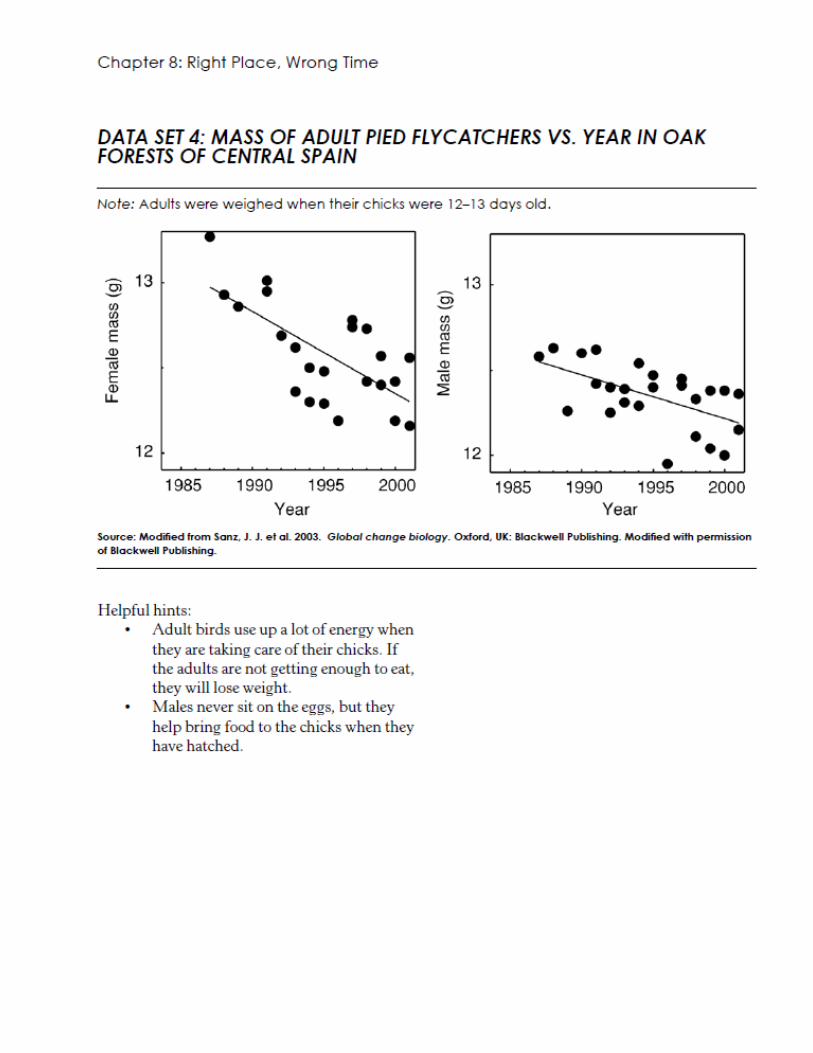
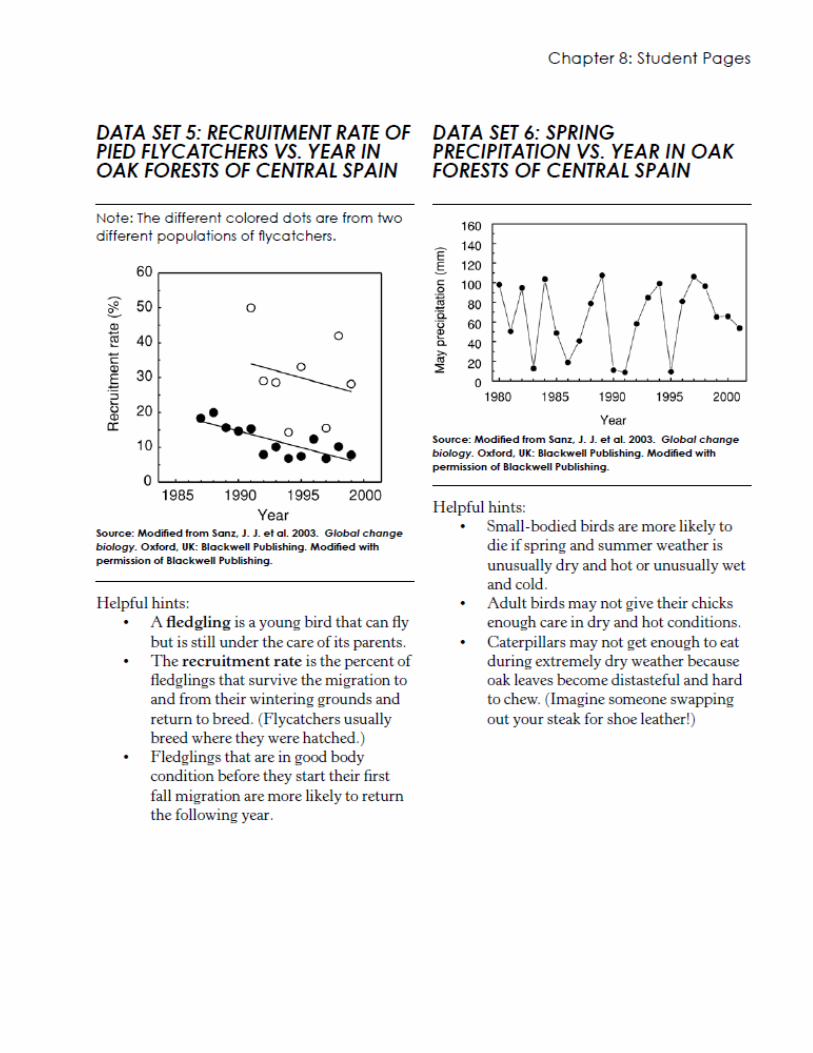
Students contemplate the ecological and phenological connections between oak leaves, caterpillars, and Pied flycatchers in Spain. (Ch. 8 Right Place, Wrong Time in Climate Change from Pole To Pole – NSTA)
Evaluate Guiding question: “What can we do to help our native plants survive long-‐term changes in climate?”
Students create interpretive signage for a SEGA research project or the phenology project.
Grade 8 Overview Last Updated: December 1, 2014
Expanding the Depth and Breadth of Climate Change Common Knowledge: Using Research Gardens as a Common Thread 1
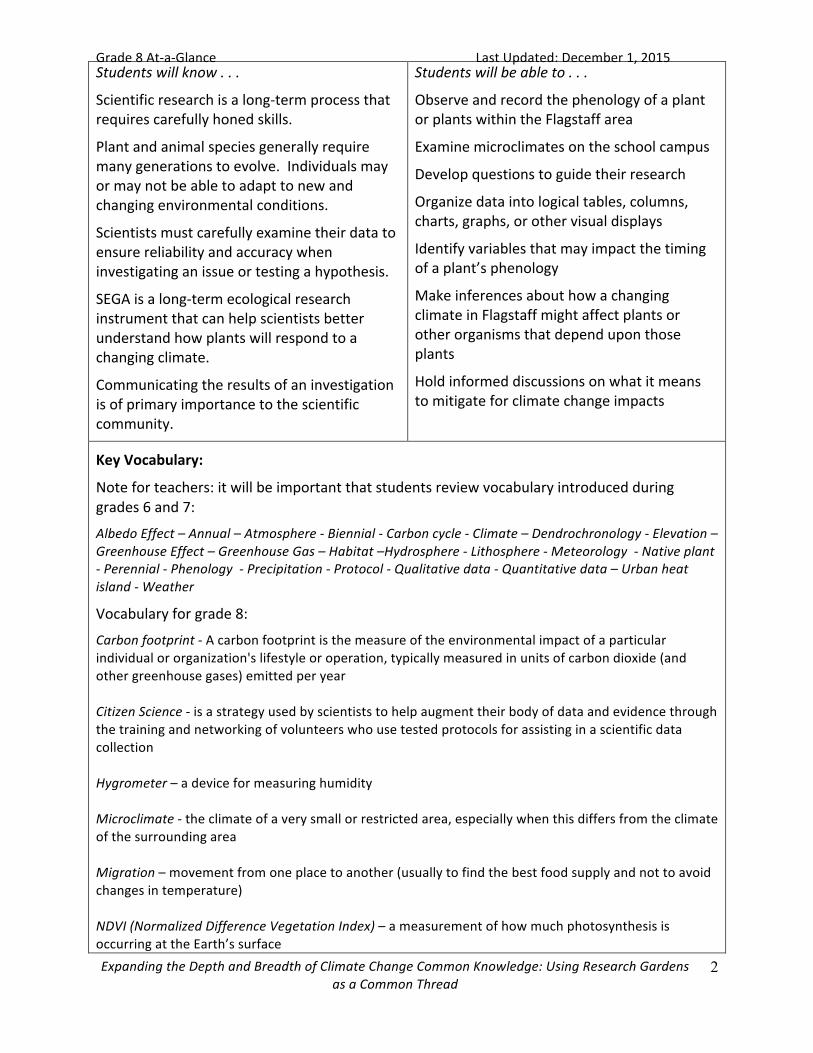
Connecting Research to Outcomes in a Changing Climate Grade 8: Arizona Academic Standards, Framework for K-‐12 Science Education, and Climate Literacy Principles
Framework for K-‐12 Science Education
Arizona Academic Standards Climate Literacy: The Essential Principles of Climate Science
Scientific and Engineering Practices 1. Asking questions (for science) and
defining problems (for engineering) 3. Planning and carrying out
investigations 4. Analyzing and interpreting data 5. Using mathematics and
computational thinking 6. Constructing explanations and
designing solutions 7. Engaging in argument from
evidence 8. Obtaining, evaluating, and
communicating information
Crosscutting Concepts 2. Cause and effect: mechanism and
explanations 4. Systems and system models 5. Energy and matter: Flows, cycles,
and conservation 6. Structure and function 7. Stability and change
Disciplinary Core Ideas Life Sciences LS2.A: Interdependent Relationships
in Ecosystems LS2.C: Ecosystem Dynamics,
Science S1C1PO2. Select appropriate resources for background information related to a question, for use in the design of a controlled investigation. S1C2PO 1. Demonstrate safe behavior and appropriate procedures (e.g., use and care of technology, materials, organisms) in all science inquiry. S1C2PO4. Perform measurements using appropriate scientific tools (e.g., balances, microscopes, probes, micrometers). S1C1PO5. Keep a record of observations, notes, sketches, questions, and ideas using tools such as written and/or computer logs. S1C3PO1. Analyze data obtained in a scientific investigation to identify trends. S1C3PO2. Form a logical argument about a correlation between variables or sequence of events (e.g., construct a cause-‐and-‐effect chain that explains a sequence of events). S1C3PO5. Explain how evidence supports the validity and reliability of a conclusion. S1C3PO7. Critique scientific reports from periodicals, television, or other media. S1C3PO8. Formulate new questions based on the results of a previous investigation. S1C4PO1. Communicate the results of an investigation. S1C4PO2. Choose an appropriate graphic representation for collected data: • line graph • double bar graph • stem and leaf plot
3. Life on Earth depends on, is shaped by, and affects climate. A. Individual organisms survive within specific
ranges of temperature, precipitation, humidity, and sunlight. Organisms exposed to climate conditions outside their normal range must adapt or migrate, or they will perish.
C. Changes in climate conditions can affect the health and function of ecosystems and the survival of entire species. The distribution patterns of fossils show evidence of gradual as well as abrupt extinctions related to climate change in the past.
4. Climate varies over space and time through both natural and man-‐made processes. A. Climate is determined by the long-‐term pattern
of temperature and precipitation averages and extremes at a location. Climate descriptions can refer to areas that are local, regional, or global in extent. Climate can be described for different time intervals, such as decades, years, seasons, months, or specific dates of the year.
B. Climate is not the same thing as weather. Weather is the minute-‐by-‐minute variable condition of the atmosphere on a local scale. Climate is a conceptual description of an area’s average weather conditions and the extent to which those conditions vary over long time intervals. .
6. Human activities are impacting the climate system.
Grade 8 Overview Last Updated: December 1, 2014
Expanding the Depth and Breadth of Climate Change Common Knowledge: Using Research Gardens as a Common Thread 2
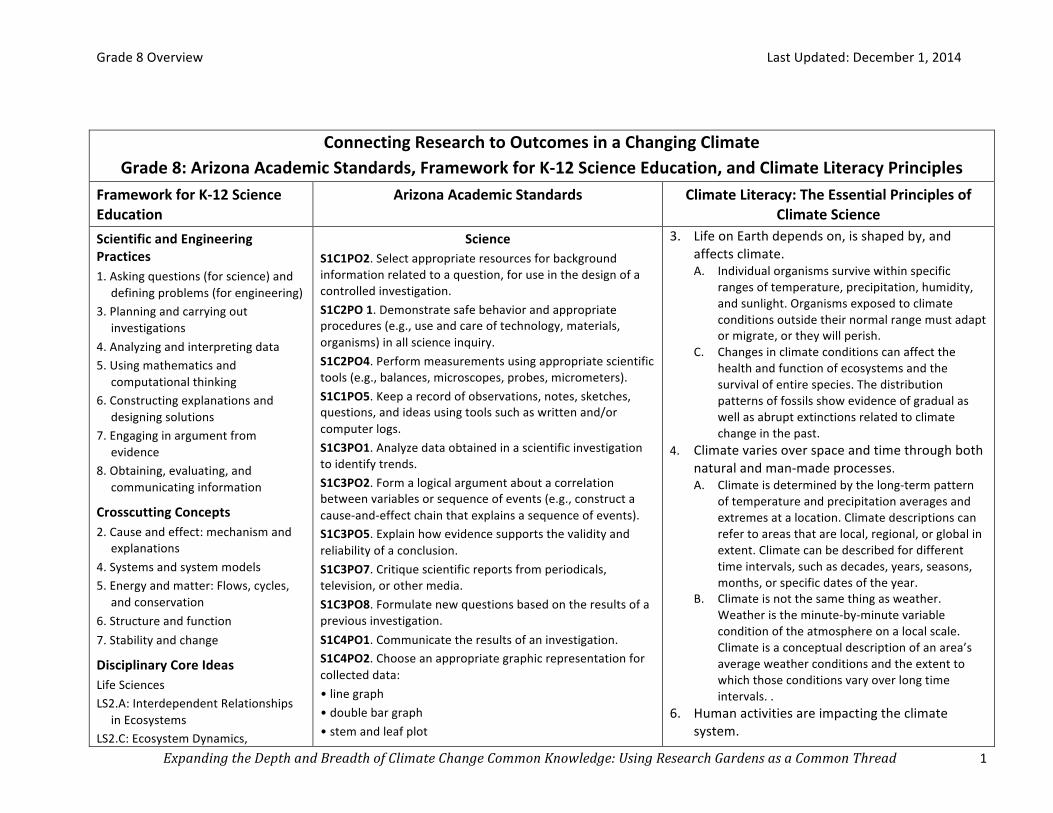
Functioning, and Resilience LS4.B: Natural Selection LS4.C: Adaptation LS4.D: Biodiversity and Humans Earth and Space Science ESS2.C: The Roles of Water in Earth’s
Surface Processes ESS2.D: Weather and Climate ESS3.C: Human Impacts on Earth Systems ESS3.D: Global Climate Change
• histogram S1C4PO3. Present analyses and conclusions in clear, concise formats. S1C4PO5. Communicate the results and conclusion of the investigation. S2C2PO1. Apply the following scientific processes to other problem solving or decision making situations:
• Observing • Questioning • Communicating • Predicting • Organizing data • Inferring • Generating hypothesis • Identifying variables NOTE: Classifying is a part of this PO but is not addressed in this lesson.
S2C2PO3. Defend the principle that accurate record keeping, openness, and replication are essential for maintaining an investigator’s credibility with other scientists and society. S2C2PO4. Explain why scientific claims may be questionable if based on very small samples of data, biased samples, or samples for which there was no control.
S3C2PO1. Propose viable methods of responding to an identified need or problem. S3C2PO2. Compare solutions to best address an identified need or problem.
S4C4PO1. Explain how an organism’s behavior allows it to survive in an environment. S4C4PO3. Determine characteristics of organisms that could change over several generations. S4C4PO4. Compare the symbiotic and competitive relationships in organisms within an ecosystem (e.g., lichen, mistletoe/tree, clownfish/sea anemone, native/non-‐native species). S4C4PO6. Describe the following factors that allow for the survival of living organisms:
D. Growing evidence shows that changes in many physical and biological systems are linked to human caused global warming. Some changes resulting from human activities have decreased the capacity of the environment to support various species and have substantially reduced ecosystem biodiversity and ecological resilience.
7. Climate change will have consequences for the Earth system and human lives. E. Ecosystems on land and in the ocean have been
and will continue to be disturbed by climate change. Animals, plants, bacteria, and viruses will migrate to new areas with favorable climate conditions. Infectious diseases and certain species will be able to invade areas that they did not previously inhabit.

Grade 8 Overview Last Updated: December 1, 2014
Expanding the Depth and Breadth of Climate Change Common Knowledge: Using Research Gardens as a Common Thread 3
• seed dispersal • pollination
Note: Beak design and protective coloration are a part of this performance objective but is not addressed in this lesson.
AZ College and Career Readiness Standards -‐ ELA Key Ideas and Details
• Cite specific textual evidence to support analysis of science and technical texts. (6-‐8.RST.1)
• Follow precisely a multistep procedure when carrying out experiments, taking measurements, or performing technical tasks. (6-‐8.RST.3)
Craft and Structure • Determine the meaning of symbols, key terms, and
other domain-‐specific words and phrases as they are used in a specific scientific or technical context relevant to grades 6–8 texts and topics. (6-‐8.RST.4)
Integration of Knowledge and Ideas • Integrate quantitative or technical information
expressed in words in a text with a version of that information expressed visually (e.g., in a flowchart, diagram, model, graph, or table). (6-‐8.RST.7)
Distinguish among facts, reasoned judgment based on research findings, and speculation in a text. (6-‐8.RST.8)
AZ College and Career Readiness Standards – Math Mathematical Practices 8.MP.1. Make sense of problems and persevere in solving them. 8.MP.2. Reason abstractly and quantitatively. 8.MP.3. Construct viable arguments and critique the reasoning of others. 8.MP.4. Model with mathematics. 8.MP.5. Use appropriate tools strategically. 8.MP.6. Attend to precision. 8.MP.7. Look for and make use of structure. 8.MP.8. Look for and express regularity in repeated

Grade 8 Overview Last Updated: December 1, 2014
Expanding the Depth and Breadth of Climate Change Common Knowledge: Using Research Gardens as a Common Thread 4
reasoning.
Technology Creativity and Innovation S1C1PO1 Analyze information to generate new ideas and products. S1C3PO1 Identify patterns and trends to draw conclusions and forecast possibilities. S1C4PO2 Use digital collaborative tools to analyze information to produce original works and express ideas. Communication and Collaboration S2C2PO1 Communicate and collaborate for the purpose of producing original works or solving problems. Digital Citizenship S5C2PO1 Promote digital citizenship by consistently leading by example and advocating social and civic responsibility.
Grade 8 Materials Required Last Updated: December 1, 2014
Expanding the Depth and Breadth of Climate Change Common Knowledge: Using Research Gardens as a Common Thread
1
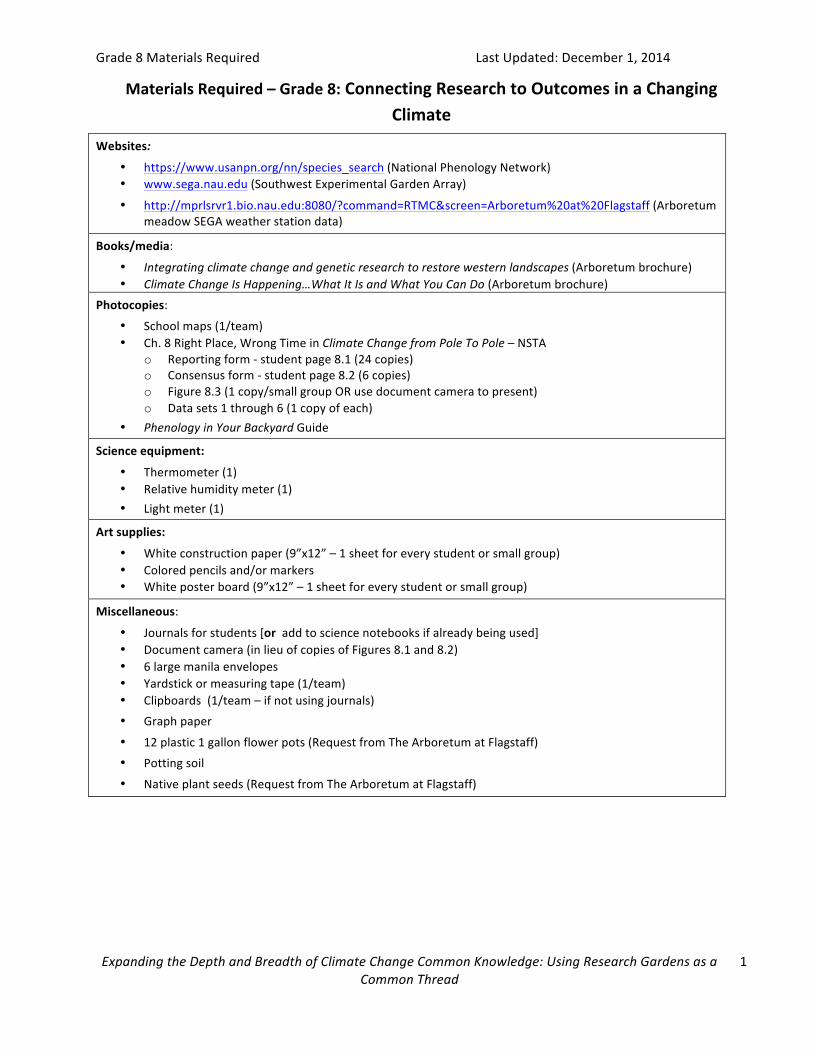
Materials Required – Grade 8: Connecting Research to Outcomes in a Changing Climate
Websites:
• https://www.usanpn.org/nn/species_search (National Phenology Network) • www.sega.nau.edu (Southwest Experimental Garden Array)
• http://mprlsrvr1.bio.nau.edu:8080/?command=RTMC&screen=Arboretum%20at%20Flagstaff (Arboretum meadow SEGA weather station data)
Books/media:
• Integrating climate change and genetic research to restore western landscapes (Arboretum brochure) • Climate Change Is Happening…What It Is and What You Can Do (Arboretum brochure)
Photocopies:
• School maps (1/team) • Ch. 8 Right Place, Wrong Time in Climate Change from Pole To Pole – NSTA
o Reporting form -‐ student page 8.1 (24 copies) o Consensus form -‐ student page 8.2 (6 copies) o Figure 8.3 (1 copy/small group OR use document camera to present) o Data sets 1 through 6 (1 copy of each)
• Phenology in Your Backyard Guide
Science equipment:
• Thermometer (1) • Relative humidity meter (1) • Light meter (1)
Art supplies:
• White construction paper (9”x12” – 1 sheet for every student or small group) • Colored pencils and/or markers • White poster board (9”x12” – 1 sheet for every student or small group)
Miscellaneous:
• Journals for students [or add to science notebooks if already being used] • Document camera (in lieu of copies of Figures 8.1 and 8.2) • 6 large manila envelopes • Yardstick or measuring tape (1/team) • Clipboards (1/team – if not using journals) • Graph paper
• 12 plastic 1 gallon flower pots (Request from The Arboretum at Flagstaff) • Potting soil
• Native plant seeds (Request from The Arboretum at Flagstaff)
Grade 8 Lessons Last Updated: December 1, 2015
Expanding the Depth and Breadth of Climate Change Common Knowledge: Using Research Gardens
as a Common Thread
1
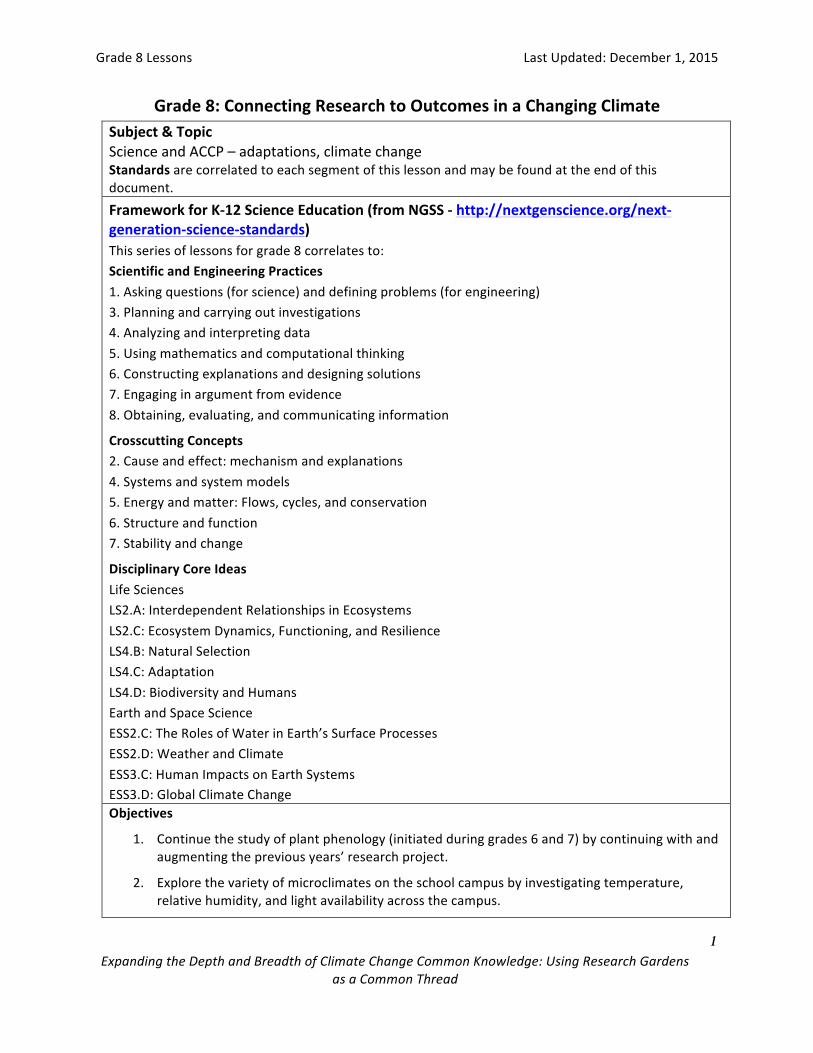
Grade 8: Connecting Research to Outcomes in a Changing Climate
Subject & Topic Science and ACCP – adaptations, climate change Standards are correlated to each segment of this lesson and may be found at the end of this document. Framework for K-‐12 Science Education (from NGSS -‐ http://nextgenscience.org/next-‐generation-‐science-‐standards) This series of lessons for grade 8 correlates to: Scientific and Engineering Practices 1. Asking questions (for science) and defining problems (for engineering) 3. Planning and carrying out investigations 4. Analyzing and interpreting data 5. Using mathematics and computational thinking 6. Constructing explanations and designing solutions 7. Engaging in argument from evidence 8. Obtaining, evaluating, and communicating information
Crosscutting Concepts 2. Cause and effect: mechanism and explanations 4. Systems and system models 5. Energy and matter: Flows, cycles, and conservation 6. Structure and function 7. Stability and change
Disciplinary Core Ideas Life Sciences LS2.A: Interdependent Relationships in Ecosystems LS2.C: Ecosystem Dynamics, Functioning, and Resilience LS4.B: Natural Selection LS4.C: Adaptation LS4.D: Biodiversity and Humans Earth and Space Science ESS2.C: The Roles of Water in Earth’s Surface Processes ESS2.D: Weather and Climate ESS3.C: Human Impacts on Earth Systems ESS3.D: Global Climate Change Objectives
1. Continue the study of plant phenology (initiated during grades 6 and 7) by continuing with and augmenting the previous years’ research project.
2. Explore the variety of microclimates on the school campus by investigating temperature, relative humidity, and light availability across the campus.
Grade 8 Lessons Last Updated: December 1, 2015
Expanding the Depth and Breadth of Climate Change Common Knowledge: Using Research Gardens
as a Common Thread
2
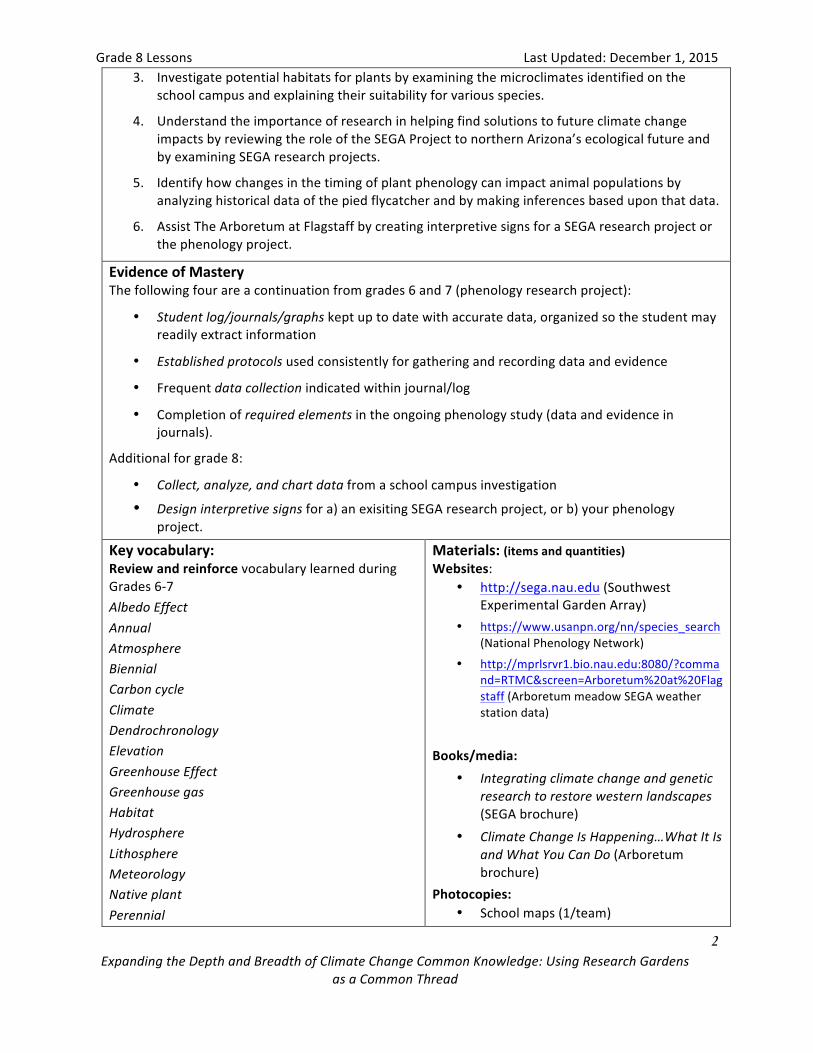
3. Investigate potential habitats for plants by examining the microclimates identified on the school campus and explaining their suitability for various species.
4. Understand the importance of research in helping find solutions to future climate change impacts by reviewing the role of the SEGA Project to northern Arizona’s ecological future and by examining SEGA research projects.
5. Identify how changes in the timing of plant phenology can impact animal populations by analyzing historical data of the pied flycatcher and by making inferences based upon that data.
6. Assist The Arboretum at Flagstaff by creating interpretive signs for a SEGA research project or the phenology project.
Evidence of Mastery The following four are a continuation from grades 6 and 7 (phenology research project):
• Student log/journals/graphs kept up to date with accurate data, organized so the student may readily extract information
• Established protocols used consistently for gathering and recording data and evidence
• Frequent data collection indicated within journal/log
• Completion of required elements in the ongoing phenology study (data and evidence in journals).
Additional for grade 8:
• Collect, analyze, and chart data from a school campus investigation
• Design interpretive signs for a) an exisiting SEGA research project, or b) your phenology project.
Key vocabulary: Review and reinforce vocabulary learned during Grades 6-‐7 Albedo Effect Annual Atmosphere Biennial Carbon cycle Climate Dendrochronology Elevation Greenhouse Effect Greenhouse gas Habitat Hydrosphere Lithosphere Meteorology Native plant Perennial
Materials: (items and quantities) Websites:
• http://sega.nau.edu (Southwest Experimental Garden Array)
• https://www.usanpn.org/nn/species_search (National Phenology Network)
• http://mprlsrvr1.bio.nau.edu:8080/?command=RTMC&screen=Arboretum%20at%20Flagstaff (Arboretum meadow SEGA weather station data)
Books/media:
• Integrating climate change and genetic research to restore western landscapes (SEGA brochure)
• Climate Change Is Happening…What It Is and What You Can Do (Arboretum brochure)
Photocopies: • School maps (1/team)

Grade 8 Lessons Last Updated: December 1, 2015
Expanding the Depth and Breadth of Climate Change Common Knowledge: Using Research Gardens
as a Common Thread
3
Phenology Precipitation Protocol Qualitative data Quantitative data Urban heat island Weather Additional vocabulary for grade 8
• Carbon footprint -‐ A carbon footprint is the measure of the environmental impact of a particular individual or organization's lifestyle or operation, typically measured in units of carbon dioxide (and other greenhouse gases) emitted per year.
• Citizen Science -‐ is a strategy used by scientists to help augment their body of data and evidence through the training and networking of volunteers who use tested protocols for assisting in a scientific data collection.
• Hygrometer – a device for measuring humidity.
• Microclimate -‐ the climate of a very small or restricted area, especially when this differs from the climate of the surrounding area.
• Migration – movement from one place to another (usually to find the best food supply and not to avoid change sin temperature)
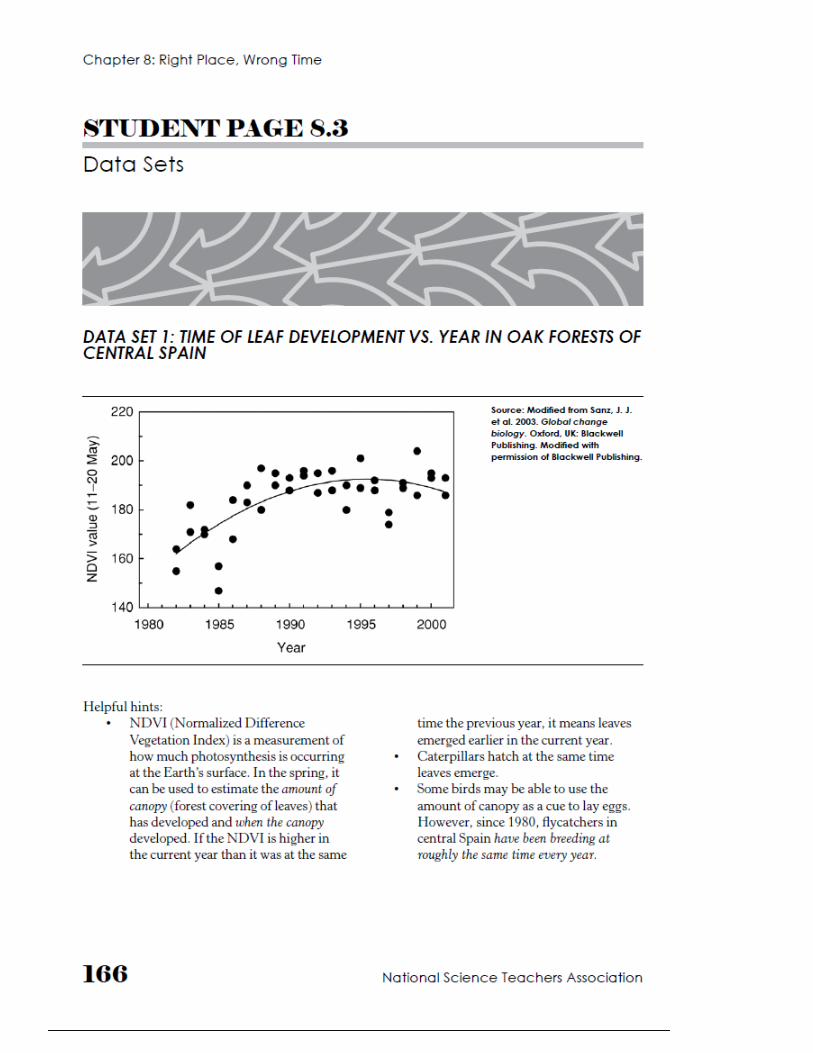
• NDVI (Normalized Difference Vegetation Index) – a measurement of how much photosynthesis is occurring at the Earth’s surface
• Photometer – a device for measuring light availability.
• Relative humidity -‐ the amount of water vapor present in air expressed as a percentage of the amount needed for saturation at the same temperature.
• Variable – something that can vary or change
• Ch. 8 Right Place, Wrong Time in Climate Change from Pole To Pole – NSTA o Reporting form -‐ student page 8.1
(24 copies) o Consensus form -‐ student page 8.2
(6 copies) o Figure 8.3 (1 copy/small group OR
use document camera to present) o Data sets 1 through 6 (1 copy of
each) • Phenology in Your Backyard Guide
Science equipment • Thermometer (1/team) • Relative humidity meter (1/team) • Light meter (PAR) (1/team)
Art supplies: • White construction paper (9”x12” – 1
sheet for every student or small group) • Colored pencils and/or markers • White poster board (9”x12” – 1 sheet
for every student or small group)
Miscellaneous: • Document camera (in lieu of copies of
Figures 8.1 and 8.2) • 6 large manila envelopes • Photos of birds native to your area
(1/every student – all different species if possible)
• Yardstick or measuring tape(1/team) • Clipboards (1/team – if not using
journals) • Graph paper • 12 plastic 1 gallon pots • Potting soil (1-‐2 bags) • Native plant seeds (Request from The
Arboretum at Flagstaff)
Engage
Guiding question: “How much do microclimates vary across my school campus?”

Grade 8 Lessons Last Updated: December 1, 2015
Expanding the Depth and Breadth of Climate Change Common Knowledge: Using Research Gardens
as a Common Thread
4
Prepare:
• Discuss different characteristics of climate and how the chosen characteristics will be measured today. Go over use of instruments and units of measure. Include in your discussion the importance of physically describing the microclimate surroundings. For example, black pavement may heat up a microclimate, whereas white concrete might cool a microclimate (Albedo Effect).
• Divide class into four teams. • Create an 8½” x 11” perimeter map of your school campus, noting specific landmarks
(streets, school building, etc.). You may choose to include a section where teams will identify date, time, weather conditions, team members, etc.
• Make copies of the map (1 copy/each team) • Draw the outline of the school campus on the board (for share outs later in the lesson) • Decide which group will be measuring temperature, light, relative humidity and making
physical descriptions. • Gather supplies: each group receives the appropriate “meter” and clipboards (if
needed), a yardstick or measuring tape, graph paper for data collection and the map • Calibrate thermometers (or plan to do this as a first step with students) to ensure
accuracy of results [Place all thermometers into a beaker of ice water for 5 minutes. All should read between 0.0° to 0.5° C. [If there is greater variation, select one to use as your comparison point. Note how much each of the others differs and plan to incorporate that amount into final calculations.]
• As a class – choose four sites around campus, that you feel would provide optimal growing conditions for plants, to measure microclimate. Mark these sites on everyone’s map. Sites should be at least 20 feet apart.
Present: • Ask: “Are the chosen site locations truly different microclimates? How can we find
out?” • Assign one of the chosen sites of the school campus to each team. Data should be
collected on the datasheet provided. • Ask: “What details should we include on our data sheet? To be consistent, what do we
need to remember?” [Discuss the importance of all teams taking measurements at the same place within their assigned site, being sure to identify the height of the thermometer – e.g., on the ground, 6’ off the ground, etc. – and the citation of other details such as date, time, names of team members, weather conditions, etc.]
Student activity: • Remind students of safety procedures to follow at all times while outdoors. • In their teams, students take their measurements or make their descriptions. Provide
at least 15 minutes per site. Afterwards, groups should rotate to the next site on their map and repeat the exercise until all four sites have been examined. Note: depending on the available amount of time, you may want to select campus sites that are
Grade 8 Lessons Last Updated: December 1, 2015
Expanding the Depth and Breadth of Climate Change Common Knowledge: Using Research Gardens
as a Common Thread
5
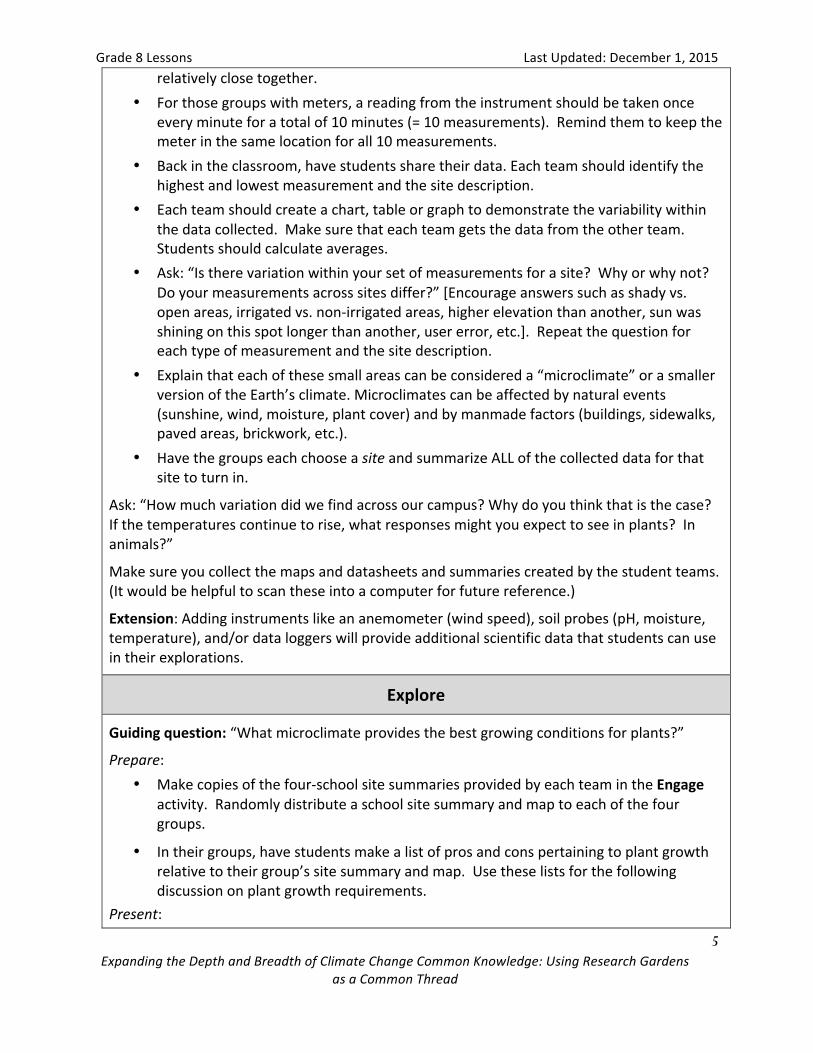
relatively close together. • For those groups with meters, a reading from the instrument should be taken once
every minute for a total of 10 minutes (= 10 measurements). Remind them to keep the meter in the same location for all 10 measurements.
• Back in the classroom, have students share their data. Each team should identify the highest and lowest measurement and the site description.
• Each team should create a chart, table or graph to demonstrate the variability within the data collected. Make sure that each team gets the data from the other team. Students should calculate averages.
• Ask: “Is there variation within your set of measurements for a site? Why or why not? Do your measurements across sites differ?” [Encourage answers such as shady vs. open areas, irrigated vs. non-‐irrigated areas, higher elevation than another, sun was shining on this spot longer than another, user error, etc.]. Repeat the question for each type of measurement and the site description.
• Explain that each of these small areas can be considered a “microclimate” or a smaller version of the Earth’s climate. Microclimates can be affected by natural events (sunshine, wind, moisture, plant cover) and by manmade factors (buildings, sidewalks, paved areas, brickwork, etc.).
• Have the groups each choose a site and summarize ALL of the collected data for that site to turn in.
Ask: “How much variation did we find across our campus? Why do you think that is the case? If the temperatures continue to rise, what responses might you expect to see in plants? In animals?”
Make sure you collect the maps and datasheets and summaries created by the student teams. (It would be helpful to scan these into a computer for future reference.)
Extension: Adding instruments like an anemometer (wind speed), soil probes (pH, moisture, temperature), and/or data loggers will provide additional scientific data that students can use in their explorations.
Explore
Guiding question: “What microclimate provides the best growing conditions for plants?”
Prepare: • Make copies of the four-‐school site summaries provided by each team in the Engage
activity. Randomly distribute a school site summary and map to each of the four groups.
• In their groups, have students make a list of pros and cons pertaining to plant growth relative to their group’s site summary and map. Use these lists for the following discussion on plant growth requirements.
Present:

Grade 8 Lessons Last Updated: December 1, 2015
Expanding the Depth and Breadth of Climate Change Common Knowledge: Using Research Gardens
as a Common Thread
6
• Ask: “Which microclimate will provide the best growing environment for plants?” • Discuss the growing requirements of different plants. Encourage responses that
include the necessities for life: food, water, shelter, space – this is also a good place to review plant adaptations.
• Explain that students will be growing native plants in the selected campus sites to determine which microclimate is best for growing plants.
Student activity: • Gather the following materials and divide equally among the four groups: (12) identical
1 gallon plastic pots; (2) bags of potting soil; masking tape for labeling pots; native plant seeds*. Note: seeds and planting instructions can be acquired from The Arboretum at Flagstaff or can be purchased.
• Students should label each of their 3 pots with their campus location, group member names, and unique replicate number (1, 2 or 3). Afterwards, pots should be filled ¾ full with potting soil and the students should follow the planting protocol for their seeds. Discuss the importance of treating each pot the same.
• Once the seeds have been watered in – groups should place their 3 replicate pots in their microclimate site.
• ALL pots should receive the same amount of water daily – see the planting protocol for how much water this should be. Students should make observations on their pots as many times as possible per week, for up to three weeks. Most seeds should germinate in ~10 days.
• Observations should be recorded in journals. At the end of the growing period (teacher determined) – students will summarize their observations and share these data with the class.
Ask: “Which microclimate supported the highest seed germination? The least seed germination? The biggest seedlings?” Encourage discussion as to which microclimate provided the best growing conditions. Ask: “How would you explain the variation across microclimates?” Refer to their microclimate measures. “Did you see variation within your microclimate? What might cause this?” Have students generate possible reasons to explain growth differences across and within microclimates.
Explain
Guiding question: “What is SEGA and how is it being used to study climate change?” Prepare:
• Invite a guest speaker by contacting the Director of Research at The Arboretum at Flagstaff. The Arboretum can provide a current list of SEGA researchers and help identify a speaker for your classroom. Ask the speaker to include: an overview of the SEGA Project (intended outcomes, protocols, how scientists are/will be using data),
Grade 8 Lessons Last Updated: December 1, 2015
Expanding the Depth and Breadth of Climate Change Common Knowledge: Using Research Gardens
as a Common Thread
7
data gathered thus far and its implications for the future, how anticipated climate change might affect plants of northern Arizona and, if known, how other species that depend upon those plants might be affected.
• Distribute the Arboretum brochure, Integrating climate change and genetic research to restore western landscapes
Present: • Introduce the guest speaker to the class. Include a brief bio of the person’s
background: special interests/hobbies, classes that helped them prepare for their career, what they enjoy about being a scientist. (You might ask the presenter to include this information prior to his/her presentation, rather than offering this information yourself.)
Student activity: • Attentively listen to the presentation. • Ask questions about SEGA and research. • Have students work in groups to design a SEGA experiment by asking, “How would you
re-‐design the campus study of microclimate and native plant germination and growth using SEGA?” Once the ideas are down on paper – discuss the pros and cons of each experiment as a class.
Extension: Plan a field trip to The Arboretum at Flagstaff to see the SEGA gardens and research projects, the state-‐of-‐the-‐art weather station, the Climate Change Learning Center and Exhibit.
Elaborate
Guiding question: “Right place, wrong time…or right time, wrong place?”
Note: The activity is adapted from the NSTA resource Climate Change from Pole to Pole.
Part I
Prepare: • Review Chapter 8: “Right Place, Wrong Time – Phenological Mismatch in the
Mediterranean” for background information. • Divide class into small groups (2-‐5 students/group).
• Assign the following roles to each group: note taker (will record group’s thoughts on each data set), timekeeper (will monitor the time and keep group on task), student representative (communicates with the teacher if the group has questions), presenter (communicates the group’s responses to the rest of the class), discussion leader (optional – leads group’s discussion).
• Copy Figure 8.1 (24 copies) and Figure 8.2 (1 copy/group OR plan to use document camera)
Grade 8 Lessons Last Updated: December 1, 2015
Expanding the Depth and Breadth of Climate Change Common Knowledge: Using Research Gardens
as a Common Thread
8
Present: Facilitate a brief discussion for the following:
• “What is migration? Do all birds migrate?” [movement from one place to another, usually to find a more suitable or available food source; not all birds migrate]
• “What do birds eat when they are migrating?” [whatever might be available en route!] • “Are some foods better for birds than others? Do birds eat the same food all year long?
How might plants impact the food selection of migrating birds?” [many animals eat different foods, consuming whatever might be available to them each season – e.g., squirrels, bears, coyotes all eat different foods depending on the time of year and what is in nature’s pantry]
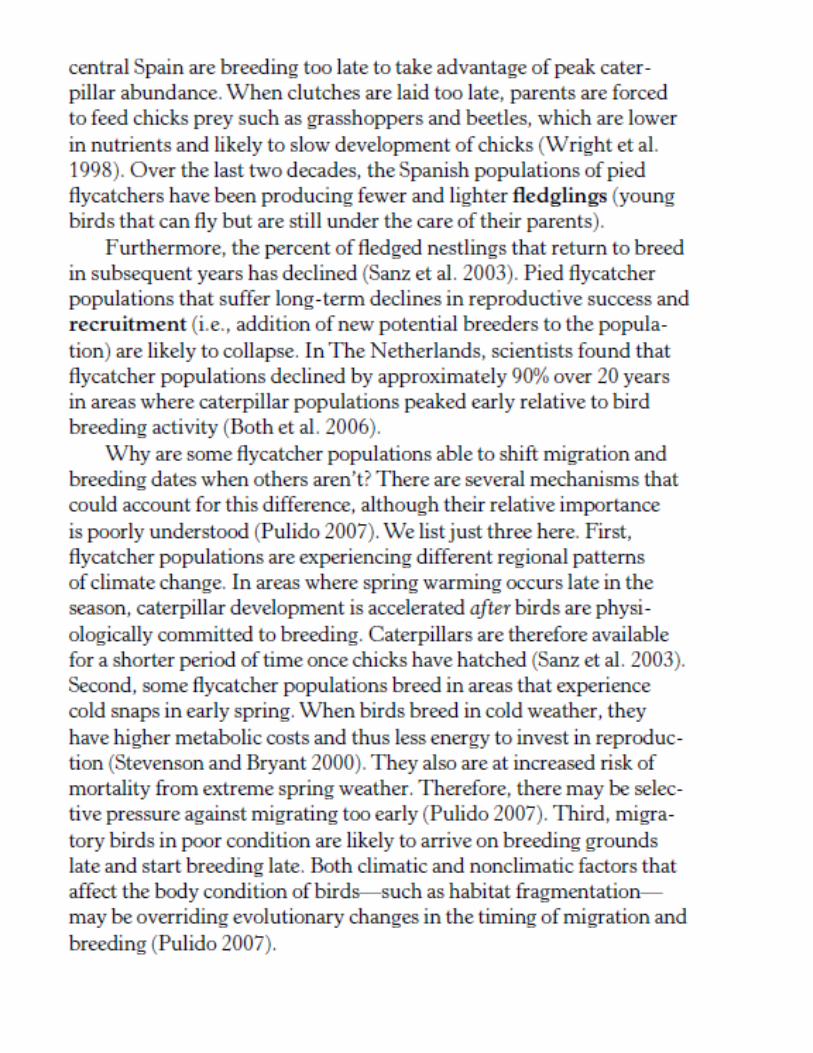
Student activity: • Students consider Figure 8.1. What is the “big idea” behind this diagram? • Students then read Figure 8.2. Each group identifies 2 or more challenges that pied
flycatchers might face during their spring migration. • The presenter for each group shares its group’s ideas with the class. Facilitate a brief
discussion on the collective results. Part II Prepare:
• Copy figure 8.3 (1 copy/group) OR use document camera Present:
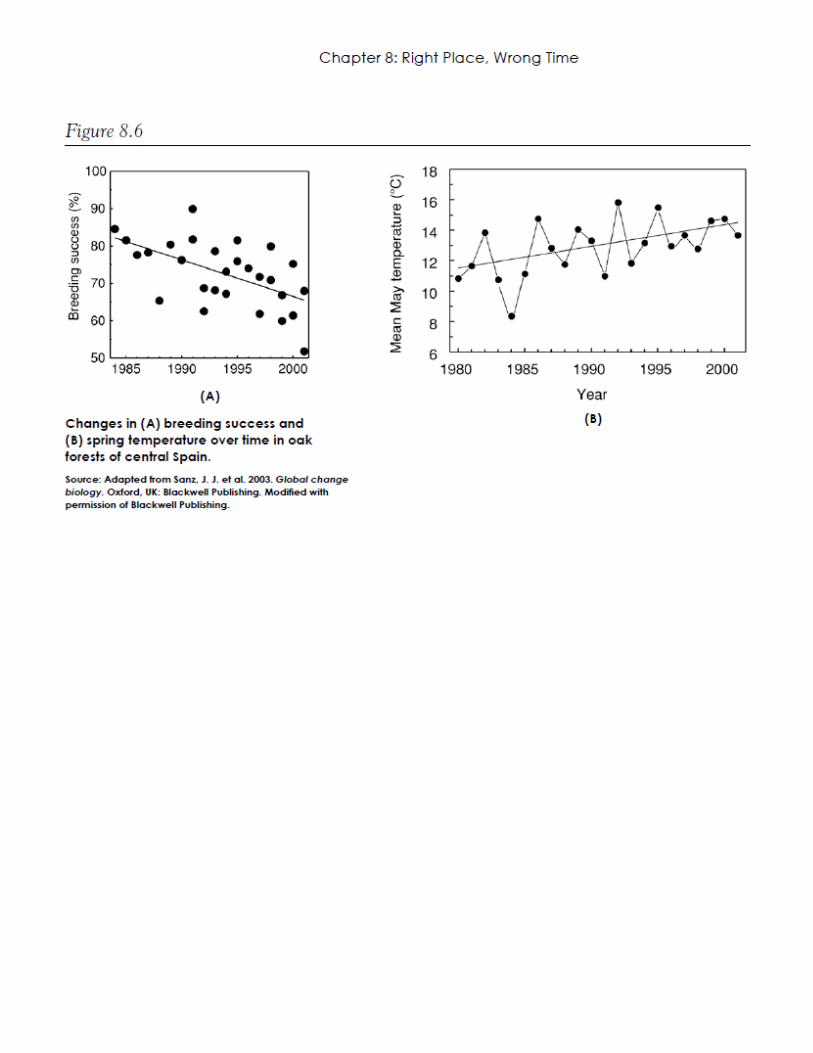
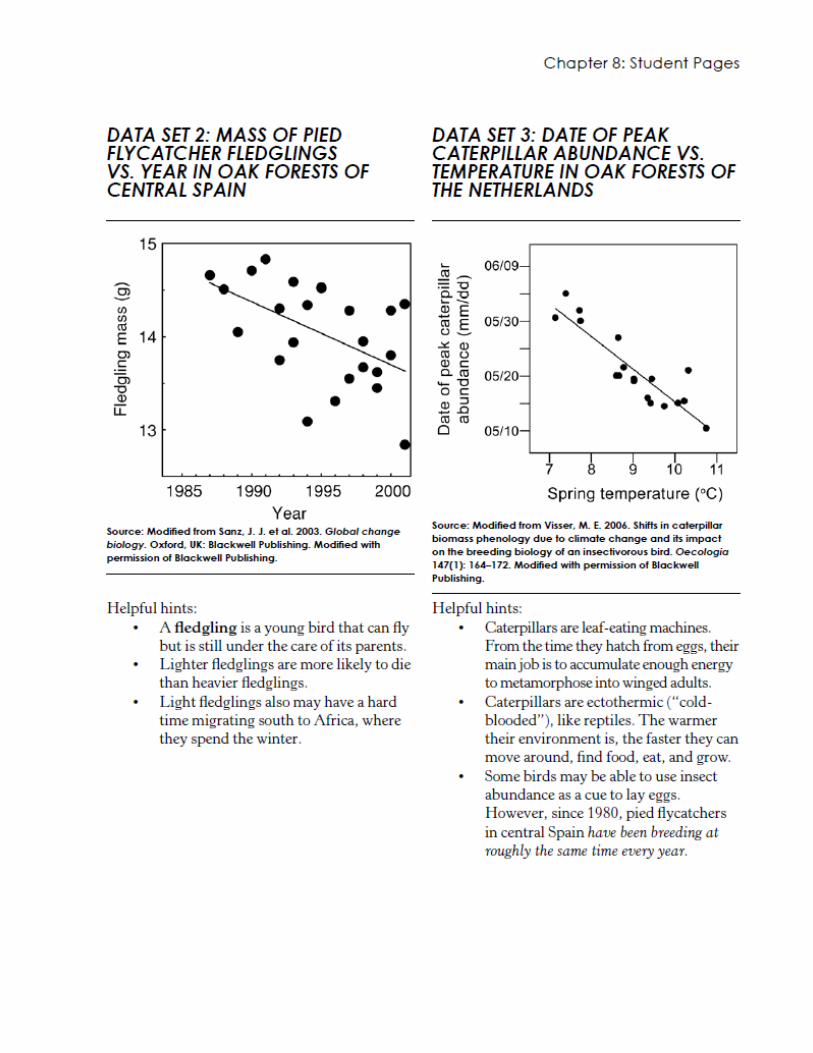
• Present figure 8.3 to the class (document camera or photocopy) • Ask: “What is the connection between oak leaves, pied flycatchers, and caterpillars?”
and “What might happen if oak leaves developed earlier than usual, well prior to the birds arrival each spring?” (This is a likely result of climate change.)
Student activity: • Students consider the ecological and phenological connections between the oak leaf,
caterpillar, and pied flycatcher in Spain. • The presenter for each group shares key elements of its discussion with the class. • Encourage students to try to think of other relationships between plants and other
insects, birds, mammals).
Part III
Prepare: • Prepare packets for group review: insert one data set into each of six different manila
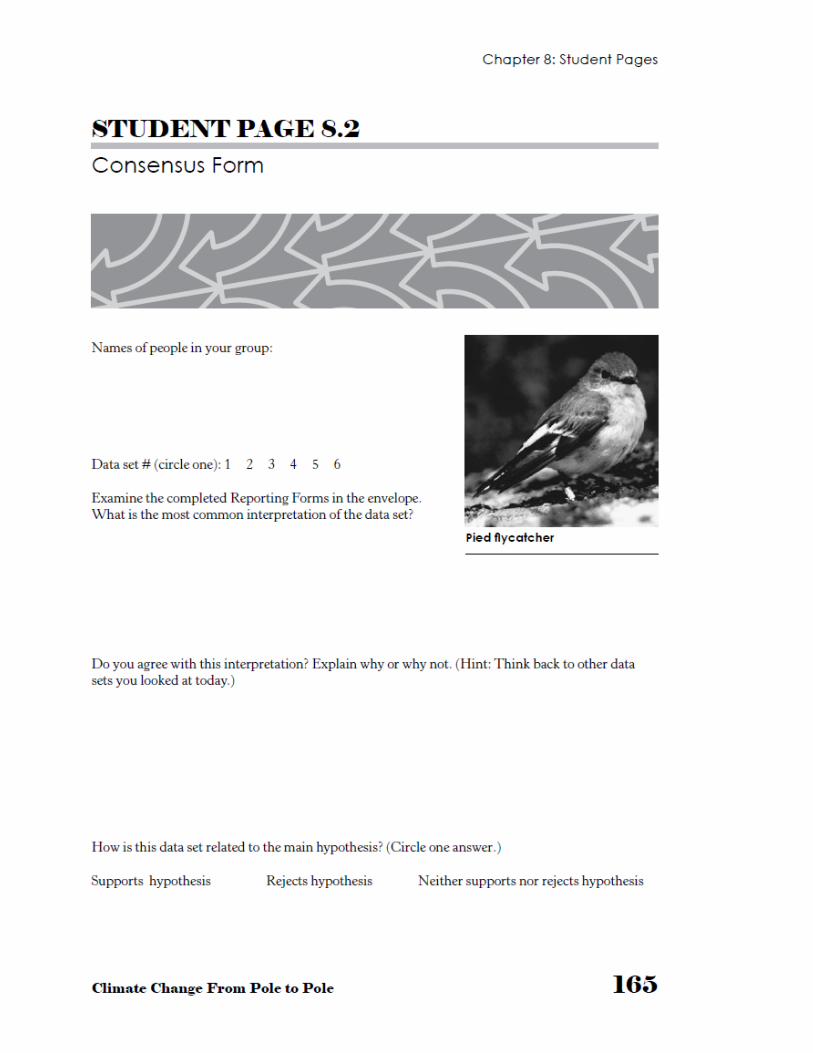
envelopes along with four copies of Student Reporting Form (Page 8.1) and one copy of Student Consensus Form (Page 8.2).
Present: • Write the following question on the board: “Is there a relationship between high spring
temperatures and the breeding success of pied flycatchers?”
Grade 8 Lessons Last Updated: December 1, 2015
Expanding the Depth and Breadth of Climate Change Common Knowledge: Using Research Gardens
as a Common Thread
9
• Explain to students that they will be exploring data collected by researchers in Spain over a period of 18 years. Not all data gathered may be relevant to this question.
• Distribute one manila packet to each group. Remind them to remain in their assigned roles while they answer all questions on their reporting form. They will have 5-‐10 minutes (teacher’s choice!) to consider and record their responses to the data – and only these data -‐ in their packet.
Student activity: • Each group reviews its data set within the time frame allocated and files its report in
the manila envelope. • Each envelope is passed to the next group (or groups move from table to table) and
the process is repeated. Students should NOT use any time to read a prior group’s responses. This will occur later. (Teachers may need to monitor this.)
• Repeat three more times until each group has seen four (4) different data sets. • Groups pass the manila packet they last considered to the next team. • Rather than reviewing this data set and completing a Reporting Form as before, each
group will review all four Reporting Sheets for the data set in their hands, consolidate the interpretations, and add details or make changes they view necessary on the Consensus Form – Page 8.2. (This may require deciding between conflicting decisions! The presenter for each group should be ready to defend his/her group’s consensus.) Additional time may be allocated to this rotation if necessary, allowing the groups time to seriously consider differences of opinion that may exist.
• Starting with data set 1, each group briefly identifies what the variables were, their relationship with each other, and (by consensus of the team) whether that data set supports, rejects, or does neither for the original hypothesis posted on the board.
Ask: “Why is it important to have both quantitative and qualitative data when considering the issue of climate change?” Facilitate a brief discussion. Ask: “How does a warming climate impact not only a plant but also other species that depend upon that plant?”
Evaluate Guiding question: “What can we do to help our native plants survive long-‐term changes in climate?”
Part I Prepare:
• Work with The Arboretum liaison to gather all data collected from all classes participating in the phenological research project.
• Collect corresponding weather data from the SEGA Arboretum weather station. http://mprlsrvr1.bio.nau.edu:8080/?command=RTMC&screen=Arboretum%20at%20Flagstaff
• Provide Climate Change Is Happening…What It Is and What You Can Do (Arboretum brochure) – 1 copy for every team member
Grade 8 Lessons Last Updated: December 1, 2015
Expanding the Depth and Breadth of Climate Change Common Knowledge: Using Research Gardens
as a Common Thread
10
Present:
• Share the aggregated phenology data and weather data with students. Ask them to create a graph, chart, or table that will begin (over time) to show trends. [This should be a visual that can be shared with the community, either via The Arboretum or classroom website or at an Arboretum kiosk. It should be presented so that any visitor to the site can easily see the research being undertaken by the students, what they are observing, and – over time – what they can infer from the data.]
Student activity: • In teams, students create a visual (chart, graph, table) that portrays the data gathered. • Ask: “How is the research we are doing today providing evidence that climate scientists
can use 100 years from now?” Facilitate a brief discussion. • Ask: “How do humans contribute to climate change?” [Students should refer to The
Arboretum’s guide Climate Change is Happening… and recall their activities from grades 6 and 7, especially remembering how we contribute to the greenhouse effect and how carbon is moved throughout the planet and atmosphere.] Facilitate a brief discussion.
• Each student team reviews suggestions provided by The Arboretum guide. Ask: “What steps can we take now to help minimize our carbon footprint [how we are adding to climate change]? What does each of these suggestions have to do with climate change? Do you have any addiitonal ideas or suggestions for steps we can take?” [Students may not understand that an incandescent light bulb provides 10% radiant (light) energy and 90% thermal (heat) energy when lit. CFL and LED bulbs are far more efficient! Water has a great deal of energy embedded in its delivery to us: electricity to pump raw water to be treated before it can be used for potable purposes, energy to pump the water to our homes, then back into the sewer system to be pumped to a water treatment plant, etc. It is important that students be able to draw connections between their daily activities and the resulting impacts upon the planet.]
Part II Prepare:
• Work with Arboretum research staff to identify ongoing research projects in the SEGA gardens OR use the phenology project data to develop interpretive signs for the public.
• Gather art supplies for each student or small group. Present:
• Explain to students that they (individually or in small groups) will be creating an interpretive sign to be displayed at The Arboretum. The purpose of this is to help the general public become more aware of the role of on-‐going research and the potential implications of those studies on how we manage landscapes.
• Information to be included on each interpretive sign will be: 1) The researcher(s) name and home institution, 2) the research question being addressed, 3) brief methods being used by the researcher, and 4) anticipated data and results and potential implications for land management. It will be helpful to include photos or drawings of

Grade 8 Lessons Last Updated: December 1, 2015
Expanding the Depth and Breadth of Climate Change Common Knowledge: Using Research Gardens
as a Common Thread
11
the experimental design, plants being studied, and any graphs or figures that might help explain what is being done.
Student activity:
• Design an interpretive sign that addresses all of the listed criteria. Closure: (revisit objective, IQ’s and make real world connections)
Students review their phenology data collected over the past three years, comparing and contrasting the data they collected with that of other project participants. Chart or graph the results. (This will form the basis for a long-‐term study among current and future students.)
Drawing inferences from their own data, what predictions would they make about what might happen if climate change continues unabated in northern Arizona?
What can they do to help minimize their own carbon footprint while helping build a body of sound science to guide future decision makers?

Grade 8 Lessons Last Updated: December 1, 2015
Expanding the Depth and Breadth of Climate Change Common Knowledge: Using Research Gardens
as a Common Thread
12
Standards addressed do not include those for the continuation of the phenology project. (See grade 6.) Standards Addressed in Each Lesson
(Refer to “Overview” for complete text of all standards cited. ACCR is the Arizona College and Career Readiness Standards, aka “Common Core”.)
ENGAGE – Science S1C1PO1 S1C2PO1, PO4, PO5 S1C3PO1 and PO5 S1C4PO1, PO2, PO3,
PO5 S2C2PO1, PO3, PO4 S4C4PO1
ENGAGE – ACCR 6-‐8.RST.3 6-‐8.RST.4
ENGAGE – Math 8.MP.2 8.MP.5 8.MP.6 8.MP.8
ENGAGE – Technology S1C1PO1 S1C3PO1 S2C2PO1
EXPLORE – Science S1C2PO1, PO4, PO5 S1C3PO1, PO2 S1C4PO1 S2C2PO1 S3C2PO1 and PO2 S4C4PO6
EXPLORE – ACCR 6-‐8.RST.3
EXPLORE – Math 8.MO.6 8.MP.7
EXPLORE – Technology S1C1PO1 S1C3PO2 S2C2PO1
EXPLAIN – Science (Contingent upon guest speaker)
S1C1PO2 S1C3PO5 and PO8 S2C2PO1 and PO4 S4C4PO1 and PO3
EXPLAIN – ACCR None
EXPLAIN – Math None
EXPLAIN – Technology None
ELABORATE – Science S1C1PO1 and PO5 S1C3PO1, PO2, PO5,
PO7 S1C4PO1 and PO3 S2C2PO1, PO3, PO4 S2C2PO1, PO3, PO4 S4C4PO1, PO3, PO4
ELABORATE – ACCR 6-‐8.RST.1 6-‐8.RST.3 6-‐8.RST.4 6-‐8.RST.7 6-‐8.RST.8
ELABORATE – Math 8.MP.2 8.MP.3 8.MP.4 8.MP.6 8.MP.7 8.MP.8
ELABORATE – Tech. S1C1PO1 S1C3PO1
EVALUATE – Science (dependent upon option selected)
S1C1PO2 S1C4PO1, PO2, PO3,
PO4, PO5 S4C4PO6
EVALUATE – ACCR (dependent upon option selected)
6-‐8.RST.3 6-‐8.RST.4 6-‐8.RST.7
EVALUATE – Math 8.MP.5 8.MP.6
EVALUATE – Tech. (dependent upon option selected)
S1C4PO2 S2C2PO1 S5C2PO1
Grade 8 Lessons Last Updated: December 1, 2015
Expanding the Depth and Breadth of Climate Change Common Knowledge: Using Research Gardens
as a Common Thread
13
Science
S1C1PO2. Select appropriate resources for background information related to a question, for use in the design of a controlled investigation. S1C2PO 1. Demonstrate safe behavior and appropriate procedures (e.g., use and care of technology, materials, organisms) in all science inquiry. S1C2PO4. Perform measurements using appropriate scientific tools (e.g., balances, microscopes, probes, micrometers). S1C1PO5. Keep a record of observations, notes, sketches, questions, and ideas using tools such as written and/or computer logs. S1C3PO1. Analyze data obtained in a scientific investigation to identify trends. S1C3PO2. Form a logical argument about a correlation between variables or sequence of events (e.g., construct a cause-‐and-‐effect chain that explains a sequence of events). S1C3PO5. Explain how evidence supports the validity and reliability of a conclusion. S1C3PO7. Critique scientific reports from periodicals, television, or other media. S1C3PO8. Formulate new questions based on the results of a previous investigation. S1C4PO1. Communicate the results of an investigation. S1C4PO2. Choose an appropriate graphic representation for collected data: • line graph • double bar graph • stem and leaf plot • histogram S1C4PO3. Present analyses and conclusions in clear, concise formats. S1C4PO5. Communicate the results and conclusion of the investigation. S2C2PO1. Apply the following scientific processes to other problem solving or decision making situations:
• Observing • Questioning • Communicating • Predicting • Organizing data • Inferring • Generating hypothesis • Identifying variables NOTE: Classifying is a part of this PO but is not addressed in this lesson.
S2C2PO3. Defend the principle that accurate record keeping, openness, and replication are essential for maintaining an investigator’s credibility with other scientists and society. S2C2PO4. Explain why scientific claims may be questionable if based on very small samples of data, biased samples, or samples for which there was no control.
S3C2PO1. Propose viable methods of responding to an identified need or problem. S3C2PO2. Compare solutions to best address an identified need or problem.
S4C4PO1. Explain how an organism’s behavior allows it to survive in an environment. S4C4PO3. Determine characteristics of organisms that could change over several generations. S4C4PO4. Compare the symbiotic and competitive relationships in organisms within an ecosystem (e.g., lichen, mistletoe/tree, clownfish/sea anemone, native/non-‐native species). S4C4PO6. Describe the following factors that allow for the survival of living organisms: • seed dispersal • pollination
Grade 8 Lessons Last Updated: December 1, 2015
Expanding the Depth and Breadth of Climate Change Common Knowledge: Using Research Gardens
as a Common Thread
14
Note: Beak design and protective coloration are a part of this performance objective but is not addressed in this lesson.
AZ College and Career Readiness Standards -‐ ELA Key Ideas and Details
• Cite specific textual evidence to support analysis of science and technical texts. (6-‐8.RST.1) • Follow precisely a multistep procedure when carrying out experiments, taking measurements, or
performing technical tasks. (6-‐8.RST.3)
Craft and Structure • Determine the meaning of symbols, key terms, and other domain-‐specific words and phrases as they are
used in a specific scientific or technical context relevant to grades 6–8 texts and topics. (6-‐8.RST.4)
Integration of Knowledge and Ideas • Integrate quantitative or technical information expressed in words in a text with a version of that
information expressed visually (e.g., in a flowchart, diagram, model, graph, or table). (6-‐8.RST.7) Distinguish among facts, reasoned judgment based on research findings, and speculation in a text. (6-‐8.RST.8)
AZ College and Career Readiness Standards – Math Mathematical Practices 8.MP.1. Make sense of problems and persevere in solving them. 8.MP.2. Reason abstractly and quantitatively. 8.MP.3. Construct viable arguments and critique the reasoning of others. 8.MP.4. Model with mathematics. 8.MP.5. Use appropriate tools strategically. 8.MP.6. Attend to precision. 8.MP.7. Look for and make use of structure. 8.MP.8. Look for and express regularity in repeated reasoning.
Technology Creativity and Innovation S1C1PO1 Analyze information to generate new ideas and products. S1C3PO1 Identify patterns and trends to draw conclusions and forecast possibilities. S1C4PO2 Use digital collaborative tools to analyze information to produce original works and express ideas. Communication and Collaboration S2C2PO1 Communicate and collaborate for the purpose of producing original works or solving problems. Digital Citizenship S5C2PO1 Promote digital citizenship by consistently leading by example and advocating social and civic responsibility.
Grade 8 Rubric Last Updated: December 1, 2014
Expanding the Depth and Breadth of Climate Change Common Knowledge: Using Research Gardens as a Common Thread
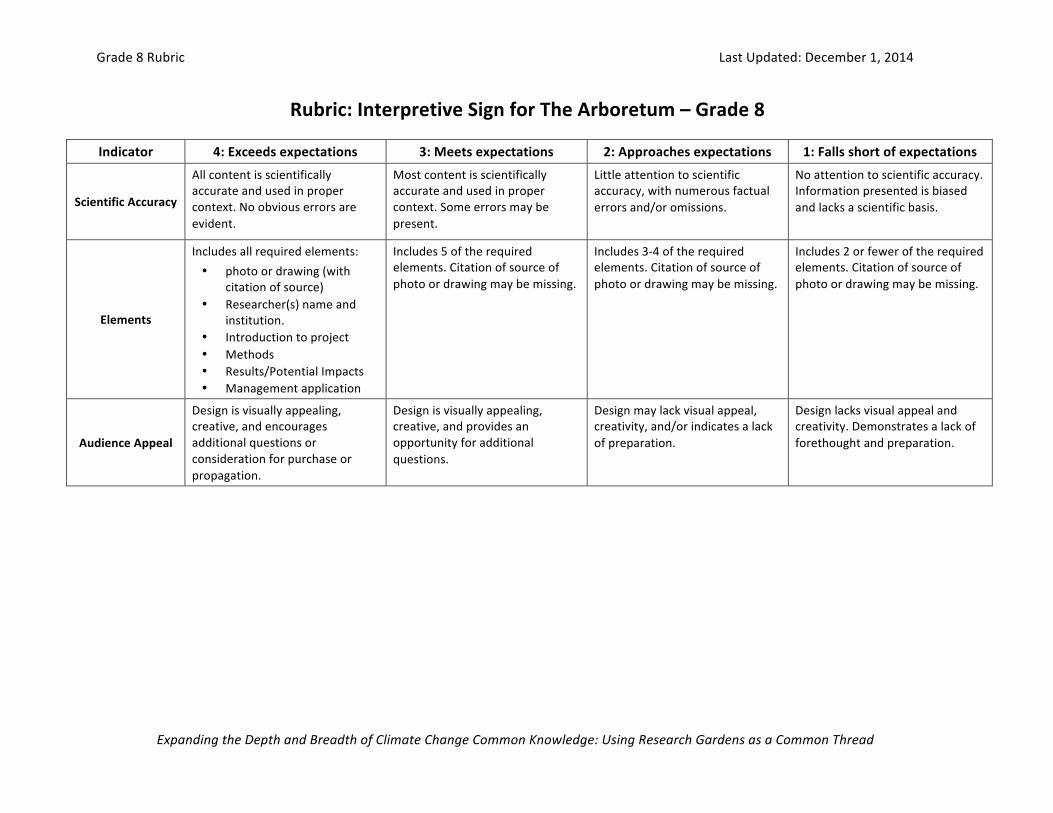
Rubric: Interpretive Sign for The Arboretum – Grade 8
Indicator 4: Exceeds expectations 3: Meets expectations 2: Approaches expectations 1: Falls short of expectations
Scientific Accuracy
All content is scientifically accurate and used in proper context. No obvious errors are evident.
Most content is scientifically accurate and used in proper context. Some errors may be present.
Little attention to scientific accuracy, with numerous factual errors and/or omissions.
No attention to scientific accuracy. Information presented is biased and lacks a scientific basis.
Elements
Includes all required elements: • photo or drawing (with
citation of source) • Researcher(s) name and
institution. • Introduction to project • Methods • Results/Potential Impacts • Management application
Includes 5 of the required elements. Citation of source of photo or drawing may be missing.
Includes 3-‐4 of the required elements. Citation of source of photo or drawing may be missing.
Includes 2 or fewer of the required elements. Citation of source of photo or drawing may be missing.
Audience Appeal
Design is visually appealing, creative, and encourages additional questions or consideration for purchase or propagation.
Design is visually appealing, creative, and provides an opportunity for additional questions.
Design may lack visual appeal, creativity, and/or indicates a lack of preparation.
Design lacks visual appeal and creativity. Demonstrates a lack of forethought and preparation.


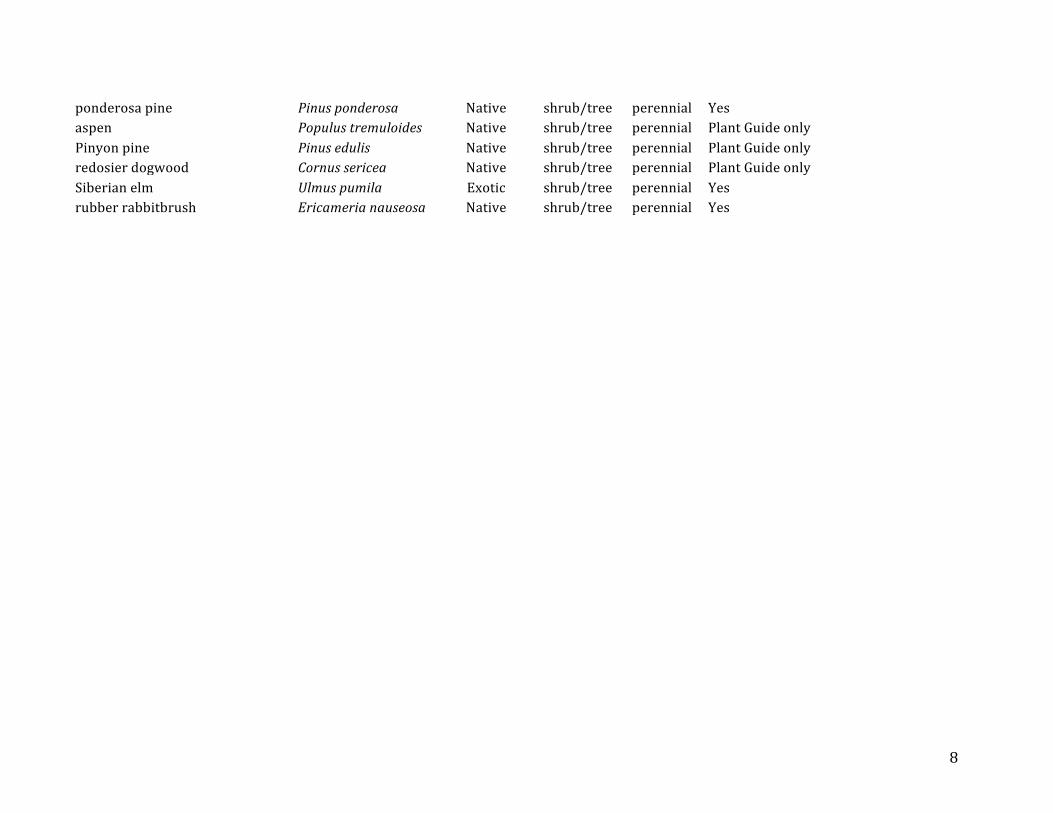
Appendix 1: Species List https://www.usanpn.org/nn/species_search
*Available from the USDA PLANTS database (http://plants.usda.gov/java/)
Common Name Latin Name Native or Exotic Lifeform Lifecycle Fact Sheet-‐Plant Guide
alkali sacaton Sporobolus airoides Native grass perennial Yes Arizona fescue Festuca arizonica Native grass perennial Yes Blue grama Bouteloua gracilis Native grass perennial Yes cheatgrass Bromus tectorum Exotic grass annual Plant Guide only deergrass Muhlenbergia rigens Native grass perennial Yes needle and thread Hesperostipa comata Native grass perennial Plant Guide only
sideoats grama Bouteloua curtipendula Native grass perennial Yes
western wheatgrass Pascopyrum smithii Native grass perennial Yes
butterfly milkweed Asclepias tuberosa Native forbs/herbs perennial Yes common dandelion Taraxacum officinale Exotic forbs/herbs perennial No common sunflower Helianthus annuus Native forbs/herbs perennial Plant Guide only common yarrow Achillea millefolium Native forbs/herbs perennial Yes scarlet gilia Ipomopsis aggregata Native forbs/herbs biennial No scarlet globemallow Sphaeralcea coccinea Native forbs/herbs biennial Plant Guide only yellow sweetclover Melilotus officinalis Exotic forbs/herbs all Plant Guide only
arroyo willow Salix lasiolepis Native shrub/tree perennial No big sagebrush Artemisia tridentata Native shrub/tree perennial Yes
blue elderberry Sambucus nigra ssp. Caerulea Native shrub/tree perennial Plant Guide only
boxelder Acer negundo Native shrub/tree perennial Plant Guide only curl-‐leaf mountain mahogany Cercocarpus ledifolius Native shrub/tree perennial No Gambel's oak Quercus gambelii Native shrub/tree perennial No
8
ponderosa pine Pinus ponderosa Native shrub/tree perennial Yes aspen Populus tremuloides Native shrub/tree perennial Plant Guide only Pinyon pine Pinus edulis Native shrub/tree perennial Plant Guide only redosier dogwood Cornus sericea Native shrub/tree perennial Plant Guide only Siberian elm Ulmus pumila Exotic shrub/tree perennial Yes rubber rabbitbrush Ericameria nauseosa Native shrub/tree perennial Yes

Phenology in Your Backyard: A Guide to Developing Your Own Phenology Garden
Developed by The Arboretum at Flagstaff As part of a Nina Mason Pulliam Charitable Trust Grant
2015
2
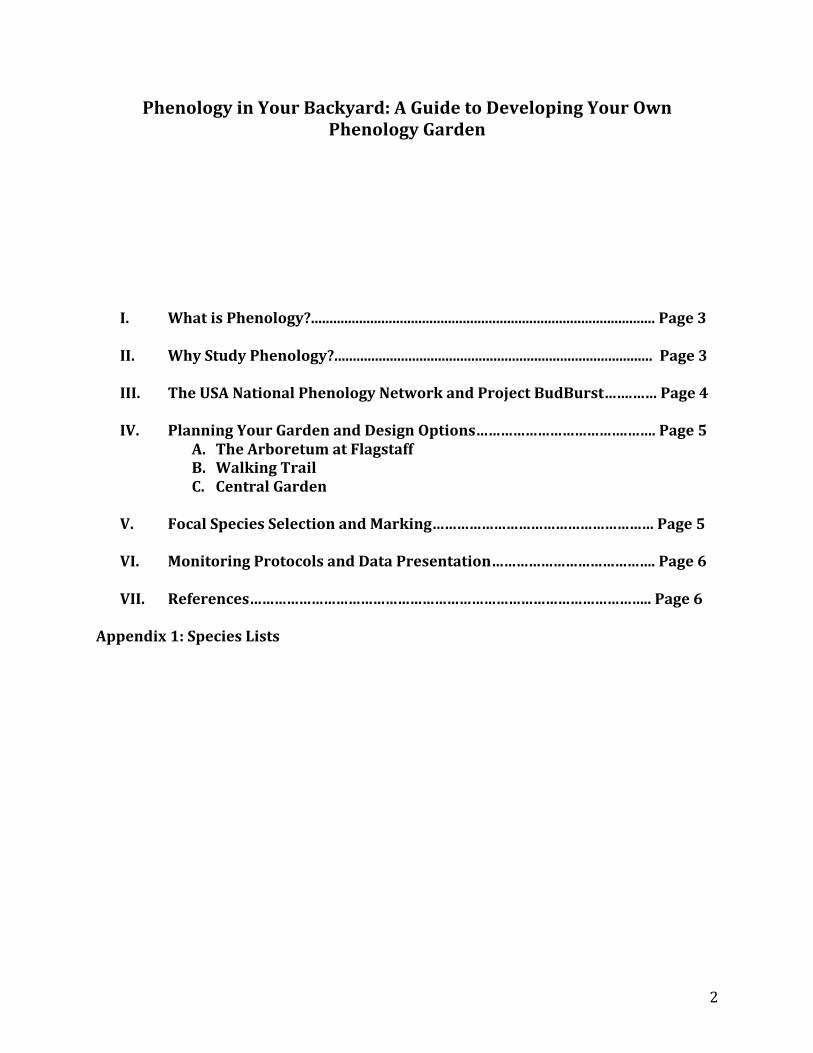
Phenology in Your Backyard: A Guide to Developing Your Own Phenology Garden
I. What is Phenology?............................................................................................. Page 3
II. Why Study Phenology?...................................................................................... Page 3
III. The USA National Phenology Network and Project BudBurst…….…… Page 4
IV. Planning Your Garden and Design Options……………………………….……. Page 5 A. The Arboretum at Flagstaff B. Walking Trail C. Central Garden
V. Focal Species Selection and Marking……………………………………………… Page 5
VI. Monitoring Protocols and Data Presentation…………………………………. Page 6
VII. References…………………………………………………………………………………….. Page 6
Appendix 1: Species Lists

3
I. What is Phenology? “Phenology refers to key seasonal changes in plants and animals from year to—such as flowering, emergence of insects and migration of birds—especially their timing and relationship with weather and climate.” – The USA National Phenology Network The word phenology is derived from “phenomenon”, meaning an occurrence or circumstance that can be observed. Combined with the suffix “-‐logy”, meaning “to study,” we arrive at our currently used term, which first dates back to the late 19th century. Using the power of observation and careful record keeping, scientists have been able to track changes in important biological events, like bird migration and bud burst, in association with changes in weather patterns. When a subject is studied over extended periods of time, and a long-‐term data set is developed, phenological events associated with a changing climate can be observed and tracked. This guide focuses on plant-‐based phenology, but because plants cannot be separated from their animal symbionts, we also suggest observation of pollinators and pests of focal plants. Inclusion of animal associates of your focal plants is also a great way to reinforce the concepts of food chains and food webs. II. Why Study Phenology? Someone once said that “timing is everything,” and for the study of important phenomena like bud burst and flowering this could not be more true. Perhaps it is easiest to visualize the importance of phenology by taking a closer look at what happens when a plant’s timing is earlier or later than usual. A classic example which is frequently witnessed in Flagstaff, AZ, is the premature opening of leaf buds in the spring. Once the leaf bud breaks or bursts, the new leaf tissue is extremely vulnerable to freezing temperatures. A late frost can completely ruin a tree’s flush of leaves, requiring the tree to send out a second flush of leaves, which costs the tree valuable resources in terms of energy use. Alternately, if a tree break its leaf buds later than usual, insects that would ordinarily feed on new leaves will go hungry, consequently causing their populations to decrease, which can then affect the ability of birds to feed their hungry young. What triggers events like bud break and flowering? The answer to this question is not simple, but typically plant phenological traits are triggered by environmental cues, specifically temperatures and moisture levels. Both temperature and precipitation are critical components of climate, thus, as our climate changes, so will the timing of these events. Over the past century, human activities have released large amounts of carbon dioxide and other greenhouse gases into the atmosphere. Greenhouse gases act like a blanket around Earth, trapping energy in the atmosphere and causing it to warm. This is a natural phenomenon called the “greenhouse effect” and it is necessary to support life on Earth. However, the buildup of too many greenhouse gases (“enhanced greenhouse effect”) can change Earth's climate, resulting in negative effects on human health and welfare and

4
ecosystem function. Right now, the southwestern USA is experiencing one of the highest levels of climate change impacts in North America and has become a nexus for climate change research and study. The study of phenology can provide important evidence that our climate is changing and reveal trends in how our environment is responding to the changing climate. For example, The U.S. Environmental Protection Agency (EPA, 2014) has identified a set of important indicators that describe trends related to the causes and effects of climate change. Among these are an index of leaf and bloom dates and documented observations in changes in the length of growing season. Anyone who has tried to grow a vegetable garden in northern Arizona knows how important length of growing season can be! Ecological studies, including phenology, often reveal disturbances in food webs. III. USA National Phenology Network and Project BudBurst The development of the USA National Phenology Network is credited to the U. S. Geological Survey, but many individuals and organizations have contributed to its continued growth and success, including The University of Arizona. So, what is the USA-‐NPN?
“The Network is a consortium of organizations and individuals that collect, share, and use phenology data, models, and related information to enable scientists, resource managers, and the public to adapt in response to changing climates and environments.” – U.S.G.S. Fact Sheet, 2011
The Network provides a very informative website (https://www.usanpn.org/node/35) that includes information on phenology indicators, educational and outreach materials, and how to become a participating Citizen Scientist. Through Nature’s Notebook (https://www.usanpn.org/natures_notebook), participating members can provide data for a national database where it will be used to make important local, regional, and even global decisions regarding environmental management. The information and resources provided by the USA-‐NPN are invaluable and we highly encourage you to explore these sites prior to developing your own phenology garden. Project BudBurst began in 2007 by folks from the National Ecological Observatory Network and the Chicago Botanic Garden with funding from the National Science Foundation. Project BudBurst aims to “Engage people from all walks of life in ecological research by asking them to share their observations of changes in plants through the seasons." Project BudBurst operates within the broader scope of the USA-‐NPN, but caters to a slightly different audience. Similarly, you can find extremely helpful information on their website, http://budburst.org/home. The websites offers species lists, from which you can choose (http://budburst.org/plantstoobserve) and also offers the option of selecting your own species to add to the database. Other features of this program are very similar to the USA-‐
5
NPN program in that they offer help with learning how to observe, provide datasheets and a database to which you can submit data, and data visualization tools, but Project BudBurst is primarily focused on plants. IV. Planning Your Phenology Study: Design Options The key to a successful garden, of any type, is having a plan! Prior to establishing your garden or trail, it is important to have a few concepts on paper. Begin by deciding WHO will be the garden coordinator. This person or group of people will be responsible for making sure that the plan is followed, the garden or trail is maintained, and that data are collected and stored appropriately. It is also a good idea to designate other duties, for example, who will be in charge of watering to establish the garden? Who will be in charge of weeding (if weeds are not the target organism)? And so on. Next, decide HOW you will study phenology. Option A is to plan regular field trips to The Arboretum at Flagstaff to make observations using their established gardens. The pros of this option are that you do not need space for your own garden or resources to develop and maintain a garden, but the cons are that you need to expend resources in getting to and from The Arboretum at Flagstaff. Also, fewer observations will be made, but you might be able to examine more species. Option B is to develop a phenology garden trail. The USA-‐NPN website provides helpful information https://www.usanpn.org/node/21081 about this option. Typically, a phenology garden trail will fall along a walking path (loops work nicely), and will focus on species already growing there. The pros of this option are that you can likely find a path to use on your school property or nearby and that you will minimize expenses in establishing a new garden. The cons are that you may still need to use time to travel to the path and that you will have less choice in what you observe. Option C is to develop a phenology garden.. This option is the most resource intensive, but in the long run may be easier to maintain and utilize. For option C, the pros are that you will be able to walk outside your classroom and be at your study location. Your students can also take pride in helping with construction and ongoing maintenance of a school garden. The cons are that it will take some resources, including time, to develop and establish your school-‐based phenology garden. If you decide to go with option B or C, then you need to decide WHERE the garden or trail will be placed. Keep the following things in mind: 1) Locate the site close as you will visit it frequently, 2) choose a uniform, representative habitat to minimize variation due to site location, 3) select a reasonable size to maintain within your available resources. Sites should not be bigger than 15 acres. And 4) make sure you have permission to establish the garden or trail. If you are establishing a garden (Option C), you want to be sure the garden area is near a water source and has good open natural light. Easy access by students and caretakers is also essential. V. Focal Species Selection and Marking Once you have developed a garden plan, the next step is to select the focal species for observation and mark these plants so that you know which ones to return to each

6
observation period. If you choose plants along a nature trail, the number of plants you select should be determined by the amount of time you want to spend making observations. For example, do you want to spend a week-‐long unit studying them or just a class period? If you have planted a garden, you will need to consider what species will grow well in your selected garden site and soil type. Staff at The Arboretum at Flagstaff can assist you with this process. Appendix 1 lists species taken from the USA-‐NPN website that can be found/grown in the Flagstaff area. For those who are outside of the Flagstaff area, we suggest looking at the species list on the USA-‐NPN website to choose your focal species https://www.usanpn.org/nn/species_search. The key to any successful long-‐term monitoring project is making sure your plants are labeled clearly and that the labels do not come off! The Arboretum suggests using aluminum hang-‐tags that can wired onto a plant without hurting the plant. These tags hold up in the field environment very well, but will still need to be replaced periodically. The following website illustrates and provides pricing for the suggested tags, http://www.nationalband.com/nbtwrite.htm. VI. Monitoring Protocols and Data Presentation The USA-‐NPN website provides all of the tools that you will need to begin learning not only how to monitor but what to monitor in terms of different phenophases. We highly suggest joining Nature’s Notebook and participating in the training videos found here: https://www.usanpn.org/nn/guidelines/shared-‐sites. Logging your class’ data into Nature’s Notebook will provide a sense of importance to the work that has been done, and make an important contribution to a citizen science database. The website can also assist you with visualizing datasets for classroom instruction and interpretation; see the following page, https://www.usanpn.org/nn/connect/visualizations for more information. VII. References U.S. Environmental Protection Agency. 2014. Climate change indicators in the United States, 2014. Third edition. EPA 430-‐R-‐14-‐004. www.epa.gov/climatechange/indicators. U.S. Geological Survey. 2011. The USA National Phenology Network – Taking the Pulse of Our Planet. http://pubs.usgs.gov/fs/2011/3023.


![Development and Validity of a Questionnaire on ...downloads.hindawi.com/journals/bmri/2019/5382130.pdf · Questionnaire[]; and()cognitiveassessmenttoolsthat addressbehavioralattitudes,beliefs,andself-ecacy,suchas](https://img.dokumen.tips/doc/110x75/5fbcb34b9e94eb2912684ff7/development-and-validity-of-a-questionnaire-on-questionnaire-andcognitiveassessmenttoolsthat.jpg)
![PANAMA MINISTRY OF AGRICULTURAL DEVELOPMENT] … › ... › 2015 › 07 › 30 › Pests_List.pdf · MINISTRY OF AGRICULTURAL DEVELOPMENT] NATIONAL DIRECTIONOF PLANT HEALTH SPECIFIC](https://img.dokumen.tips/doc/110x75/5f04a35f7e708231d40ef6b0/panama-ministry-of-agricultural-development-a-a-2015-a-07-a-30-a.jpg)