Embed Size (px)
Citation preview
LESSON TITLE I Dream of Genome GRADE LEVELS 9-12 TIME ALLOTMENT 3 – 4 45-minute class periods OVERVIEW One of our strongest desires as humans is to know our roots – where we came from, and why we are the way we are. In recent years, we have been able to discover more information about ourselves than ever before, thanks to the sequencing of the human genome. Biologists, geneticists, historians and genealogists have all studied this fascinating and complex structure to find out what it can tell us about ourselves and our origins. This lesson, using clips from the PBS series FACES OF AMERICA, explores the various types of genetic information contained in the human genome. The Introductory Activity examines the structure and composition of chromosomes and DNA, and can be used as a review or introduction to the topic. Following that, students will participate in a hands-on activity reviewing basic Mendelian genetics and the difference between genotype and phenotype. Students will also learn about different ways of tracing ancestry through DNA, and apply that to patterns of human migration and genetic population sets known as haplogroups. In the Culminating Activity, students will develop methods for determining the genetic heritage of their class, school, or community. SUBJECT MATTER Life Science, Biology, Genetics LEARNING OBJECTIVES Students will be able to: • Identify chemical and structural properties of DNA; • Define “genotype” and “phenotype,” and explain the difference between the two; • Describe how Y-chromosome DNA and mitochondrial DNA are used to trace ancestry
and family lineage; • Recognize and identify discrete population groups and paths of human migration; • Develop a scientific investigation to determine the ethnic heritage of a large group of
people.

STANDARDS National Science Education Standards SCIENCE AS INQUIRY Content Standard A As a result of activities in grades 9–12, all students should develop: • Abilities necessary to do scientific inquiry
o Identify questions and concepts that guide scientific investigations. • Understandings about scientific inquiry
o Scientists usually inquire about how physical, living, or designed systems function. Conceptual principles and knowledge guide scientific inquiries. Historical and current scientific knowledge influence the design and interpretation of investigations and the evaluation of proposed explanations made by other scientists.
o Scientists rely on technology to enhance the gathering and manipulation of data. New techniques and tools provide new evidence to guide inquiry and new methods to gather data, thereby contributing to the advance of science. The accuracy and precision of the data, and therefore the quality of the exploration, depends on the technology used.
o Results of scientific inquiry—new knowledge and methods—emerge from different types of investigations and public communication among scientists. In communicating and defending the results of scientific inquiry, arguments must be logical and demonstrate connections between natural phenomena, investigations, and the historical body of scientific knowledge. In addition, the methods and procedures that scientists used to obtain evidence must be clearly reported to enhance opportunities for further investigation.
Life Science Content Standard C As a result of their activities in grades 9-12, all students should develop understanding of: • The cell
o Cells store and use information to guide their functions. The genetic information stored in DNA is used to direct the synthesis of the thousands of proteins that each cell requires.
• Molecular basis of heredity o In all organisms, the instructions for specifying the characteristics of the organism
are carried in DNA, a large polymer formed from subunits of four kinds (A, G, C, and T). The chemical and structural properties of DNA explain how the genetic information that underlies heredity is both encoded in genes (as a string of molecular ''letters") and replicated (by a templating mechanism). Each DN A molecule in a cell forms a single chromosome.
o Most of the cells in a human contain two copies of each of 22 different chromosomes. In addition, there is a pair of chromosomes that determines sex: a female contains two X chromosomes and a male contains one X and one Y chromosome. Transmission of genetic information to offspring occurs through egg and sperm cells that contain only one representative from each chromosome pair. An egg and a sperm unite to form a new individual. The fact that the human body is formed from cells that contain two copies of each chromosome—and therefore two copies of each gene—explains many features of human heredity, such as how variations that are hidden in one generation can be expressed in the next.
o Changes in DNA (mutations) occur spontaneously at low rates. Some of these changes make no difference to the organism, whereas others can change cells and
organisms. Only mutations in germ cells can create the variation that changes an organism's offspring.
• Biological evolution o The millions of different species of plants, animals, and microorganisms that live on
earth today are related by descent from common ancestors. MEDIA COMPONENTS Video: Clip 1: Frenetic Genetics This segment includes examples of the types of genetic information contained in the human genome – physical traits, behaviors, and propensity for diseases. Clip 2: All in the Family This segment details the process of documenting family history and tracing lineage back through maternal and paternal lines. Clip 3: Migration Sensations This segment details the process of human migration through haplogroups, and shows the haplogroups of some of the series’ guests. Clip 4: A Piece of the Pie This segment covers what DNA can tell us about our ethnic identities that regular genealogy might not. Websites: NOVA Online | Cracking the Code of Life | Journey into DNA http://www.pbs.org/wgbh/nova/genome/dna_flash.html This interactive explores the structure of DNA, and DNA’s relationship to the human body as a whole. National Geographic Genetic Signposts https://genographic.nationalgeographic.com/genographic/lan/en/signposts.html An online interactive developed for the Genographic Project that explains the different types of DNA passed down through generations. Tracing Ancestry with mtDNA http://www.pbs.org/wgbh/nova/neanderthals/mtd_flash.html This chart shows the genetic relationships between 16 individuals over six generations. Population Genetics https://genographic.nationalgeographic.com/genographic/lan/en/population.html This online interactive shows users how DNA mutations affect future generations. Atlas of the Human Journey https://genographic.nationalgeographic.com/genographic/lan/en/atlas.html This interactive timeline provides a comprehensive overview of the major y-chromosome DNA and mtDNA haplotypes found in humans over the past 200,000 years.

MATERIALS For each student: • Journey into DNA Student Organizer • What’s Your Genotype? Student Organizer • Atlas of the Human Journey Student Organizer • Genetic Heritage Investigation Student Organizer • Computer, if available For each pair or group: • Computer, if not available for each student For the class: • Computer, projector, screen • Interactive whiteboard or overhead projector • Journey into DNA Student Organizer Answer Key • What’s Your Genotype? Student Organizer Answer Key • Atlas of the Human Journey Student Organizer Answer Key • Genetic Heritage Investigation Student Organizer Answer Key PREP FOR TEACHERS: Prior to teaching this lesson, you will need to: Preview all of the video segments and websites used in the lesson. Download the video segments used in the lesson to your classroom computer, or prepare to watch them using your classroom’s Internet connection. Make sure the Flash plug-in (available free at www.adobe.com) is downloaded and installed on each computer that you or your students will be using in the lesson. Bookmark the websites used in the lesson on each computer in your classroom. Using a social bookmarking tool such as del.icio.us or diigo (or an online bookmarking utility such as portaportal) will allow you to organize all the links in a central location. Print enough copies of each organizer for each student in your class, and print the answer keys for your reference. Note: In order to effectively conduct Learning Activity 3, class must have access to a computer lab or computers in the classroom. Students must be able to work at computers individually, in pairs, or in groups. INTRODUCTORY ACTIVITY 1. Begin by asking your students what they already know about DNA. (Answers will vary, based on grade level and curriculum. The basic answers that will likely come up are: DNA is contained in the nucleus, it is in a double helix (twisted ladder) structure, there are dominant and recessive genes for traits, every human cell has 2 sets of 23 chromosomes.) Tell your students, if it hasn’t been addressed in their answers, that DNA contains all of the genetic information that your body needs to develop and function. Explain that the genes and DNA are complex structures, and that the students will be exploring them more thoroughly using an online interactive. 2. Ask students to open the NOVA Online | Cracking the Code of Life | Journey into DNA interactive. (http://www.pbs.org/wgbh/nova/genome/dna.html) Depending on how many
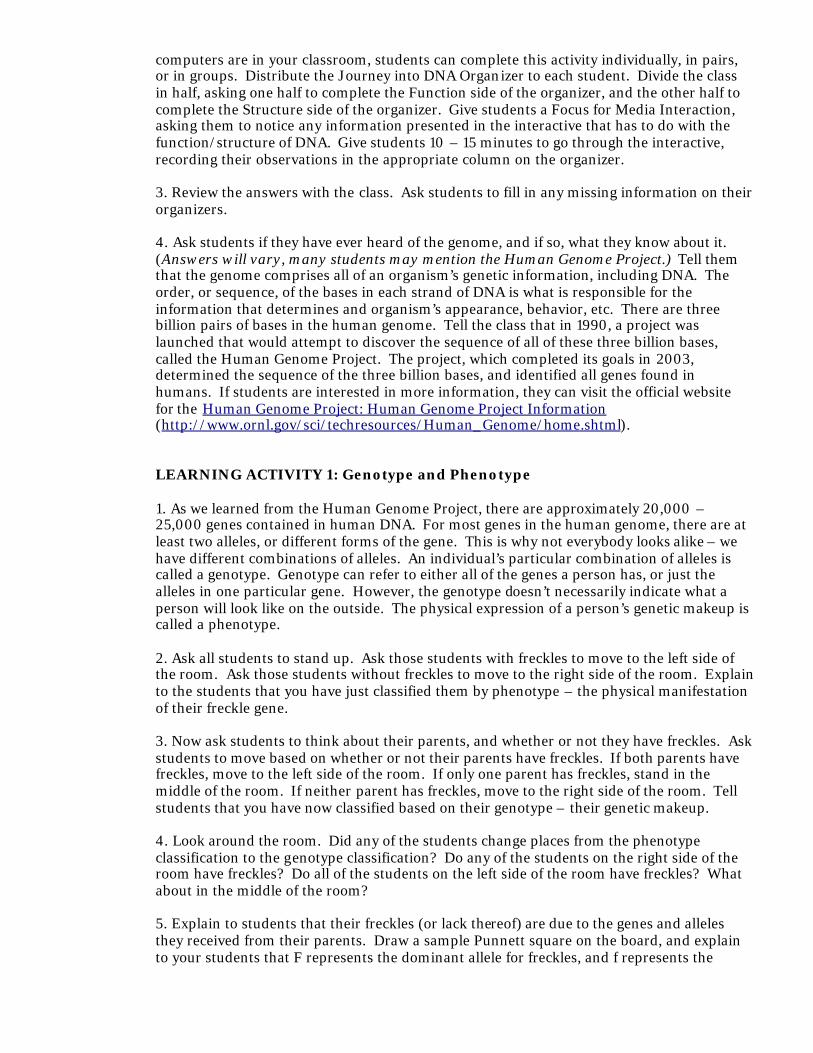
computers are in your classroom, students can complete this activity individually, in pairs, or in groups. Distribute the Journey into DNA Organizer to each student. Divide the class in half, asking one half to complete the Function side of the organizer, and the other half to complete the Structure side of the organizer. Give students a Focus for Media Interaction, asking them to notice any information presented in the interactive that has to do with the function/structure of DNA. Give students 10 – 15 minutes to go through the interactive, recording their observations in the appropriate column on the organizer. 3. Review the answers with the class. Ask students to fill in any missing information on their organizers. 4. Ask students if they have ever heard of the genome, and if so, what they know about it. (Answers will vary, many students may mention the Human Genome Project.) Tell them that the genome comprises all of an organism’s genetic information, including DNA. The order, or sequence, of the bases in each strand of DNA is what is responsible for the information that determines and organism’s appearance, behavior, etc. There are three billion pairs of bases in the human genome. Tell the class that in 1990, a project was launched that would attempt to discover the sequence of all of these three billion bases, called the Human Genome Project. The project, which completed its goals in 2003, determined the sequence of the three billion bases, and identified all genes found in humans. If students are interested in more information, they can visit the official website for the Human Genome Project: Human Genome Project Information (http://www.ornl.gov/sci/techresources/Human_Genome/home.shtml). LEARNING ACTIVITY 1: Genotype and Phenotype 1. As we learned from the Human Genome Project, there are approximately 20,000 – 25,000 genes contained in human DNA. For most genes in the human genome, there are at least two alleles, or different forms of the gene. This is why not everybody looks alike – we have different combinations of alleles. An individual’s particular combination of alleles is called a genotype. Genotype can refer to either all of the genes a person has, or just the alleles in one particular gene. However, the genotype doesn’t necessarily indicate what a person will look like on the outside. The physical expression of a person’s genetic makeup is called a phenotype. 2. Ask all students to stand up. Ask those students with freckles to move to the left side of the room. Ask those students without freckles to move to the right side of the room. Explain to the students that you have just classified them by phenotype – the physical manifestation of their freckle gene. 3. Now ask students to think about their parents, and whether or not they have freckles. Ask students to move based on whether or not their parents have freckles. If both parents have freckles, move to the left side of the room. If only one parent has freckles, stand in the middle of the room. If neither parent has freckles, move to the right side of the room. Tell students that you have now classified based on their genotype – their genetic makeup. 4. Look around the room. Did any of the students change places from the phenotype classification to the genotype classification? Do any of the students on the right side of the room have freckles? Do all of the students on the left side of the room have freckles? What about in the middle of the room? 5. Explain to students that their freckles (or lack thereof) are due to the genes and alleles they received from their parents. Draw a sample Punnett square on the board, and explain to your students that F represents the dominant allele for freckles, and f represents the
recessive allele for no freckles. Show an example of a square for a student who has freckles, and only has one parent with freckles. F F
f Ff Ff
f Ff Ff
Explain to students that their genotype is Ff, indicating that they should have freckles. Their phenotype matches their genotype, since they have freckles. Distribute the What’s Your Genotype? Student Organizer to each student, and ask them to fill in the Punnett square to determine their own genotype. 6. Explain to students that phenotype can be affected by other factors, and is not always aligned with genotype. For example, maybe neither of your parents have freckles, but when you were a child you spent a lot of time in the sun and developed some freckles. Your genotype is still ff, indicating that you are not genetically determined to have freckles, but your phenotype is different. 7. Explain to students that in the PBS series FACES OF AMERICA, Harvard University professor Dr. Henry Louis Gates, Jr. has his genome sequences, and gets to take a very close look at his genotype. Tell students that you are going to show them a clip from the series, reviewing some of the alleles and traits present in Dr. Gates. Give students a FOCUS FOR MEDIA INTERACTION by asking them to observe which variants mentioned in the clip relate to Gates’s genotype, and which describe his phenotype. PLAY clip “Frenetic Genetics.” When the clip has finished, ask students what Dr. Gates learned about his genotype (variants for lactose intolerance, epiphyseal development, no baldness, 1 sickle cell allele – both are required for the disease, no variant for early onset Alzheimers, resistance to malaria, high tolerance for caffeine). How did these genetic variants represented in Gates’s phenotype? (Slipped epiphysis resulting in fractured hip, hair texture and how much hair he’ll keep, inability to eat milk or ice cream.) 8. Your students have just heard many examples of different physical and behavioral traits, such as freckles, lactose intolerance, bone weakness, and propensity for diseases. Ask students to speculate why there are different alleles for these genes, or why there are differences or variations in these traits. (Answers will vary, encourage discussion among students.) LEARNING ACTIVITY 2 1. Now that we’ve learned what our genes tell us about ourselves, we can learn what our genes tell us about our ancestors. Explain to students that genetic research can be used in addition to paper records to determine one’s ancestry. Tell students that you are going to show them a clip from the public television series FACES OF AMERICA, in which host Henry Louis Gates, Jr. aims to uncover genealogical information about himself and his guests. Give students a Focus for Media Interaction by asking them to write down the attempts to trace ancestry seen in the clip, and note if they are through maternal or paternal lines. PLAY “All in the Family” clip. When clip is finished, review answers with the class. (Henry Louis Gates, Jr. attempting to find his second great-grandfather through paternal lines; Elizabeth Alexander tracing her ancestry through maternal lines to her 24th great-grandparents.) Ask students how they think geneticists are able to determine a person’s ancestry? (Answers may vary; engage the class in a discussion. Students should come to understand that if the same genes are present in people from different generations then it is likely that they are related – similar to the alleles for freckles being passed from parent to child.)
2. Project the National Geographic Genographic Project Genetic Signposts interactive (https://genographic.nationalgeographic.com/genographic/lan/en/signposts.html) on a screen or interactive whiteboard for the whole class. Students may follow along on personal computers if available. Click on the button that says “Show recombined DNA.” Explain that this is regular nuclear DNA – genes and alleles - that has been passed down from generation to generation. As indicated by the multicolored chromosomes of the son and daughter, their recombined DNA is a random assortment of the genes of their ancestors. Read or ask a student to read the text at the top of the page. 3. Explain that there are two types of DNA that are not shuffled randomly from generation to generation, and give definitions.
Y-chromosome DNA: nuclear DNA that is particular to the Y-chromosome. Since the Y-chromosome is only found in males and doesn’t combine with any other chromosomes, it is passed down virtually unchanged from father to son. Mitochondrial DNA: non-nuclear DNA found in cell organelles called mitochondria. mtDNA is found in both men and women but does not recombine, as any mtDNA contained in sperm cells is lost in the fertilization process. mtDNA is thus passed down virtually unchanged from mother to daughter.
4. Click on the button that says “Show non-recombined DNA.” Your students should clearly see how yDNA and mtDNA is passed down from generation to generation. As students can see, by using yDNA and mitochondrial DNA it is possible to find connections between people across generations. Explain to students that this information also allows people in the same generation to find genetic connections with each other as well. Project the Tracing Ancestry with mtDNA interactive (http://www.pbs.org/wgbh/nova/neanderthals/mtdna.html) on a screen or interactive white board, and ask students to follow on personal computers (or distribute printout to each student if computers are not available). Give students approximately 5 minutes to complete the activity. Remind students that while all of the people in the “great, great, great grandparents” generation are the ancestors of the current generation, only one shares mitochondrial DNA with everyone in the current generation. LEARNING ACTIVITY 3 1. yDNA and mtDNA can also be used to trace human ancestry on a grander scale. This is due to the fact that yDNA and mtDNA do experience changes occasionally. Go to the Population Genetics interactive (https://genographic.nationalgeographic.com/genographic/lan/en/population.html). Read or ask a student to read the text at the top of page 1. Click on the button that says “Click to Compare,” and ask students to find the mutation. Explain that these random mutations, when passed down through generations, become inheritable genetic markers. Go to page two of the interactive. Read or have a student read the text. Ask students to click through the interactive, asking them to pay attention to the number of genetic markers in each generation. When students have completed the interactive, ask the class for a definition of haplotype. (Combination of genetic markers.) Note that even when other markers appear, the original marker is still present. Explain that population groups sharing the same haplotype are called haplogroups. The study of haplogroups is valuable for tracing paths of human migration and development, in order to find common ancestors. Direct students to page five of the Population Genetics interactive. Read or ask a student to read the text at the top of the page. Ask students to click on the buttons to see the different divisions of haplogroups. 2. Tell students that you are going to show them a clip from the series FACES OF AMERICA, in which Dr. Henry Louis Gates, Jr. reveals the maternal (or mtDNA) haplogroups of three of his guests. Give students a FOCUS FOR MEDIA INTERACTION by
asking them to observe where the human population is thought to have originated, and how it spread over time. Play clip “Migration Sensations.” When the clip is finished, ask students where, according to the clip, human originated. (East Africa.). Following that, when and where did human populations spread? (East and north of Africa, in Southeastern Asia during the Ice Age, Central and East Asia and the Americas about 16,000 years ago, to Europe after the end of the last Ice Age.) 3. Tell students that you would now like them to explore human migratory paths, haplogroups, and common ancestors in more detail. Direct students to the Atlas of the Human Journey interactive, and distribute the Atlas of the Human Journey Student Organizer to each student in the class. Depending on how many computers are in the classroom, students can view the interactive in pairs or groups, but each student should complete the activity individually. Ask students to click on the right-most box in the timeline, 10 – 5,000 B.C. They can see that there are many haplogroups represented, both mtDNA and y-chromosome. Ask students to look at the map, and pick the haplogroup line that best corresponds to the area where they and their ancestors are from. (If any student cannot find an appropriate haplogroup, or they are not familiar with where their ancestors are from, they can choose one at random.) Ask the male students to pick a blue line, representing a y-chromosome haplogroup, and the female students to pick an orange line, representing an mtDNA haplogroup. When the line is clicked, a text box will appear with information about that haplogroup. Ask students to read the text, and fill in the appropriate information in the first box on their organizer. 4. Students should continue to trace their haplogroup lines back as far as they can, until they arrive at the spots on the map that read “Adam” (for y-chromosome haplogroups) or “Mitochondrial Eve” (for mtDNA haplogroups). It is possible that some students will need more than one organizer sheet to complete the activity, as there will be many different haplogroups in their line. Ask students to circle the information about the last haplogroup in their line. Give students 20 – 30 minutes to complete the activity, depending on how many students are working at each computer. 5. When the activity has been completed, ask the class the following questions to engage the class in discussion:
• What was the last haplogroup in your line? (Male students should answer Haplogroup A (M91); female students should answer Haplogroup L0 or L1.) How many years ago did that haplogroup originate? (Haplogroup A (M91) originated approx. 55,000 years ago, L0 and L1 originated approx. 150 – 170,000 years ago.) Ask students why they think the distribution of yDNA and mtDNA haplogroups is different? (Accept all answers and encourage discussion; explain to students that since mtDNA and y-chromosome DNA have different mutation rates the respective haplogroups divided and proliferated differently.)
• Was there anything that surprised you about your haplogroup’s path? Does your haplogroup appear in places that you didn’t expect?
CULMINATING ACTIVITY 1. Remind students that based on one’s haplotype or haplogroups, it’s conceivable that one could trace their ancestors and their lineage much further back than traditional genealogy would allow. Explain that this concept is the basis of the field of genetic genealogy, which aims to determine the genetic relationships between individuals and families over time. Tell students that there are many methods and tests that claim to be able to tell you your genetic ethnic heritage. One of these is called an admixture test, which reveals the geographical regions represented by your DNA markers. Tell students that they will be watching a clip from FACES OF AMERICA in which the series’ guests learn the results of their own

admixture tests. Give students a FOCUS FOR MEDIA INTERACTION by asking them to observe which geographic areas are represented in the admixture results. Play clip “A Piece of the Pie.” When the clip has finished playing, review the focus question with students and ask for their answers. (Europe, Asia, Africa.) Point out that in the clip, Dr. Gates states that according to the admixture results, “Asian and Native American are the same.” Ask students what they think the reason for that may be? (Native America populations migrated to America from Asia, so they would likely have the same genetic markers.) Explain that even the “indigenous Mexicans” that Eva Longoria mentions have ancestors from Asia, going back tens of thousands of years. 2. As we can see by the range of guests in FACES OF AMERICA, the paths of human migration continues to this day. None of the people in the clip identify as Native American, yet they all wound up living in America. Henry Louis Gates, Jr. set out to explore this stage of human migration by exploring how all of these individuals came to reside in America. Ask your students, what can you do in our community to explore the paths of human migration? How would you determine how everyone in the class/school/community came to be living not just in this country, but in this town or city? 3. Tell students that you would like them to develop an experiment or research model that would effectively trace the genetic heritage of the class/school/community. Distribute the Genetic Heritage Investigation Student Organizer, and tell students they are welcome to use this to construct their experiment. Divide students into pairs or groups to work on the project. Students should use the rest of the class period to work, and can complete the assignment over the course of the next day (or as many days as you choose to allot) as class work or homework. 4. As an assessment, have pairs/groups present their ideas to the class.
JOURNEY INTO DNA Student Organizer
Function Structure

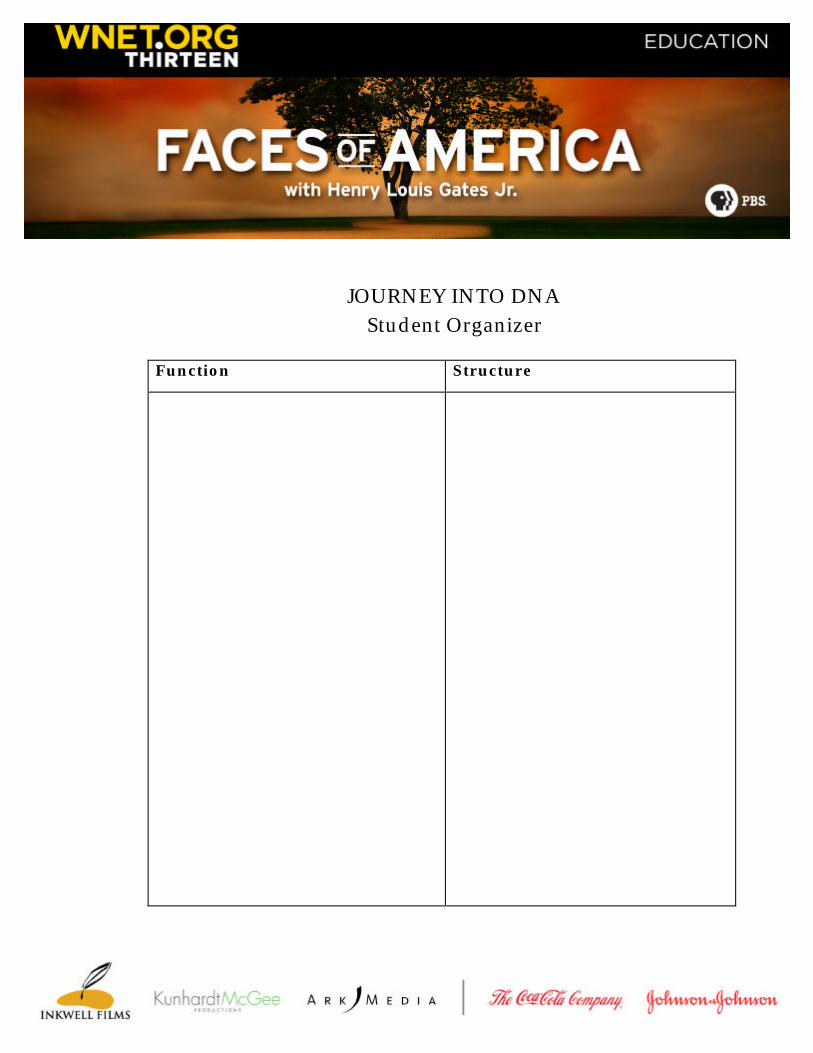
JOURNEY INTO DNA Answer Key
Function Structure
• Different cells have different functions.
Muscle cells contract, neurons (brain
cells) send and receive electronic
impulses, intestinal cells filter
nutrients out of food
• Differentiation or specialization of cells
• DNA can turn sections of information
on and off
• Nucleus is the control center of the cell,
it regulates cell growth, metabolism,
and reproduction
• 97% of DNA consists of non-coding or
non-functional sequences
• Genes determine eye color, height, etc.
they also determine how your cells
grow and interact with each other
• Histones have a positive charge, and
DNA has a negative charge, allowing
them to stick together
• Red blood cells have no nucleus or
nuclear DNA
• DNA has 4 bases, A, C, G, T
• The cells change to different forms
during embryonic development
• The nucleus is s sphere-like structure
surrounded by a membrane and the
genome is contained inside
• The genome contains 2 sets of 23
chromosomes
• Estimated 70,000 functional genes
• The chromosome is most visible during
mitosis
• Dark bands indicate areas where the
structure is dense. Each chromosome
has a unique banding patters, pairs
have identical banding
• Genes can range in length from 100
bases to several million bases
• There are 6 feet of DNA in the nucleus,
DNA bends and loops around
chromatin coils and resembles a
spring.
• Chromatin=proteins that help organize
the DNA molecule
• DNA is wrapped around protein
structures called histones.
• Nucleosome=segment of DNA wrapped
around histones
• Double helix structure
• Rungs of the double helix formed by 4
bases – Adenine, Cytosine, Guanine,
Thymine. A always pairs with T, C
always pairs with C.
• the sides of the double helix consist of
sugar and phosphate molecules.
• Nucleotide=sugar + phosphate + base
• 30+ atoms in 1 nucleotide
What’s Your Genotype? Student Organizer
Key: F = dominant allele (Freckles) f = recessive allele (no freckles) I have freckles: q YES q NO My mother has freckles: q YES q NO Genotype: ______ My father has freckles: q YES q NO Genotype: ______ Fill in the blanks based on your parents’ genotypes:
MO
THER
’S G
ENO
TYPE
FATHER’S GENOTYPE
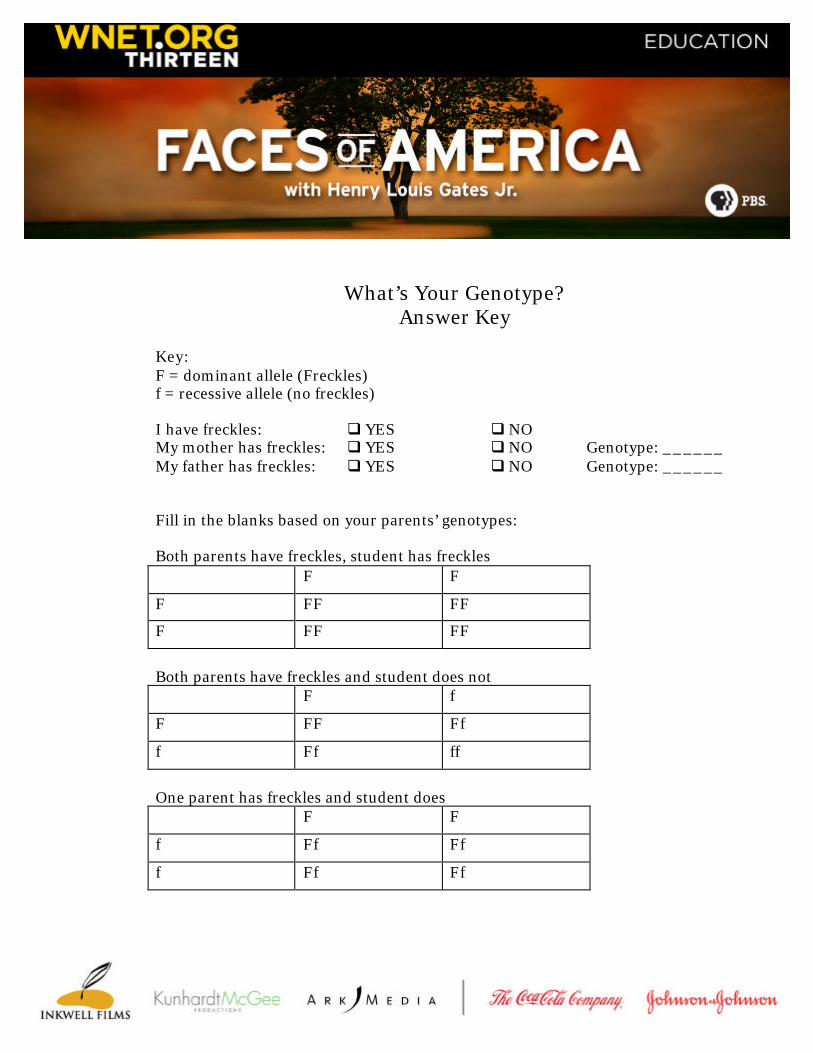
What’s Your Genotype? Answer Key
Key: F = dominant allele (Freckles) f = recessive allele (no freckles) I have freckles: q YES q NO My mother has freckles: q YES q NO Genotype: ______ My father has freckles: q YES q NO Genotype: ______ Fill in the blanks based on your parents’ genotypes: Both parents have freckles, student has freckles F F
F FF FF
F FF FF
Both parents have freckles and student does not F f
F FF Ff
f Ff ff
One parent has freckles and student does F F
f Ff Ff
f Ff Ff
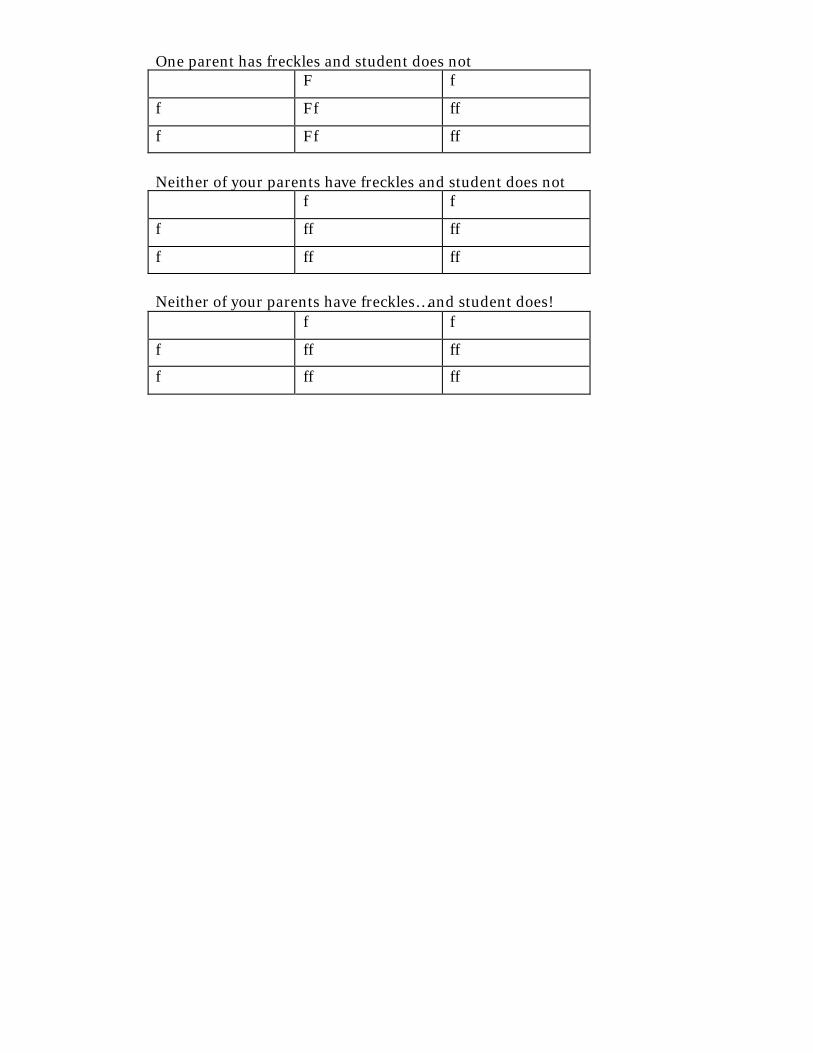
One parent has freckles and student does not F f
f Ff ff
f Ff ff
Neither of your parents have freckles and student does not f f
f ff ff
f ff ff
Neither of your parents have freckles…and student does! f f
f ff ff
f ff ff

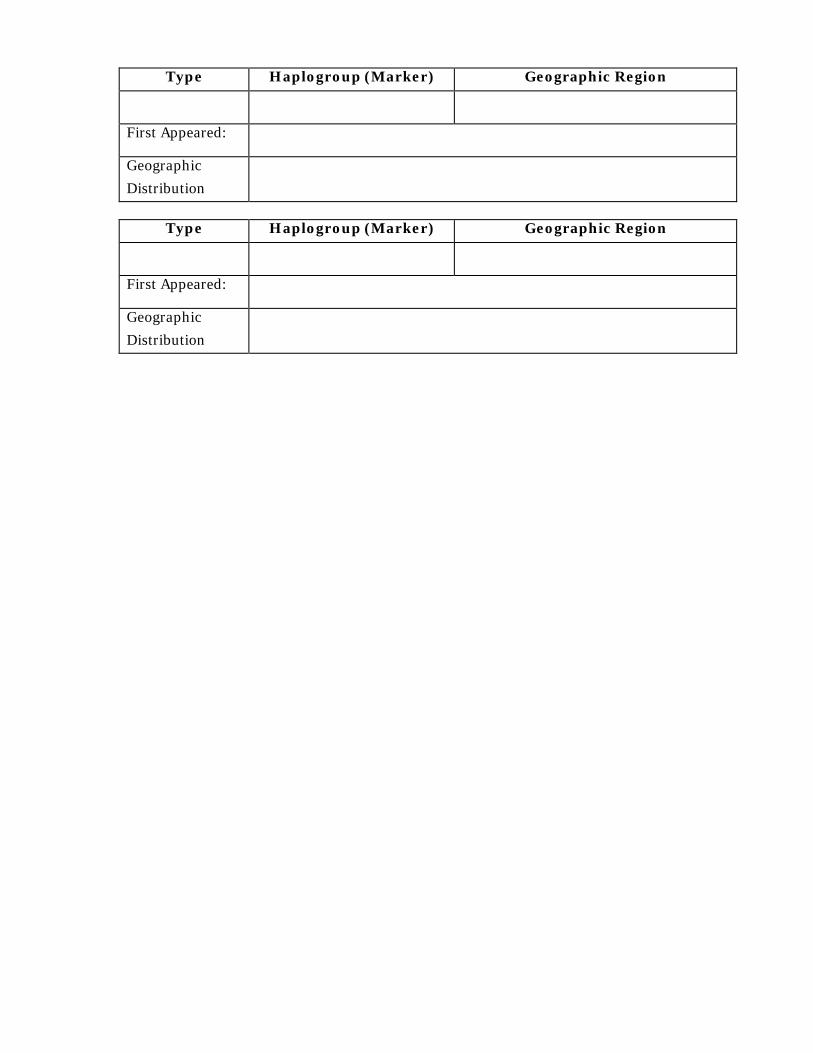
ATLAS OF THE HUMAN JOURNEY STUDENT ORGANIZER
Start at 10 – 5,000 B.C. Enter the information about your starting point:
Type Haplogroup (Marker) Geographic Region
First Appeared:
Geographic Distribution
Continue to trace this line as far back as it goes. You m ay use a second page if necessary.
Type Haplogroup (Marker) Geographic Region
First Appeared:
Geographic Distribution
Type Haplogroup (Marker) Geographic Region
First Appeared
Geographic
Distribution
Type Haplogroup (Marker) Geographic Region
First Appeared:
Geographic
Distribution
Type Haplogroup (Marker) Geographic Region
First Appeared:
Geographic
Distribution

ATLAS OF THE HUMAN JOURNEY ANSWER KEY
Start at 10 – 5,000 B.C. Enter the information about your starting point: Type Haplogroup (Marker) Geographic Region
y chromosome D2 (P37.1) Japan
First Appeared: 30,000 years ago
Geographic Distribution
Japan, southeast Asia
Continue to trace this line as far back as it goes. You may use a second page if necessary. Haplogroup (Marker) D (M174)
First Appeared: 50,000 years ago
Geographic
Distribution
coastline of Africa, Arabian peninsula, India, Sri Lanka, southeast Asia
Haplogroup (Marker) YAP
First Appeared: 50,000 years ago
Geographic
Distribution
northeast Africa
Haplogroup (Marker) M168
First Appeared: 31,000 and 79,000 years ago
Geographic Distribution
Ethiopia, Sudan (the first surviving wave out of Africa)
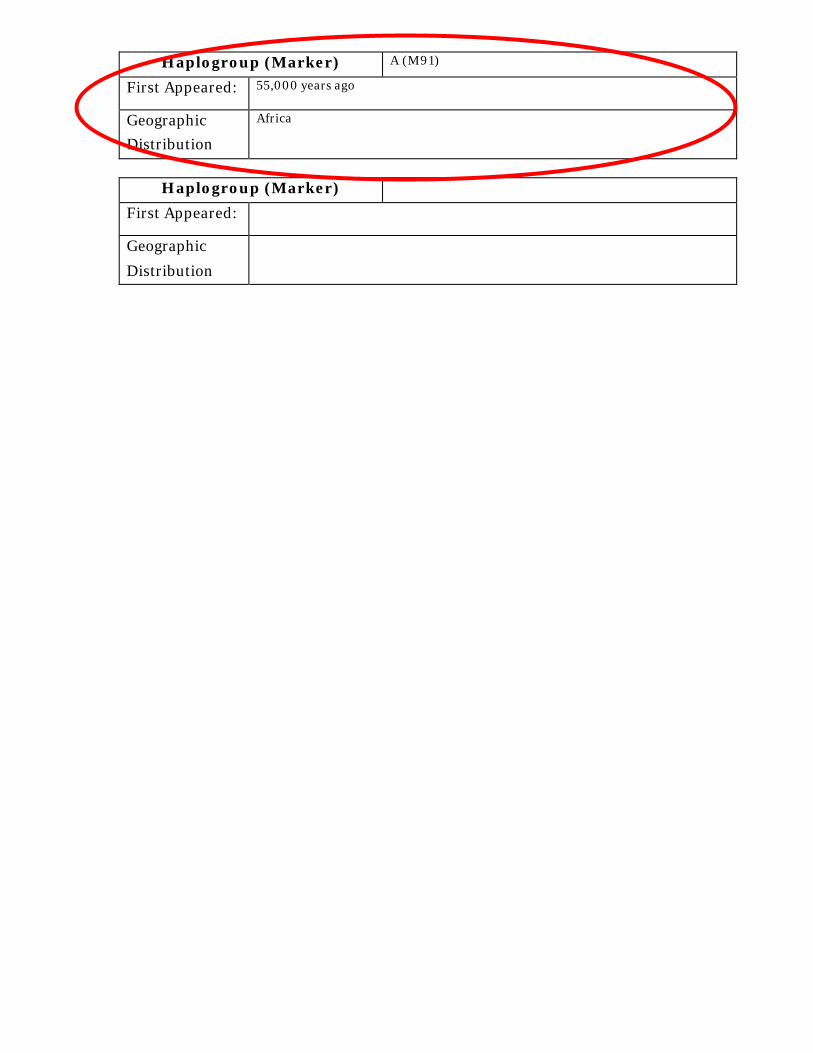
Haplogroup (Marker) A (M91)
First Appeared: 55,000 years ago
Geographic Distribution
Africa
Haplogroup (Marker)
First Appeared:
Geographic
Distribution

GENETIC HERITAGE INVESTIGATION STUDENT ORGANIZER
Title: What will you call this investigation? Statement of Purpose: What are you trying to achieve with this investigation? What question(s) are you trying to answer? Are there any existing thoughts or observations that have an impact on what you are trying to accomplish? Hypothesis: What do you think the conclusion of this investigation will be? Can this potential conclusion be tested using your outlines procedure? Materials: List any and all materials, including websites and other media elements, needed for this investigation.

Procedure: Provide a thorough, step-by-step plan for conducting this investigation.

SUGGESTED WEBSITES The following websites contain information that may be useful when planning your investigation. Genome Programs of the U.S. Department of Energy http://genomics.energy.gov/ The official page for government initiatives concerning the genome, including the Human Genome Project. Human Genome Project Information http://www.ornl.gov/sci/techresources/Human_Genome/home.shtml The official page for information about the Human Genome Project The International Society of Genetic Genealogy http://www.isogg.org/ This website, maintained by society members, contains a variety of resources for both newcomers to the field and seasoned genetic genealogists. World Haplogroups Map http://www.scs.uiuc.edu/~mcdonald/WorldHaplogroupsMaps.pdf PDF with maps and trees indicating the distribution of Y haplogroups and mtDNA haplogroups. The Genographic Project https://genographic.nationalgeographic.com/genographic/index.html The main page of National Geographic’s Genographic Project - described as a “landmark study of the human journey” – has links to a variety of information and interactives. The Phillips DNA Project http://www.phillipsdnaproject.com/ A family’s effort to trace their ancestry and lineage through many different means. Ancestry.com http://www.ancestry.com Popular site for building traditional family trees, with a wealth of genealogical information. Immigration Explorer http://www.nytimes.com/interactive/2009/03/10/us/20090310-immigration-explorer.html This interactive map shows the patterns of foreign-born groups settling in the United States since 1990.