Embed Size (px)
Citation preview

1
GRADE GAP/FUTURE GAP:
ADDRESSING RACIAL DISPARITIES IN L&S INTRODUCTORY COURSES
Report of the Equity and Diversity Committee of the College of Letters and Science
to Dean Gary Sandefur and the College Community
May 2010
Committee Members
Deborah Brandt (English), Chair
Judith Burstyn (Chemistry)
Vera Crowell (Office of the Dean, L&S)
Jeffrey Henriques (Psychology)
Steven Kosciuk (Student Academic Affairs, L&S)
Gloria Mari-Beffa (Mathematics)
Benjamin Marquez (Political Science)
Ruby Paredes (Assistant Vice Chancellor)
Adrienne Thunder (Cross-College Advising Service, L&S)
Eric Wilcots (Associate Dean, L&S; Astronomy)
DeVon Wilson (Assistant Dean & MDC, L&S)
2
GUIDE TO CONTENTS
EXECUTIVE SUMMARY .................................................................................................................................. 3
BACKGROUND: .............................................................................................................................................................. 3
FINDINGS ........................................................................................................................................................................ 3
RECOMMENDATIONS: ELIMINATE THE GRADE GAP IN KEY INTRODUCTORY COURSES BY 2014. ............ 4
INTRODUCTION .................................................................................................................................................. 5
THE GRADE GAP IN KEY INTRODUCTORY COURSES.................................................................. 6
CLIMATE GAPS AND GRADE GAPS ....................................................................................................... 12
THE PEER GAP ................................................................................................................................................... 13
THE ENGAGEMENT GAP ............................................................................................................................. 16
TEACHER ENGAGEMENT AND THE CLIMATE GAP ................................................................... 19
THE CONFIDENCE GAP ................................................................................................................................ 20
A FINAL FINDING ............................................................................................................................................. 21
RECOMMENDATIONS: ELIMINATE THE GRADE GAP IN KEY INTRODUCTORY
COURSES BY 2014 ...................................................................................................................................... 23
RECOMMENDATION # 1: CONVENE A TASKFORCE FOR THE ELIMINATION OF GRADE GAPS .................. 23
RECOMMENDATION # 2: DISSEMINATE INFORMATION ABOUT THE GRADE GAP TO FACULTY AND
INITIATE DISCUSSIONS AROUND STUDENT PERFORMANCE. .................................................................... 24
RECOMMENDATION # 3: PROVIDE INCENTIVES FOR DEPARTMENTS TO INNOVATE WITH CURRICULUM
AND COURSE STRUCTURES IN ORDER TO RAISE STUDENT ENGAGEMENT AND PERFORMANCE AND
REDUCE GRADE GAPS. REWARD DEPARTMENTS THAT IMPLEMENT RESULTS-ORIENTED,
SCALABLE STRATEGIES. .................................................................................................................................. 24
RECOMMENDATION # 4 SUPPORT THE DEPARTMENT OF MATHEMATICS IN IMPROVING GRADE
OUTCOMES FOR UNDER-REPRESENTED STUDENTS IN LOWER DIVISION MATH COURSES,
INCLUDING CALCULUS. ................................................................................................................................... 25
RECOMMENDATION # 5 FOCUS MORE TA PROFESSIONAL DEVELOPMENT ON INCLUSIVE EXCELLENCE. ............................................................................................................................................................................... 25
RECOMMENDATION # 6 OFFER TEACHING AWARDS FOR INCLUSIVE EXCELLENCE IN INTRODUCTORY
TEACHING ........................................................................................................................................................... 26
RECOMMENDATION # 7 FOCUS MORE INSTRUCTIONAL ATTENTION ON PEER RELATIONS IN
INTRODUCTORY COURSES. .............................................................................................................................. 26
RECOMMENDATION # 8 LINK THE ELIMINATION OF THE GRADE GAP IN INTRODUCTORY COURSES TO
EFFORTS TO ELIMINATE THE BROADER ACHIEVEMENT GAP. ...................................................................... 27
IN CONCLUSION: THE ACCOUNTABILITY GAP ............................................................................. 27
APPENDICES ....................................................................................................................................................... 28
APPENDIX 1: HOW THE SURVEYS WERE CONDUCTED ................................................................. 29
APPENDIX 2: SIX YEAR GRADUATION RATES .................................................................................... 30
APPENDIX 3: ACT ADJUSTED FINAL GRADES ..................................................................................... 31
APPENDIX 4: REPORTED STUDY TIME .................................................................................................... 32

3
Executive Summary
Background:
This report addresses the problem of the grade gap between non-targeted and targeted-
minority students in five key introductory L&S courses: Chemistry 103, Communication Arts 100,
English 100, Psychology 202 and Mathematics 112. In each course and at nearly every preparation
level—from least to most prepared—non-targeted students receive higher grades than their similarly
prepared targeted-minority counterparts. Indeed, targeted minority students who enter the university
with the highest ACT scores experience some of the widest grade disparities in relationship to their
majority counterparts. These discrepancies in educational outcomes create an aspiration gap—as
targeted minority students are shunted from desired majors and career paths and the university falls
short in its public promise to bring out the best in students regardless of race.
Specifically this report explores relationships between grade gaps and classroom climate. It is
based on a survey of more than 1700 first-year students and 75 of their instructors in the five focal
courses. The survey was administered in November 2009, and student survey responses were linked
to individual final grades. Our study required us to look at five courses that varied considerably by
academic discipline, format, and pedagogy. Our analysis focused in two areas: (1) significant
differences in reported experience between targeted and non-targeted students and (2) significant
differences in climate ratings reported by all students across the 5 focal courses.
Findings
1. Significant differences in grade outcomes by targeted and non-targeted status occurred in all
five courses. These differences occurred at both the bottom and the top of the grading scale
and at nearly every preparation level.
2. In courses with higher overall rates of adverse outcomes (i.e., grades below a C), gaps in
adverse outcomes between targeted and non-targeted students were more severe than they
were in courses with lower overall rates of adverse outcomes.
3. There was a small but significant difference in how targeted-minority and non-targeted
students rated classroom climate overall. Targeted-minority students rated the climate more
favorably.
4. Targeted minority students reported significantly higher rates of anxiety when they worked
academically with peers of other races and reported higher rates of unease in forming study
groups outside of class. Overall targeted-minority students were more likely to report the
learning environment in their introductory courses as competitive compared to non-targeted
students.
5. Compared to non-targeted students, targeted-minority students were more likely to report that
hurtful racial incidents and uses of racial stereotypes occurred in their classrooms.

4
6. Both targeted-minority and non-targeted students reported that their course learning was
influenced by a wide array of resources in and out of the classroom. Compared with non-
targeted students, targeted- minority students rated the impact of course organized groups;
learning centers and tutorials; small group activity; academic advisors; and tutors as having
significantly higher impact on their learning.
7. Climate ratings between the five courses differed significantly. Both targeted and non-
targeted students in Communication Arts 100 and English 100 reported significantly higher
levels of engagement and more positive relations with instructors than students in Psychology
202 or Mathematics 112, with Chemistry 103 in the middle.
8. Instructors in favorable-climate courses were significantly more likely to report making
greater efforts around teaching than instructors in courses with lower-climate ratings.
Instructors in favorable-climate courses were more likely to report that their instruction
needed improvement than instructors in courses with lower climate ratings.
Recommendations: Eliminate the grade gap in key introductory courses by 2014.
The following recommendations are designed to build a foundation for focal departments to
implement strategic action plans to eliminate racial grade gaps by 2014. These recommendations
also will help the Dean put in place a system of incentives to bring quick and steady annual
improvements. The recommendations call for small investments of money and large investments of
will power.
1) Convene a taskforce for the elimination of grade gaps.
2) Disseminate information about grade gaps to L&S faculty and initiate department-wide
discussions on student performance.
3) Provide incentives for departments to innovate with curriculum and course structures in
order to raise student engagement and performance and reduce grade gaps. Reward
departments that implement results-oriented, scalable strategies.
4) Support the Department of Mathematics in improving grade outcomes for underrepresented
students in lower division math courses, including Calculus.
5) Focus more TA professional development on inclusive excellence.
6) Create faculty and TA teaching awards for inclusive excellence in introductory teaching.
7) Focus more instructional attention on peer relations in introductory courses.
8) Link the elimination of the grade gap in introductory courses to efforts to eliminate the
broader achievement gap.
5
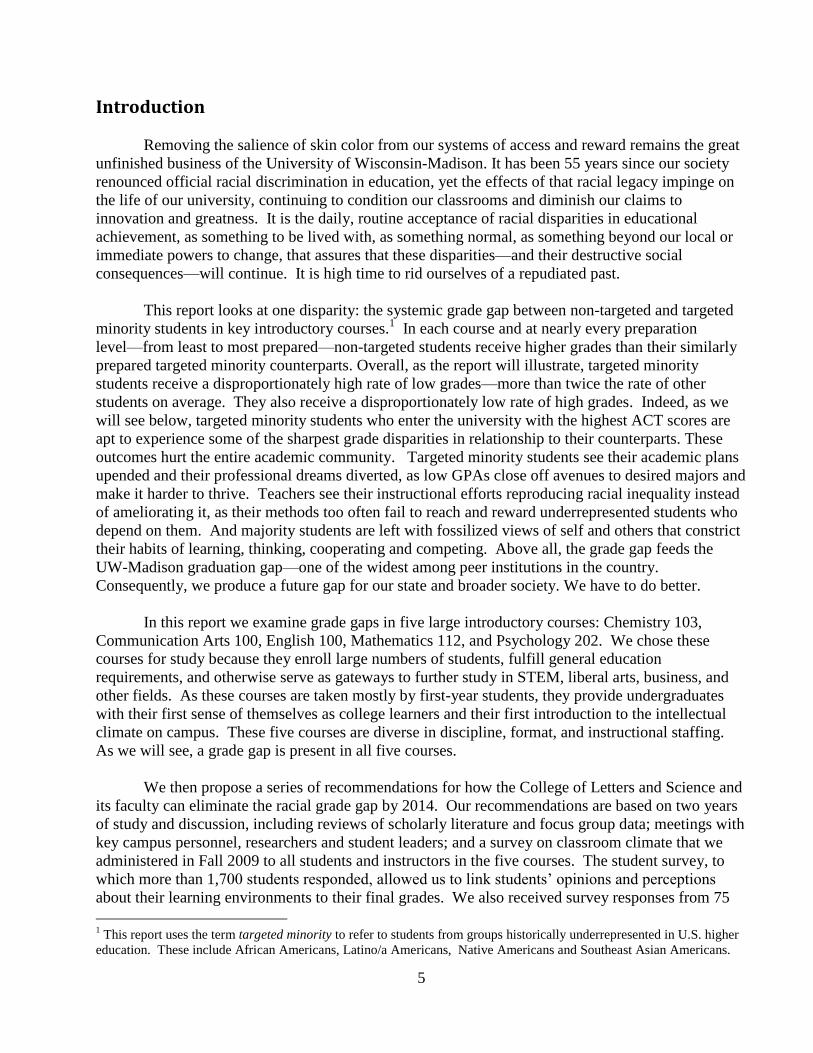
Introduction
Removing the salience of skin color from our systems of access and reward remains the great
unfinished business of the University of Wisconsin-Madison. It has been 55 years since our society
renounced official racial discrimination in education, yet the effects of that racial legacy impinge on
the life of our university, continuing to condition our classrooms and diminish our claims to
innovation and greatness. It is the daily, routine acceptance of racial disparities in educational
achievement, as something to be lived with, as something normal, as something beyond our local or
immediate powers to change, that assures that these disparities—and their destructive social
consequences—will continue. It is high time to rid ourselves of a repudiated past.
This report looks at one disparity: the systemic grade gap between non-targeted and targeted
minority students in key introductory courses.1 In each course and at nearly every preparation
level—from least to most prepared—non-targeted students receive higher grades than their similarly
prepared targeted minority counterparts. Overall, as the report will illustrate, targeted minority
students receive a disproportionately high rate of low grades—more than twice the rate of other
students on average. They also receive a disproportionately low rate of high grades. Indeed, as we
will see below, targeted minority students who enter the university with the highest ACT scores are
apt to experience some of the sharpest grade disparities in relationship to their counterparts. These
outcomes hurt the entire academic community. Targeted minority students see their academic plans
upended and their professional dreams diverted, as low GPAs close off avenues to desired majors and
make it harder to thrive. Teachers see their instructional efforts reproducing racial inequality instead
of ameliorating it, as their methods too often fail to reach and reward underrepresented students who
depend on them. And majority students are left with fossilized views of self and others that constrict
their habits of learning, thinking, cooperating and competing. Above all, the grade gap feeds the
UW-Madison graduation gap—one of the widest among peer institutions in the country.
Consequently, we produce a future gap for our state and broader society. We have to do better.
In this report we examine grade gaps in five large introductory courses: Chemistry 103,
Communication Arts 100, English 100, Mathematics 112, and Psychology 202. We chose these
courses for study because they enroll large numbers of students, fulfill general education
requirements, and otherwise serve as gateways to further study in STEM, liberal arts, business, and
other fields. As these courses are taken mostly by first-year students, they provide undergraduates
with their first sense of themselves as college learners and their first introduction to the intellectual
climate on campus. These five courses are diverse in discipline, format, and instructional staffing.
As we will see, a grade gap is present in all five courses.
We then propose a series of recommendations for how the College of Letters and Science and
its faculty can eliminate the racial grade gap by 2014. Our recommendations are based on two years
of study and discussion, including reviews of scholarly literature and focus group data; meetings with
key campus personnel, researchers and student leaders; and a survey on classroom climate that we
administered in Fall 2009 to all students and instructors in the five courses. The student survey, to
which more than 1,700 students responded, allowed us to link students’ opinions and perceptions
about their learning environments to their final grades. We also received survey responses from 75
1 This report uses the term targeted minority to refer to students from groups historically underrepresented in U.S. higher
education. These include African Americans, Latino/a Americans, Native Americans and Southeast Asian Americans.

6
instructors across the five courses, allowing us to consider their opinions and perceptions about their
preparation, effectiveness, practices, and values as teachers. (See Appendix 1 for a description of the
survey procedures.) Survey results show targeted and non-targeted students alike appreciate
educational supports on this campus. On the whole, they trust their instructors to do right by them.
Likewise, instructors express confidence in the ability of all of their students to excel, and they say
they prize inclusive pedagogical strategies. However, our study also turned up gaps in classroom
climate—in peer relations, student and instructor engagement, and students’ reported confidence—
that require our immediate attention. We also found that some courses more effectively than others
employ high-engagement pedagogies that lift the performance of all students. As we will see, the
findings of our study are not clear cut but rather complex and complicated, begging for follow-up by
the Dean, the Academic Planning Council, departments, program directors, and instructors. In our
recommendations we suggest avenues for such follow-up.
We submit this report well aware that other efforts are underway on campus to address the
racial achievement gap. These include initiatives by the Vice Provost for Diversity and Climate; the
Vice Provost for Teaching and Learning; the Academic Advancement Program and Pathways to
Excellence; as well as academic departments, including the Departments of Chemistry and
Mathematics. Continued efforts to invest in advising and the professional skills of advisors; to
coordinate services; strengthen the pre-college experience; build stronger academic bridges between
departments and student academic services; incorporate innovative pedagogy, and take successful
experiments to scale—-all have the potential to contribute to better and fairer academic outcomes for
all students. We also applaud the decision by the Madison Initiative for Undergraduates to fund an
expansion of the First Year Interest Groups (FIGS), a proven model of inclusive excellence.
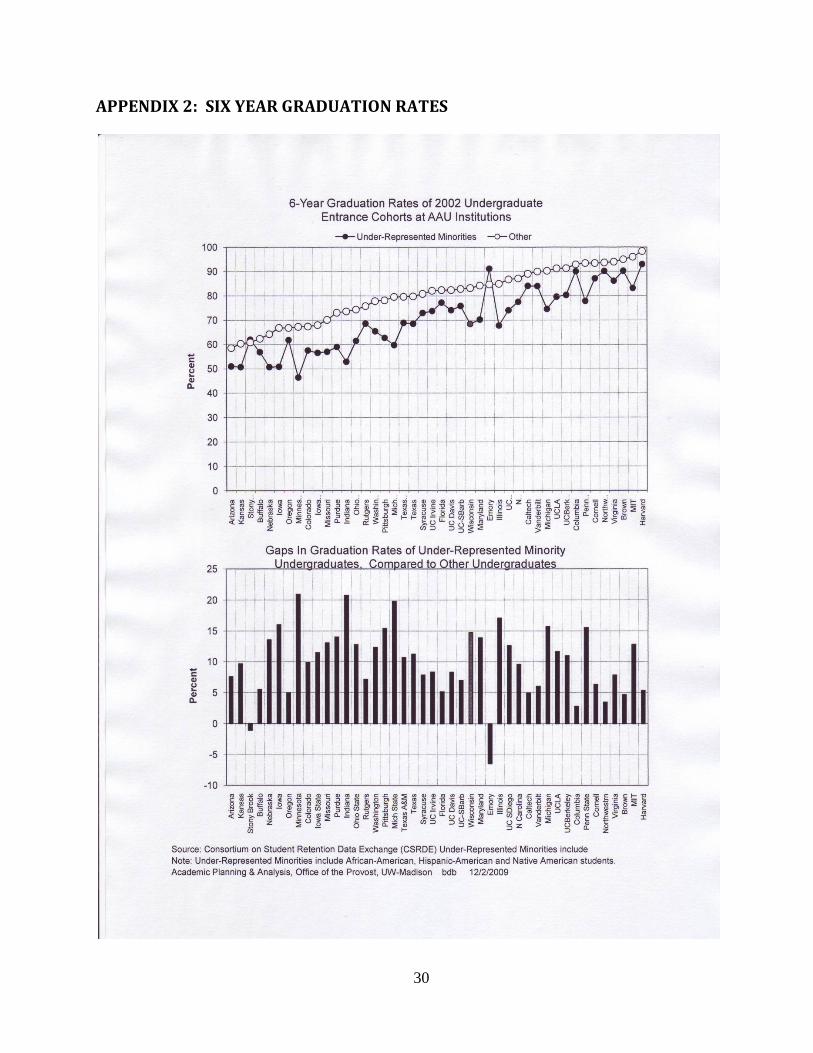
At the same time we submit this report well aware that while the University of Wisconsin-
Madison has been making some progress in increasing the graduation rate of targeted minority
students, we rank a disappointing 34th
among 44 other AAU institutions in closing the gap. (See
Appendix 2.) After six years, 83 out of 100 non-targeted students at UW-Madison will graduate, but
only 66 out of 100 targeted minority students will graduate. Only 58 out of 100 African American
and Native American students will graduate after six years. The consequences of these losses are
enormous when we ponder the small number of targeted minority students who matriculate on this
campus to begin with.
The L&S Committee on Equity and Diversity decided early in our investigations to focus
particularly on the role that classroom climate plays in the grade gap. We recognize that classroom
climate is not the full story. But we discovered very little research on this campus or nationally about
the role of the classroom environment in contributing to student performance gaps—even as we
collected anecdotal evidence of its impact. So while not the full story, classroom climate is an
important part of the story—and especially relevant to departments and their faculty who want to turn
their teaching toward inclusive excellence. The first step in that turn is facing the complex facts of
the grade gap itself.
The Grade Gap in Key Introductory Courses
We preface this discussion by acknowledging the diverse teaching, learning and disciplinary
conditions across the five courses in our focus. Psychology 202 is a large social-science lecture class

7
with no discussion sections. Chemistry 103 is a science lab course led by faculty with TAs
supervising labs and leading discussion sections. English 100 and Communication Arts 100 are
comprised of stand- alone, director-supervised, TA- taught sections, as is Mathematics 112. Some
courses use and study mathematical language; others use and study only natural language. The
instructional staffs differ as well in size and character: 5 permanent academic staff instructors in
Psychology; 11 Mathematics TAs; 30 Communication Arts TAs, 44 English TAs and 31 Chemistry
TAs. FTEs differ across the programs, as does the level and focus of TA professional development.
Grading policies and grade distributions vary as well—as do instructional priorities and practices.
Nevertheless, all these courses have something in common: sharp disparities in grade
outcomes by race. In all courses targeted minority students achieve lower grades than non-targeted
students at similar preparation levels.2 In each course, targeted minority students receive more of the
low grades and fewer of the high grades. Figure 1 captures the overall character of the grade gap
among students across all courses. Notice that while non-targeted students with top ACT scores
receive the highest grades, as the entrance test might predict, this is not the case for targeted minority
students with similarly high entrance scores. Indeed, their final grades match those of non-targeted
students who enter the university with the lowest ACT scores. Clearly we have performance
problems in key introductory courses—a disparity in how student potential converts to achievement
and reward.
FIG. 1Composite Final Grades Across ACT Scores In 5 Intro Courses Fall 2009
The next series of figures provides different perspectives on grade gaps within the five
courses. First, Fig. 2 shows final grades (unadjusted for preparation level). In other words, these are
the average grades that each group of students took forward as part of their GPAs at the end of the
Fall 2009 semester. Fig. 3 shows ACT adjusted final grades (by relevant math and verbal scores) in
order to demonstrate that disparity persisted even when we controlled for preparation level. These
disparities did not vary significantly by targeted group. (See Appendix 3 for a breakdown of final
grades by each targeted minority group.)
2 For purposes of this study preparation level means a student’s score on the ACT, a standardized entrance exam that is
designed to predict how well a student will perform academically in his or her first year of college.

8
FIG 2Unadjusted Final Grades in 5 Intro Courses Fall 2009
1
1.5
2
2.5
3
3.5
4
Chem Comm Arts English Math Psych
Ave
rage
Fin
al G
rad
e
Course
Non-Targeted Targeted
FIG. 3ACT Adjusted Final Grades in 5 Intro Courses Fall 2009
1
1.5
2
2.5
3
3.5
4
Chem Comm Arts English Math Psych
Fin
al G
rad
e
Course
Non-Targeted Targeted
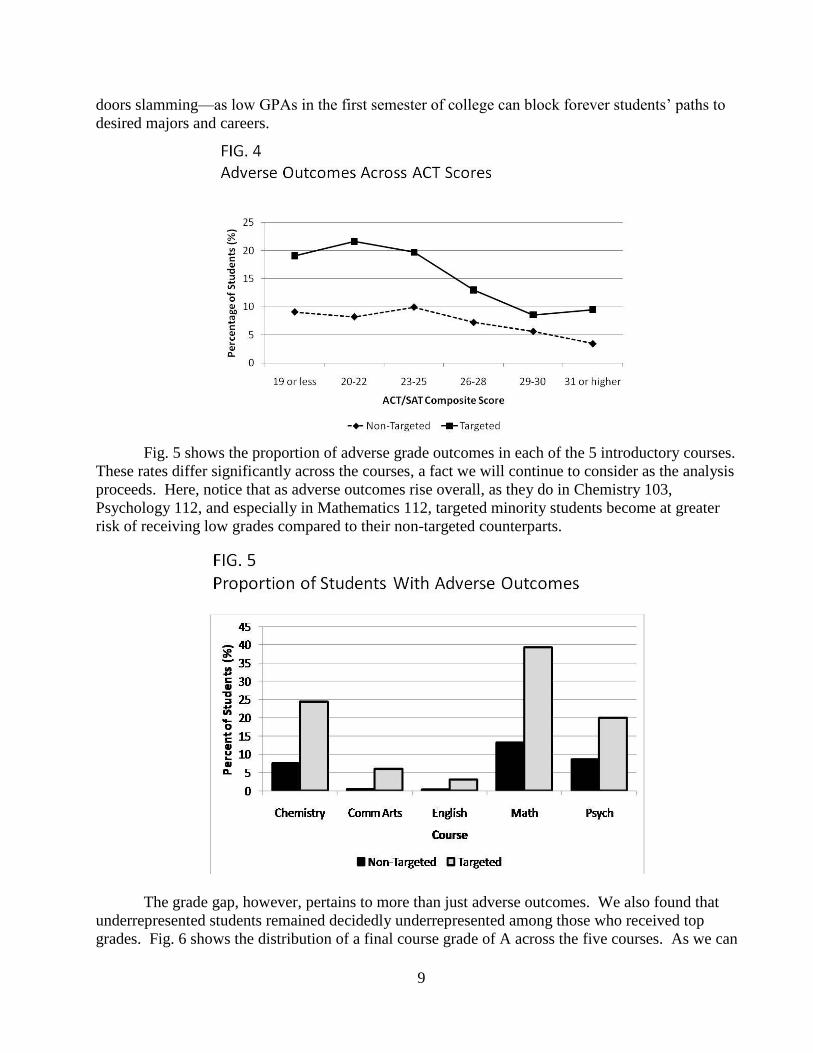
The next series of figures addresses one of the most consequential aspects of the grade gap:
the disproportionate number of adverse grade outcomes for targeted minority students enrolled in the
five courses.3 As we can see in Fig. 4, at almost all ACT levels, including the highest, targeted
minority students overall receive low grades at twice the rate or more of other students. Indeed
targeted minority students with the highest ACT scores experience more adverse outcomes overall
than non-targeted students with the lowest ACT scores. In these outcomes we can hear the sounds of
3 Adverse grade outcomes are defined as D, F, W(ithdrawal) or U(nsatisfactory)
9
doors slamming—as low GPAs in the first semester of college can block forever students’ paths to
desired majors and careers.
Fig. 5 shows the proportion of adverse grade outcomes in each of the 5 introductory courses.
These rates differ significantly across the courses, a fact we will continue to consider as the analysis
proceeds. Here, notice that as adverse outcomes rise overall, as they do in Chemistry 103,
Psychology 112, and especially in Mathematics 112, targeted minority students become at greater
risk of receiving low grades compared to their non-targeted counterparts.
The grade gap, however, pertains to more than just adverse outcomes. We also found that
underrepresented students remained decidedly underrepresented among those who received top
grades. Fig. 6 shows the distribution of a final course grade of A across the five courses. As we can

10
see, targeted minority students in Chemistry 103, English 100, and Psychology 202 were half as
likely to earn A’s as non-targeted students. Targeted students were 3 times less likely to earn A’s in
Mathematics 112 than non- targeted students. And in Communication Arts 100, targeted students
were 5 times less likely to earn A’s. As we know, students compete on the basis of GPA to gain
entrance to majors, pursue professional training, and benefit from other scholarly opportunities. So a
grade gap at the top also carries enormous consequences for students, their families and their
communities, not to mention our university, our professional fields and our society overall. We must
apprehend the reverberating effects of a persistent grade gap. If the university is to be a genuine
engine of opportunity, our teaching must become equally effective in bringing out the best in students
of all races.
FIG.6Proportion of Students Earning A’s Across 5 Intro Courses Fall 2009
0
10
20
30
40
50
60
Chemistry Comm Arts English Math Psych
Per
cent
of
Stu
den
ts (
%)
Course
Non-Targeted Targeted
As the committee worked with these data, we came to understand that different pedagogical
practices and priorities across the five courses resulted in different grade distributions. English 100,
for instance, uses a portfolio system by which students, with ample support from peers and
instructors, continue to revise, improve, and correct their written work throughout the semester.
Chemistry 103 and Mathematics 112, on the other hand, calculate grades by averaging the scores of
tests and other assignments. These differences no doubt account in part for the differing rates of
adverse outcomes across the five courses. Many fewer students in English 100 and Communication
Arts 100, for instance, experienced adverse outcomes than students in Chemistry 103 or Mathematics
112, a focus to which we return later. However, given these differences in grading distributions and
in order to fully understand disparities in grades by race, it was necessary to standardize final grades.
Fig. 7 provides the results of that adjustment, whereby 0 on the scale represents the grade average for
each particular course and the other values represent standard deviations away from that average.
Here we are better able to see sharp disparities in all five courses—as non-targeted students have
grades that hover at or above the course grade average and targeted minority students have grades
that drop sharply below the average. Fig. 8 presents these data when controlled for preparation level.

11
FIG. 7Standardized Final Grades in 5 Intro Courses Fall 2009
-1
-0.8
-0.6
-0.4
-0.2
0
0.2
Chem Comm Arts English Math Psych
Z T
ran
sfo
rme
d F
ina
l Gra
de
Course
Non-Targeted Targeted
FIG. 8ACT Adjusted Standardized Final Grades in Five Intro Courses, Fall 2009
-0.8
-0.6
-0.4
-0.2
0
0.2
0.4
Chem Comm Arts English Math Psych
Z T
ran
sfo
rme
d F
ina
l Gra
de
Course
Non-Targeted Targeted
To sum up, grade gaps by race occurred in all five courses that we studied. They occurred at
nearly every preparation level. Grade gaps occurred at the bottom of the grade scale and at the top of
the grade scale. Our instructional methods appear to lift and suppress student potential differently by
race. In the rest of the report, we will probe potential conditions in classrooms that might relate to
this discrepancy.

12
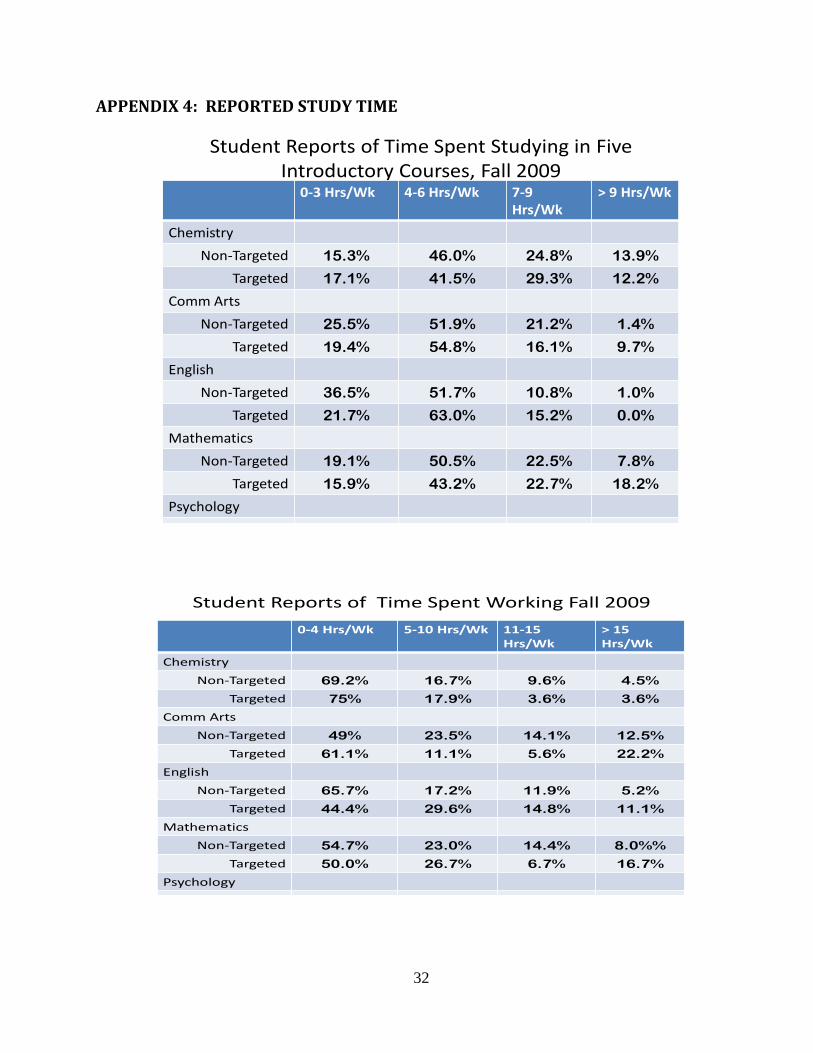
Before moving on, we observe that the survey established that the racial grade gap could not
be assigned to differences either in reported time studying or reported time working a job. In terms
of reported study time, we found no statistical differences between targeted and non-targeted students
across courses, except for Communication Arts 100, where targeted students were more likely to
report spending more than 9 hours a week on their studies. Most students reported studying between
4 and 9 hours a week for each course. No statistical differences emerged in reports of time spent
working. Most students reported working 10 or fewer hours a week. (See Appendix 4 for more
details.)
Climate Gaps and Grade Gaps
After we established the scope of the grade gap, the committee examined survey results for
differences in the reported classroom experiences of targeted and non-targeted students. The survey
asked students many questions having to do with their sense of peer and instructor relations, their
sense of fairness and validation, and their sense of ownership over their learning. Overall, as we see
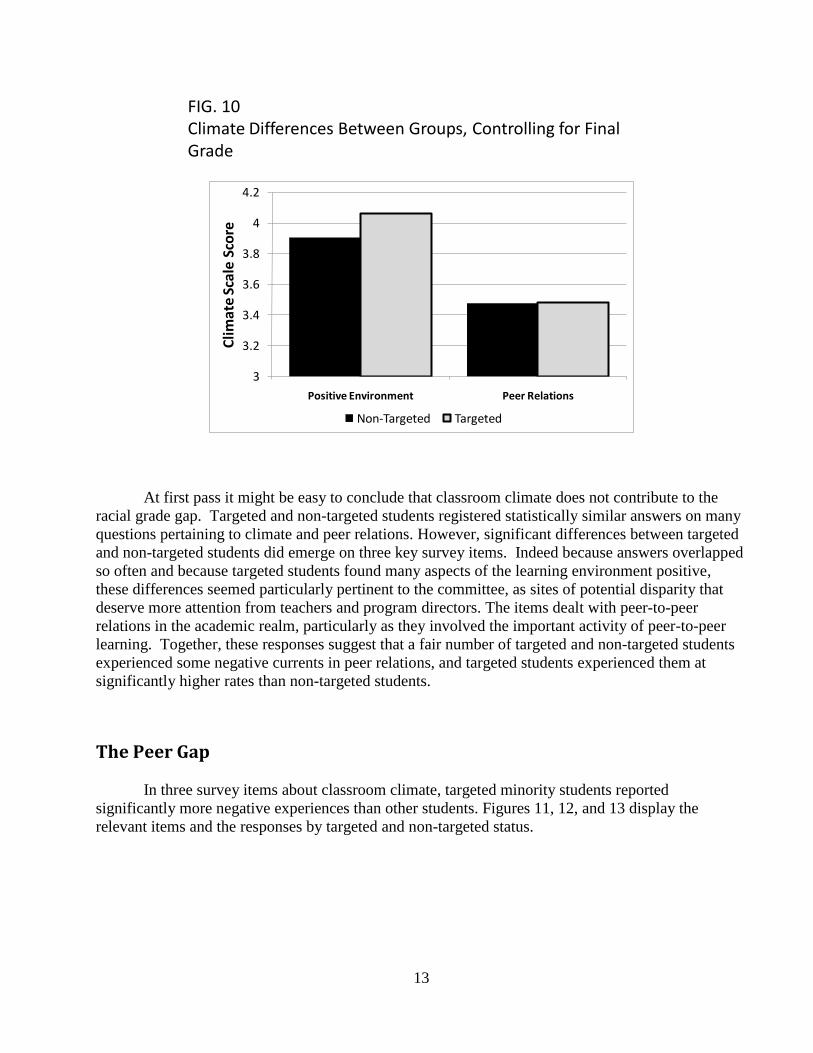
in Fig. 9, both groups rated classroom climate positively (scale is 1 to 5). In fact, targeted minority
students rated the climate significantly more highly than non-targeted students, even when controlling
for the possible effect of final grades on climate perceptions (Fig. 10). Both groups rated peer
relations less favorably than overall environment. The similar climate ratings by targeted and non-
targeted students generated much discussion and competing interpretations among committee
members—matters we continue to address in the analysis that follows. It was only by drilling down
into students’ answers to specific survey items that we found gaps in reported experience between
targeted and non-targeted students: gaps in peer relations, gaps in student and instructor engagement,
and gaps in confidence. These topics receive further scrutiny below.
,
FIG. 9Climate Differences Between Groups Aggregated by Instructor
3
3.2
3.4
3.6
3.8
4
4.2
Positive Environment Peer Relations
Clim
ate
Scal
e Sc
ore
Non-Targeted Targeted
Note. Positive Environment, 22 items, coefficient alpha = .934; Peer Relations, 9 items, .789Group * Dimension interaction F(1,76)=5.53, p < .025
13
FIG. 10Climate Differences Between Groups, Controlling for Final Grade
3
3.2
3.4
3.6
3.8
4
4.2
Positive Environment Peer Relations
Clim
ate
Scal
e S
core
Non-Targeted Targeted
At first pass it might be easy to conclude that classroom climate does not contribute to the
racial grade gap. Targeted and non-targeted students registered statistically similar answers on many
questions pertaining to climate and peer relations. However, significant differences between targeted
and non-targeted students did emerge on three key survey items. Indeed because answers overlapped
so often and because targeted students found many aspects of the learning environment positive,
these differences seemed particularly pertinent to the committee, as sites of potential disparity that
deserve more attention from teachers and program directors. The items dealt with peer-to-peer
relations in the academic realm, particularly as they involved the important activity of peer-to-peer
learning. Together, these responses suggest that a fair number of targeted and non-targeted students
experienced some negative currents in peer relations, and targeted students experienced them at
significantly higher rates than non-targeted students.
The Peer Gap
In three survey items about classroom climate, targeted minority students reported
significantly more negative experiences than other students. Figures 11, 12, and 13 display the
relevant items and the responses by targeted and non-targeted status.

14
FIG. 11I feel anxious about working on assignments with students of other races
0%
2%
4%
6%
8%
10%
12%
14%
16%
18%
20%
Chem Comm Arts English Math Psych
Perc
en
t A
gre
eme
nt
(%)
Non-Targeted Targeted
FIG. 12I feel comfortable asking other students in my class to meet outside of class to work on assignments
0%
10%
20%
30%
40%
50%
60%
70%
80%
Chem Comm Arts English Math Psych
Pe
rce
nt
Ag
ree
me
nt
(%)
Non-Targeted Targeted
15
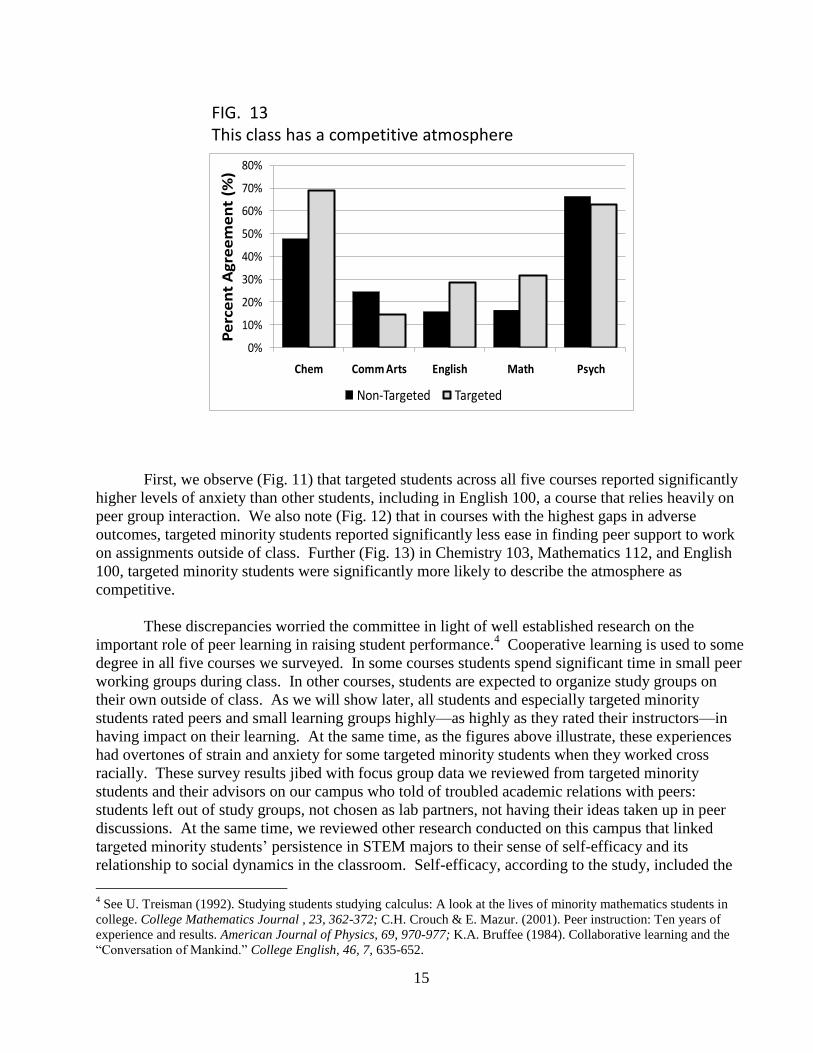
FIG. 13This class has a competitive atmosphere
0%
10%
20%
30%
40%
50%
60%
70%
80%
Chem Comm Arts English Math Psych
Pe
rce
nt
Ag
ree
me
nt
(%)
Non-Targeted Targeted
First, we observe (Fig. 11) that targeted students across all five courses reported significantly
higher levels of anxiety than other students, including in English 100, a course that relies heavily on
peer group interaction. We also note (Fig. 12) that in courses with the highest gaps in adverse
outcomes, targeted minority students reported significantly less ease in finding peer support to work
on assignments outside of class. Further (Fig. 13) in Chemistry 103, Mathematics 112, and English
100, targeted minority students were significantly more likely to describe the atmosphere as
competitive.
These discrepancies worried the committee in light of well established research on the
important role of peer learning in raising student performance.4 Cooperative learning is used to some
degree in all five courses we surveyed. In some courses students spend significant time in small peer
working groups during class. In other courses, students are expected to organize study groups on
their own outside of class. As we will show later, all students and especially targeted minority
students rated peers and small learning groups highly—as highly as they rated their instructors—in
having impact on their learning. At the same time, as the figures above illustrate, these experiences
had overtones of strain and anxiety for some targeted minority students when they worked cross
racially. These survey results jibed with focus group data we reviewed from targeted minority
students and their advisors on our campus who told of troubled academic relations with peers:
students left out of study groups, not chosen as lab partners, not having their ideas taken up in peer
discussions. At the same time, we reviewed other research conducted on this campus that linked
targeted minority students’ persistence in STEM majors to their sense of self-efficacy and its
relationship to social dynamics in the classroom. Self-efficacy, according to the study, included the
4 See U. Treisman (1992). Studying students studying calculus: A look at the lives of minority mathematics students in
college. College Mathematics Journal , 23, 362-372; C.H. Crouch & E. Mazur. (2001). Peer instruction: Ten years of
experience and results. American Journal of Physics, 69, 970-977; K.A. Bruffee (1984). Collaborative learning and the
“Conversation of Mankind.” College English, 46, 7, 635-652.
16
ability to work well with majority peers. Persistence in STEM majors was related to positive peer
academic relations.5
In our recommendations we return to the important matter of developing interactional skills
that support successful peer learning groups and positive cross-racial peer relations in classrooms.
Here we simply note that our survey data suggest that many targeted minority students may be
missing out on the benefits of supportive study groups and are having to manage disproportionate
levels of racial strain in some peer learning situations. We believe performance gains could be made
in all five courses if all students received better and franker instruction in cross-race communication
in academic settings, a point to which we return in the recommendations.
These peer-to-peer strains gain added contextual significance when put together with the
number of reports of hurtful racial incidents occurring during classes. In response to the survey item,
Hurtful racial incidents have occurred in this class, 42 students responded affirmatively, including 26
non-targeted students and 16 targeted students. Overall, hurtful racial incidents were reported by 14
percent of African American respondents; 7 percent of Latino respondents; 7 percent of non-targeted
Asian respondents; and 1 percent of white students. We also asked survey takers if students in their
classes used racial stereotypes one or more times (Item: In this class students use racial stereotypes.) Classmates’ use of racial stereotypes was reported by 13 percent of African American students; 12
percent of Latinos; 8 percent of targeted Asian students; 5 percent of non-targeted Asian students; 4
percent of Native Americans; 3 percent of Whites; and 11 percent of “not specified” respondents.
It is the committee’s view that one hurtful racial incident or one use of a racial stereotype is
one too many in a classroom. Here we wish mostly to observe how the negative force of racial
segregation in our wider society pushes into peer-to-peer academic relations, making classrooms ripe
for unequal levels of comfort, trust, mutual support, inclusion, awareness, and self-efficacy. These
inequalities degrade the quality of learning in tangible ways. The habits of racial segregation that
continue to plague the wider society—and the interactional ineptitudes they can create—must be
addressed in the classroom for what they are: a drag on everyone’s learning. Closing the peer gap
must be part of closing the grade gap.
The Engagement Gap
In this section we treat one of the most complicated issues raised by our survey findings: the
relationship of climate to the matter of adverse grade outcomes. As we saw earlier, adverse outcomes
for targeted minority students in Communication Arts 100 and English 100 were less severe than
those in Chemistry 103, Psychology 202, and Mathematics 112 (and have been historically). Yet our
findings led to no simple conclusions regarding low grades and negative climate reports. For
example, in Chemistry 103 and Mathematics 112, courses that exhibited severe gaps in adverse
outcomes, we found that targeted minority students receiving low grades reported higher levels of
validation and other positive aspects of classroom climate than other students with higher final
grades. Moreover, within a given course, on many of the climate dimensions there was little contrast
in the student responses across racial demographics.
5 See Angela Byars-Winston et al. (2008). Increasing STEM retention for underrepresented students: Factors that matter.
Research Brief. Center for Education and Work. Nov. www.cew.wisc.edu
17
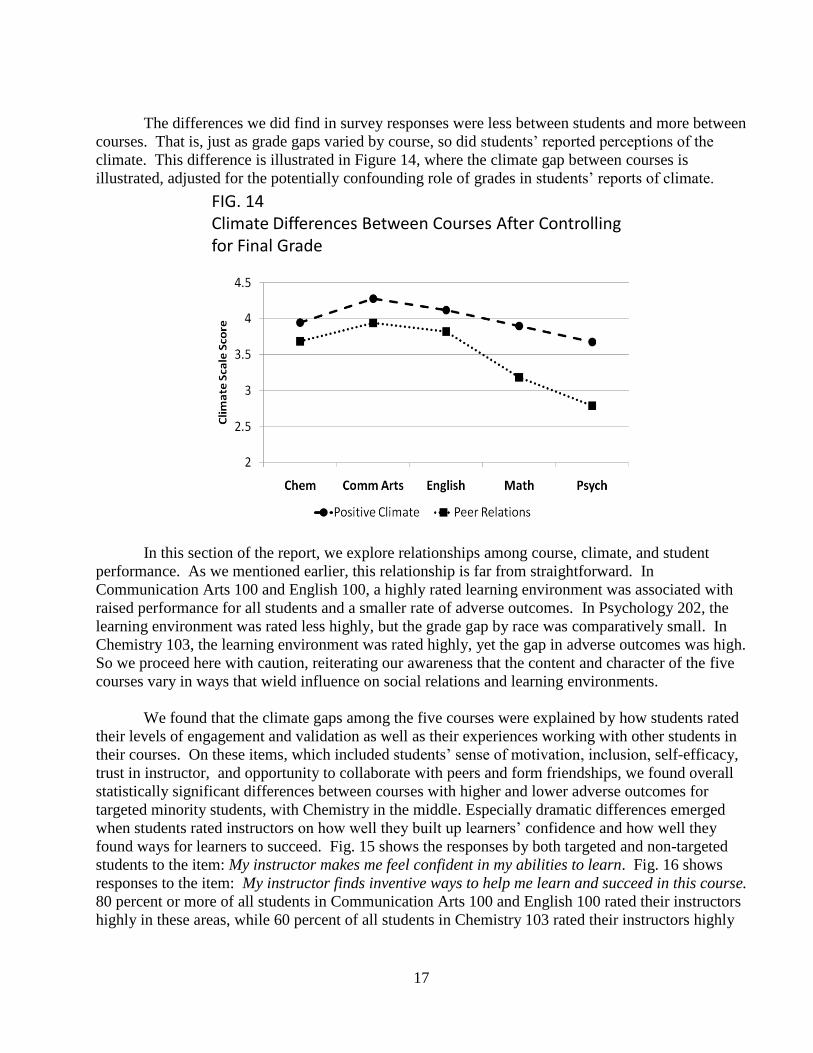
The differences we did find in survey responses were less between students and more between
courses. That is, just as grade gaps varied by course, so did students’ reported perceptions of the
climate. This difference is illustrated in Figure 14, where the climate gap between courses is
illustrated, adjusted for the potentially confounding role of grades in students’ reports of climate.
FIG. 14Climate Differences Between Courses After Controlling for Final Grade
In this section of the report, we explore relationships among course, climate, and student
performance. As we mentioned earlier, this relationship is far from straightforward. In
Communication Arts 100 and English 100, a highly rated learning environment was associated with
raised performance for all students and a smaller rate of adverse outcomes. In Psychology 202, the
learning environment was rated less highly, but the grade gap by race was comparatively small. In
Chemistry 103, the learning environment was rated highly, yet the gap in adverse outcomes was high.
So we proceed here with caution, reiterating our awareness that the content and character of the five
courses vary in ways that wield influence on social relations and learning environments.
We found that the climate gaps among the five courses were explained by how students rated
their levels of engagement and validation as well as their experiences working with other students in
their courses. On these items, which included students’ sense of motivation, inclusion, self-efficacy,
trust in instructor, and opportunity to collaborate with peers and form friendships, we found overall
statistically significant differences between courses with higher and lower adverse outcomes for
targeted minority students, with Chemistry in the middle. Especially dramatic differences emerged
when students rated instructors on how well they built up learners’ confidence and how well they
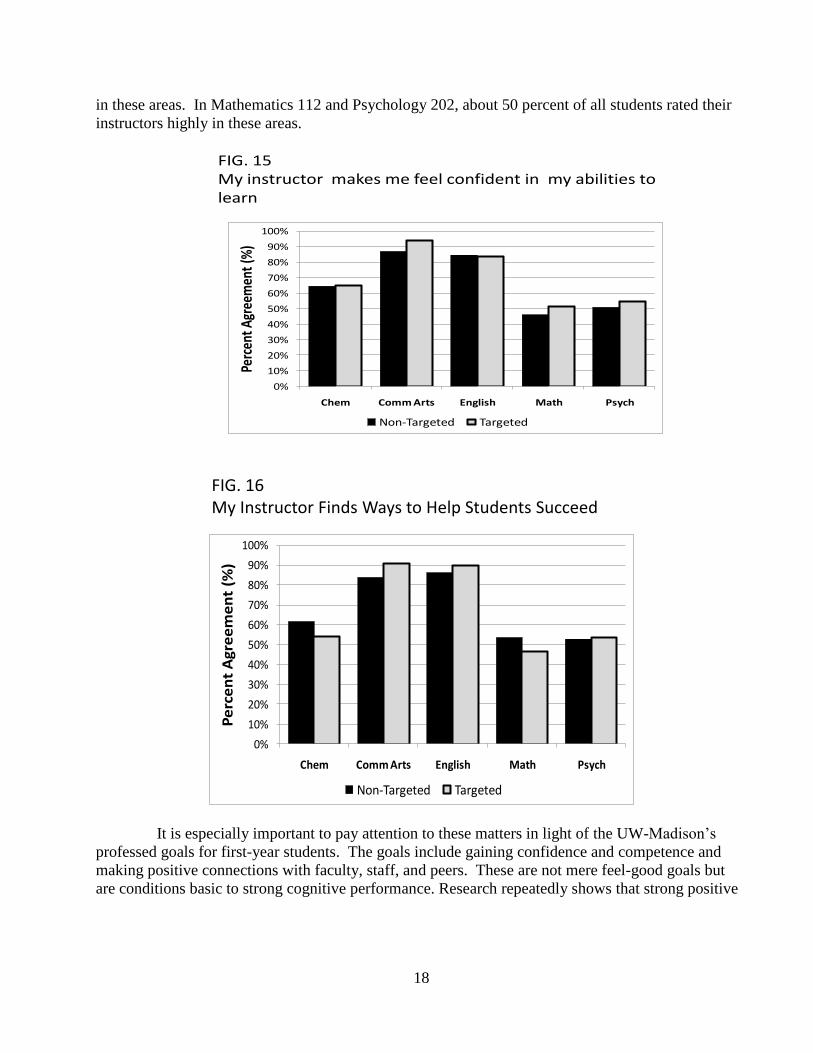
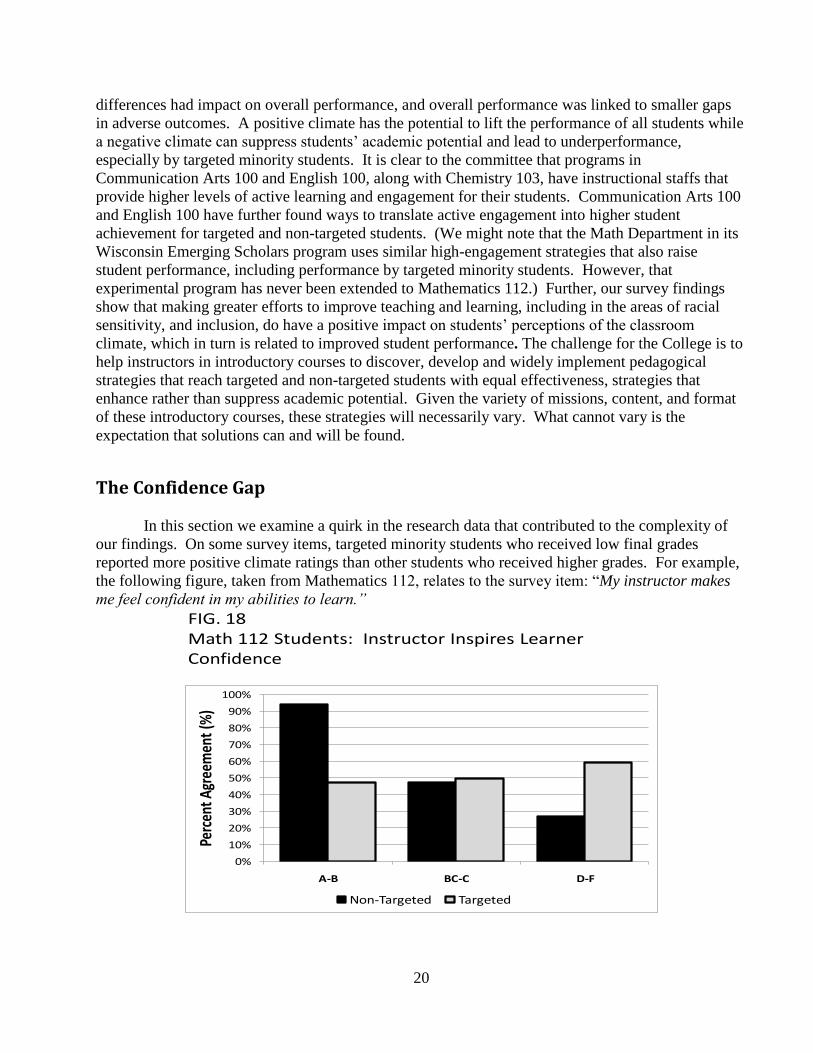
found ways for learners to succeed. Fig. 15 shows the responses by both targeted and non-targeted
students to the item: My instructor makes me feel confident in my abilities to learn. Fig. 16 shows
responses to the item: My instructor finds inventive ways to help me learn and succeed in this course.
80 percent or more of all students in Communication Arts 100 and English 100 rated their instructors
highly in these areas, while 60 percent of all students in Chemistry 103 rated their instructors highly
18
in these areas. In Mathematics 112 and Psychology 202, about 50 percent of all students rated their
instructors highly in these areas.
FIG. 15My instructor makes me feel confident in my abilities to learn
0%
10%
20%
30%
40%
50%
60%
70%
80%
90%
100%
Chem Comm Arts English Math Psych
Perc
ent A
gree
men
t (%
)
Non-Targeted Targeted
FIG. 16My Instructor Finds Ways to Help Students Succeed
0%
10%
20%
30%
40%
50%
60%
70%
80%
90%
100%
Chem Comm Arts English Math Psych
Pe
rce
nt
Ag
ree
me
nt
(%)
Non-Targeted Targeted
It is especially important to pay attention to these matters in light of the UW-Madison’s
professed goals for first-year students. The goals include gaining confidence and competence and
making positive connections with faculty, staff, and peers. These are not mere feel-good goals but
are conditions basic to strong cognitive performance. Research repeatedly shows that strong positive

19
emotions of caring, commitment, motivation and engagement are linked to high-level learning. On
the other hand, negative feelings of fear, shame, and detachment shut down thinking and learning.6
Teacher Engagement and the Climate Gap
Our next questions were these: How did teachers’ assessment of their own teaching relate
to students’ perceptions of classroom climate? In other words, what relationship could we find
between student engagement with learning and instructor engagement with teaching? For this we
looked to results of the surveys returned by 75 instructors across the five courses. We asked
instructors a number of questions having to do with their general efforts around student learning.
These included how they rated their effectiveness in making curriculum relevant to diverse students;
making students’ life experiences relevant to learning; encouraging peer-to-peer learning; using
multiple strategies to encourage success; providing positive feedback; encouraging students to ask for
help; and making student achievement a pedagogical priority. We also asked questions that invited
instructors to identify areas of their teaching that needed improvement, including in racial inclusion.
Generally we found that instructors in courses with more favorable climates reported making higher
efforts around student learning. At the same time, these instructors were more likely to report that
their teaching needed improvement. Differences among instructors by course were significant (p<
.001). (We also noticed a correlation between efforts around teaching and smaller grade gaps but it
was not statistically significant.) We return to these findings and other aspects of the instructor
survey in our recommendations.
FIG. 17Instructors’ Self-Reported Ratings of Teaching Effort
1.00
1.50
2.00
2.50
3.00
3.50
4.00
4.50
5.00
Chem Comm Arts English Math Psych
Ave
rage
Sca
le R
ati
ng
Makes Effort Needs Improvement
To summarize our sense of the engagement gap, we see that students experienced the
academic climates in their introductory courses differently. At least in some courses, these
6 For a review of this research, see E.T. Pascarella & P.T. Terenzini (1991). How college affects students. San Francisco:
Jossey Bass. Also see J.D. Brandsford, A.L. Brown & R. Cocking, eds. (1999). How people learn: Brain, mind,
experience and school. Washington,D.C.: National Academy Press.
20
differences had impact on overall performance, and overall performance was linked to smaller gaps
in adverse outcomes. A positive climate has the potential to lift the performance of all students while
a negative climate can suppress students’ academic potential and lead to underperformance,
especially by targeted minority students. It is clear to the committee that programs in
Communication Arts 100 and English 100, along with Chemistry 103, have instructional staffs that
provide higher levels of active learning and engagement for their students. Communication Arts 100
and English 100 have further found ways to translate active engagement into higher student
achievement for targeted and non-targeted students. (We might note that the Math Department in its
Wisconsin Emerging Scholars program uses similar high-engagement strategies that also raise
student performance, including performance by targeted minority students. However, that
experimental program has never been extended to Mathematics 112.) Further, our survey findings
show that making greater efforts to improve teaching and learning, including in the areas of racial
sensitivity, and inclusion, do have a positive impact on students’ perceptions of the classroom
climate, which in turn is related to improved student performance. The challenge for the College is to
help instructors in introductory courses to discover, develop and widely implement pedagogical
strategies that reach targeted and non-targeted students with equal effectiveness, strategies that
enhance rather than suppress academic potential. Given the variety of missions, content, and format
of these introductory courses, these strategies will necessarily vary. What cannot vary is the
expectation that solutions can and will be found.
The Confidence Gap
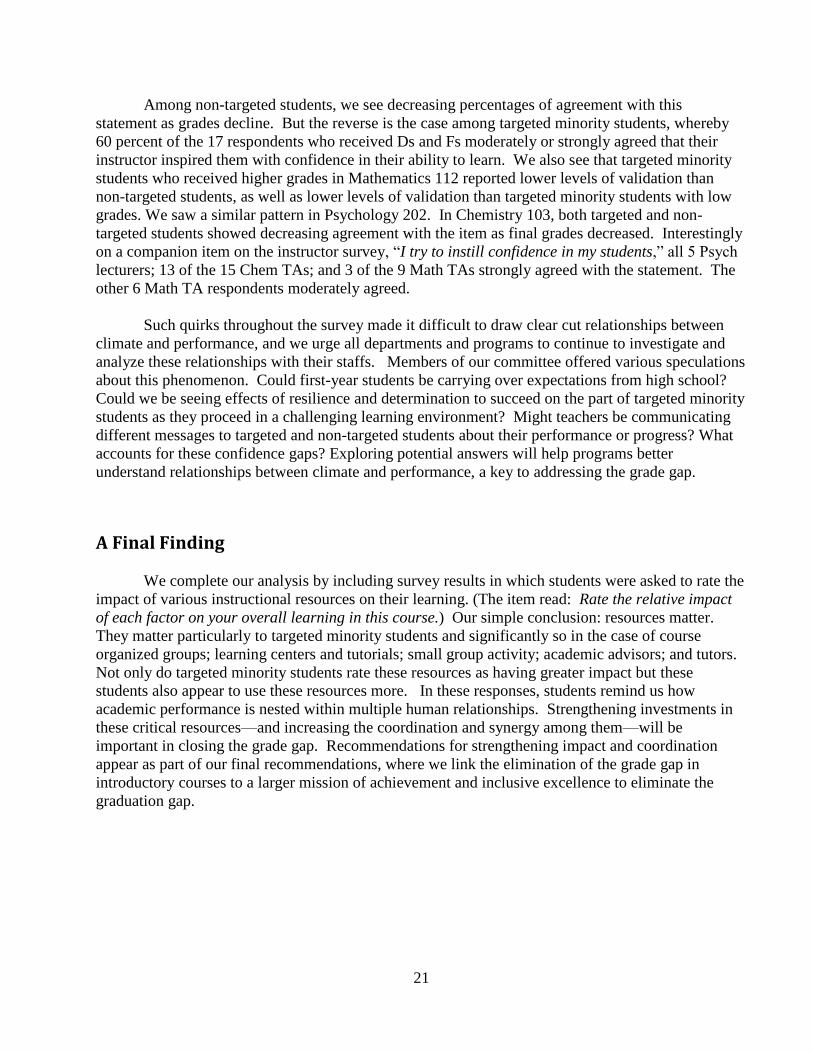
In this section we examine a quirk in the research data that contributed to the complexity of
our findings. On some survey items, targeted minority students who received low final grades
reported more positive climate ratings than other students who received higher grades. For example,
the following figure, taken from Mathematics 112, relates to the survey item: “My instructor makes
me feel confident in my abilities to learn.”
FIG. 18Math 112 Students: Instructor Inspires Learner Confidence
0%
10%
20%
30%
40%
50%
60%
70%
80%
90%
100%
A-B BC-C D-F
Perc
ent A
gree
men
t (%
)
Non-Targeted Targeted
21
Among non-targeted students, we see decreasing percentages of agreement with this
statement as grades decline. But the reverse is the case among targeted minority students, whereby
60 percent of the 17 respondents who received Ds and Fs moderately or strongly agreed that their
instructor inspired them with confidence in their ability to learn. We also see that targeted minority
students who received higher grades in Mathematics 112 reported lower levels of validation than
non-targeted students, as well as lower levels of validation than targeted minority students with low
grades. We saw a similar pattern in Psychology 202. In Chemistry 103, both targeted and non-
targeted students showed decreasing agreement with the item as final grades decreased. Interestingly
on a companion item on the instructor survey, “I try to instill confidence in my students,” all 5 Psych
lecturers; 13 of the 15 Chem TAs; and 3 of the 9 Math TAs strongly agreed with the statement. The
other 6 Math TA respondents moderately agreed.
Such quirks throughout the survey made it difficult to draw clear cut relationships between
climate and performance, and we urge all departments and programs to continue to investigate and
analyze these relationships with their staffs. Members of our committee offered various speculations
about this phenomenon. Could first-year students be carrying over expectations from high school?
Could we be seeing effects of resilience and determination to succeed on the part of targeted minority
students as they proceed in a challenging learning environment? Might teachers be communicating
different messages to targeted and non-targeted students about their performance or progress? What
accounts for these confidence gaps? Exploring potential answers will help programs better
understand relationships between climate and performance, a key to addressing the grade gap.
A Final Finding
We complete our analysis by including survey results in which students were asked to rate the
impact of various instructional resources on their learning. (The item read: Rate the relative impact
of each factor on your overall learning in this course.) Our simple conclusion: resources matter.
They matter particularly to targeted minority students and significantly so in the case of course
organized groups; learning centers and tutorials; small group activity; academic advisors; and tutors.
Not only do targeted minority students rate these resources as having greater impact but these
students also appear to use these resources more. In these responses, students remind us how
academic performance is nested within multiple human relationships. Strengthening investments in
these critical resources—and increasing the coordination and synergy among them—will be
important in closing the grade gap. Recommendations for strengthening impact and coordination
appear as part of our final recommendations, where we link the elimination of the grade gap in
introductory courses to a larger mission of achievement and inclusive excellence to eliminate the
graduation gap.

22
FIG. 19
Impact of …
23
Recommendations: Eliminate the grade gap in key introductory courses by 2014
Recently we saw how the College could quickly improve the retention of first-year students
when all units made a concerted and coordinated effort. The same level of commitment and
coordination must be brought to the problem of the grade gap. Every year that goes by under the
shadow of the grade gap suppresses the horizons of individual students and their families, diminishes
UW-Madison’s reputation in the eyes of the public, and degrades the potential of our teaching
mission to make a positive difference in society. Solutions must proceed in an integrated way in
terms of faculty awareness, curricular innovation, teacher professional development, advising, and
student academic relations.
The following recommendations are designed to build a foundation for the Departments of
Chemistry, Communication Arts, English, Psychology and Mathematics to eliminate the grade gap in
the focal courses by 2014. By no later than Spring 2011, each department will develop a strategic
action plan and report progress to the Dean and the Academic Planning Council each semester.
While we have focused on five important courses, we encourage Departments to develop systematic
data on all courses and document efforts to improve outcomes for targeted minority students who
take courses or major in their departments. We call on the Dean and the Academic Planning Council
to put in place a system of accountability and incentive that will bring quick improvement. The
recommendations call for modest increases in the financial budget and big increases in our will power
budget.
Recommendation #1: Convene a Taskforce for the Elimination of Grade Gaps
In our deliberations over two years, it became clear to the committee that perhaps the largest
and most persistent and hurtful gap in targeted minority student achievement is the one between rank-
and-file faculty and the personnel in academic student services. Both groups need to work more
closely and knowledgeably together to support the academic thriving of targeted minority students
and all students. We need to build direct thoroughfares between academic departments and academic
support programs. We need to make solutions to disparities in academic outcomes more central to
the mainstream business of academic departments.7
The Grade Gap Task Force will model such collaboration. It will bring together course
leaders in Chemistry 103, Communication Arts 100, English 100, Mathematics 112 and Psychology
202 with the L&S MD Coordinator and representatives of key student service programs. Together
this small group affects thousands of entering students each year and scores of teaching assistants and
advisors. The group will engage with achievement data and hear the voices of students through
facilitated presentations such as those orchestrated by Aaron Bird-Bear at the Addressing the
Achievement Gap retreat. The group will review advising practices and establish early warning
systems in intro courses. It will share best practices in TA professional development and student
engagement; and conduct surveys or other research where advisable. It will work on increasing
faculty and departmental involvement in the Summer Collegiate Experience and the proposed Center
7 See Derek Bok. (2006). Our underachieving colleges. A candid look at how much students learn and why they should be
learning more. Princeton, NJ: Princeton University Press.
24
for Academic Excellence. It will guide departments in developing action plans for eliminating the
grade gap. It will work on expanding Undergraduate Teaching Fellows (now in place in
Communication B writing courses) to other disciplines. It will engage with representatives from other
schools and colleges. It will help departments where necessary build in professional development
around inclusive excellence and high-impact learning.
Faculty need to understand where their responsibilities overlap with those of student academic
services. At the same time, closer connections between academic departments and academic student
services could enhance advisors’ knowledge of particular courses and lead to better placement,
advising, communication and coordination. The grade gap cannot close until fewer students fall
through the cracks. Strengthening connections between academic departments and academic student
services needs to be a high priority.
Recommendation #2: Disseminate information about the grade gap to faculty and initiate discussions around student performance.
Departments need to be well informed about the extent of grade gaps and their persistence
across student preparation levels. Basic awareness could well prompt individual faculty members to
make changes in their own teaching and take wider actions in their departments—efforts we would
heartily applaud. We recommend that, in academic year 2010-11, the Dean accompany members of
the L&S EDC in visits to Departmental Committees in Chemistry, Communication Arts, English,
Mathematics, and Psychology to share data and initiate discussions with faculty about raising student
academic performance and eliminating grade gaps. This visit will help departments to develop action
plans and report progress to the Dean on an annual basis.
Recommendation #3: Provide incentives for departments to innovate with curriculum and course structures in order to raise student engagement and performance and reduce grade gaps. Reward departments that implement results-oriented, scalable strategies.
Chemistry and Mathematics are two departments that have been trying out changes in
curriculum and course structures in selected sections of introductory courses. This experimentation
must continue and outcomes must be documented, analyzed, and refined. It is clear from our survey
results that courses with validating structures (particularly opportunities for students to receive timely
and responsive feedback; engage with and learn from supportive peers; and reflect and revise their
work) make a difference to majority and minority students alike.
The practical challenge is to translate high-impact teaching and learning methods across the
various missions, formats and contexts in which first-year instruction occurs. The College must look
to sites of inclusive excellence—First Year Interest Groups, Wisconsin Emerging Scholars,
Undergraduate Research Scholars, as well as effective programs at other institutions8—and figure out
how their principles for learning and teaching can be adapted and scaled up for use in large
8 See for example the Virginia-North Carolina Alliance for Minority Participation and the Charles A. Dana Center at the
University of Texas at Austin, both programs that are successfully diversifying students in STEM majors.

25
introductory programs. It also requires that academic departments build expert and proactive
multicultural competence into their teaching corps at every level. Above all, we must identify and
strengthen teaching practices that result in equal opportunity classrooms. Systematic, differential
outcomes by race cannot be acceptable characteristics of our instruction. Neither can the grade gap
remain an elective or transitory concern in our programs and departments.
Recommendation #4 Support the Department of Mathematics in improving grade outcomes for underrepresented students in lower division math courses, including Calculus.
It was clear to the committee that the College must make significant improvement in student
performance in Mathematics 112 and other lower-division math courses, including Calculus.
Adverse outcomes in pre-Calculus courses thwart the opportunity for targeted minority students to
pursue STEM majors. They also thwart the professed goal of the university to help diversify these
professions. Although this is a complex national problem, we simply cannot siphon off so many
young people. Mathematics is a foundational discipline and gateway to an array of highly desired
majors and professions. Math skills are increasingly necessary for all citizens in a growing
technological society. Investment in raising student performance in mathematics must become one of
the College’s highest priorities. The cost of inaction—the loss of so much human potential and the
negative impact on STEM professions and society—is too great to bear. Failing is not an option.
We endorse the plan for a coordinator of pre-Calculus courses who will have the mission of
raising student performance and helping more targeted minority students to get on the STEM track.
The coordinator will integrate supplemental instruction by coordinating with the Math Tutorial and
other programs on campus, while being the contact person for minority support programs needed to
address students’ problems. The person in this position also will coordinate the different curricular
innovations that are being currently tried and will stimulate new ones. The person in this position
will further coordinate the program with the Calculus sequence and participate in the training of TAs
and instructors. Some of these initiatives are already in place in one way or another, but more
coordination is needed to keep students from falling through the cracks. As part of this revamping,
we call on the College and the Math Department to create WES-style programs for pre-Calculus
courses.
Recommendation #5 Focus more TA professional development on inclusive excellence.
In conducting our climate survey, we were impressed by the vote of confidence that so many
undergraduates gave to their teaching-assistant instructors. Clearly much good teaching takes place
in our introductory programs every day. Introductory programs and the College overall must build
on these strengths and give all teaching assistants more strategies for breaking the grip of racial
disparity in academic achievement. Instructors in our survey reported strong commitment to
inclusion, diversity, and equal access in their classroom and rated themselves well prepared in these
areas. However, few instructors reported taking what the committee saw as proactive steps: checking
grades for racial bias; reaching out to foundering or absent students; communicating with student

26
advisors; recruiting minority students to the major; re-channeling negative peer interactions; or
actively mediating challenges faced by minority students.
Professional development with a focus on inclusive excellence will raise the academic
performance of all students and provide indispensible skills to our future professoriate. These efforts
can take many forms, beginning with orientations and other staff development already in place in
introductory courses. Frank attention to the problem of grade gaps is important. So is guiding TAs
in the art of leading successful peer learning groups; addressing common forms of racial tension in
peer learning; and developing practical strategies for reaching out to foundering students, recruiting
targeted minority students to academic majors, and helping minority students mediate challenges.
We strongly recommend that programs partner with the Delta program, which can offer
instructional staff at all levels with training in teaching diverse students. Delta also provides support
to test and evaluate intervention strategies in the classrooms. Their approaches have been endorsed
by the Vice Provost for Diversity and Climate and the Vice Provost for Teaching and Learning. We
can improve TA skills by leveraging the success Delta already has had on campus. We further
suggest that L&S leverage the expertise of the many diversity oriented programs on campus to help
TAs develop pedagogies that reach more students effectively.
Other important partners in this effort must be the L&S Teaching Fellows program and the
Future Faculty Partners in the Teaching Academy. The aim should be developing broad competence
in teaching for inclusive excellence.
Recommendation #6 Offer Teaching Awards for Inclusive Excellence in Introductory Teaching
In our surveys we saw evidence of individual teachers who made outstanding efforts and met
with outstanding success in teaching all students effectively. Annual competitive awards for TAs,
faculty, and course directors, based on nominations by department, would raise general awareness
and serve to recognize this most important dimension in teaching.
Recommendation #7 Focus more instructional attention on peer relations in introductory courses.
Racial segregation in the wider society is a barrier to productive learning in the classroom.
Just as teachers need strategies for breaking its grip, so do students. When the potential drag of racial
segregation in classroom interactions is not candidly addressed, students are likely to fall into socially
ingrained interactional patterns that can breed strain, distrust, insult and defeatism. Students need
explicit and ongoing guidance in how to work productively together across race. Best practices in
peer learning generally can go a long way toward supporting healthy cross-racial learning. (These
include active listening, respect for difference, and opportunities to reflect on process.) In addition,
students need frank guidance in creating an inclusive, trusting dynamic in the classroom; upfront
guidance in how to negotiate difference and majority/minority relations in peer work; and safe
mechanisms for voicing concerns and correcting problems. Similar processes need to be in place to
address uses of stereotypes or negative racial incidents when they occur in the classroom. As we
27
mentioned earlier, the committee believes student performance can be raised by increased attention to
peer academic relations—both specifically in the introductory courses and more broadly as part of
first-year education, including, for instance, in ethnic studies courses.
Recommendation #8 Link the elimination of the grade gap in introductory courses to efforts to eliminate the broader achievement gap.
As we mentioned at the start of this report, the committee did its work well aware that other
efforts are afoot on campus to address the wider achievement gap, including, importantly, the
graduation gap. Eliminating the grade gap in introductory courses will have an immediate and
significant impact on the graduation rate. At the same time, targeted first-year students who can see
their upper-division peers thriving and graduating will have added incentive to persevere and thrive
in their introductory courses. For these reasons, we endorse the proposed Center for Academic
Excellence. The center will broker this broader success by helping students connect with high-impact
academic experiences; declare majors sooner; and reach junior status on time. All of these elements
have been associated with 90 per cent graduation rates by all students, including targeted minority
students. Further, the center will be a hub of faculty involvement, thereby drawing together students,
academic departments, and student academic services. We urge that actions to eliminate the grade
gap be as coordinated as possible with the wider closing-the-achievement-gap effort on campus.
In Conclusion: The Accountability Gap
To eliminate the grade gap we must address gaps in faculty awareness, unit-to-unit
cooperation, student performance, teaching skills, learning relationships, and advising. Above all we
must close the accountability gap. Racial disparity in academic achievement cannot be treated as an
inevitable fact of the social order. Rather, we must grasp how we reproduce this fact every day, in
the ways we distribute resources and attention; in the ways we make and fail to make decisions; in
the ways we act and fail to act. If as a teaching community we do not soon establish the routine
competence to graduate large numbers of diverse students, this university risks becoming irrelevant
to higher education in the 21st century.

28
APPENDICES
29
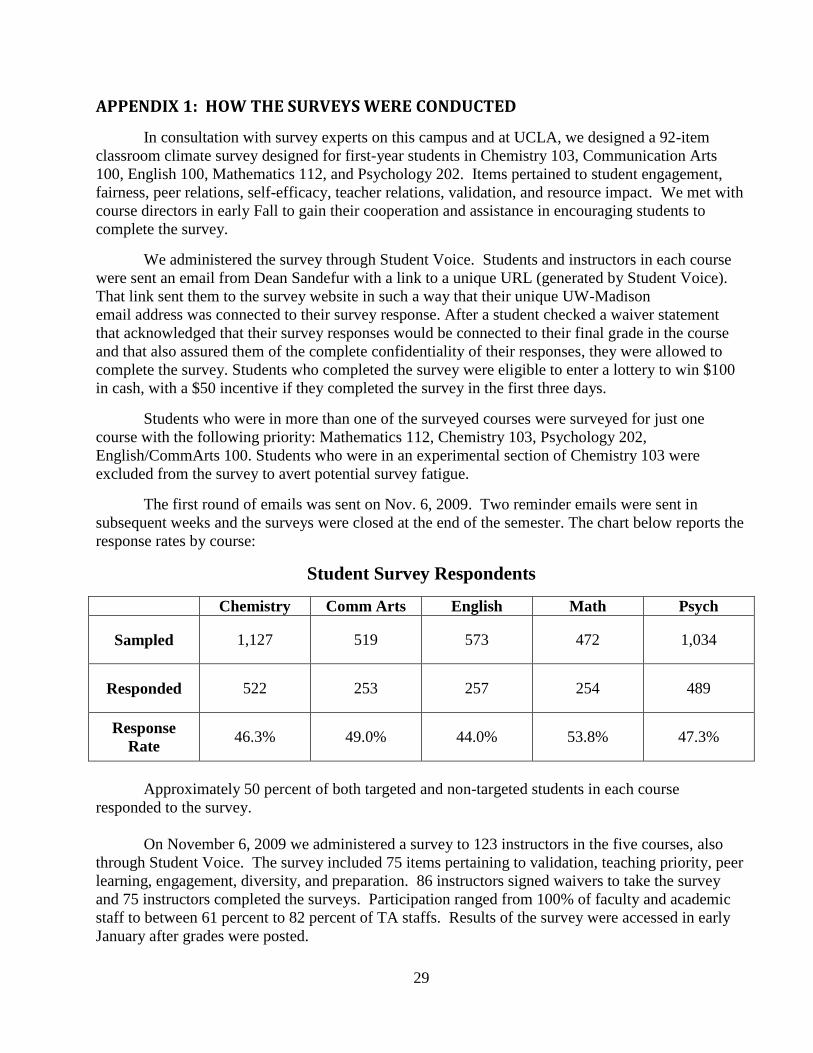
APPENDIX 1: HOW THE SURVEYS WERE CONDUCTED
In consultation with survey experts on this campus and at UCLA, we designed a 92-item
classroom climate survey designed for first-year students in Chemistry 103, Communication Arts
100, English 100, Mathematics 112, and Psychology 202. Items pertained to student engagement,
fairness, peer relations, self-efficacy, teacher relations, validation, and resource impact. We met with
course directors in early Fall to gain their cooperation and assistance in encouraging students to
complete the survey.
We administered the survey through Student Voice. Students and instructors in each course
were sent an email from Dean Sandefur with a link to a unique URL (generated by Student Voice).
That link sent them to the survey website in such a way that their unique UW-Madison
email address was connected to their survey response. After a student checked a waiver statement
that acknowledged that their survey responses would be connected to their final grade in the course
and that also assured them of the complete confidentiality of their responses, they were allowed to
complete the survey. Students who completed the survey were eligible to enter a lottery to win $100
in cash, with a $50 incentive if they completed the survey in the first three days.
Students who were in more than one of the surveyed courses were surveyed for just one
course with the following priority: Mathematics 112, Chemistry 103, Psychology 202,
English/CommArts 100. Students who were in an experimental section of Chemistry 103 were
excluded from the survey to avert potential survey fatigue.
The first round of emails was sent on Nov. 6, 2009. Two reminder emails were sent in
subsequent weeks and the surveys were closed at the end of the semester. The chart below reports the
response rates by course:
Student Survey Respondents
Chemistry Comm Arts English Math Psych
Sampled 1,127 519 573 472 1,034
Responded 522 253 257 254 489
Response
Rate 46.3% 49.0% 44.0% 53.8% 47.3%
Approximately 50 percent of both targeted and non-targeted students in each course
responded to the survey.
On November 6, 2009 we administered a survey to 123 instructors in the five courses, also
through Student Voice. The survey included 75 items pertaining to validation, teaching priority, peer
learning, engagement, diversity, and preparation. 86 instructors signed waivers to take the survey
and 75 instructors completed the surveys. Participation ranged from 100% of faculty and academic
staff to between 61 percent to 82 percent of TA staffs. Results of the survey were accessed in early
January after grades were posted.
30
APPENDIX 2: SIX YEAR GRADUATION RATES

31
APPENDIX 3: ACT ADJUSTED FINAL GRADES
African American
African American
African American
African American
African American
Hispanic
Hispanic
Hispanic
Hispanic
Hispanic
Native American
Native American
Native American
Native American
Native American
SE Asian
SE Asian
SE Asian
SE Asian
SE Asian
1 1.5 2 2.5 3 3.5 4
Chem
Comm Arts
English
Math
Psych
ACT Adjusted Final Grades of Minority Students In Five
Introductory Courses, Fall 2009
32
APPENDIX 4: REPORTED STUDY TIME
Student Reports of Time Spent Studying in Five Introductory Courses, Fall 2009
0-3 Hrs/Wk 4-6 Hrs/Wk 7-9 Hrs/Wk
> 9 Hrs/Wk
Chemistry
Non-Targeted 15.3% 46.0% 24.8% 13.9%
Targeted 17.1% 41.5% 29.3% 12.2%
Comm Arts
Non-Targeted 25.5% 51.9% 21.2% 1.4%
Targeted 19.4% 54.8% 16.1% 9.7%
English
Non-Targeted 36.5% 51.7% 10.8% 1.0%
Targeted 21.7% 63.0% 15.2% 0.0%
Mathematics
Non-Targeted 19.1% 50.5% 22.5% 7.8%
Targeted 15.9% 43.2% 22.7% 18.2%
Psychology
Non-Targeted 25.2% 46.8% 20.2% 7.8%
Student Reports of Time Spent Working Fall 2009
0-4 Hrs/Wk 5-10 Hrs/Wk 11-15 Hrs/Wk
> 15Hrs/Wk
Chemistry
Non-Targeted 69.2% 16.7% 9.6% 4.5%
Targeted 75% 17.9% 3.6% 3.6%
Comm Arts
Non-Targeted 49% 23.5% 14.1% 12.5%
Targeted 61.1% 11.1% 5.6% 22.2%
English
Non-Targeted 65.7% 17.2% 11.9% 5.2%
Targeted 44.4% 29.6% 14.8% 11.1%
Mathematics
Non-Targeted 54.7% 23.0% 14.4% 8.0%%
Targeted 50.0% 26.7% 6.7% 16.7%
Psychology
Non-Targeted 54.0% 20.4% 14.4% 11.1%