Embed Size (px)
Citation preview

www.northgateminerals.ca
Grade Control at the Kemess Mine
Minerals North - Mackenzie
Apr 27, 2006
Brian O’Connor - Chief Mine Geologist

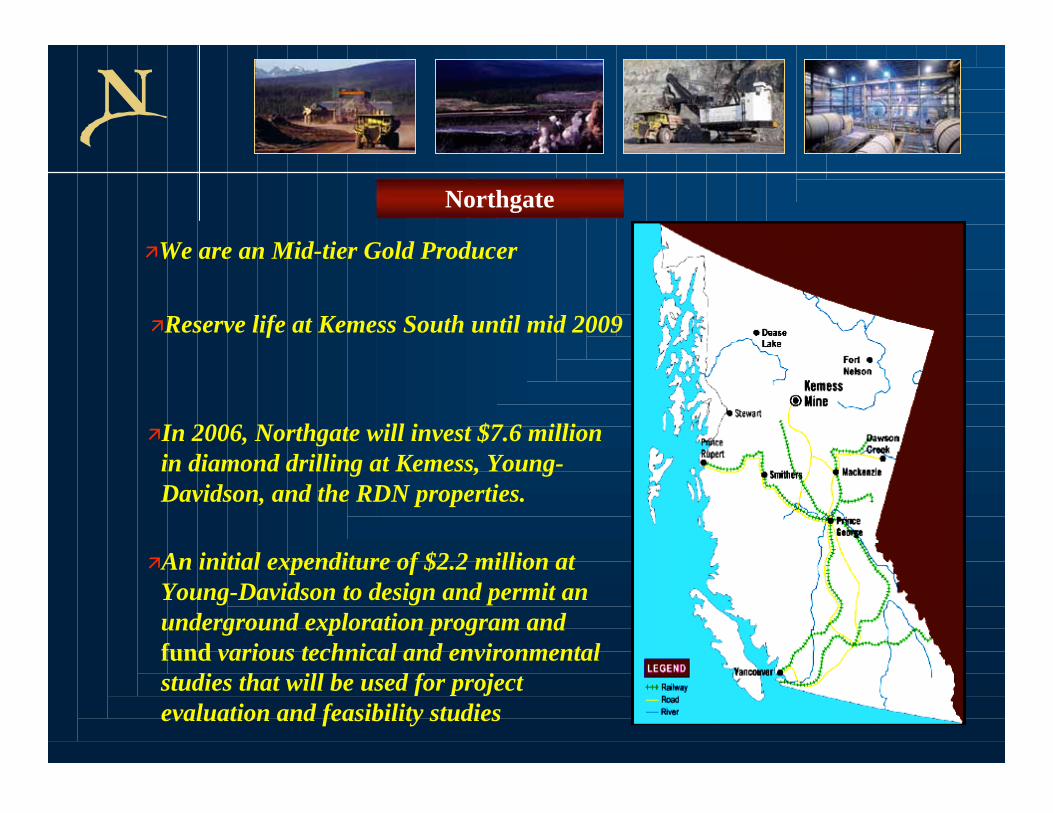
Northgate Exploration and the Kemess Mine
1 Introduction to Northgate
Benefits of a Good Grade Control Program 3
Grade Control at Kemess Mine 2
Presentation Outline
We are an Mid-tier Gold Producer
Northgate
Reserve life at Kemess South until mid 2009
In 2006, Northgate will invest $7.6 million
in diamond drilling at Kemess, Young-
Davidson, and the RDN properties.
An initial expenditure of $2.2 million at
Young-Davidson to design and permit an
underground exploration program and
fund various technical and environmental
studies that will be used for project
evaluation and feasibility studies

Reserves
& Resources
Principal
Assets
>300,000 ounces of gold per year
>75 Million pounds of copper per year
>Mineable Reserves: 68.2 Million tonnes.
>Gold: 1.41 million oz.
>Copper: 322 Million pounds.
Kemess South Mine
At December 31, 2005

5 km from existing infrastructure
Low development cost at the end of Kemess
South mine life
Kemess North
Further exploration of Kemess North
to be carried out in 2006.
Diamond drilling at Kemess North
resulted to the discovery of the fault
offset portion of the deposit
In 2005 exploration was focused on the
extensive claim package around the
Kemess South mine.

1,452,7684,091,402423,898,000Total
412,9701,180,8550.150.29124,631,000Probable
1,039,7982,910,5470.160.30299,267,000Proven
Copper (000's Pound)Gold (ounces)Copper (%)Gold (g/mt)tonnes
Contained MetalsGradesQuantity
Mineral Reserves - Kemess North
Kemess North
At December 31, 2005
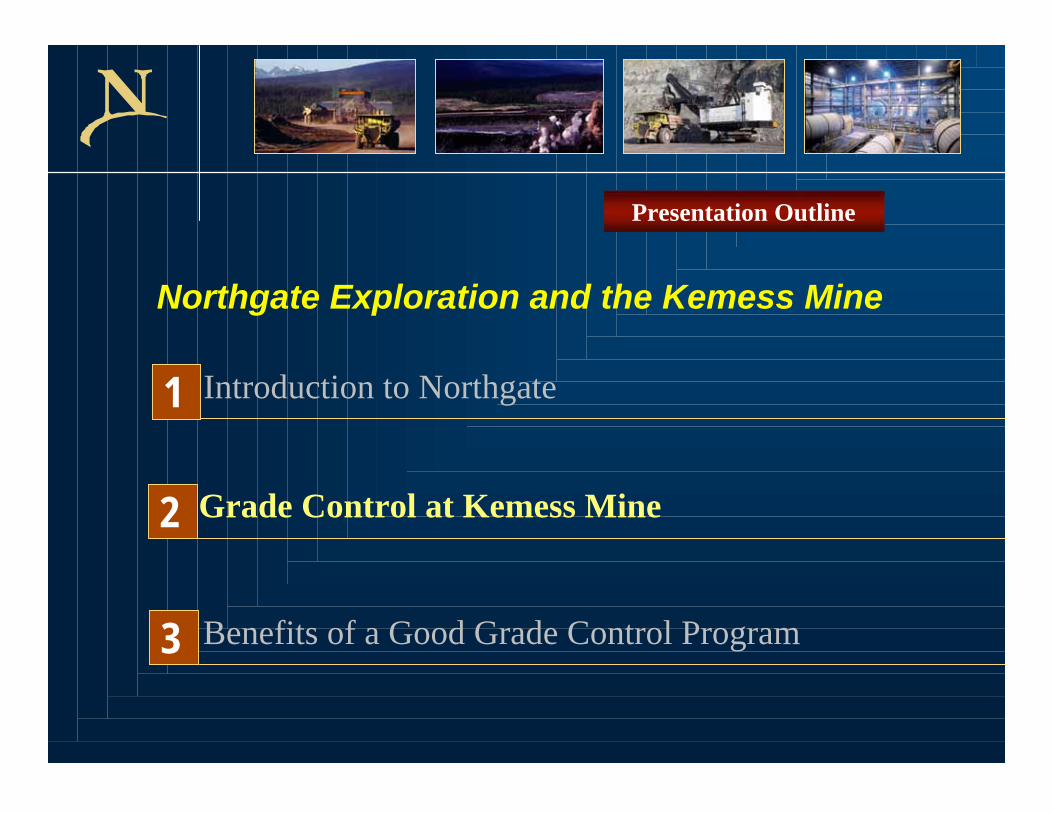
Introduction to Northgate 1
Grade Control at Kemess Mine 2
Benefits of a Good Grade Control Program 3
Northgate Exploration and the Kemess Mine
Presentation Outline

Grade Control at the Kemess Mine
GEOLOGY of the KEMESS MINE 1
SAMPLING PROCESS 2
STOCKPILE MODELLING 4
MAPPING OF STRUCTURES 5
ALTERATION MODEL 3

SAMPLING PROCESS

–EVERY ORE BLASTHOLE is sampled and mapped
–EVERY WASTE BLASTHOLE is mapped.
–EVERY WASTE BLASTHOLE, in acid generating waste, is sampled for S%, and every fifth hole is sampled for ABA.
–Four ore types and seven waste types
–Close interaction with the mill and mine supervisors
–Effective communication with the entire operation
–Dig maps are distributed to the crews.
SAMPLING PROCESS

Geology of Kemess Mine
Bench 1290
–On 12 hour intervals a report is sent to the mill which describes the feed for the shift.
–Grade and tonnes estimated
–Alteration description and hardness domain
–Mine and Mill Maintenance Scheduling
–Pyrite to chalcopyrite ratio, and total sulfide content are estimated for Transition and Hypogene ore.
–Native copper and copper oxide contents are calculated for Supergene, Transition, and Leach-cap ore.
–Communication with metallurgist throughout the day
MILLING
SAMPLING PROCESS
Materials Management
•Define the waste characteristics from blasthole samples
»Four ore and seven waste types
»Stockpile modeling and construction materials
»Adhere to permit M-206 requirements
•Daily monitoring of the materials as extracted and placed
»Database is updated daily
»Efficient software programming updates daily materials moved into a daily/monthly/yearly and stockpile format
Quarterly reporting of materials moved from the pit
Timely permitting acceptance
Geology of Kemess Mine
Material Management
Alteration Types
• Potassic-altered Monzonite: Pink/Brown; Euhedral primary
biotite is replaced by finer grained biotite and k-spar.
• Phyllic-altered Monzonite: Light-green; quartz-sericite-pyrite
alteration replaces K-spar rich potassic alteration. Or, dark-green
quartz-chlorite-pyrite alteration replaces biotite-rich potassic
alteration.
• Late Potassic-altered Monzonite: Pink; K-spar-hematite
alteration associated with pyrite stringers.
• Supergene altered Monzonite: intense hematite alteration
replaces primary hydrothermal minerals and textures.
Paul Duuring, Steve Rowins, Brad McKinley, UBC, Jan 2006.
Alteration Model

Alteration Model – Plan View

1 o f
7
- Primary Economic Minerals
1. Chalcopyrite, 0.5-3.0%
2. Gold (Native Gold, Electrum, 1-50 m), >95%
3. Submicroscopic Gold < 5%
4. Silver – Ag : Au ration is 1.4 : 1
- Accessory Economical Minerals
1. Native Copper
2. Chalcocite – Cu2S
3. Bornite – Cu5FeS4
4. Cuprite – Cu2O
5. Molybdenite – MoS2
- Non-economic Minerals
1. Pyrite, 2 – 5 %
2. Magnetite < 1%
Geology of Kemess Mine
Mineralogy

STOCKPILE MODELLING

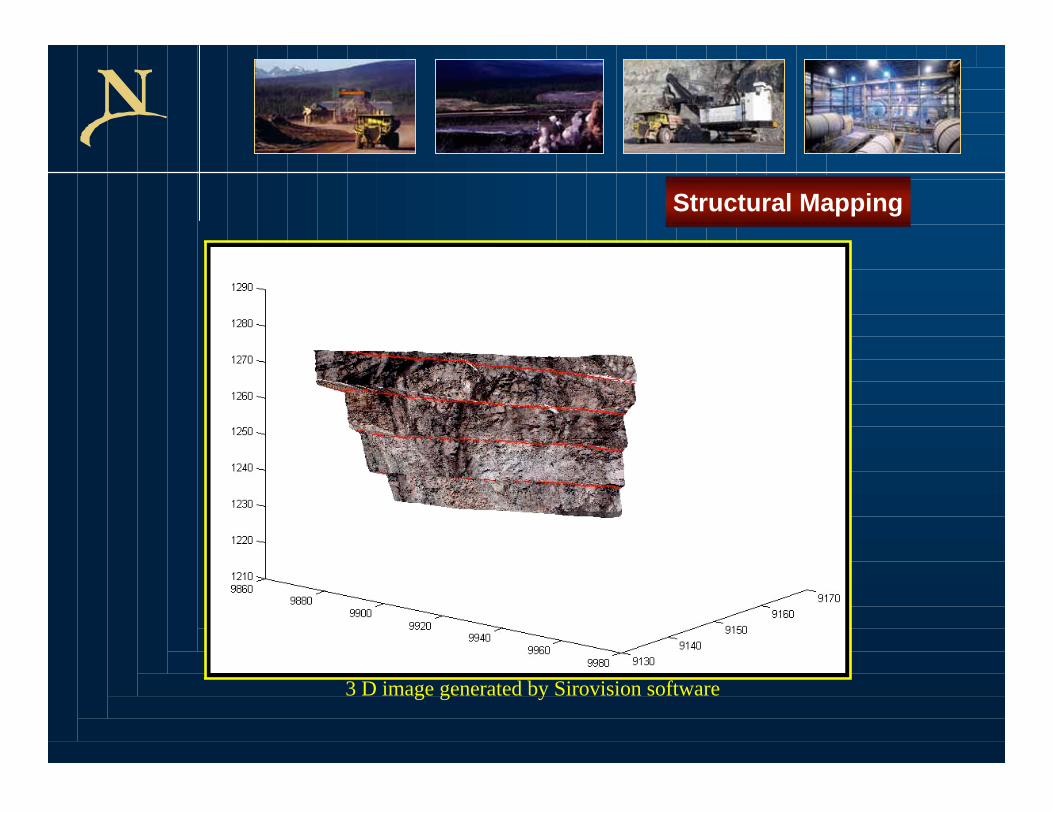
High-wall mapping using Sirovision software
Structural Mapping
• 3D digital image mapping of rocks and surfaces for Geology
and Surveying.
• Pre-failure and post-failure data collection without placing
personnel close to the high-wall.
• Data collected is highly accurate and could be gathered from up
to 700 m away.
• Data collected is highly precise (1-2 cm) from 100 m away.
• Detailed information can be collected from the entire wall rather
than just two meters that previously could be reached.

Clipped bench view of the Sirovision surface vs. surveyed pit surface

Clipped Sectional view of the Sirovision surface vs. the pit surface
Structural Mapping
3 D image generated by Sirovision software

Northgate Exploration and the Kemess Mine
1 Introduction to Northgate
Benefits of a Good Grade Control Program 3
Grade Control at Kemess Mine 2
Presentation Outline

$4.34$5.97$8.29Total
$0.73$1.07$1.27G&A
$2.00$2.45$3.60Milling
$1.61$2.45$3.42Mining
2010-20192006-20092005
Kemess NorthKemess South
Project Operating Costs (per mT milled)
Operating Costs

Achievements Since Acquisition in 2000
Increased gold production by 32%
Reduced cash operating costs by 40%
Increased reserve grade by 10%
Increased resource base by 500%
Kemess South Mine

Productivity and External Benchmarks
Tonnes/day/employee
0
100
200
300
400
500
Alumbrera Batu HVC Aitik Kemess Antamina Bingham
Operating Costs
Figure from Chris Rockingham
Kemess Productivity Gains
Tonnes per shift worked
0
200
400
600
800
2000 2001 2002 2003 2004 2005

Grade Control at the Kemess South Mine