Embed Size (px)
Citation preview
Grade 8 Term 3 MathematicsLearners Worksheets
Page 1 of 73
Grade 8 Term 3 Mathematics Strategy Learners Worksheets
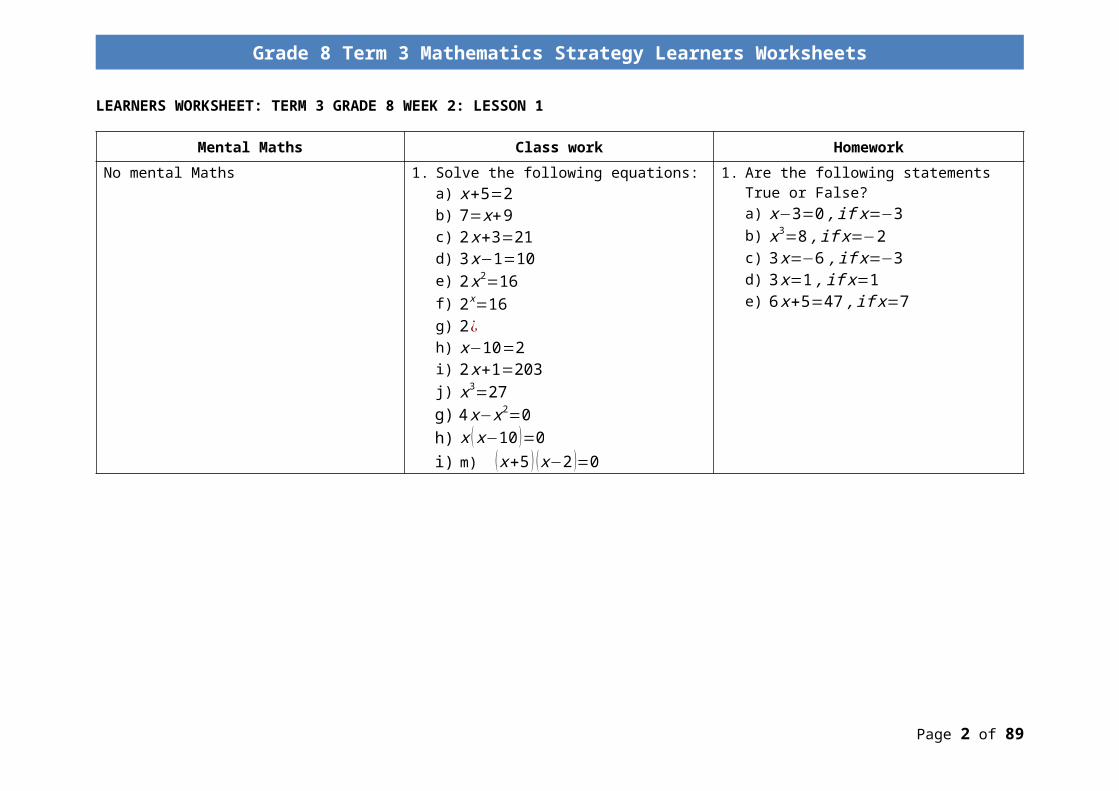
LEARNERS WORKSHEET: TERM 3 GRADE 8 WEEK 2: LESSON 1
Mental Maths Class work HomeworkNo mental Maths 1. Solve the following equations:
a) x+5=2b) 7=x+9c) 2 x+3=21d) 3 x−1=10e) 2 x2=16f) 2x=16g) 2¿h) x−10=2i) 2 x+1=203j) x3=27g) 4 x−x2=0h) x (x−10 )=0i) m) ( x+5 ) ( x−2 )=0
1. Are the following statements True or False?a) x−3=0 , if x=−3b) x3=8 , if x=−2c) 3 x=−6 , if x=−3d) 3 x=1 ,if x=1e) 6 x+5=47 , if x=7
Page 2 of 73
Grade 8 Term 3 Mathematics Strategy Learners Worksheets
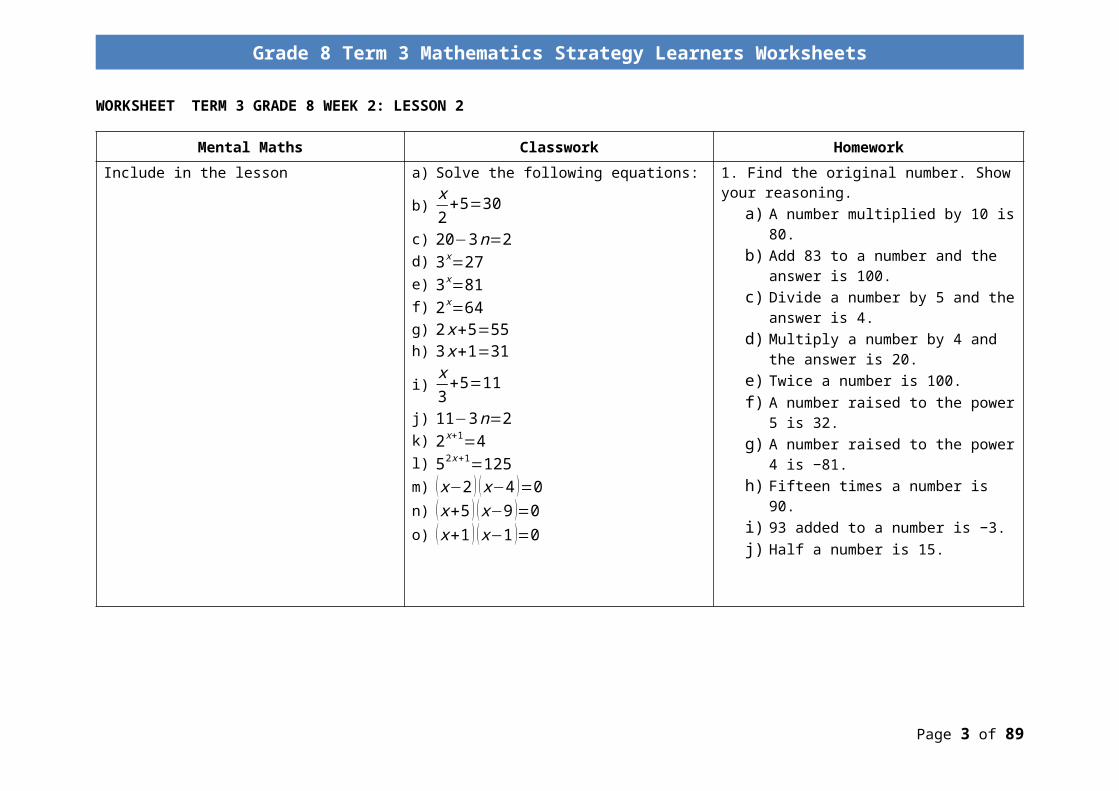
WORKSHEET TERM 3 GRADE 8 WEEK 2: LESSON 2
Mental Maths Classwork HomeworkInclude in the lesson a) Solve the following equations:
b) x2+5=30
c) 20−3n=2d) 3x=27e) 3x=81f) 2x=64g) 2 x+5=55h) 3 x+1=31i) x
3+5=11
j) 11−3n=2k) 2x+1=4l) 52 x+1=125m) ( x−2 ) ( x−4 )=0n) ( x+5 ) ( x−9 )=0o) ( x+1 ) ( x−1 )=0
1. Find the original number. Show your reasoning.
a) A number multiplied by 10 is 80.b) Add 83 to a number and the
answer is 100.c) Divide a number by 5 and the
answer is 4.d) Multiply a number by 4 and the
answer is 20.e) Twice a number is 100.f) A number raised to the power 5
is 32.g) A number raised to the power 4
is −81.h) Fifteen times a number is 90.i) 93 added to a number is −3.j) Half a number is 15.
Page 3 of 73
Grade 8 Term 3 Mathematics Strategy Learners Worksheets
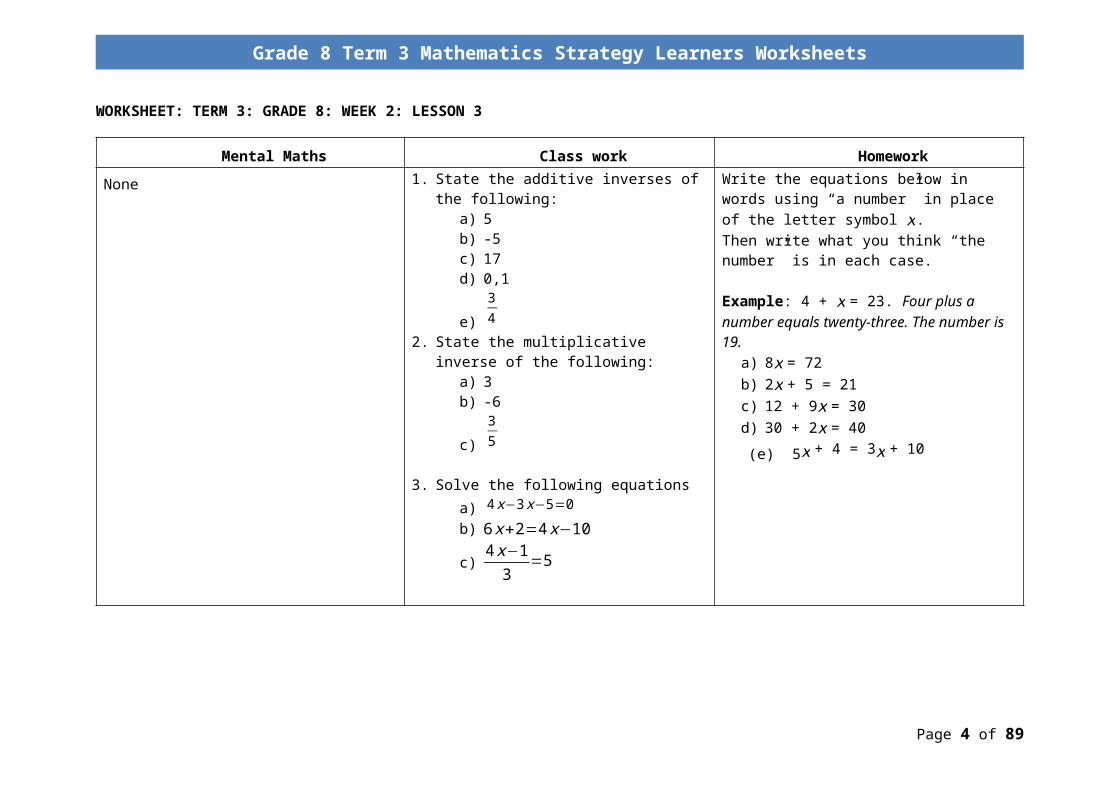
WORKSHEET: TERM 3: GRADE 8: WEEK 2: LESSON 3
Mental Maths Class work HomeworkNone 1. State the additive inverses of the
following:a) 5b) -5c) 17d) 0,1
e)34
2. State the multiplicative inverse of the following:
a) 3b) -6
c)35
3. Solve the following equationsa) 4 x−3 x−5=0b) 6 x+2=4 x−10c) 4 x−1
3=5
Write the equations below in words using “a number” in place of the letter symbol x.Then write what you think “the number” is in each case.
Example: 4 + x = 23. Four plus a number equals twenty-three. The number is 19.
a) 8x = 72b) 2x + 5 = 21c) 12 + 9x = 30d) 30 + 2x = 40
(e) 5x + 4 = 3x + 10
Page 4 of 73
Grade 8 Term 3 Mathematics Strategy Learners Worksheets
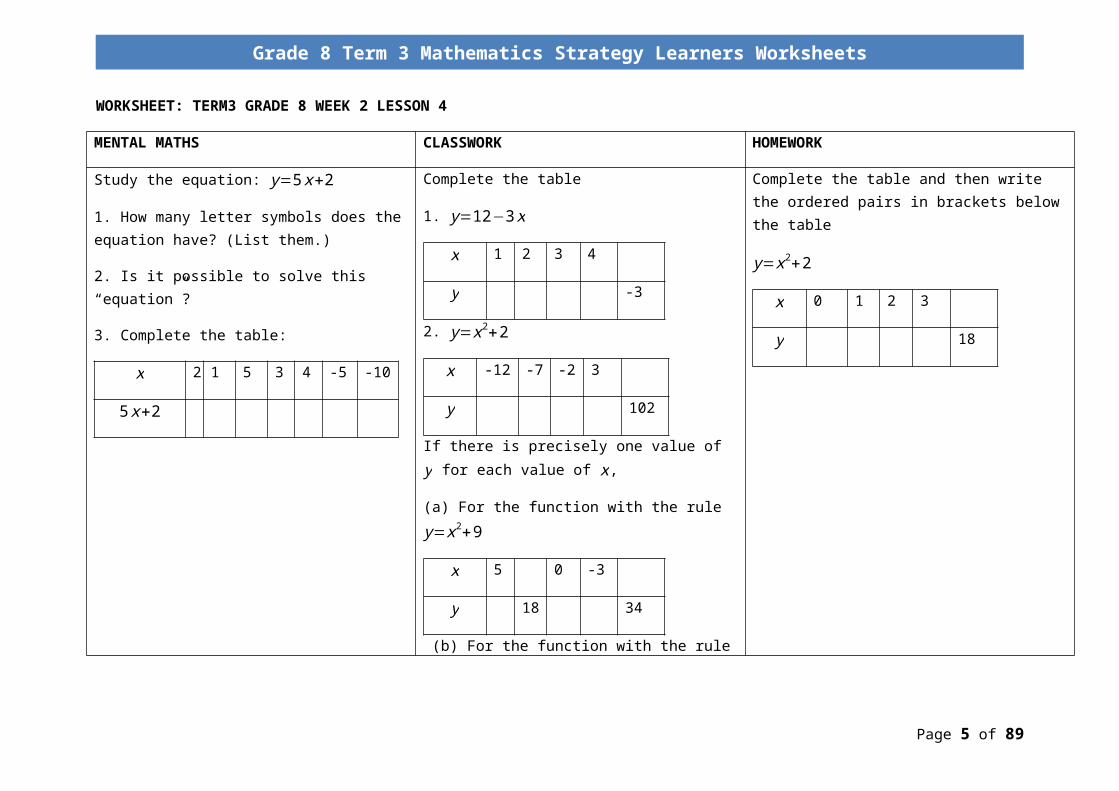
WORKSHEET: TERM3 GRADE 8 WEEK 2 LESSON 4
MENTAL MATHS CLASSWORK HOMEWORK
Study the equation: y=5 x+2
1. How many letter symbols does the equation have? (List them.)
2. Is it possible to solve this “equation”?
3. Complete the table:
x 2 1 5 3 4 -5 -10
5 x+2
Complete the table
1. y=12−3 x
x 1 2 3 4
y -3
2. y=x2+2
x -12 -7 -2 3
y 102
If there is precisely one value of y for each value of x,
(a) For the function with the rule y=x2+9
x 5 0 -3
y 18
34
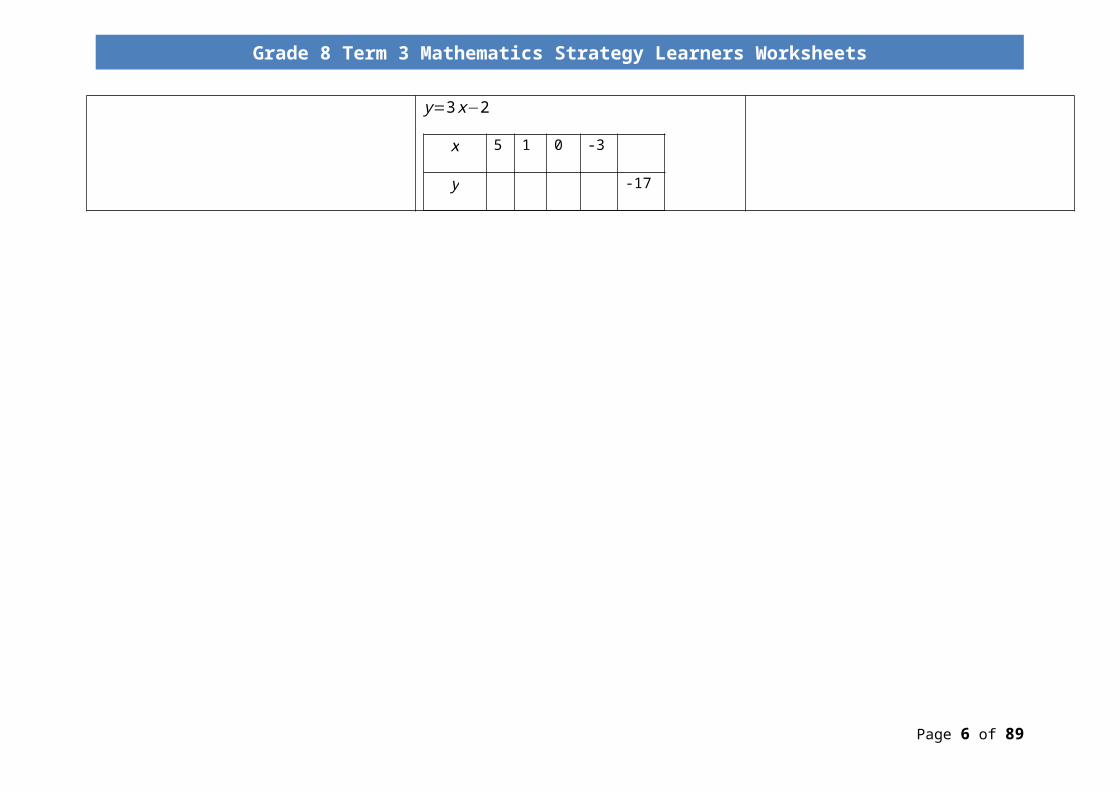
(b) For the function with the rule y=3 x−2
x 5 1 0 -3
y -17
Complete the table and then write the ordered pairs in brackets below the table
y=x2+2
x 0 1 2 3
y 18
Page 5 of 73
Grade 8 Term 3 Mathematics Strategy Learners Worksheets
Page 6 of 73
Grade 8 Term 3 Mathematics Strategy Learners Worksheets
WORKSHEET: TERM 3 GRADE 8 WEEK 2 LESSON 5
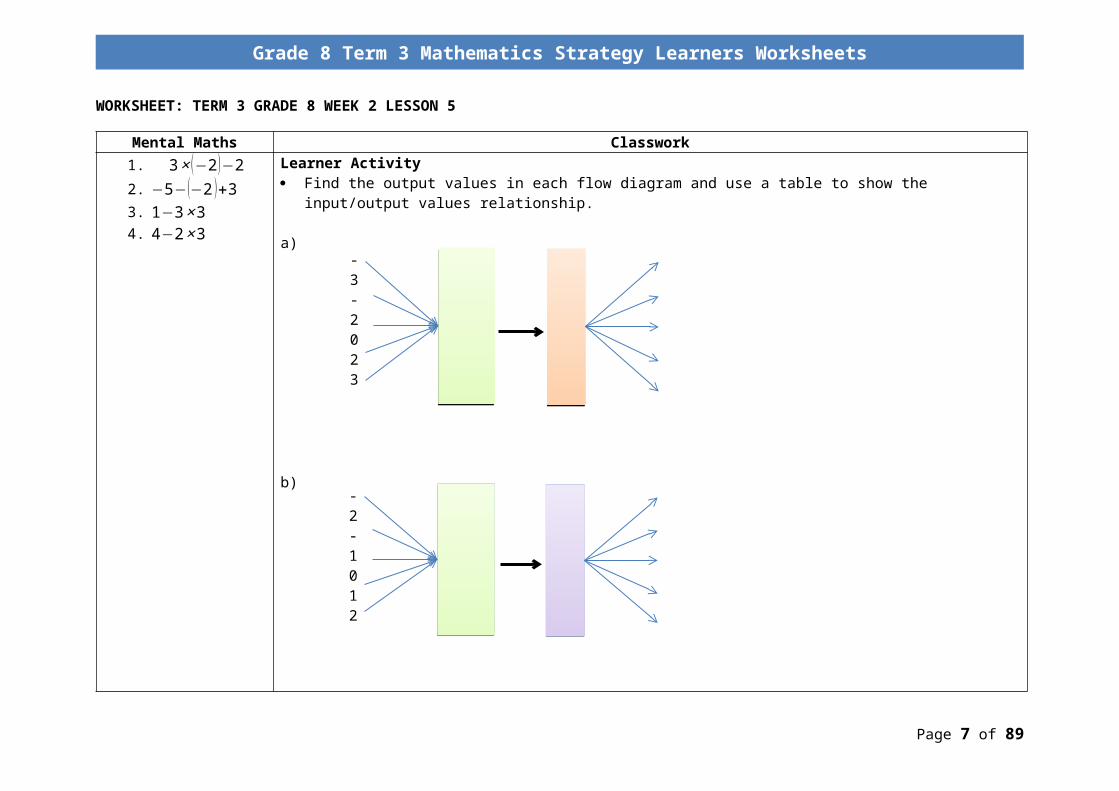
Mental Maths Classwork1. 3× (−2 )−22. −5−(−2 )+33. 1−3×34. 4−2×3
Learner Activity Find the output values in each flow diagram and use a table to show the input/output values
relationship.
a)
b)
Page 7 of 73
Grade 8 Term 3 Mathematics Strategy Learners Worksheets
-3-2023
-2-1012
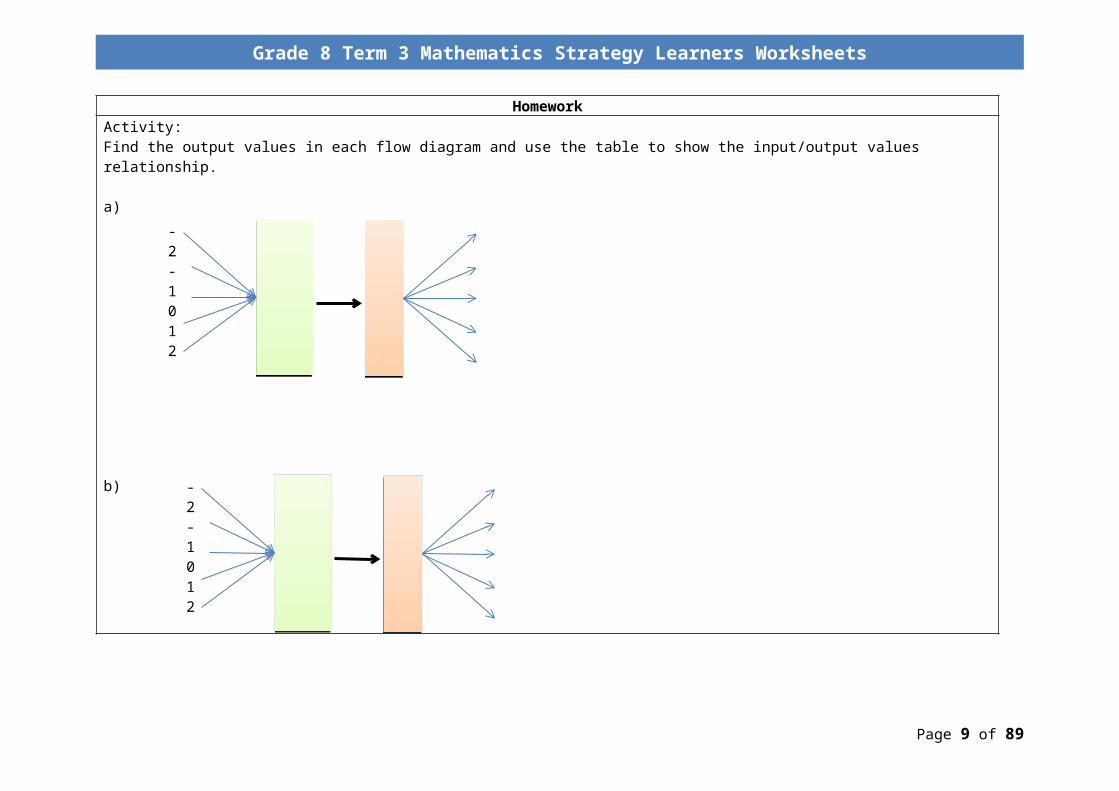
HomeworkActivity:Find the output values in each flow diagram and use the table to show the input/output values relationship.
a)
b)
Page 8 of 73
Grade 8 Term 3 Mathematics Strategy Learners Worksheets
-2-1012
-2-1012
WORKSHEET: TERM 3 GRADE 8 WEEK 2 LESSON 6
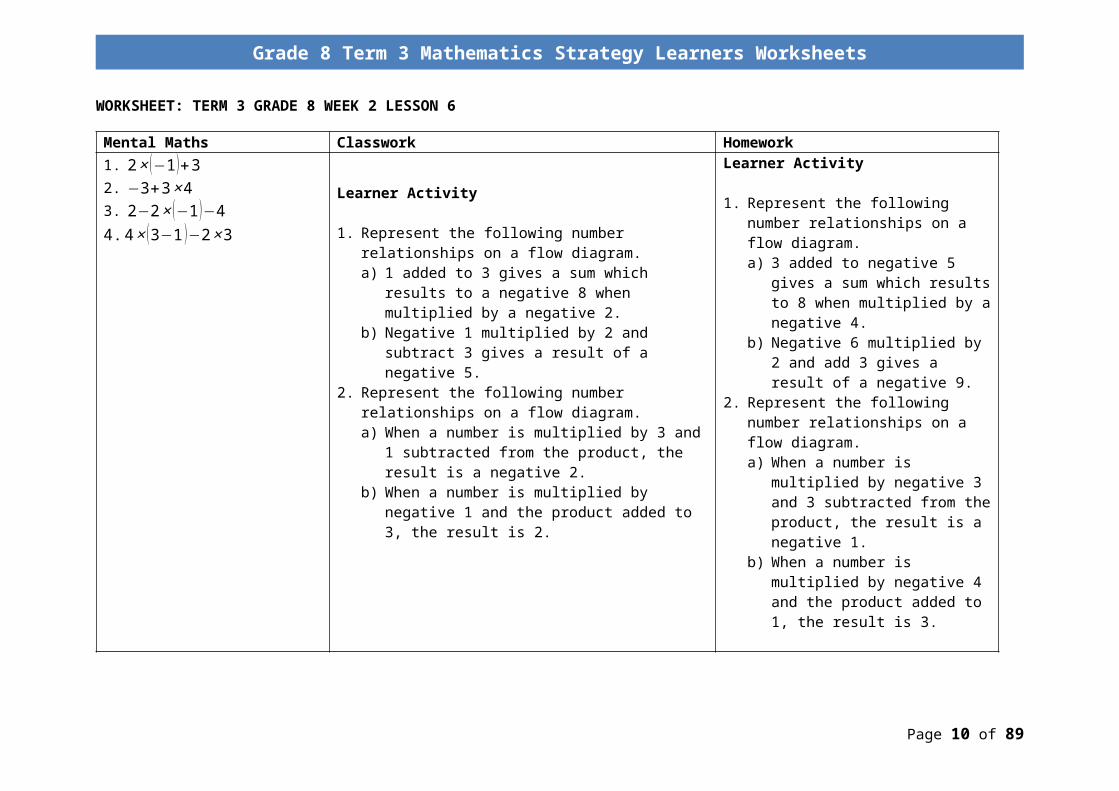
Mental Maths Classwork Homework1. 2× (−1 )+32. −3+3×43. 2−2× (−1 )−44. 4× (3−1 )−2×3
Learner Activity
1. Represent the following number relationships on a flow diagram.a) 1 added to 3 gives a sum which results to a
negative 8 when multiplied by a negative 2.b) Negative 1 multiplied by 2 and subtract 3
gives a result of a negative 5.2. Represent the following number relationships
on a flow diagram. a) When a number is multiplied by 3 and 1
subtracted from the product, the result is a negative 2.
b) When a number is multiplied by negative 1 and the product added to 3, the result is 2.
Learner Activity
1. Represent the following number relationships on a flow diagram.a) 3 added to negative 5 gives a
sum which results to 8 when multiplied by a negative 4.
b) Negative 6 multiplied by 2 and add 3 gives a result of a negative 9.
2. Represent the following number relationships on a flow diagram. a) When a number is multiplied
by negative 3 and 3 subtracted from the product, the result is a negative 1.
b) When a number is multiplied by negative 4 and the product added to 1, the result is 3.
Page 9 of 73
Grade 8 Term 3 Mathematics Strategy Learners Worksheets
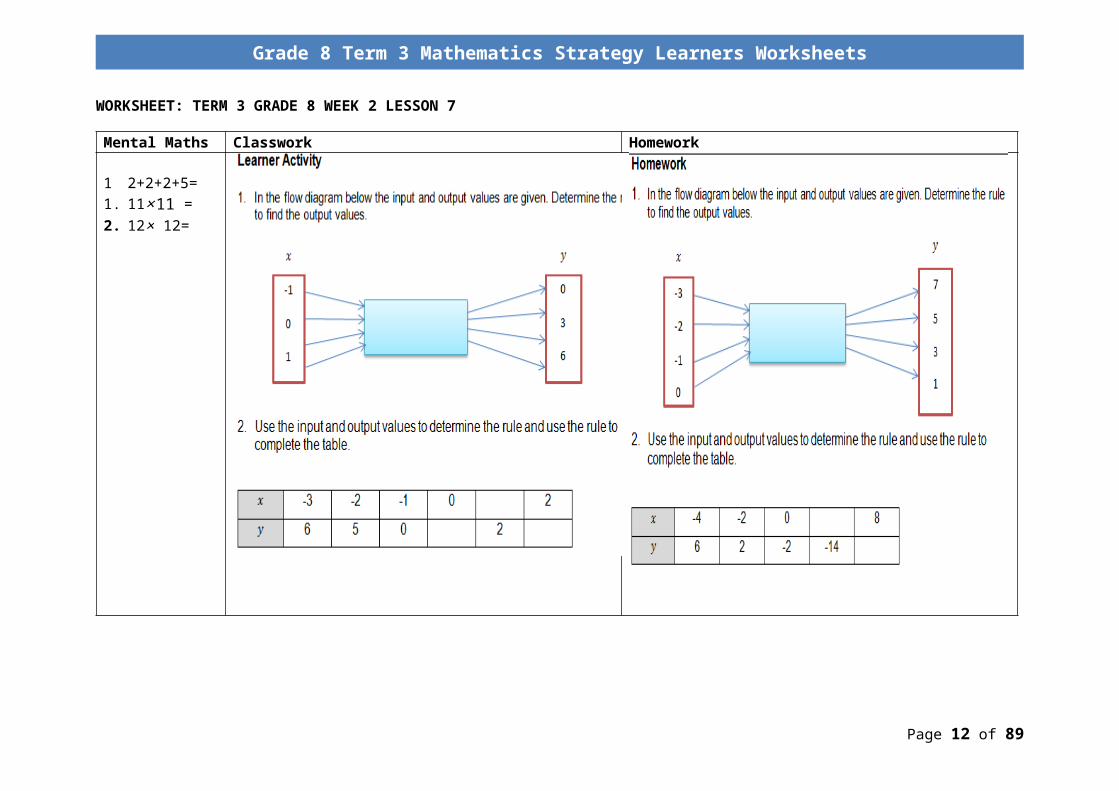
WORKSHEET: TERM 3 GRADE 8 WEEK 2 LESSON 7
Mental Maths Classwork Homework
1 2+2+2+5=1. 11×11 =2. 12× 12=
Page 10 of 73
Grade 8 Term 3 Mathematics Strategy Learners Worksheets

WORKSHEET: GRADE 8: TERM 3: WEEK 2: LESSON 8
Mental Maths ClassworkColumn A Column BGradient undefined a)
Gradient is 0 b)
Gradient is positive c)
Gradient is negative d)
Activity 1Determine the gradient of the following lines and state whether the lines are increasing, decreasing or constant.
1) The line passing through the points (2;1) and (4;3)2) The line passing through the points (-1;3) and (-3;3).
Page 11 of 73
Grade 8 Term 3 Mathematics Strategy Learners Worksheets
HomeworkActivity 2
1) Calculate the interceptsDraw the graph of 2 x− y+4=0 on the set of axis below
Find the y-intercept by putting x=0 Find the x-intercept by putting y=0 Join the two intercepts
Page 12 of 73
Grade 8 Term 3 Mathematics Strategy Learners Worksheets

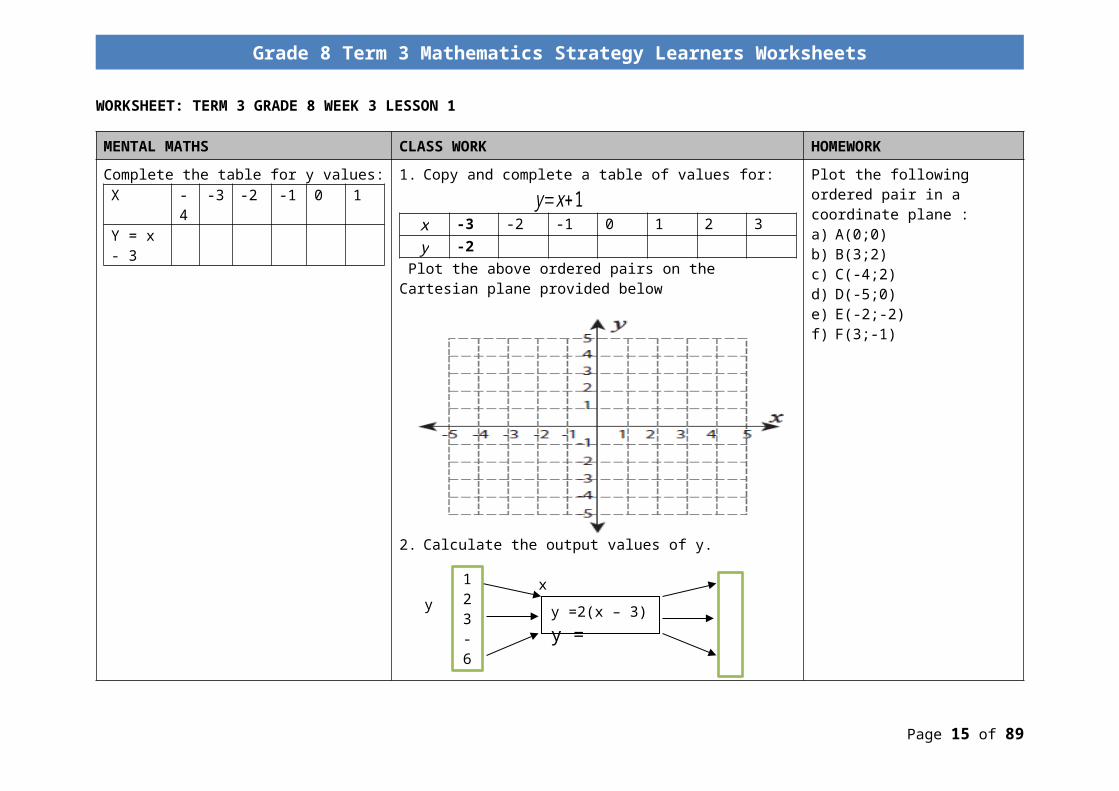
WORKSHEET: TERM 3 GRADE 8 WEEK 3 LESSON 1
MENTAL MATHS CLASS WORK HOMEWORKComplete the table for y values:X -
4-3 -2 -1 0 1
Y = x - 3
1. Copy and complete a table of values for:
y=x+1x -3 -2 -1 0 1 2 3y -2
Plot the above ordered pairs on the Cartesian plane provided below
2. Calculate the output values of y.
x y
Plot the following ordered pair in a coordinate plane :a) A(0;0)b) B(3;2)c) C(-4;2)d) D(-5;0)e) E(-2;-2)f) F(3;-1)
WORKSHEET: TERM 3 GRADE 8 WEEK 3 LESSON 2
Page 13 of 73
Grade 8 Term 3 Mathematics Strategy Learners Worksheets
y =2(x – 3)y =
123-6

MENTAL MATHS CLASSWORK HOMEWORKComplete the table for y-values:
x -4 -3 -2 -1 0 1y = x + 6
1. Complete the following flow diagram:
2. Use the flow diagram below to complete the table.a)
+2 x 3 output valueinput value
Inpu
t va
lue1 2 3 4 5 5
086
Outp
ut
36
75
b) Describe by means of a formula how the input and output values are related. Use the letter y for output values and letter xfor input values.
Complete the following flow diagrams below.
Sketch the following graphs using the table method (NB: x must start from -3 to 3):
1. y = x - 32. y = x + 2
Page 14 of 73
Grade 8 Term 3 Mathematics Strategy Learners Worksheets
WORKSHEET: GRADE 8 TERM 3 WEEK 3 LESSON 3
MENTAL MATHS CLASS WORKLet A = ½ B x H, complete the table for the values of A:
B 12 4 8 16 20H 8 6 4 10 12A
1. If the distance covered (d) is represented by the formula d=s× t where s represents speed and t represents time, determine the distance covered in 4,7 hours at a constant speed of 100km/h.
2. If the area of a triangle is given by A=1
2×b×h
, determine the area if b=5cm and h=20cm
3. Study the table below and answer the questions that follow:
x 1 2 3 6 9y=x+1
Complete the table
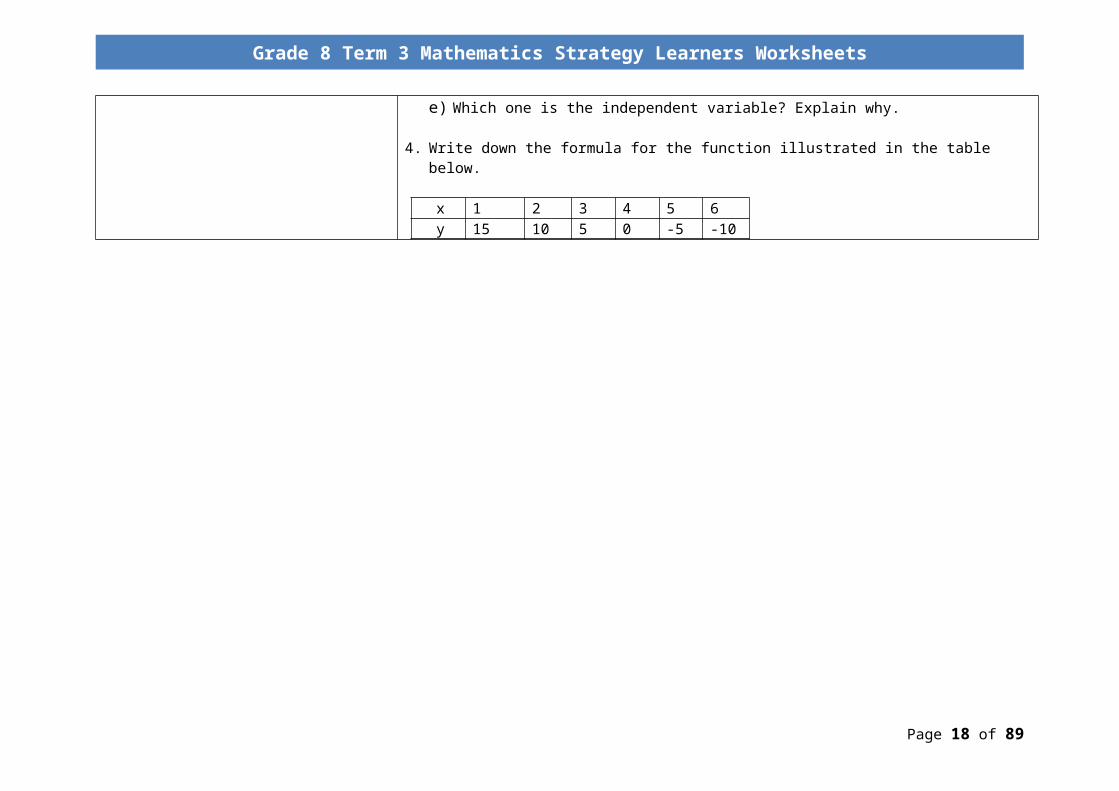
a) Which are the input values? b) Which are the output values? c) Which are the two variables in the table above? d) Which one is the dependent variable? Explain why. e) Which one is the independent variable? Explain why.
4. Write down the formula for the function illustrated in the table below.
x 1 2 3 4 5 6 y 15 10 5 0 -5 -10
Page 15 of 73
Grade 8 Term 3 Mathematics Strategy Learners Worksheets

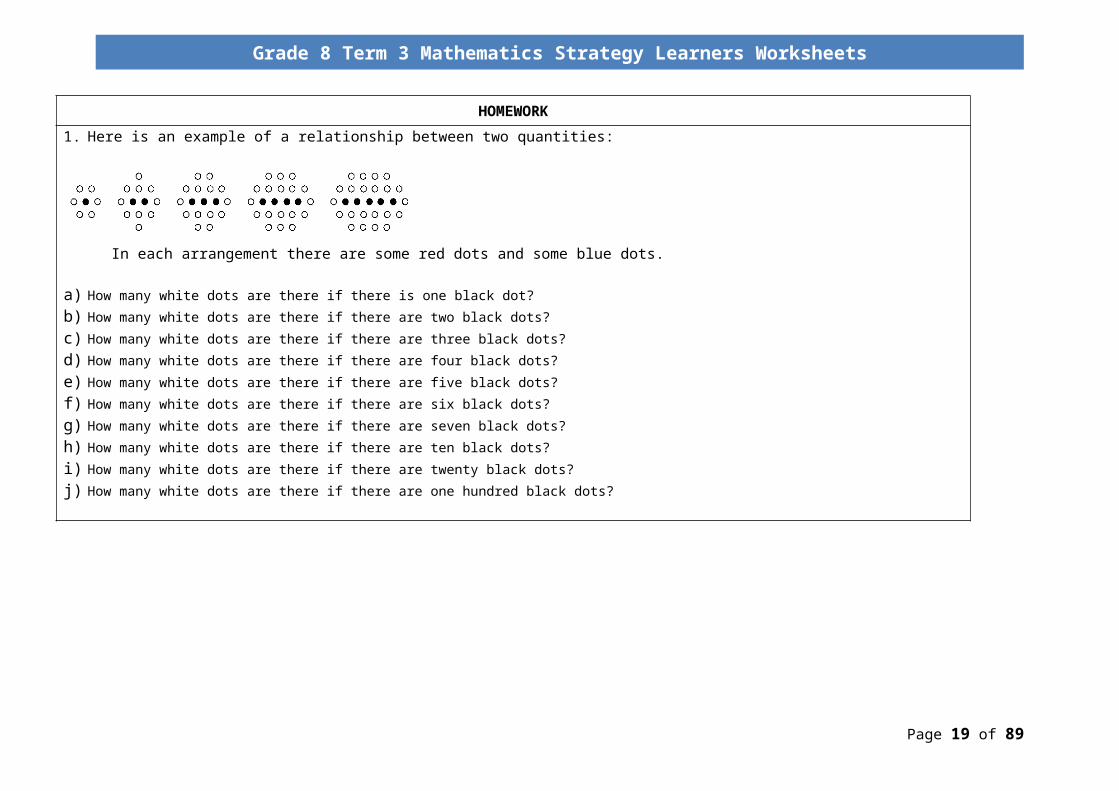
HOMEWORK1. Here is an example of a relationship between two quantities:
In each arrangement there are some red dots and some blue dots.
a) How many white dots are there if there is one black dot?b) How many white dots are there if there are two black dots?c) How many white dots are there if there are three black dots?d) How many white dots are there if there are four black dots?e) How many white dots are there if there are five black dots?f) How many white dots are there if there are six black dots?g) How many white dots are there if there are seven black dots?h) How many white dots are there if there are ten black dots?i) How many white dots are there if there are twenty black dots?j) How many white dots are there if there are one hundred black dots?
Page 16 of 73
Grade 8 Term 3 Mathematics Strategy Learners Worksheets

WORKSHEET: GRADE 8 TERM 3 WEEK 3 LESSON 4
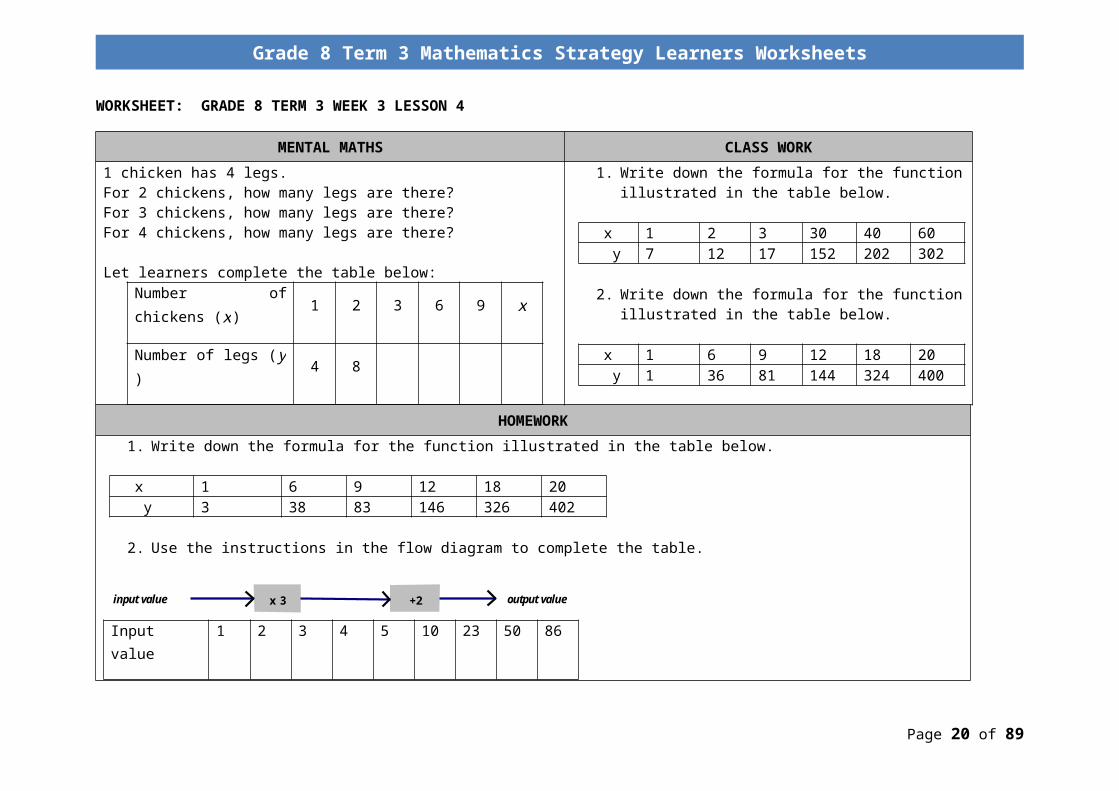
MENTAL MATHS CLASS WORK1 chicken has 4 legs.For 2 chickens, how many legs are there?For 3 chickens, how many legs are there?For 4 chickens, how many legs are there?
Let learners complete the table below:Number of chickens (x) 1 2 3 6 9 x
Number of legs (y) 4 8
1. Write down the formula for the function illustrated in the table below.
x 1 2 3 30 40 60 y 7 12 17 152 202 302
2. Write down the formula for the function illustrated in the table below.
x 1 6 9 12 18 20 y 1 36 81 144 324 400
HOMEWORK1. Write down the formula for the function illustrated in the table below.
x 1 6 9 12 18 20 y 3 38 83 146 326 402
2. Use the instructions in the flow diagram to complete the table.
+2x 3 output valueinput value
Input value 1 2 3 4 5 10 23 50 86
Output value
Page 17 of 73
Grade 8 Term 3 Mathematics Strategy Learners Worksheets
WORKSHEET: TERM 3 GRADE 8 WEEK 3 LESSON 5
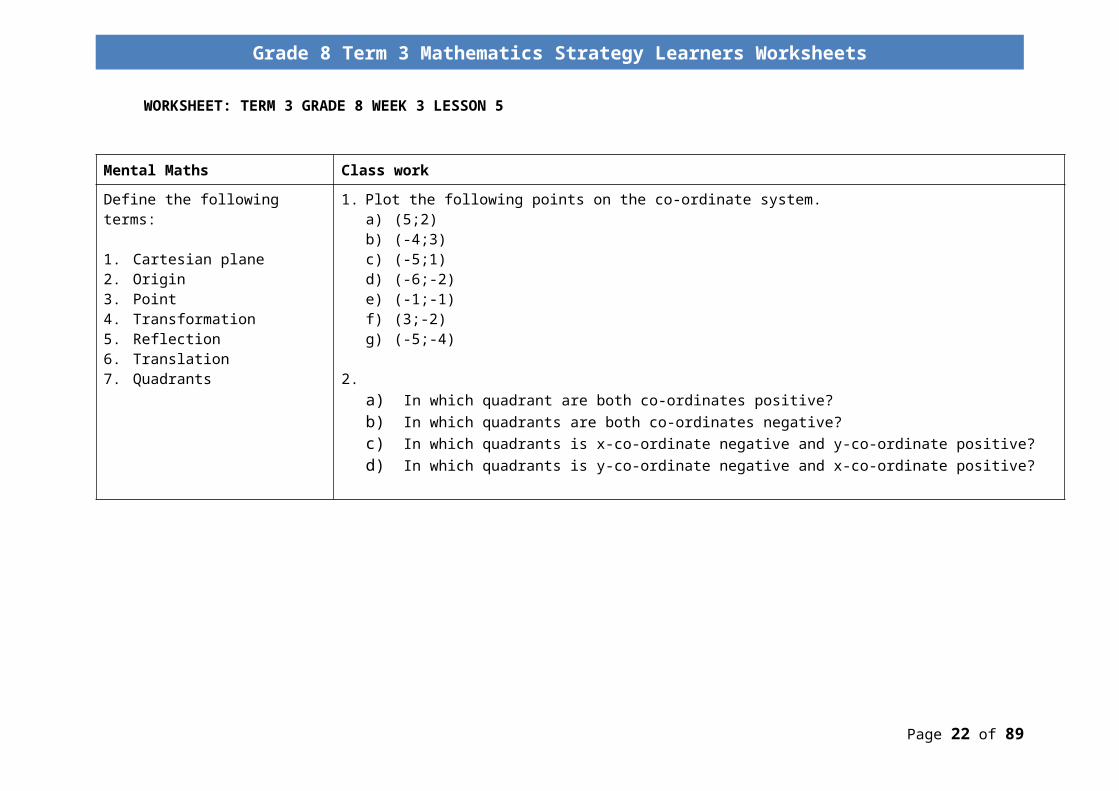
Mental Maths Class workDefine the following terms:
1. Cartesian plane2. Origin3. Point4. Transformation5. Reflection6. Translation7. Quadrants
1. Plot the following points on the co-ordinate system.a) (5;2)b) (-4;3)c) (-5;1)d) (-6;-2)e) (-1;-1)f) (3;-2)g) (-5;-4)
2.a) In which quadrant are both co-ordinates positive? b) In which quadrants are both co-ordinates negative? c) In which quadrants is x-co-ordinate negative and y-co-ordinate positive? d) In which quadrants is y-co-ordinate negative and x-co-ordinate positive?
Page 18 of 73
Grade 8 Term 3 Mathematics Strategy Learners Worksheets
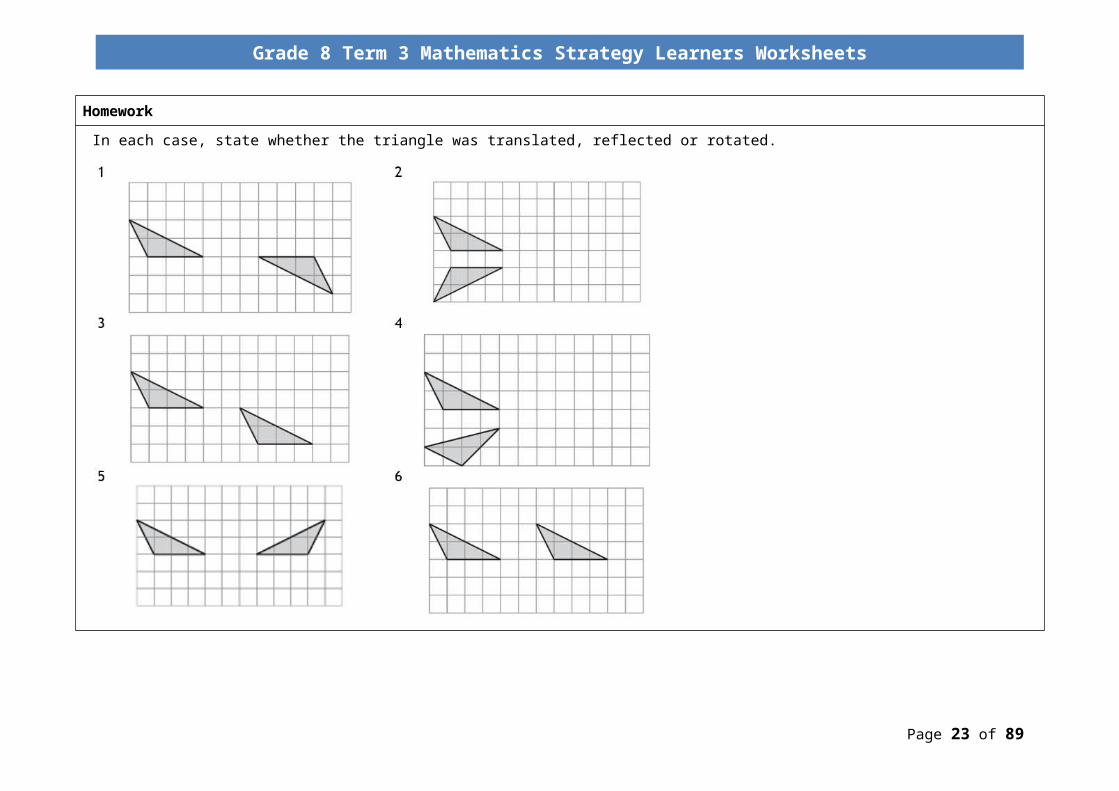
HomeworkIn each case, state whether the triangle was translated, reflected or rotated.
Page 19 of 73
Grade 8 Term 3 Mathematics Strategy Learners Worksheets
WORKSHEET: TERM 3 GRADE 8 WEEK3 LESSON 6
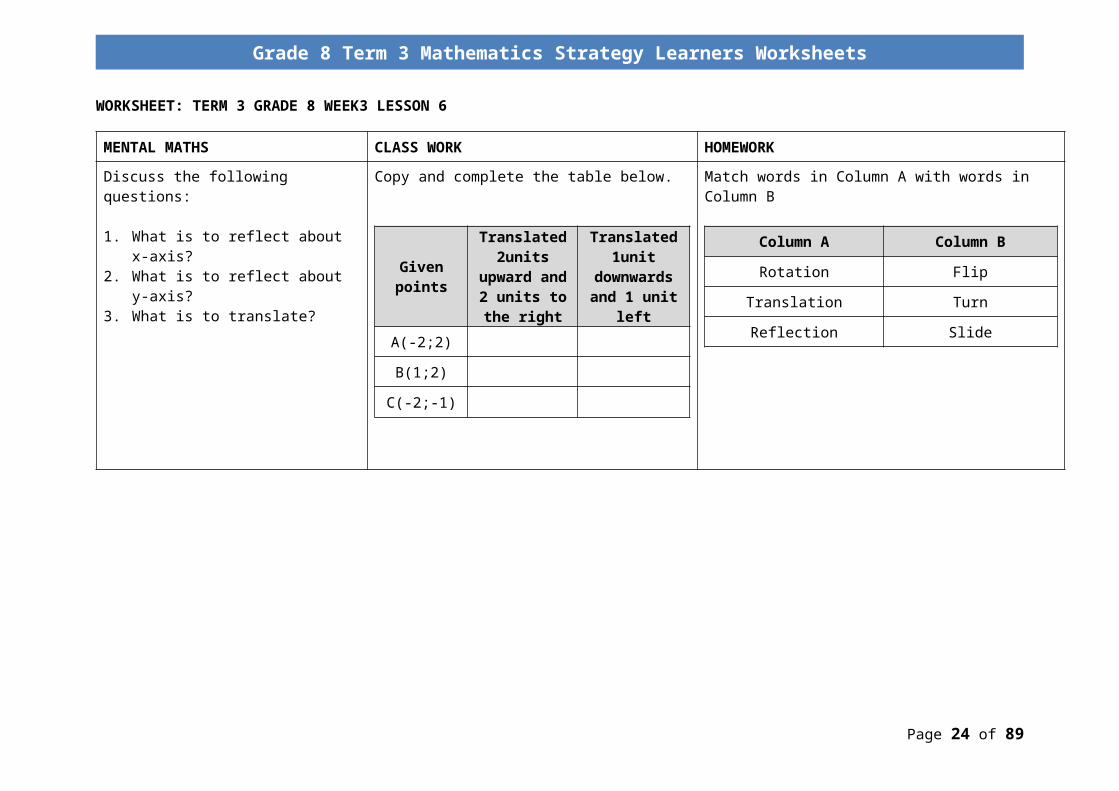
MENTAL MATHS CLASS WORK HOMEWORKDiscuss the following questions:
1. What is to reflect about x-axis?2. What is to reflect about y-axis?3. What is to translate?
Copy and complete the table below.
Given points
Translated 2units upward
and 2 units to the right
Translated 1unit
downwards and 1 unit
leftA(-2;2)B(1;2)
C(-2;-1)
Match words in Column A with words in Column B
Column A Column B
Rotation FlipTranslation TurnReflection Slide
Page 20 of 73
Grade 8 Term 3 Mathematics Strategy Learners Worksheets
WORKSHEET: TERM3 GRADE 8 WEEK 3 LESSON 7
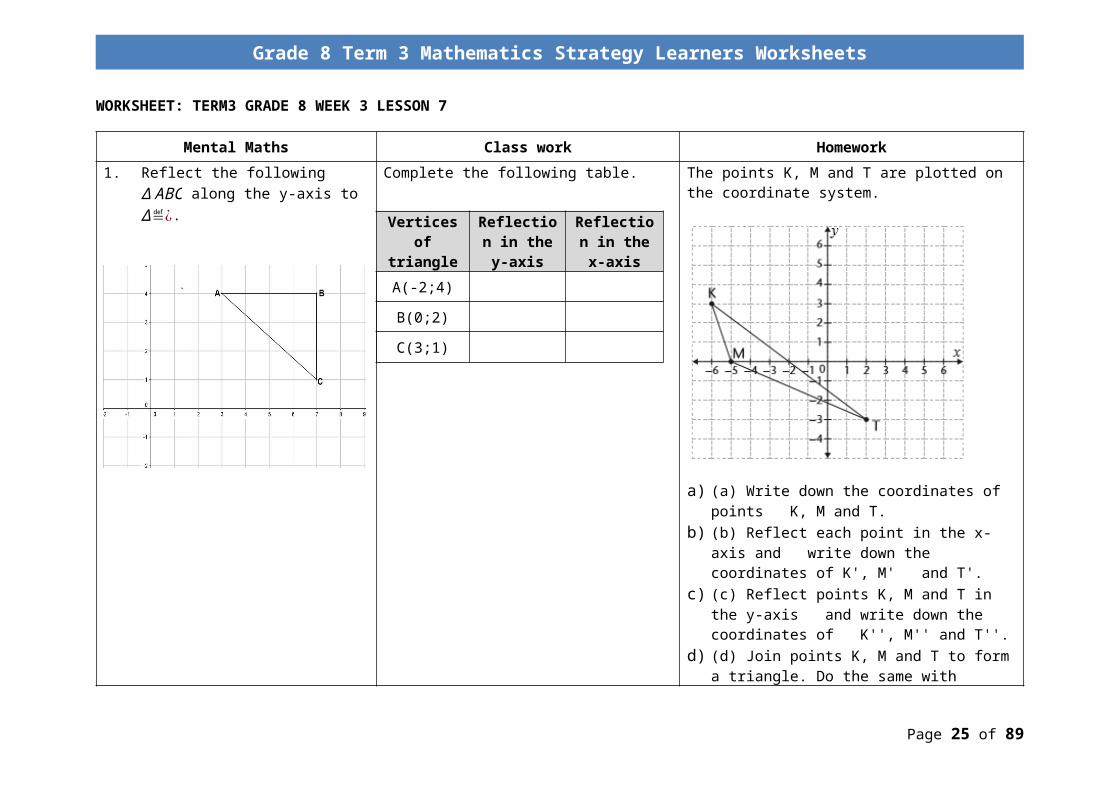
Mental Maths Class work Homework1. Reflect the following ∆ ABC
along the y-axis to∆≝¿.Complete the following table. The points K, M and T are plotted on the
coordinate system.
a) (a) Write down the coordinates of points K, M and T.
b) (b) Reflect each point in the x-axis and write down the coordinates of K', M' and T'.
c) (c) Reflect points K, M and T in the y-axis and write down the coordinates of K'', M'' and T''.
d) (d) Join points K, M and T to form a triangle. Do the same with points K', M' and T', and with points K'', M'' and T''.
Page 21 of 73
Grade 8 Term 3 Mathematics Strategy Learners Worksheets
Vertices of
triangle
Reflection in the y-axis
Reflection in the x-axis
A(-2;4)B(0;2)C(3;1)
Page 22 of 73
Grade 8 Term 3 Mathematics Strategy Learners Worksheets
WORKSHEET: TERM 4 GRADE 8 WEEK3 LESSON 8
Mental Maths Class work Homework1. What do you understand
by the word Rotation about the origin?
2. Write down the co-ordinates of each image after these transformations:a) Rotation 180°
clockwise about the origin. A(1;3) B(5;4) C(4;-3).
b) Is the image and original congruent?
Write Down the co-ordinates of the vertices of ∆ BCD after each rotation described in the table.
Vertices of the
Triangle
180° clockwi
se
90° clockwi
se
90° anti-
clockwise
B(2;4)
C(-1;-1)D(3; -
2)
1. Rotate the following triangle 90° clockwise about the origin and write down the co-ordinates of the vertices of the triangle after rotation.
2. What do you understand by the words:a) Enlargement in transformation.b) Reduction in transformation.c) Scale factor.
3. Is there a relationship between Enlargement and Congruency?
Page 23 of 73
Grade 8 Term 3 Mathematics Strategy Learners Worksheets
Page 24 of 73
Grade 8 Term 3 Mathematics Strategy Learners Worksheets
WORKSHEET: TERM 3 GRADE 8 WEEK 4 LESSON 1
Mental Maths Class work Homework1a) Determine whether the figure
ABCD below is an Enlargement, a Reduction or either of the two of figure JMLK.
b) Calculate the perimeters of both figures.
c) Determine the scale factor.
1. The perimeter of rectangle DEFG = 20cm and its area = 16cm2. Find the perimeter and area of the enlarged rectangle D’E’F’G’ if the scale factor is 3.
2. The perimeter of ∆ JKL = 20cm and its area = 600cm2. Determine the perimeter and area of reduced ∆J'k'L' if the scale factor is 0,5.
3. The perimeter of ∆ STU = 15cm and its area 12cm2. Calculate the perimeter and area of ∆ S ' T ' U ' if the scale factor is 13
4. Determine the scale factor of the following figures with same centre O
1. Do you agree or disagree with the following statements:
a) Perimeter of Enlargement/Reduction = perimeter of original x-scale factor.
b) Area of Enlargement/Reduction = area of original x(scale factor )2.
c) Is there a relationship between Enlargement/Reduction with similarity?
d) Is Enlargement/Reduction a transformation that results in change of shape and size?
2. Determine the scale factor of the figures below.
Page 25 of 73
Grade 8 Term 3 Mathematics Strategy Learners Worksheets
WORKSHEET: TERM 3 GRADE 8 WEEK 4 LESSON 2
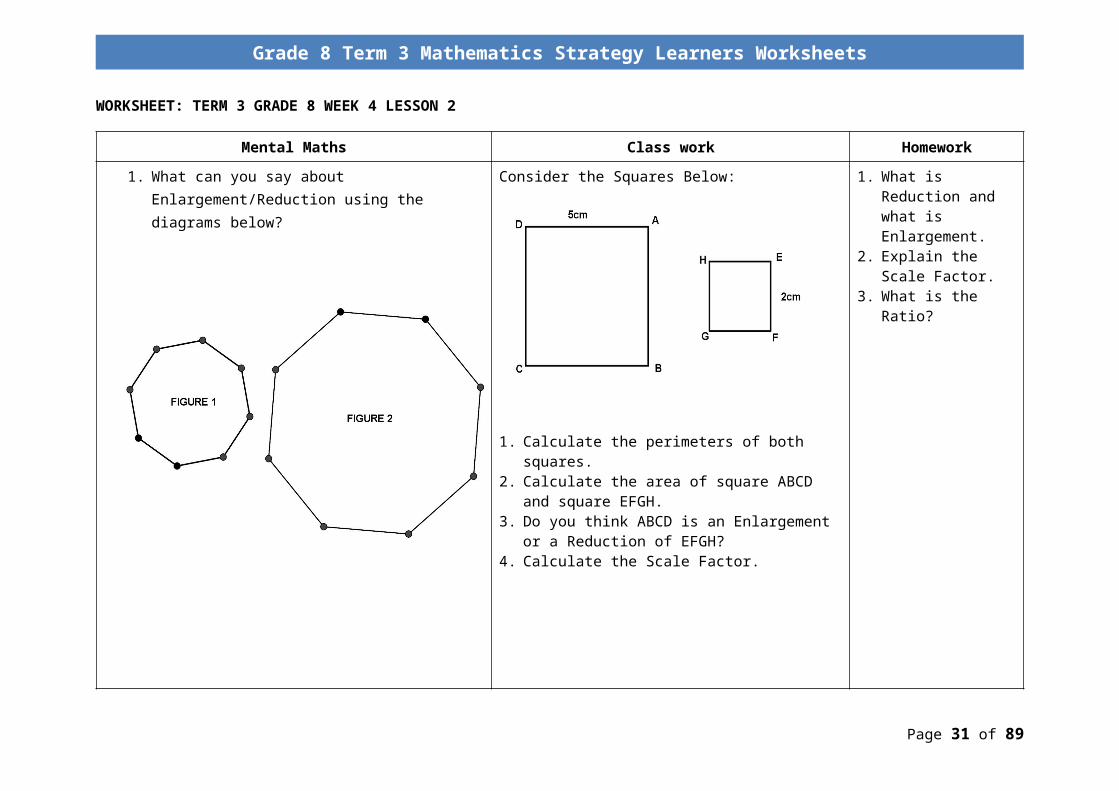
Mental Maths Class work Homework1. What can you say about
Enlargement/Reduction using the diagrams below?
Consider the Squares Below:
1. Calculate the perimeters of both squares.2. Calculate the area of square ABCD and
square EFGH.3. Do you think ABCD is an Enlargement or a
Reduction of EFGH?4. Calculate the Scale Factor.
1. What is Reduction and what is Enlargement.
2. Explain the Scale Factor.
3. What is the Ratio?
Page 26 of 73
Grade 8 Term 3 Mathematics Strategy Learners Worksheets

Page 27 of 73
Grade 8 Term 3 Mathematics Strategy Learners Worksheets
WORSHEET: GRADE 8: TERM 3: WEEK 4: LESSON 3 AND 4
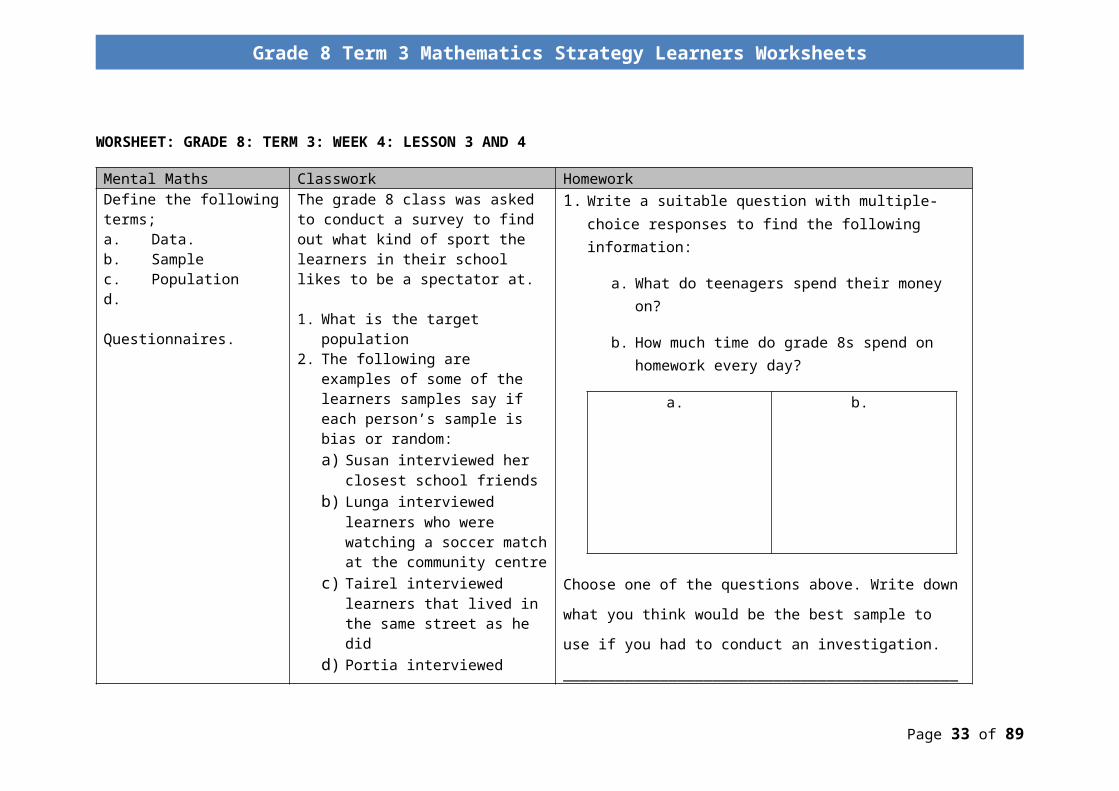
Mental Maths Classwork HomeworkDefine the following terms;a. Data.b. Samplec. Populationd. Questionnaires.
The grade 8 class was asked to conduct a survey to find out what kind of sport the learners in their school likes to be a spectator at.
1. What is the target population2. The following are examples of
some of the learners samples say if each person’s sample is bias or random:a) Susan interviewed her
closest school friends b) Lunga interviewed learners
who were watching a soccer match at the community centre
c) Tairel interviewed learners that lived in the same street as he did
d) Portia interviewed everyone she saw during break
e) Thato interviewed everyone form her school that used her dads spaza shop one weekend.
1. Write a suitable question with multiple-choice responses to find the following information:
a. What do teenagers spend their money on?
b. How much time do grade 8s spend on homework every day?
a. b.
Choose one of the questions above. Write down what you think would be the best sample to use if you had to conduct an investigation. _______________________________________________________________________________________________________________________________________
Page 28 of 73
Grade 8 Term 3 Mathematics Strategy Learners Worksheets

WORKSHEET: TERM 3 GRADE 8 WEEK 4 LESSON 5&6
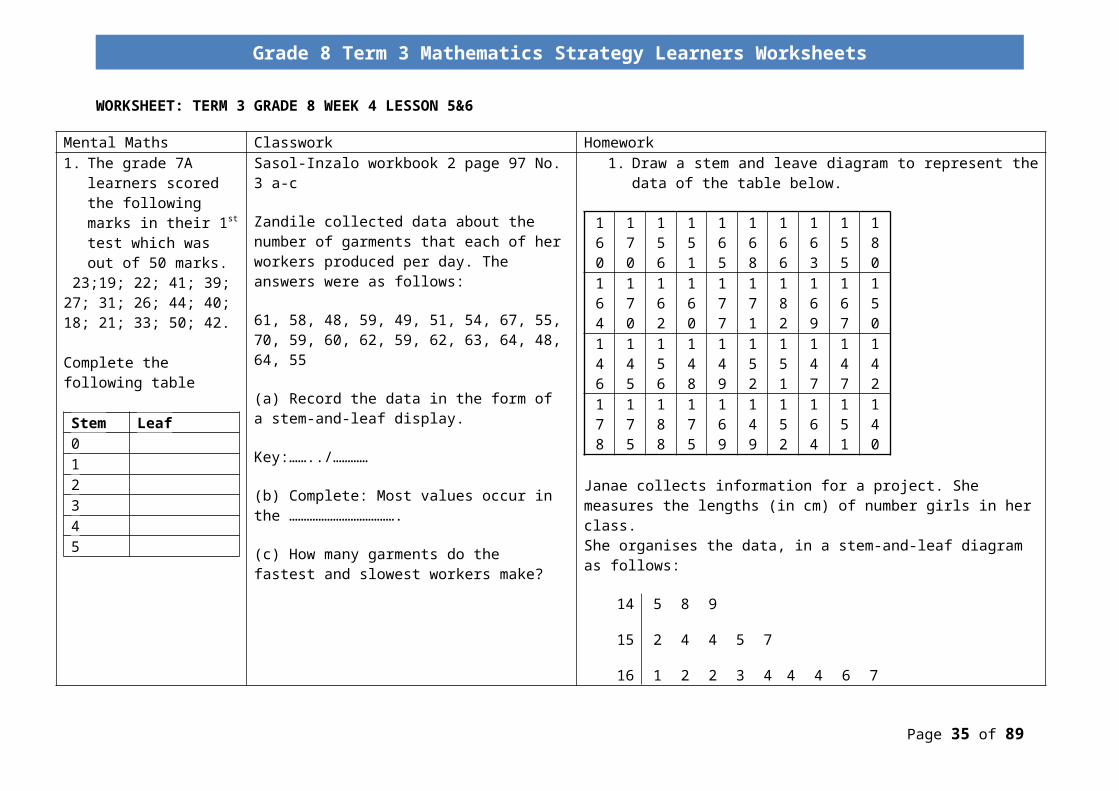
Mental Maths Classwork Homework1. The grade 7A
learners scored the following marks in their 1st test which was out of 50 marks.
23;19; 22; 41; 39; 27; 31; 26; 44; 40; 18; 21; 33; 50; 42.
Complete the following table
Stem Leaf012345
Sasol-Inzalo workbook 2 page 97 No. 3 a-c
Zandile collected data about the number of garments that each of her workers produced per day. The answers were as follows:
61, 58, 48, 59, 49, 51, 54, 67, 55, 70, 59, 60, 62, 59, 62, 63, 64, 48, 64, 55
(a) Record the data in the form of a stem-and-leaf display.
Key:……../…………
(b) Complete: Most values occur in the ……………………………….
(c) How many garments do the fastest and slowest workers make?
1. Draw a stem and leave diagram to represent the data of the table below.
160
170
156
151
165
168
166
163
155
180
164
170
162
160
177
171
182
169
167
150
146
145
156
148
149
152
151
147
147
142
178
175
188
175
169
149
152
164
151
140
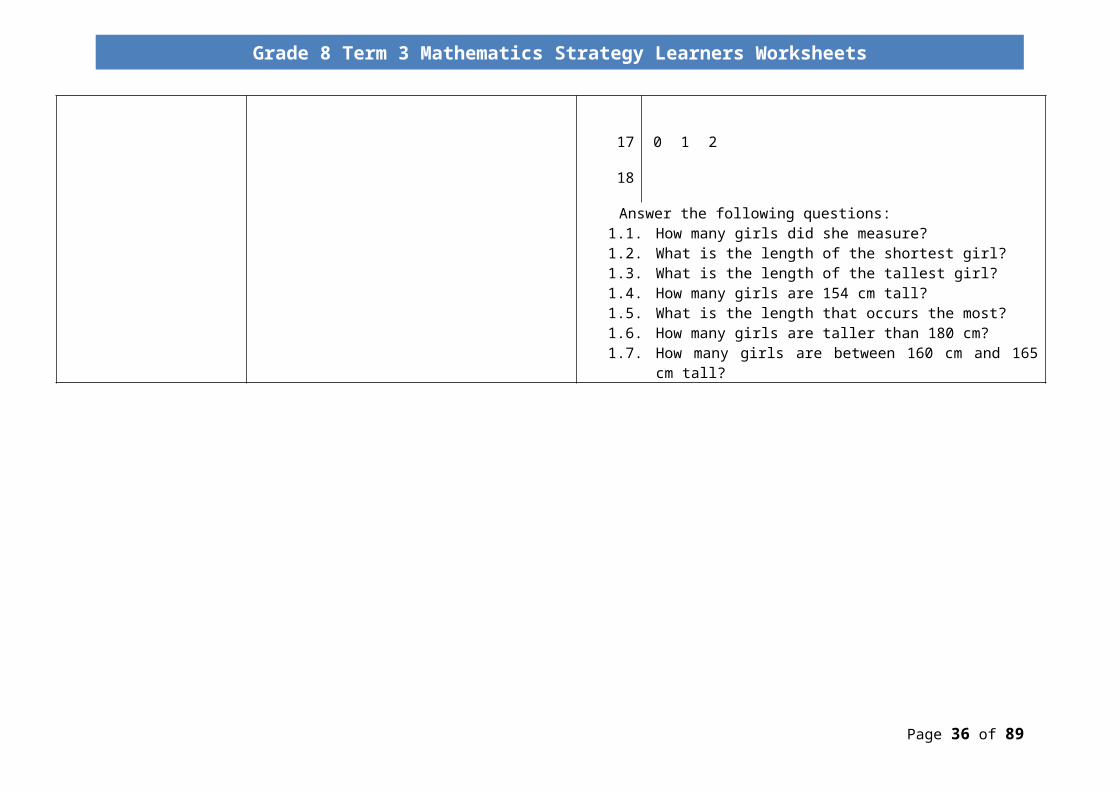
Janae collects information for a project. She measures the lengths (in cm) of number girls in her class. She organises the data, in a stem-and-leaf diagram as follows:
14 5 8 9
15 2 4 4 5 7
16 1 2 2 3 4 4 4 6 7
17 0 1 2
18
Answer the following questions:
Page 29 of 73
Grade 8 Term 3 Mathematics Strategy Learners Worksheets

1.1. How many girls did she measure?1.2. What is the length of the shortest girl?1.3. What is the length of the tallest girl?1.4. How many girls are 154 cm tall?1.5. What is the length that occurs the most?1.6. How many girls are taller than 180 cm? 1.7. How many girls are between 160 cm and 165 cm
tall?
Page 30 of 73
Grade 8 Term 3 Mathematics Strategy Learners Worksheets
WORSHEET: TERM 3 GRADE 8 WEEK 4 LESSON 7 & 8
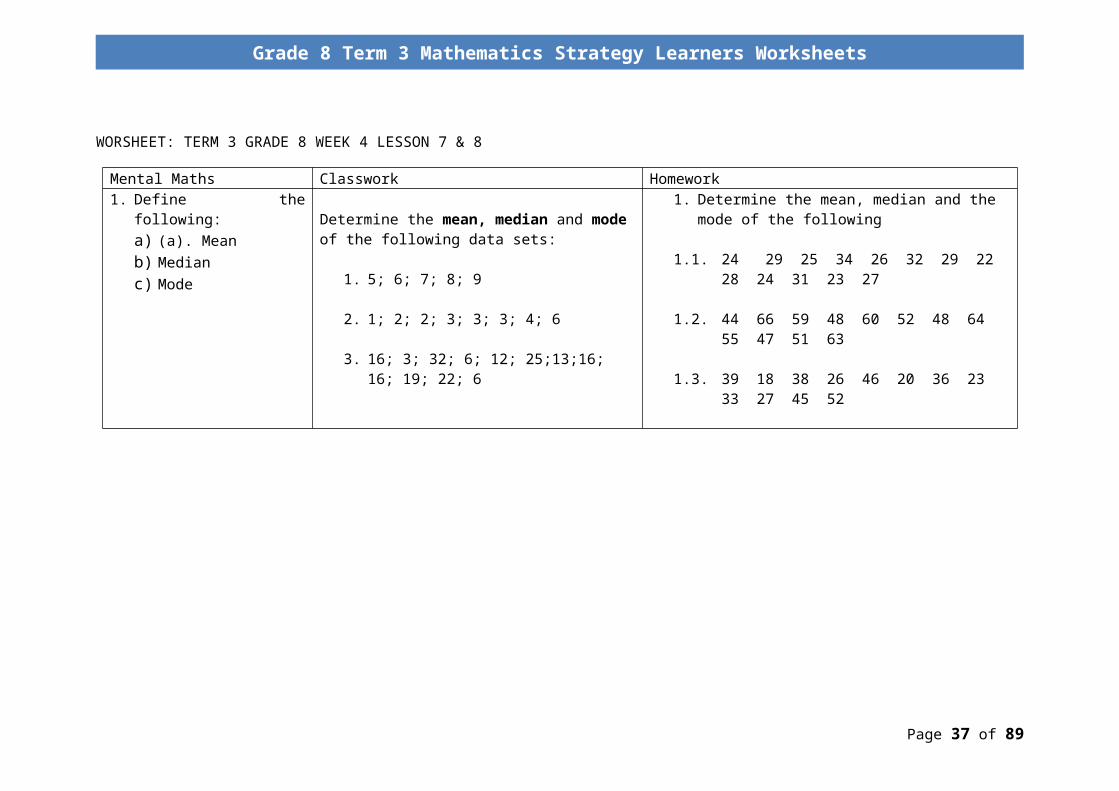
Mental Maths Classwork Homework1. Define the following:
a) (a). Meanb) Medianc) Mode
Determine the mean, median and mode of the following data sets:
1. 5; 6; 7; 8; 9
2. 1; 2; 2; 3; 3; 3; 4; 6
3. 16; 3; 32; 6; 12; 25;13;16; 16; 19; 22; 6
1. Determine the mean, median and the mode of the following
1.1. 24 29 25 34 26 32 29 22 28 24 31 23 27
1.2. 44 66 59 48 60 52 48 64 55 47 51 63
1.3. 39 18 38 26 46 20 36 23 33 27 45 52
Page 31 of 73
Grade 8 Term 3 Mathematics Strategy Learners Worksheets

WORKSHEET: TERM 3 GRADE 8 WEEK 5 LESSON 1 & 2
MENTAL MATHS
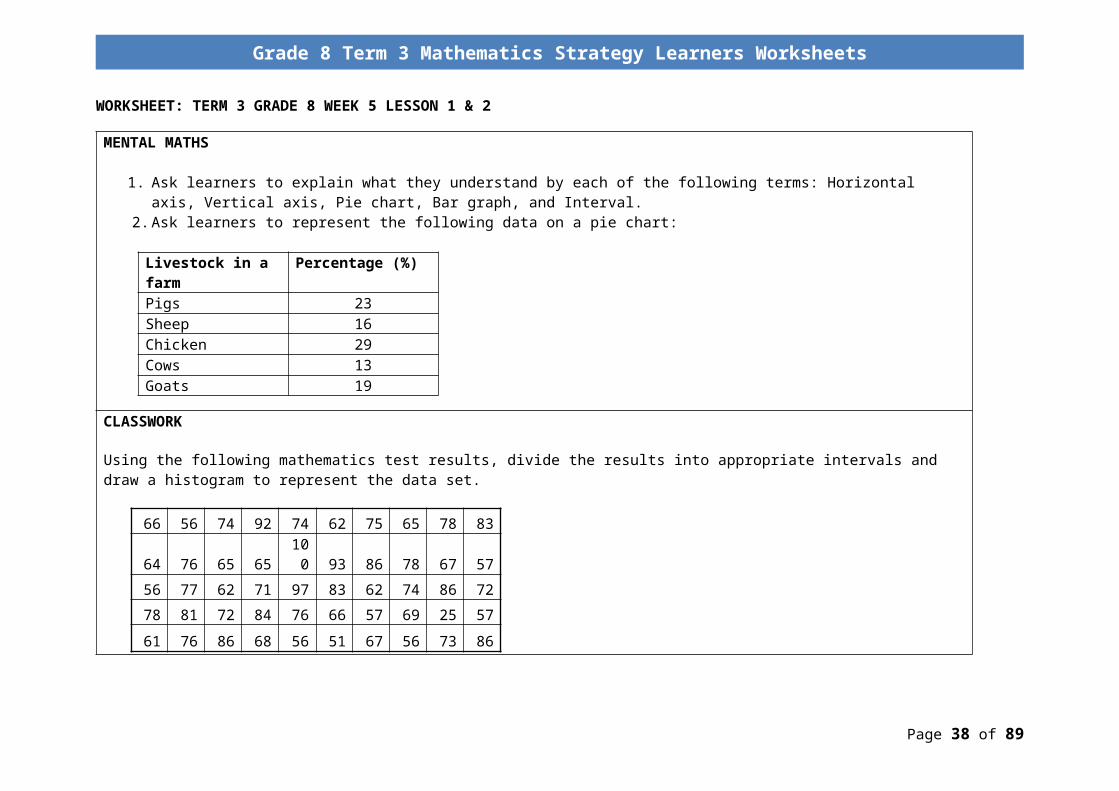
1. Ask learners to explain what they understand by each of the following terms: Horizontal axis, Vertical axis, Pie chart, Bar graph, and Interval.
2. Ask learners to represent the following data on a pie chart:
Livestock in a farm
Percentage (%)
Pigs 23Sheep 16Chicken 29Cows 13Goats 19
CLASSWORK
Using the following mathematics test results, divide the results into appropriate intervals and draw a histogram to represent the data set.
66 56 74 92 74 62 75 65 78 83
64 76 65 6510
0 93 86 78 67 5756 77 62 71 97 83 62 74 86 7278 81 72 84 76 66 57 69 25 5761 76 86 68 56 51 67 56 73 86
Page 32 of 73
Grade 8 Term 3 Mathematics Strategy Learners Worksheets
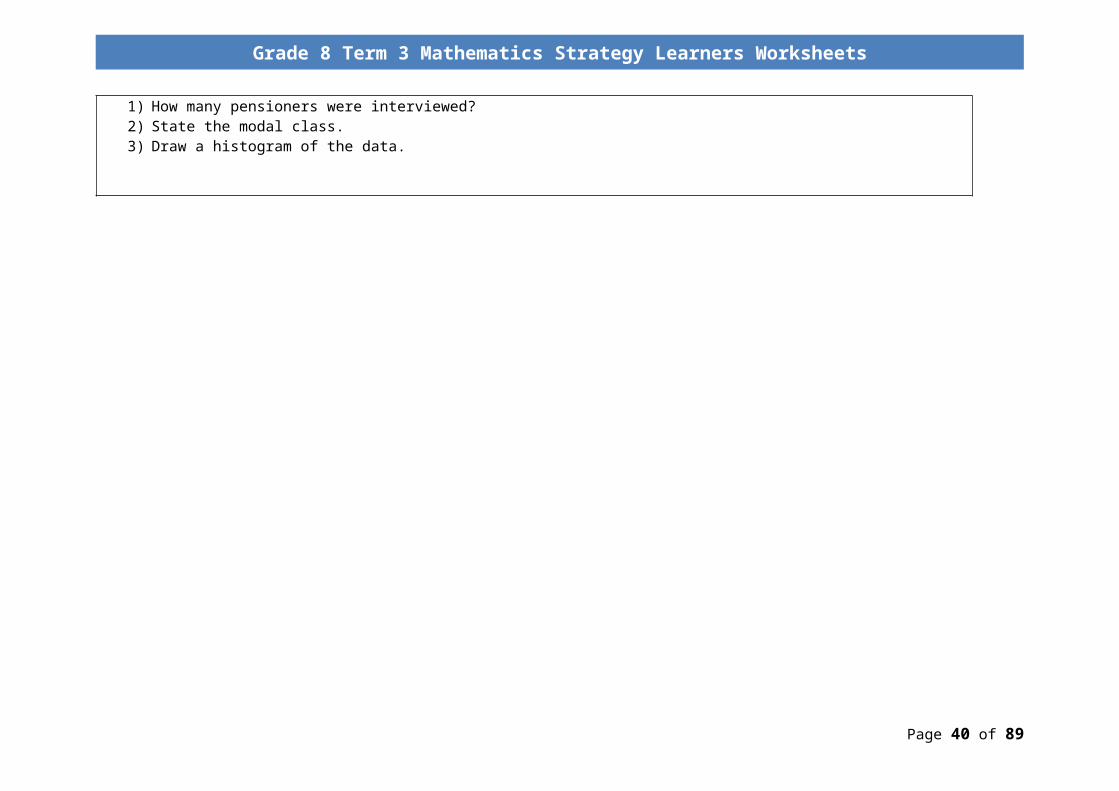
HOMEWORK
A group of pensioners were asked which age in their lives was most productive. The table below shows data collected from that survey.
Age Tally Frequency
0 ≤ x ∠ 10 //// 4
10 ≤ x ∠20 //// 5
20≤ x ∠ 30 //// //// // 12
30 ≤ x ∠ 40 //// //// //// 15
40 ≤ x ∠ 50 //// //// 9
50≤ x ∠ 60 // 2
60 ≤ x ∠ 70 // 2
70 ≤ x ∠ 80 / 1
1) How many pensioners were interviewed?2) State the modal class.3) Draw a histogram of the data.
Page 33 of 73
Grade 8 Term 3 Mathematics Strategy Learners Worksheets

WORKSHEET: TERM 3 GRADE 8 WEEK 5 LESSON 3
Mental Maths
1.Define the following:(a) Discrete data(b) Ordered number pair(c) Plotting
2. Plot the following points on a system of axes. (a) (2;5) (b) (3;1) (c) (4;0) (d) (0;3)
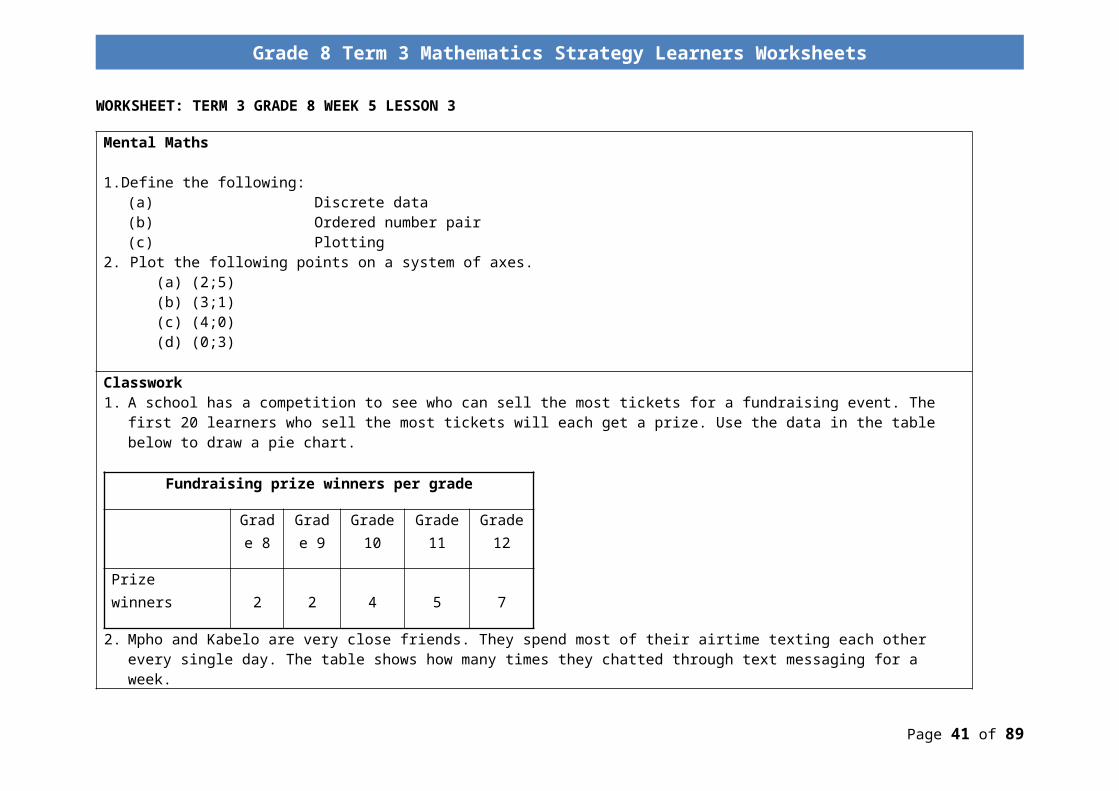
Classwork 1. A school has a competition to see who can sell the most tickets for a fundraising event. The first 20 learners who
sell the most tickets will each get a prize. Use the data in the table below to draw a pie chart.
Fundraising prize winners per grade
Grade 8
Grade 9
Grade 10
Grade 11
Grade 12
Prize winners 2 2 4 5 7
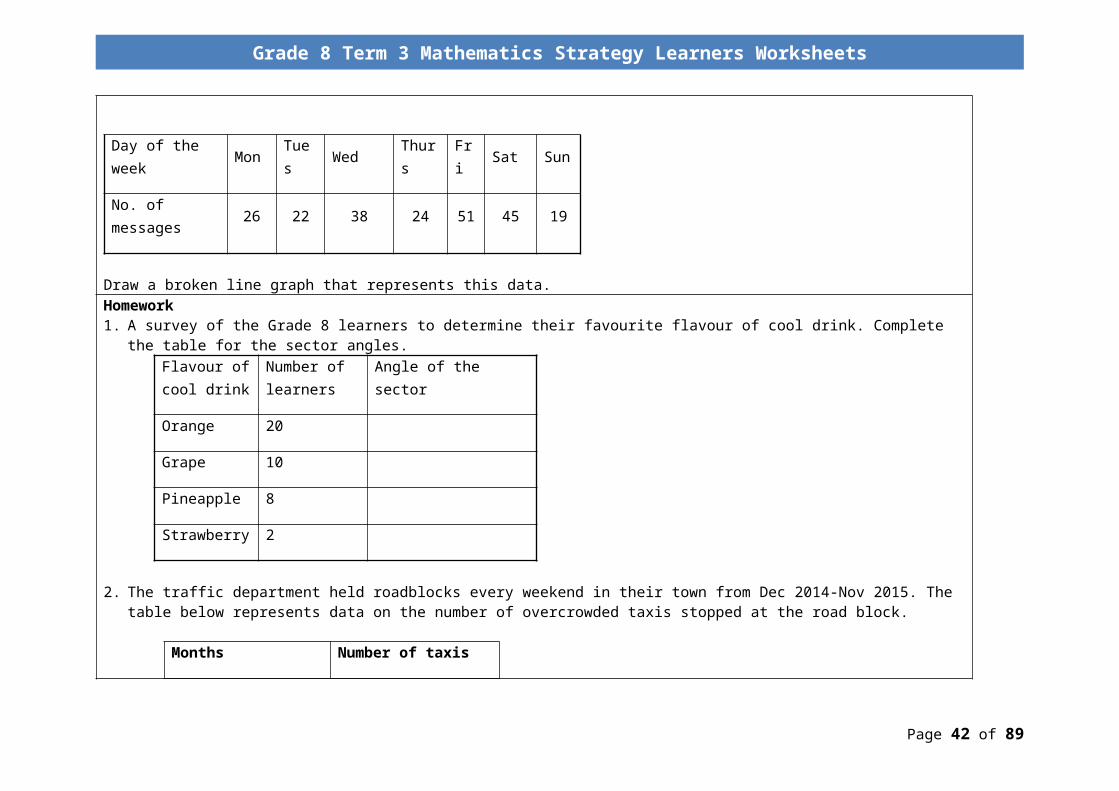
2. Mpho and Kabelo are very close friends. They spend most of their airtime texting each other every single day. The table shows how many times they chatted through text messaging for a week.
Day of the week Mon Tue
s Wed Thurs Fri Sat Sun
No. of messages 26 22 38 24 51 45 19
Page 34 of 73
Grade 8 Term 3 Mathematics Strategy Learners Worksheets
Draw a broken line graph that represents this data.Homework1. A survey of the Grade 8 learners to determine their favourite flavour of cool drink. Complete the table for the
sector angles.Flavour of cool drink
Number of learners Angle of the sector
Orange 20
Grape 10
Pineapple 8
Strawberry 2
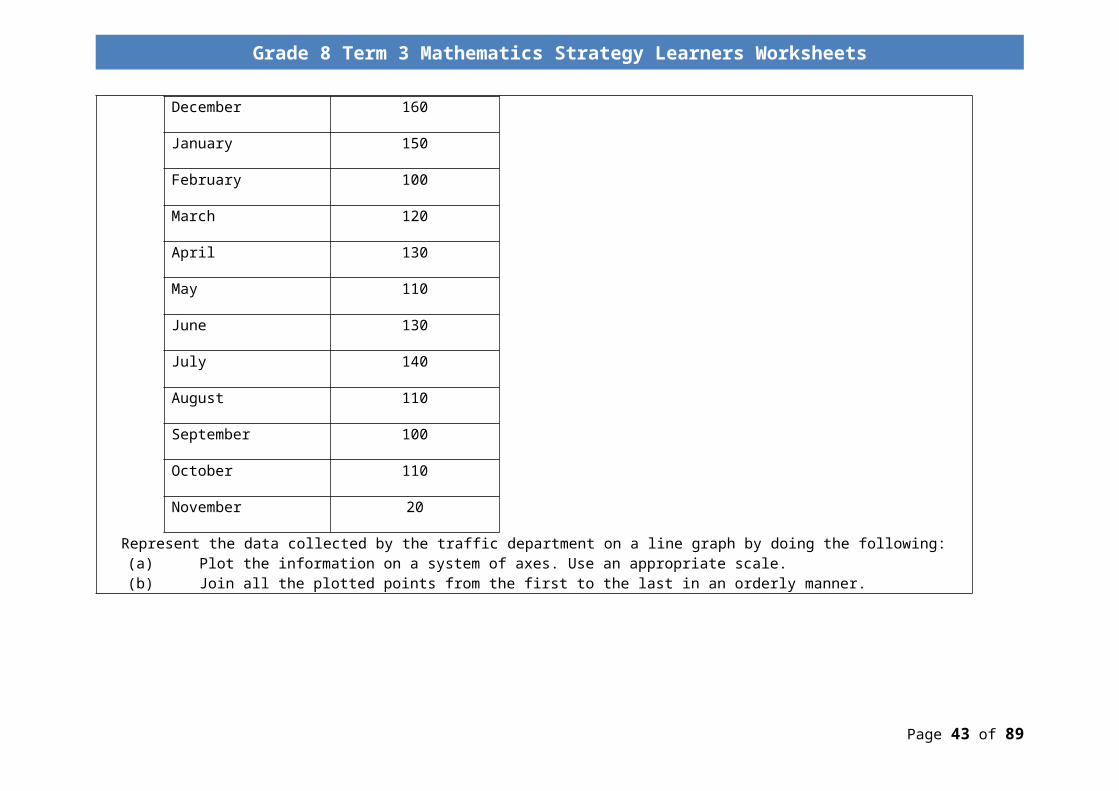
2. The traffic department held roadblocks every weekend in their town from Dec 2014-Nov 2015. The table below represents data on the number of overcrowded taxis stopped at the road block.
Months Number of taxis
December 160
January 150
February 100
March 120
April 130
May 110
June 130
Page 35 of 73
Grade 8 Term 3 Mathematics Strategy Learners Worksheets
July 140
August 110
September 100
October 110
November 20
Represent the data collected by the traffic department on a line graph by doing the following:(a) Plot the information on a system of axes. Use an appropriate scale.(b) Join all the plotted points from the first to the last in an orderly manner.
Page 36 of 73
Grade 8 Term 3 Mathematics Strategy Learners Worksheets
WORKSHEET: TERM 3 GRADE 8 WEEK 5 LESSON 4&5
Mental Maths
1. What is the difference between the following:(a) Discrete data and continuous data.(b) Bar graph and histogram.
2. What will be the size of a sector angle on a pie chart if 25% of leaners in a class of 40 performed below average in Mathematics?
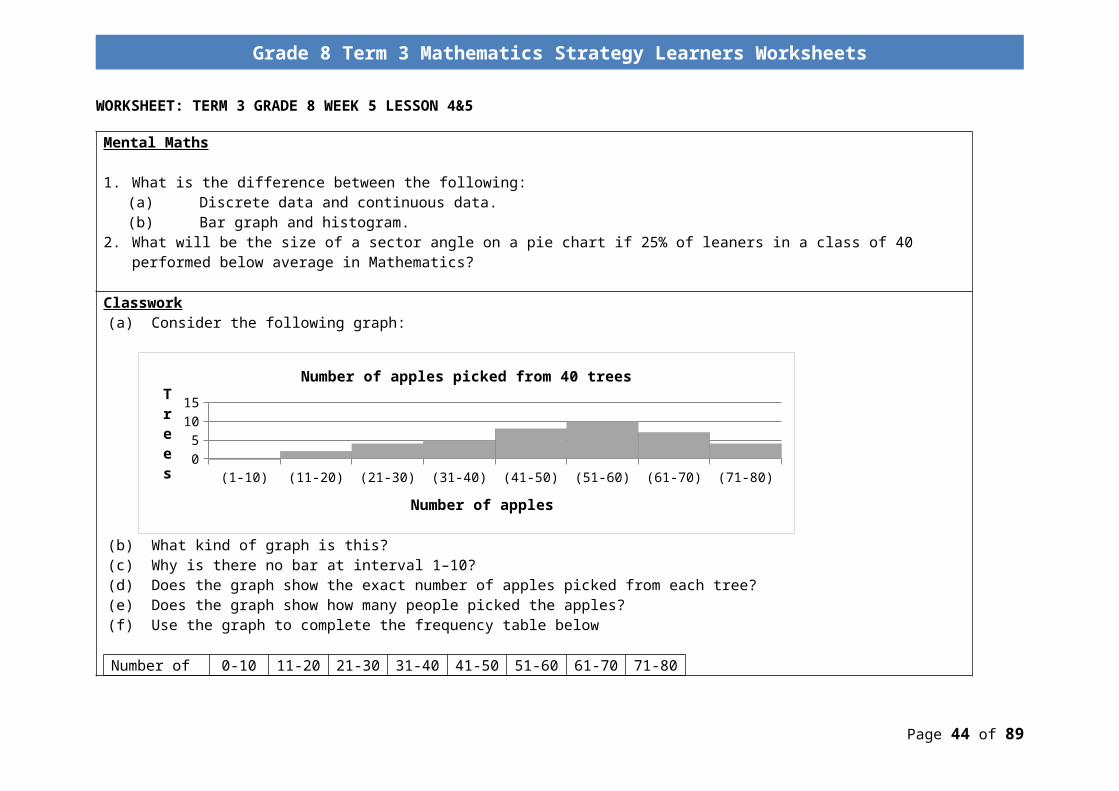
Classwork(a) Consider the following graph:
(1-10) (11-20) (21-30) (31-40) (41-50) (51-60) (61-70) (71-80)0
4
8
12
Number of apples picked from 40 trees
Number of apples
Trees
(b) What kind of graph is this?(c) Why is there no bar at interval 1–10?(d) Does the graph show the exact number of apples picked from each tree?(e) Does the graph show how many people picked the apples?(f) Use the graph to complete the frequency table below
Number of apples 0-10 11-20 21-30 31-40 41-50 51-60 61-70 71-80No. of Trees
2 The following data shows the highest level of schooling completed by a selected group of people.
Page 37 of 73
Grade 8 Term 3 Mathematics Strategy Learners Worksheets
Highest level of schooling completed
Number of people
Fraction of whole
Percentage of whole
Some primary school grades
36
All primary school grades
54
Some high school grades
72
All high school grades
18
(a) How many people make up the whole group?(b) Complete the third column by working out a fraction that each category makes up of the whole group.(c) Complete the fourth column by working out the percentage that each category makes up of the whole group.(d) Draw a pie chart showing representation of the data.
Page 38 of 73
Grade 8 Term 3 Mathematics Strategy Learners Worksheets

Homework
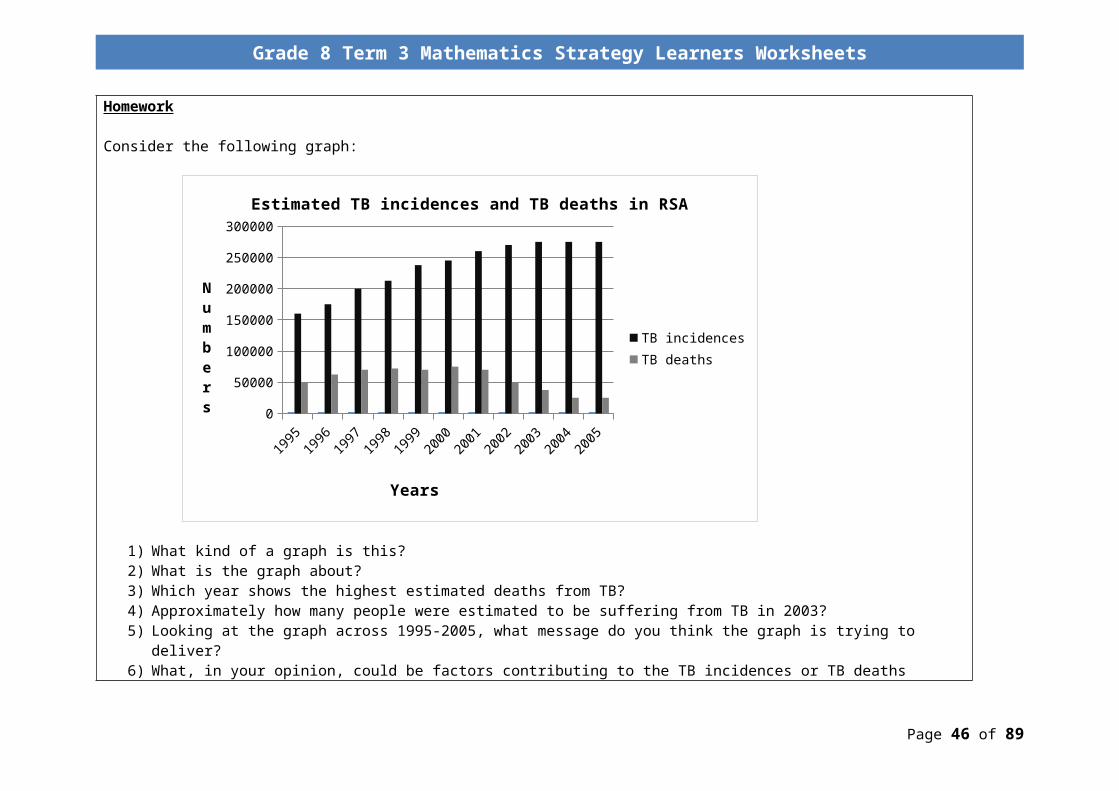
Consider the following graph:
1995 1996 1997 1998 1999 2000 2001 2002 2003 2004 20050
50000
100000
150000
200000
250000
300000
Estimated TB incidences and TB deaths in RSA
TB incidencesTB deaths
Years
Numbers
1) What kind of a graph is this?2) What is the graph about?3) Which year shows the highest estimated deaths from TB?4) Approximately how many people were estimated to be suffering from TB in 2003?5) Looking at the graph across 1995-2005, what message do you think the graph is trying to deliver?6) What, in your opinion, could be factors contributing to the TB incidences or TB deaths displayed by the data?7) How do you explain the TB incidences from 2003-2005? What do you think we have such a situation?
Page 39 of 73
Grade 8 Term 3 Mathematics Strategy Learners Worksheets
WORKSHEET: TERM 3 GRADE 8 WEEK 5 LESSON 6 &7
Mental maths
1. Explain the difference between the following :(a) Sample and population(b) Scale and frequency(c) Mean, median and mode
2. Find the mean, mode and median of the following set of numbers: 5; 7; 3; 12; 4; 6; 3; 10; 1; 15; 19
Classwork
1. John tries to sell his house in London. He drew the graph below and included it in his advert.
Page 40 of 73
Grade 8 Term 3 Mathematics Strategy Learners Worksheets
(a) What impression has John tried to give and why is this graph misleading?(b) What is the average increment amount in the price of the house from the first year to the second?(c) Try to draw a more accurate bar graph to illustrate the average house price over the two years.
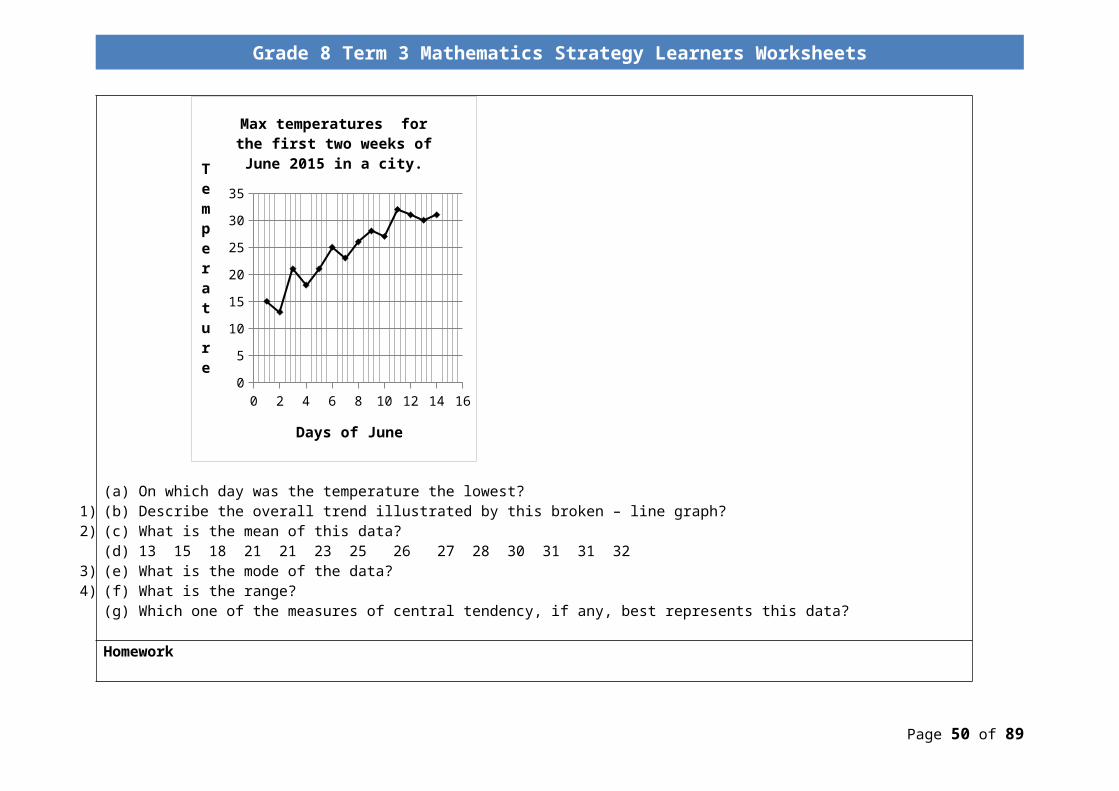
2. The following broken line graph represents the maximum temperatures (in 0C) for the first 2 weeks of June 2015 in a city.
0 2 4 6 8 10 12 14 160
5
10
15
20
25
30
35
Max temperatures for the first two weeks of June 2015 in a city.
Days of June
Temperature
(a) On which day was the temperature the lowest?1) (b) Describe the overall trend illustrated by this broken – line graph?2) (c) What is the mean of this data?
(d) 13 15 18 21 21 23 25 26 27 28 30 31 31 323) (e) What is the mode of the data?4) (f) What is the range?
(g) Which one of the measures of central tendency, if any, best represents this data?
Page 41 of 73
Grade 8 Term 3 Mathematics Strategy Learners Worksheets
Homework
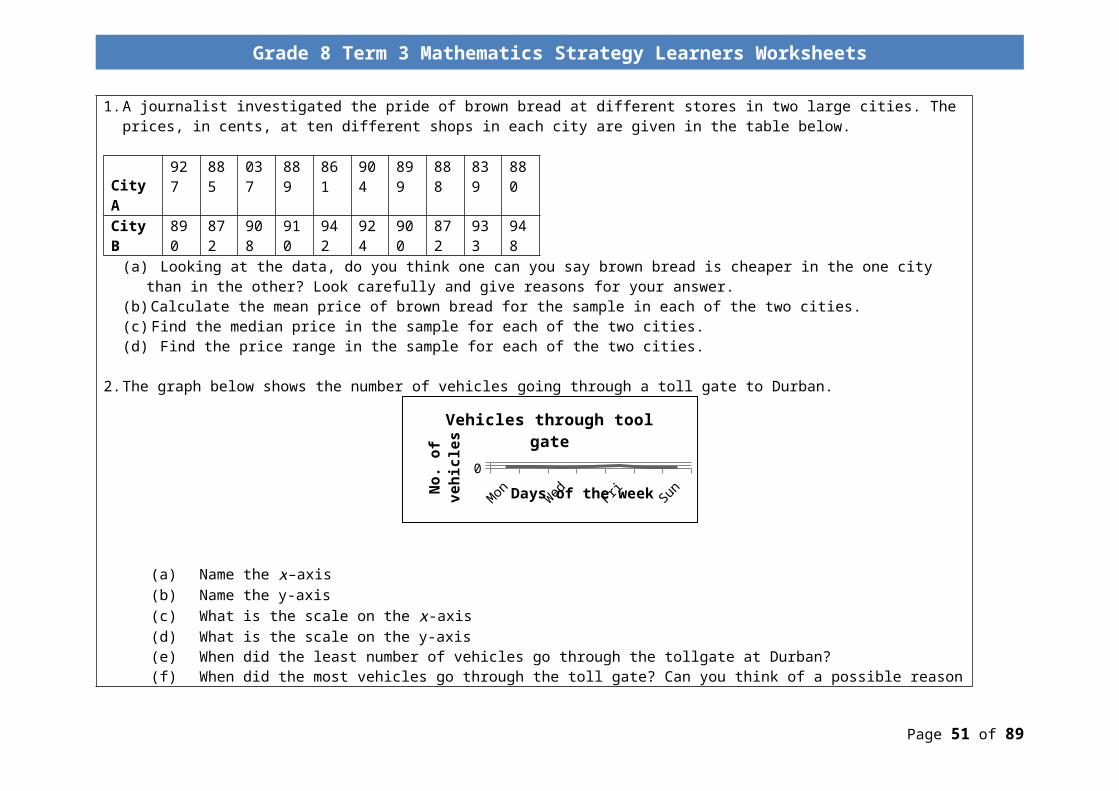
1. A journalist investigated the pride of brown bread at different stores in two large cities. The prices, in cents, at ten different shops in each city are given in the table below.
City A
927
885
037
889
861
904
899
888
839
880
City B
890
872
908
910
942
924
900
872
933
948
(a) Looking at the data, do you think one can you say brown bread is cheaper in the one city than in the other? Look carefully and give reasons for your answer.
(b) Calculate the mean price of brown bread for the sample in each of the two cities.(c) Find the median price in the sample for each of the two cities.(d) Find the price range in the sample for each of the two cities.
2. The graph below shows the number of vehicles going through a toll gate to Durban.
Mon Tues Wed Thur Fri Sat Sun0
10000Vehicles through tool gate
Days of the weekNo.
of v
ehic
les
(a) Name the x–axis(b) Name the y-axis(c) What is the scale on the x-axis(d) What is the scale on the y-axis(e) When did the least number of vehicles go through the tollgate at Durban?(f) When did the most vehicles go through the toll gate? Can you think of a possible reason for this?(g) Which is the dependent variable?
Page 42 of 73
Grade 8 Term 3 Mathematics Strategy Learners Worksheets
(h) Which is the independent variable?WORKSHEET: GRADE 8 TERM 3 WEEK 5 LESSON 8
Mental Maths1. Define the following terms:
(a) Graph.(b) Ordered number pair.(c) Outlier.
2. Describe the shapes of the following graphs:Bar graph, double bar graph, pie chart, histogram, linear graph, broken line graph.
Classwork
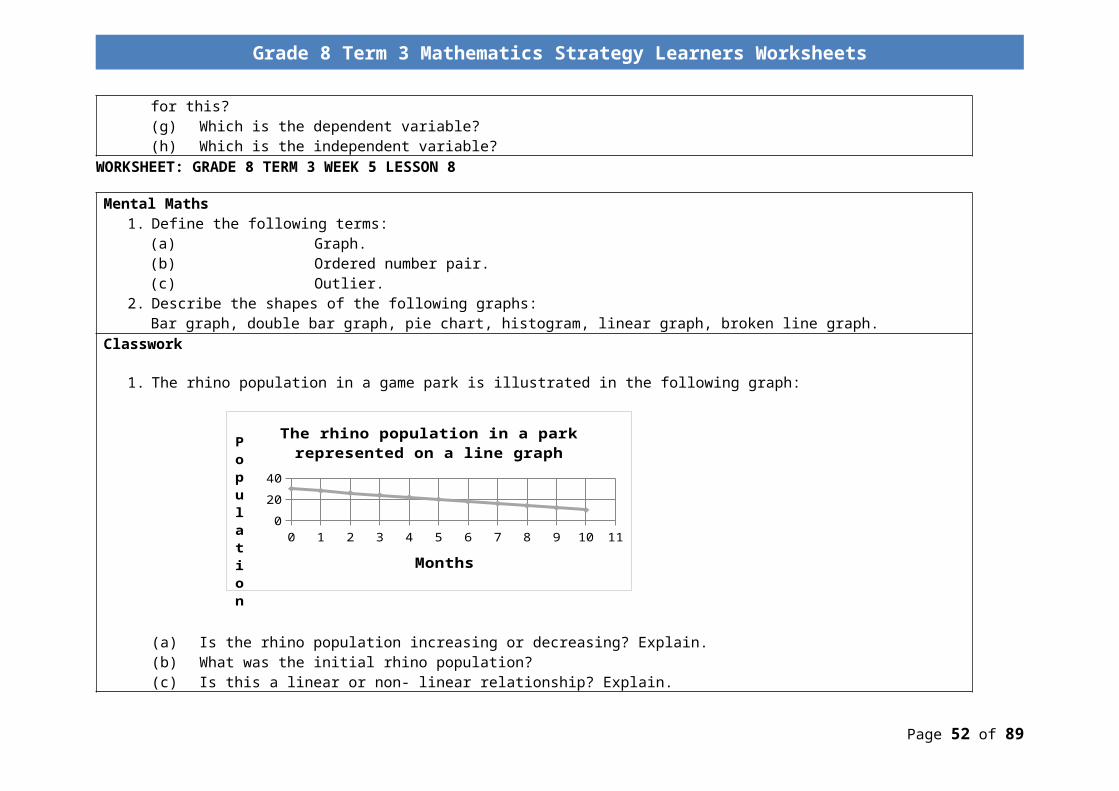
1. The rhino population in a game park is illustrated in the following graph:
0 1 2 3 4 5 6 7 8 9 10 110
10203040
The rhino population in a park represented on a line graph
Months
Population
(a) Is the rhino population increasing or decreasing? Explain.(b) What was the initial rhino population?(c) Is this a linear or non- linear relationship? Explain.(d) On average, how many rhinos die every month?(e) If this trend continues, how long will it take before there won’t be any rhinos left in the park?(f) What measure do you think should be put in place to reduce the death of these rhinos?
Page 43 of 73
Grade 8 Term 3 Mathematics Strategy Learners Worksheets
2. The manager of a small business is asked what monthly salaries his employees get, and his answer was: “the mean of the salaries is R13 731”.
(a) Do you think the manager’s answer is a good description of the salaries?(b) In order to have some sense of the salaries paid at the firm, which one of the following would you prefer to
know: the median or the mode or the range or the lowest and the highest salaries? Explain your choice.Homework
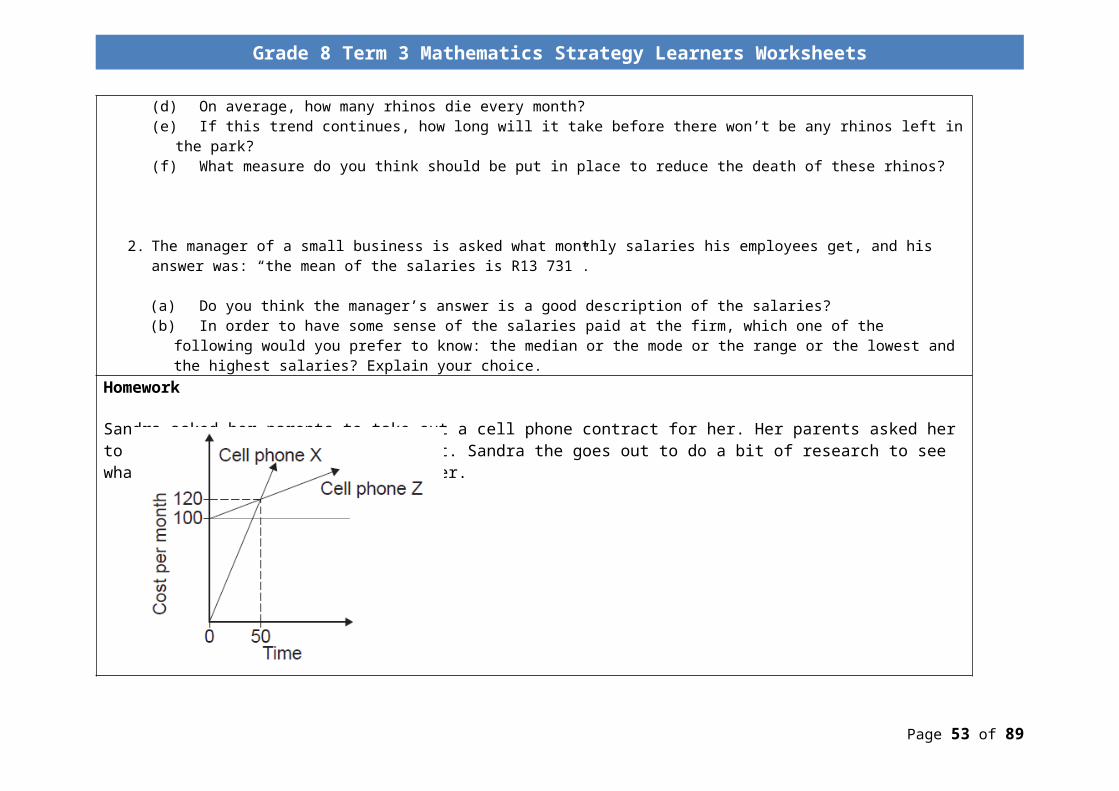
Sandra asked her parents to take out a cell phone contract for her. Her parents asked her to find the most reasonable contract. Sandra the goes out to do a bit of research to see what would be the best option for her.
1. Which company has the highest basic service fee?2. What will the cost be per phone if she spoke on the phone for 50 minutes?
Page 44 of 73
Grade 8 Term 3 Mathematics Strategy Learners Worksheets

3. On which contract will she get free talk time4. Which contract will be the cheapest is she speaks for less than 50 minutes?5. Which company will give Sandra’s parents the best value for money (assuming that Sandra is only allowed to
speak on the phone for 100 minutes per month, but she never speaks for less than that)?
Page 45 of 73
Grade 8 Term 3 Mathematics Strategy Learners Worksheets
WORKSHEET: TERM 3 GRADE 8 WEEK 6 LESSON 1 &2
Mental Maths1)What is chance of getting:
a. an even number when you roll a dice once?b. an odd number when you roll a dice once?c. an Ace whenever you draw one card from a pack of 52 playing cards?
OR
a) If you spun the spinner 1 time, what is the probability it would land on a grey piece?b) If you spun the spinner 1 time, what is the probability it would land on a black piece?c) If you spun the spinner 1 time, what is the probability it would land on a white piece?
1) Mandla rolls a dice just once each day before going to school.a. What are the possible outcomes of rolling a dice once? b. Are the six outcomes of rolling a dice equally likely?
Classwork Sasol-Inzalo book pages 231 number 1 and 2 and 3Jayden lives close to the sea. He goes fishing every day. Some days he catches no fish, but on some days he catches several fish. He never catches more than five fish in a day. He has decided that he will always stop fishing when he has caught five fish in one day.1. What are the different possible outcomes of each of Jayden’s daily fishing trips?
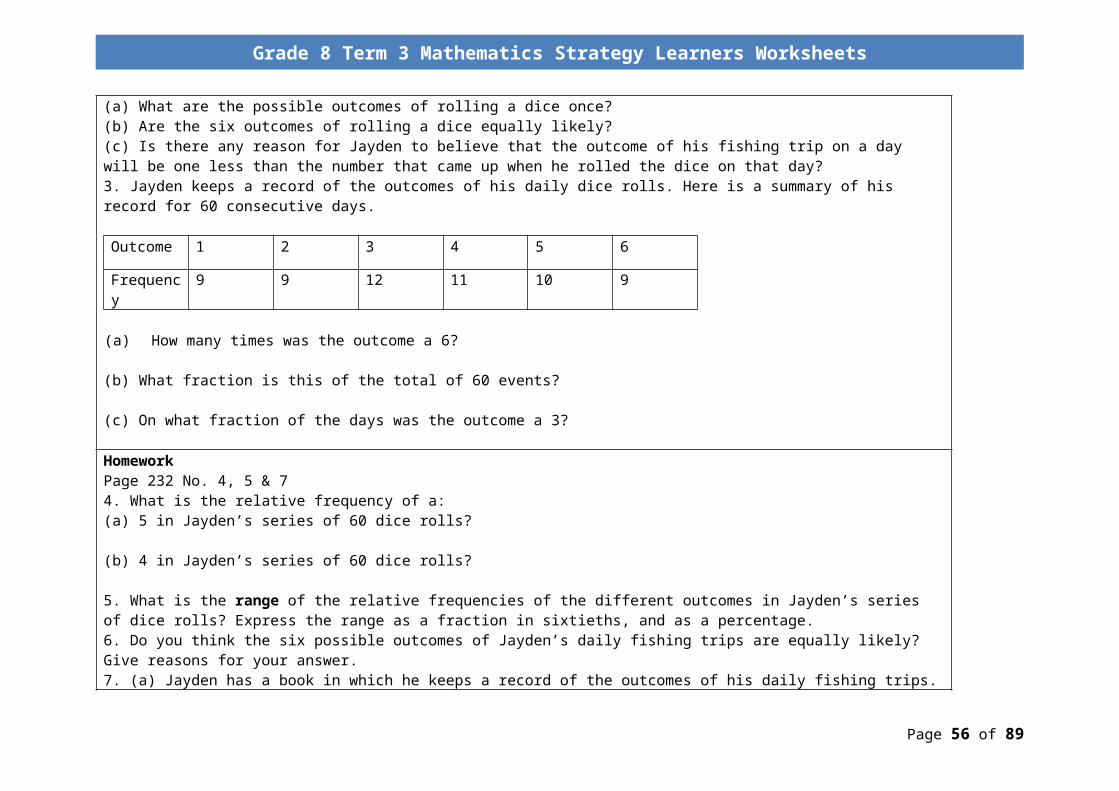
2. Jayden rolls a dice just once each day before he goes fishing.(a) What are the possible outcomes of rolling a dice once? (b) Are the six outcomes of rolling a dice equally likely? (c) Is there any reason for Jayden to believe that the outcome of his fishing trip on a day will be one less than the number that came up when he rolled the dice on that day?
Page 46 of 73
Grade 8 Term 3 Mathematics Strategy Learners Worksheets
3. Jayden keeps a record of the outcomes of his daily dice rolls. Here is a summary of his record for 60 consecutive days.
Outcome 1 2 3 4 5 6
Frequency
9 9 12 11 10 9
(a) How many times was the outcome a 6?
(b) What fraction is this of the total of 60 events?
(c) On what fraction of the days was the outcome a 3?
HomeworkPage 232 No. 4, 5 & 74. What is the relative frequency of a:(a) 5 in Jayden’s series of 60 dice rolls?
(b) 4 in Jayden’s series of 60 dice rolls?
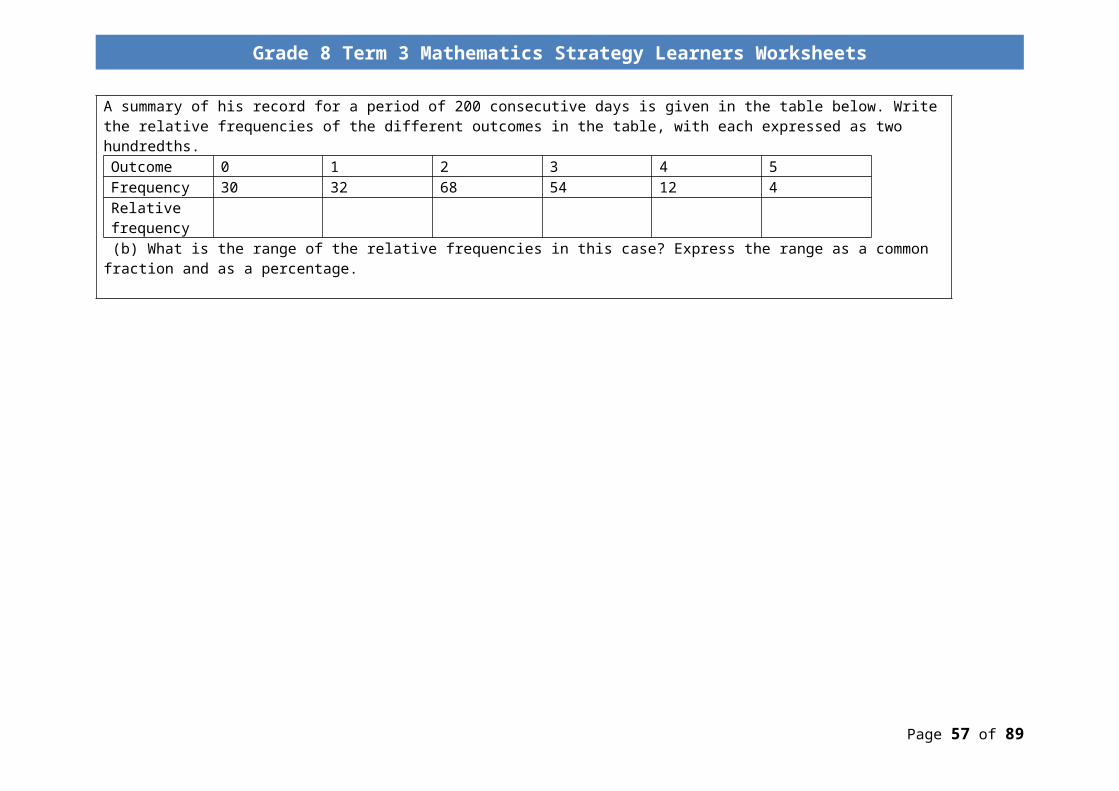
5. What is the range of the relative frequencies of the different outcomes in Jayden’s series of dice rolls? Express the range as a fraction in sixtieths, and as a percentage.6. Do you think the six possible outcomes of Jayden’s daily fishing trips are equally likely? Give reasons for your answer.7. (a) Jayden has a book in which he keeps a record of the outcomes of his daily fishing trips. A summary of his record for a period of 200 consecutive days is given in the table below. Write the relative frequencies of the different outcomes in the table, with each expressed as two hundredths.Outcome 0 1 2 3 4 5Frequency 30 32 68 54 12 4Relative frequency
(b) What is the range of the relative frequencies in this case? Express the range as a common fraction and as a percentage.
Page 47 of 73
Grade 8 Term 3 Mathematics Strategy Learners Worksheets

Page 48 of 73
Grade 8 Term 3 Mathematics Strategy Learners Worksheets
WORKSHEET: TERM 3 GRADE 8 WEEK 6 LESSON 3&4
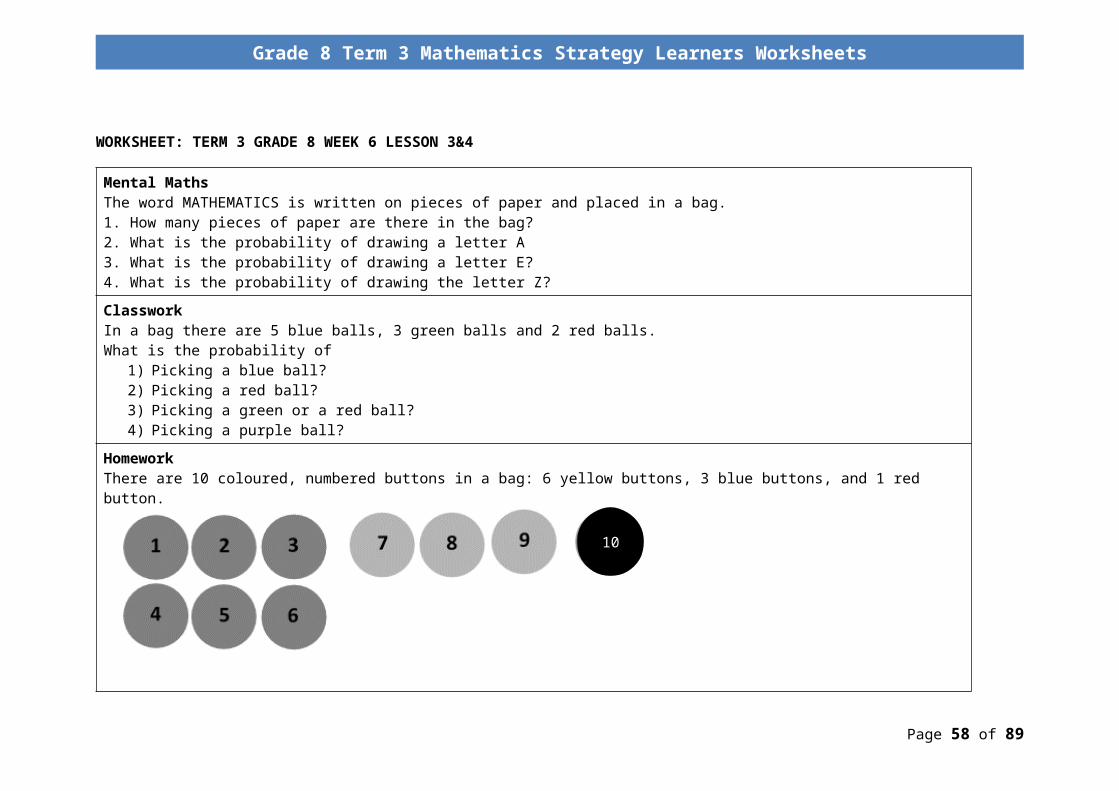
Mental MathsThe word MATHEMATICS is written on pieces of paper and placed in a bag.1. How many pieces of paper are there in the bag? 2. What is the probability of drawing a letter A 3. What is the probability of drawing a letter E? 4. What is the probability of drawing the letter Z? ClassworkIn a bag there are 5 blue balls, 3 green balls and 2 red balls.What is the probability of
1) Picking a blue ball?2) Picking a red ball?3) Picking a green or a red ball?4) Picking a purple ball?
HomeworkThere are 10 coloured, numbered buttons in a bag: 6 yellow buttons, 3 blue buttons, and 1 red button.
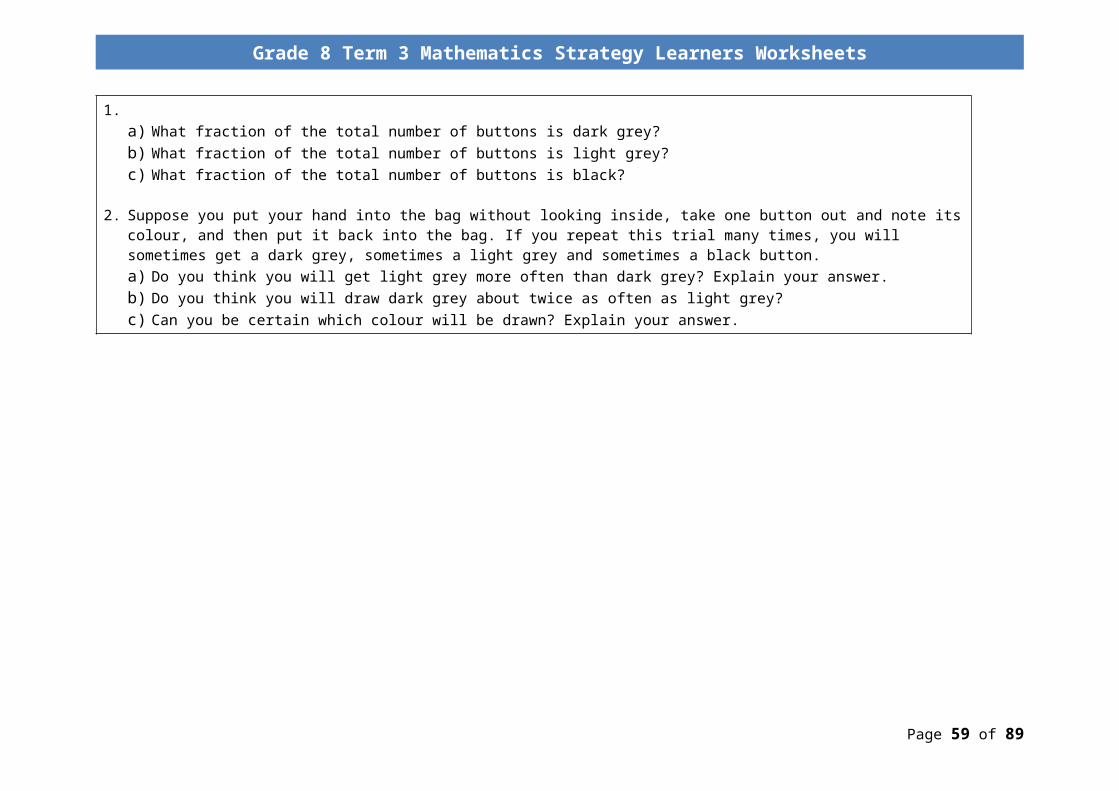
1.a) What fraction of the total number of buttons is dark grey? b) What fraction of the total number of buttons is light grey?c) What fraction of the total number of buttons is black?
Page 49 of 73
Grade 8 Term 3 Mathematics Strategy Learners Worksheets
10
2. Suppose you put your hand into the bag without looking inside, take one button out and note its colour, and then put it back into the bag. If you repeat this trial many times, you will sometimes get a dark grey, sometimes a light grey and sometimes a black button.a) Do you think you will get light grey more often than dark grey? Explain your answer.b) Do you think you will draw dark grey about twice as often as light grey?c) Can you be certain which colour will be drawn? Explain your answer.
Page 50 of 73
Grade 8 Term 3 Mathematics Strategy Learners Worksheets
WORKSHEET: GRADE 8 TERM 3 WEEK 6 LESSON 5&6
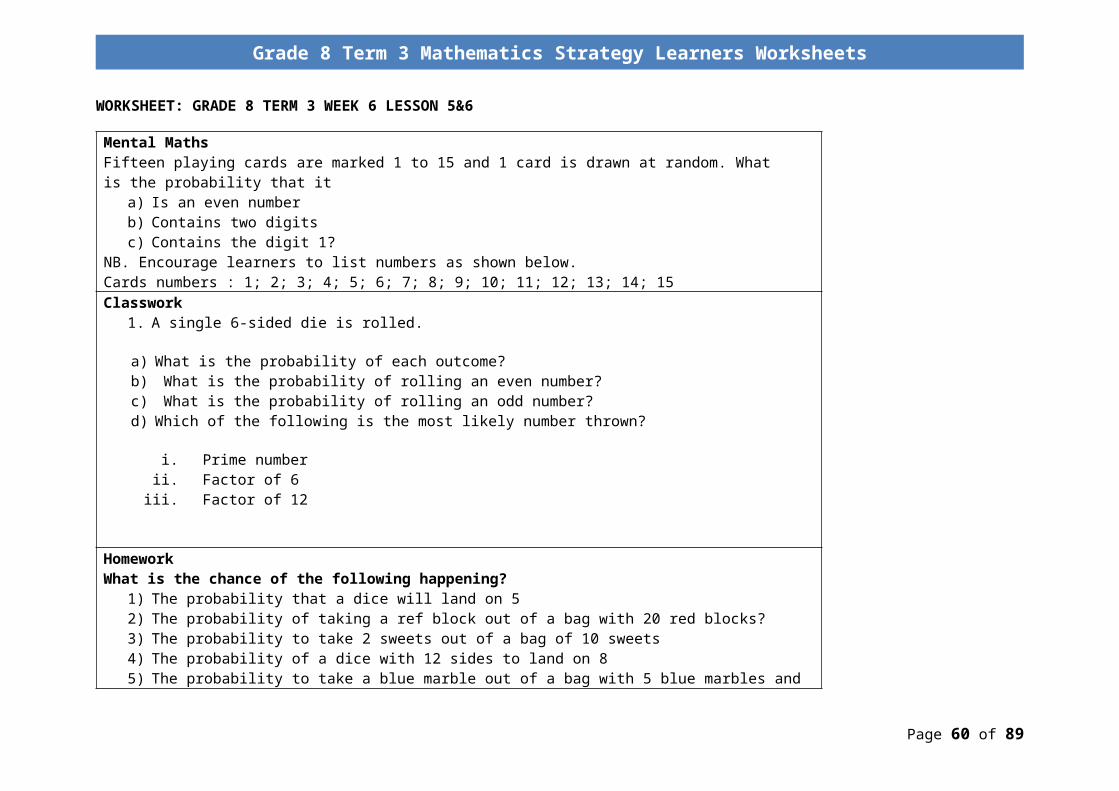
Mental MathsFifteen playing cards are marked 1 to 15 and 1 card is drawn at random. What is the probability that it
a) Is an even numberb) Contains two digitsc) Contains the digit 1?
NB. Encourage learners to list numbers as shown below.Cards numbers : 1; 2; 3; 4; 5; 6; 7; 8; 9; 10; 11; 12; 13; 14; 15 Classwork
1. A single 6-sided die is rolled.
a) What is the probability of each outcome?b) What is the probability of rolling an even number?c) What is the probability of rolling an odd number? d) Which of the following is the most likely number thrown?
i. Prime numberii. Factor of 6iii. Factor of 12
HomeworkWhat is the chance of the following happening?
1) The probability that a dice will land on 52) The probability of taking a ref block out of a bag with 20 red blocks?3) The probability to take 2 sweets out of a bag of 10 sweets4) The probability of a dice with 12 sides to land on 85) The probability to take a blue marble out of a bag with 5 blue marbles and 5 red marbles
Page 51 of 73
Grade 8 Term 3 Mathematics Strategy Learners Worksheets
WORKSHEET: GRADE 8 TERM 3 WEEK 6 LESSON 7&8
Mental Maths
1. a) How many total pieces of candy are in the box?b) What is the probability of selecting a cherry piece?c) What is the probability of selecting a lemon piece?d) What is the probability of selecting a grape piece?e) What is the probability of selecting an apple piece?
2. Say if the events below are likely, unlikely , impossible, have even chance of occurring or certain to occura. It will rain tomorrow. -b. I don't have to study much for my exams- c. When I flip a coin it will land on heads -
Classwork
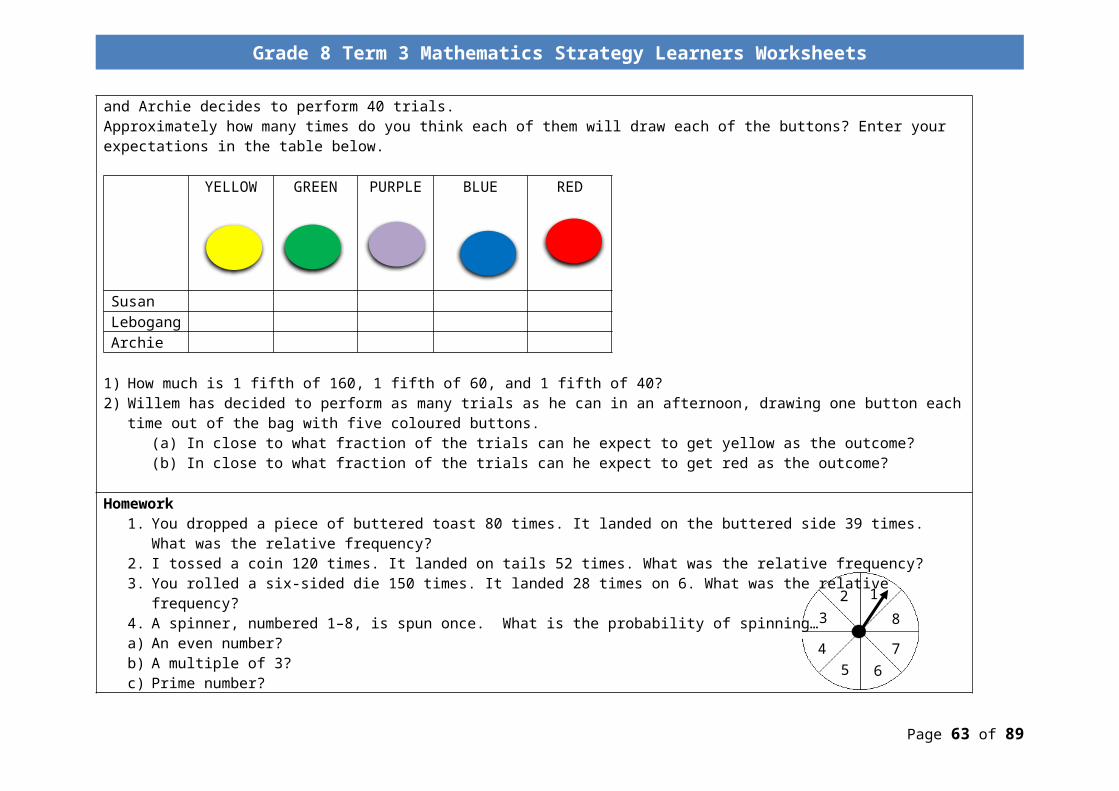
Susan decides to perform 160 trials on the bag with five buttons. In each trial she will draw one button from the bag, note its colour, and put it back. Lebogang decides she will perform 60 trials and Archie decides to perform 40 trials.Approximately how many times do you think each of them will draw each of the buttons? Enter your expectations in the table below.
Page 52 of 73
Grade 8 Term 3 Mathematics Strategy Learners Worksheets
123
765
4
8
YELLOW GREEN PURPLE BLUE RED
SusanLebogangArchie
1) How much is 1 fifth of 160, 1 fifth of 60, and 1 fifth of 40? 2) Willem has decided to perform as many trials as he can in an afternoon, drawing one button each time out of the
bag with five coloured buttons.(a) In close to what fraction of the trials can he expect to get yellow as the outcome?
(b) In close to what fraction of the trials can he expect to get red as the outcome?
Homework1. You dropped a piece of buttered toast 80 times. It landed on the buttered side 39 times. What was the
relative frequency? 2. I tossed a coin 120 times. It landed on tails 52 times. What was the relative frequency? 3. You rolled a six-sided die 150 times. It landed 28 times on 6. What was the relative frequency? 4. A spinner, numbered 1–8, is spun once. What is the probability of spinning…a) An even number? b) A multiple of 3? c) Prime number? d) 9?
Page 53 of 73
Grade 8 Term 3 Mathematics Strategy Learners Worksheets
WORKSHEET: TERM 3 GRADE 8 WEEK 7 LESSON 1
MENTAL MATHS CLASS WORK HOMEWORK1. What is a platonic Solid?2. Name the 5 platonic
solids you know.3. Draw a cube.
Fill in the name and the number of sides of the platonic diagrams below.
Name of
Platonic solid
Example
Tetrahedron
Four faces
Describe the tetrahedron and the hexahedron in terms of faces, vertex, and edges.
Page 54 of 73
Grade 8 Term 3 Mathematics Strategy Learners Worksheets

WORKSHEET TERM 3 GRADE 8 WEEK 7 LESSON 2
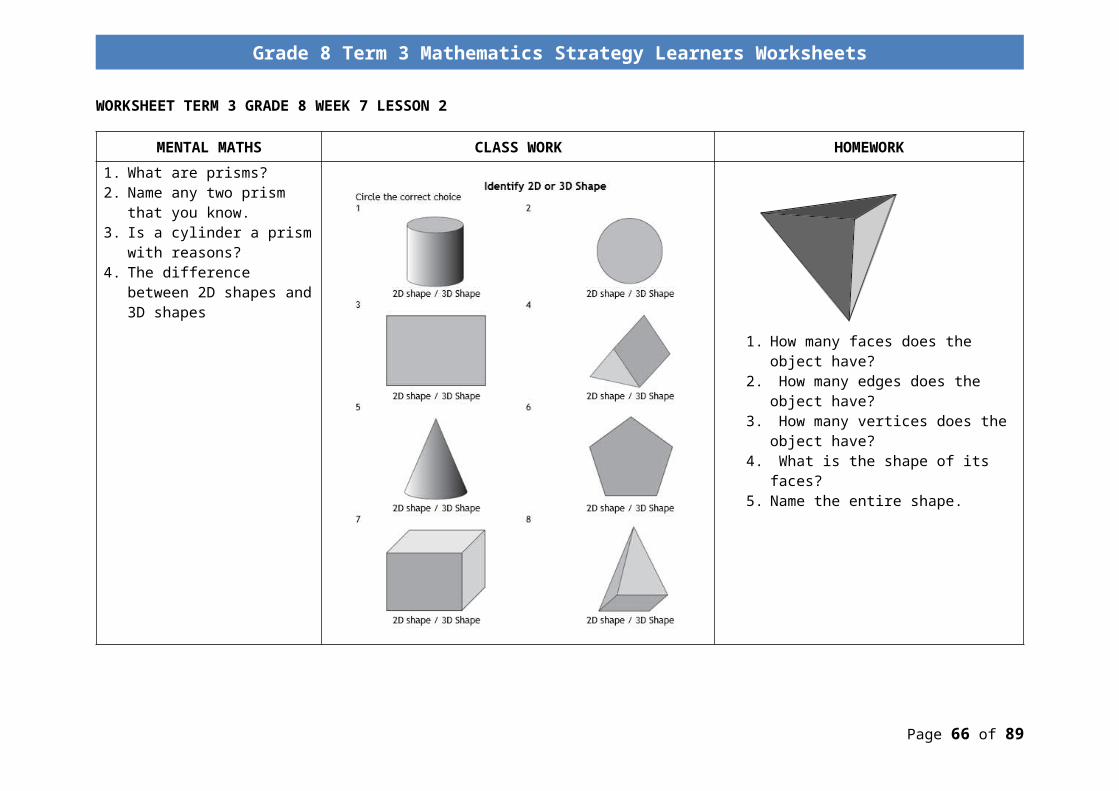
MENTAL MATHS CLASS WORK HOMEWORK1. What are prisms?2. Name any two prism that
you know.3. Is a cylinder a prism with
reasons?4. The difference between
2D shapes and 3D shapes
1. How many faces does the object have?
2. How many edges does the object have?
3. How many vertices does the object have?
4. What is the shape of its faces?5. Name the entire shape.
Page 55 of 73
Grade 8 Term 3 Mathematics Strategy Learners Worksheets
WORKSHEET: TERM 3 GRADE 8 WEEK 7 LESSON 3
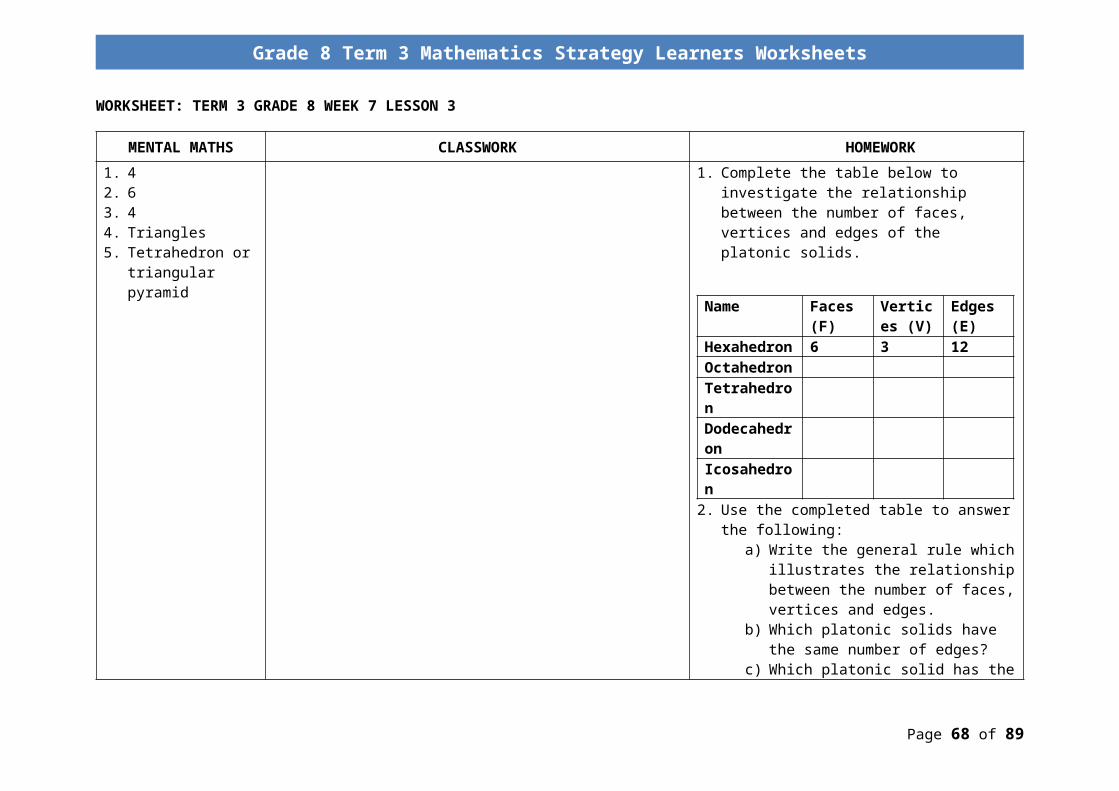
MENTAL MATHS CLASSWORK HOMEWORK1. 42. 63. 44. Triangles5. Tetrahedron or
triangular pyramid
1. Complete the table below to investigate the relationship between the number of faces, vertices and edges of the platonic solids.
Name Faces (F)
Vertices (V)
Edges (E)
Hexahedron
6 3 12
OctahedronTetrahedronDodecahedronIcosahedron
2. Use the completed table to answer the following:
a) Write the general rule which illustrates the relationship between the number of faces, vertices and edges.
b) Which platonic solids have the same number of edges?
c) Which platonic solid has the highest number of faces?
d) Which platonic solid has the highest number of vertices?
Page 56 of 73
Grade 8 Term 3 Mathematics Strategy Learners Worksheets
Page 57 of 73
Grade 8 Term 3 Mathematics Strategy Learners Worksheets
WORKSHEET TERM 3 GRADE 8 WEEK 7 LESSON 4
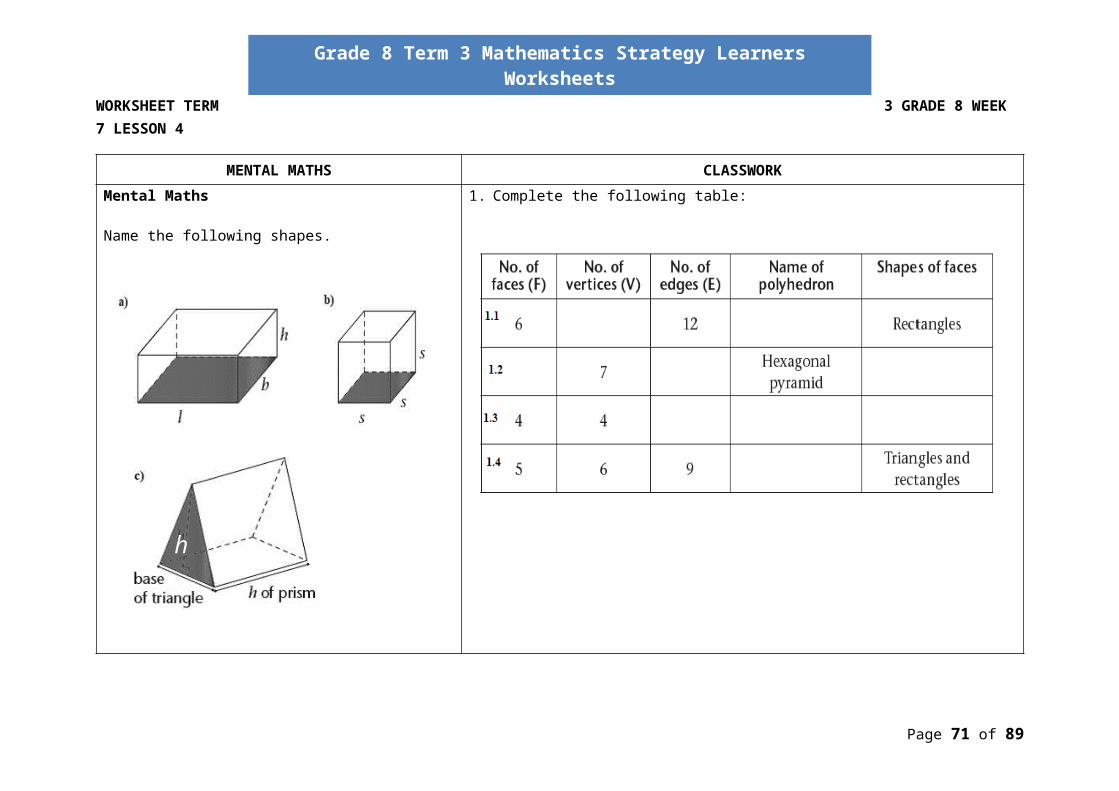
MENTAL MATHS CLASSWORKMental Maths
Name the following shapes.
1. Complete the following table:
Page 58 of 73
h
Grade 8 Term 3 Mathematics Strategy Learners Worksheets
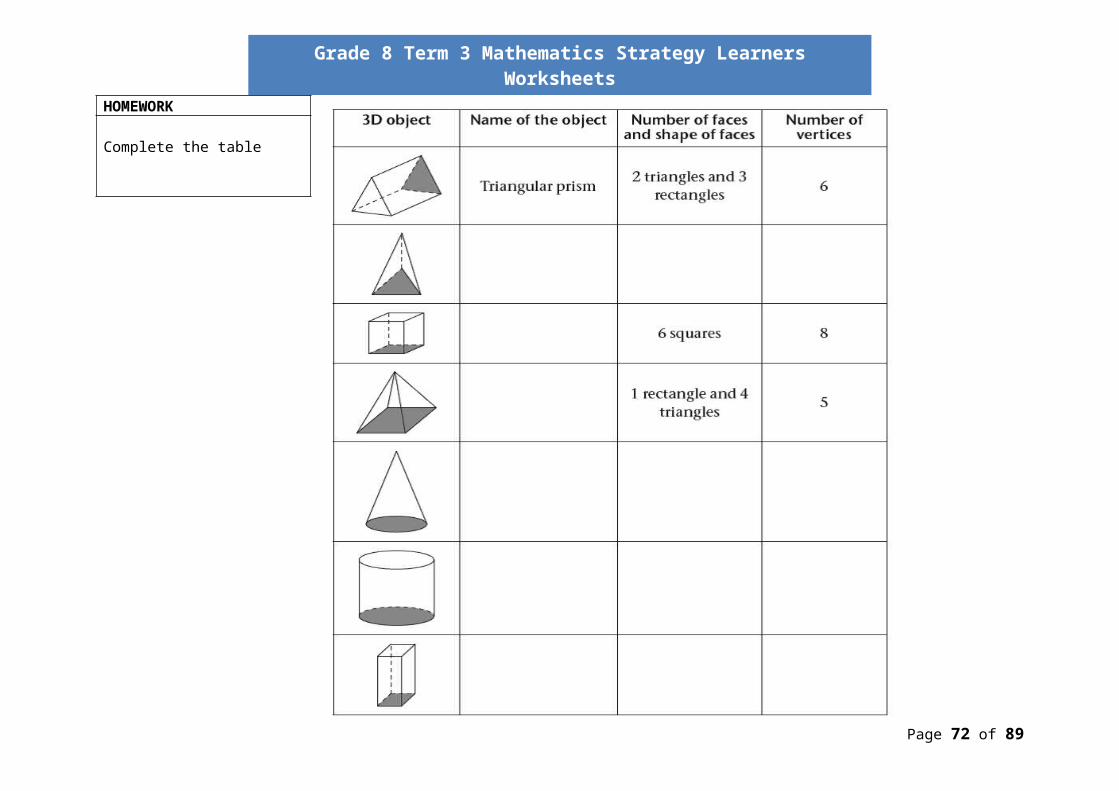
HOMEWORK
Complete the table
Page 59 of 73
Grade 8 Term 3 Mathematics Strategy Learners Worksheets
WORKSHEET: TERM 3 GRADE 8 WEEK 7 LESSON 5
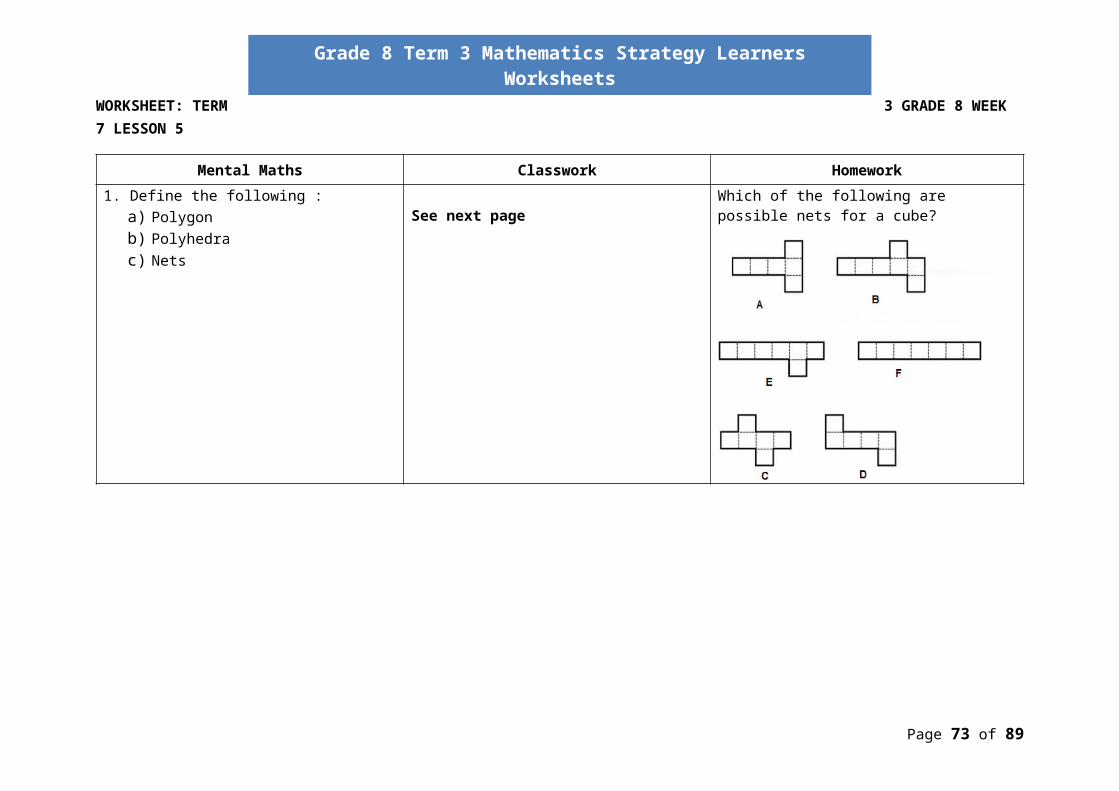
Mental Maths Classwork Homework1. Define the following :
a) Polygonb) Polyhedrac) Nets
See next pageWhich of the following are possible nets for a cube?
Page 60 of 73
Grade 8 Term 3 Mathematics Strategy Learners Worksheets
Classwork
Page 61 of 73
Grade 8 Term 3 Mathematics Strategy Learners Worksheets

WORKSHEET: TERM 3 GRADE 8 WEEK 7 LESSON 6
CLASS WORK HOMEWORK
1. Which of the following are nets for a cube? No homework
Page 62 of 73
Grade 8 Term 3 Mathematics Strategy Learners Worksheets
WORKSHEET: TERM 3 GRADE 8 WEEK 7 LESSON 7
MENTAL MATHS CLASS WORK HOMEWORK
1. Given the diagram below, answer the following questions:
a) How many faces does the object have?
b) How many edges does the object have?
c) How many vertices does the object have?
d) What is the shape of its faces?
e) Name the entire shape.
COMPLETE THE DIAGRAM
Page 63 of 73
Grade 8 Term 3 Mathematics Strategy Learners Worksheets
WORKSHEET: TERM 3 GRADE 8 WEEK 7 LESSON 8
MENTAL MATHS CLASS WORK HOMEWORK1. Do you think the diagram below can
be used as a net to make a platonic solid?
a) If possible, what’s the name of the plastic solid?
b) If possible, how many faces and vertices will the polyhedron have?
Revision in preparation for assessment.
Page 64 of 73
Grade 8 Term 3 Mathematics Strategy Learners Worksheets

WORKSHEET TERM 3 GRADE 8 WEEK 8 LESSON 1
Mental Maths Class work HomeworkDefine the following words:1. Surface Area2. Volume
1. Identify 2D- and 3D-Shapes from the shapes below.
Circle the correct choice1
2D shape/3D shape
2
2D shape/3D shape3
2D shape/3D shape
4
2D shape/3D shape5
2D shape/3D shape
6
2D shape/3D shape
1. Is the Surface area and Volume connected? If so, how?
2. Name the 5 shapes where Surface Area and Volume may be calculated.
Page 65 of 73
Grade 8 Term 3 Mathematics Strategy Learners Worksheets
7
2D shape/3D shape
8
2D shape/3D shape
Page 66 of 73
Grade 8 Term 3 Mathematics Strategy Learners Worksheets
WORKSHEET TERM 3 GRADE 8 WEEK 8 LESSON 2
Mental Maths Class work Homework1. Name the 3D-Shapes that are formed
from the nets below.
2. How many faces does a Triangular Prism have?
3. What is the difference between Volume and Capacity
1. Study the diagram below and answer the following questions.
a) If you fill the container with water, what Volume of water will the container hold?
b) Calculate the Capacity of the container.
c) Determine the thickness of the wall of the container.
d) What is the name of the Shape?
1. Determine the Surface Area
2. Calculate the Volume of the 3D- object above
Page 67 of 73
Grade 8 Term 3 Mathematics Strategy Learners Worksheets
WORKSHEET TERM 3 GRADE 8 WEEK 8 LESSON 3
Mental Maths Class work Homework1. Determine the following. 1. Name the following solid shapes and
determine their Volume.a.
b.
c.
1. Calculate the Volume and Surface Area of the Prism if AB=8cm, BC=6cm and CF= 16cm of the diagram below.
Page 68 of 73
Grade 8 Term 3 Mathematics Strategy Learners Worksheets
WORKSHEET TERM 3 GRADE 8 WEEK 8 LESSON 4
Mental Maths Class work Homework1. Calculate the Surface Area of
the object below without using a calculator.
1. Calculate the Surface Area and Volume of the following Rectangular Prisms by completing the table below.Lengt
h(m)
Breadth(m)
Height(m)
Surface Area
(m2)
Volume
(m3)12 2 18 3 16 4 14 3 22 2 6
Find the Surface Area of the following shapes.
1.
2.
Page 69 of 73
Grade 8 Term 3 Mathematics Strategy Learners Worksheets

WORKSHEET TERM 3 GRADE 8 WEEK 8 LESSON 5
Mental Maths Class work HomeworkA solid block of wood that measures 30cm × 20cm× 10cm is given below. Calculate the Surface Area.
1. Name the following solid shapes and determine the Surface Area of the following 3D-shapes.a.
b.
c.
Use the general rule: Volume of a Prism = Area of base ×height, to write the formula for Volume of a Cube, Rectangular Prism and a Triangular Prism.
Page 70 of 73
Grade 8 Term 3 Mathematics Strategy Learners Worksheets
WORKSHEET TERM 3 GRADE 8 WEEK 8 LESSON 6
Mental Maths Class work HomeworkWhat is the difference between Capacity and Volume?
Determine the Volume of the following objects. 1. Determine the Volume and Surface Area of the following object.
Page 71 of 73
Grade 8 Term 3 Mathematics Strategy Learners Worksheets
WORKSHEET TERM 3 GRADE 8 WEEK 8 LESSON 7
Mental Maths Class work HomeworkWhich of the Cubes given below has a bigger Volume? Explain your answer.
a) A cube with a volume of1m3b) A cube with a volume of 1000000cm3
1. Write the following Volumes inmm3
a) 1cm3b) 20cm3c) 4,7 cm3d) 100 cm3
2. Write the following Volumes in cm3
a) 1mm3b) 0,6m3c) 45mm3
1. Write the following Volumes incm3.(a) 3mm3 (b) 45mm3
2. Write the following Volumes inmm3.(a) 4, 7cm3 (b) 89, 5cm3
3. Write the following answers incm3.
(a) 4m3 + 68cm3 (b) 12m3 + 143cm3
WORKSHEET TERM 3 GRADE 8 WEEK 8 LESSON 8
Mental Maths Class work HomeworkHow many 1mm x1mm x 1mm Cubes are needed to form a 1cm x 1cm x 1cm Cube.
1.a) Determine the Surface Area
and Volume of the Cube with a length of 7cm.
b) Convert the answer to mm2∧mm3, respectively.
None. Practice on your own at home and prepare for the weekly assessment
Page 72 of 73
Grade 8 Term 3 Mathematics Strategy Learners Worksheets
Page 73 of 73
Grade 8 Term 3 Mathematics Strategy Learners Worksheets