Embed Size (px)
Citation preview
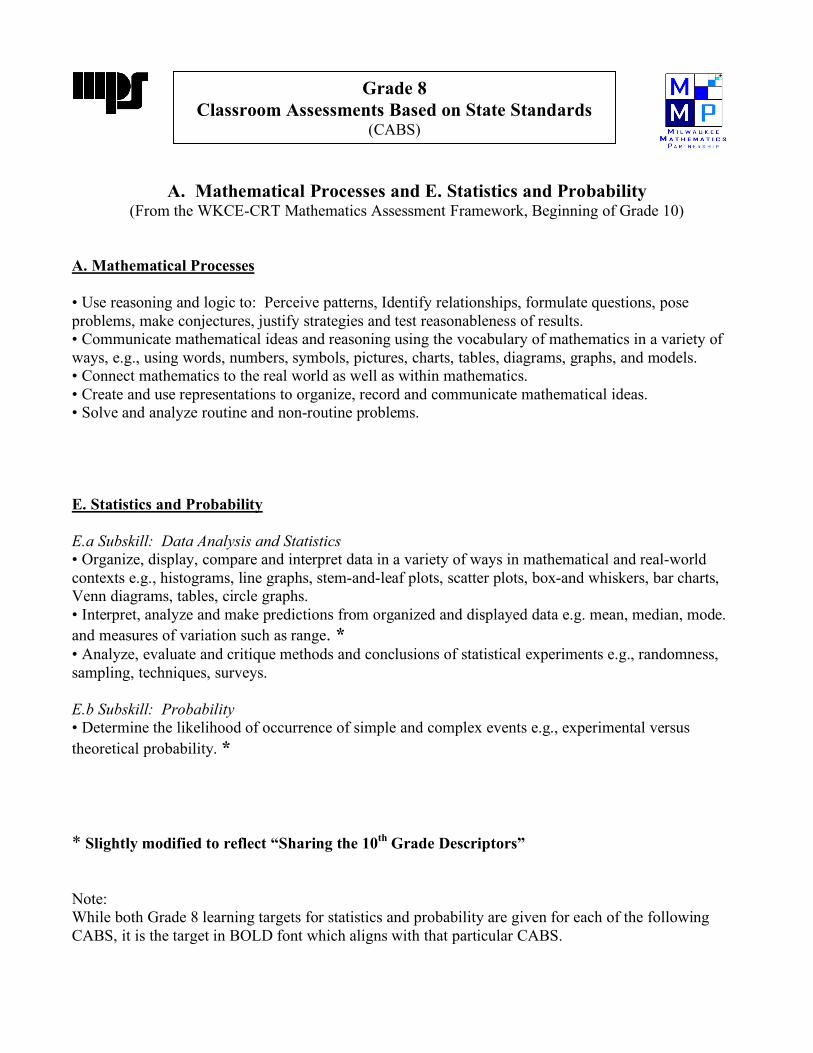
A. Mathematical Processes and E. Statistics and Probability (From the WKCE-CRT Mathematics Assessment Framework, Beginning of Grade 10)
A. Mathematical Processes • Use reasoning and logic to: Perceive patterns, Identify relationships, formulate questions, pose problems, make conjectures, justify strategies and test reasonableness of results. • Communicate mathematical ideas and reasoning using the vocabulary of mathematics in a variety of ways, e.g., using words, numbers, symbols, pictures, charts, tables, diagrams, graphs, and models. • Connect mathematics to the real world as well as within mathematics. • Create and use representations to organize, record and communicate mathematical ideas. • Solve and analyze routine and non-routine problems. E. Statistics and Probability E.a Subskill: Data Analysis and Statistics • Organize, display, compare and interpret data in a variety of ways in mathematical and real-world contexts e.g., histograms, line graphs, stem-and-leaf plots, scatter plots, box-and whiskers, bar charts, Venn diagrams, tables, circle graphs. • Interpret, analyze and make predictions from organized and displayed data e.g. mean, median, mode. and measures of variation such as range. * • Analyze, evaluate and critique methods and conclusions of statistical experiments e.g., randomness, sampling, techniques, surveys. E.b Subskill: Probability • Determine the likelihood of occurrence of simple and complex events e.g., experimental versus theoretical probability. * * Slightly modified to reflect “Sharing the 10th Grade Descriptors” Note: While both Grade 8 learning targets for statistics and probability are given for each of the following CABS, it is the target in BOLD font which aligns with that particular CABS.
Grade 8 Classroom Assessments Based on State Standards
(CABS)

Examining the 10th Gr. Descriptors: What’s “New” for 8th Graders? The 8th Grade Classroom Assessments Based on State Standards were created to reflect the 10th grade state descriptors and the MPS learning targets for 8th grade. The 10th grade state descriptors should be used by both 8th and 9th grade math teachers. See your MTL for the document, “Sharing the 10th Grade Descriptors”, or visit the Portal (math page, inside the teacher community), for the delineated shared responsibilities. The 10th grade state descriptors contain both previously introduced and new concepts. It is the intent of the 8th - 9th Grades Math Assessment Pilot, after considerable feedback from Kevin McLeod, UWM Mathematics Professor and Co-Investigator, MMP, to emphasize the new concepts. Alerting teachers to what is new for 8th graders should have classroom implications. The 8th grade math CABS are therefore split into two categories. First, a series of “Power CABS” which can be used to assess student understanding of concepts not found in earlier grade level state descriptors. Second, a series of CABS not denoted with “Power” which can be used to assess student understanding of concepts found in both earlier state descriptors and in the 10th grade descriptors. The chart below identifies the descriptors that are new to 8th grade as determined by the 8th - 9th Grades Math Assessment Pilot, 2006-2007. E. Statistics and Probability Objective/Subskill 10th Gr. Descriptor Piece that
is “New” Notes
E.a “Organize, display, compare and interpret data in a variety of ways in mathematical and real-world contexts e.g. histograms, scatterplots, and box and whiskers plot”
While earlier grades are asked to organize, display and interpret data, it has not been with histograms, scatterplots, and box plots.
E.a “Interpret, analyze, and make predictions from organized and displayed data e.g. mean, median, mode and measures of variation such as range”
E.a “Analyze, evaluate, and critique methods and conclusions of statistical experiments, e.g. randomness, sampling techniques, surveys”
E. b “Determine the likelihood of occurrence of complex events”

Name __________________________________________________________ Date _______________________
Mathematics Grade 8 Classroom Assessment Based on Standards
CABS Identifier: “Reading Survey”
MPS Learning Target: Statistics and Probability MPS Learning Target #4: Design and conduct investigations, display data using appropriate representations, analyze and summarize data using measures of central tendency and variation, and evaluate methods and conclusions MPS Learning Target #5: Design and analyze experiments with simple and complex events, predict likelihood of outcomes, and justify strategies based on theoretical and experimental probabilities.
Wisconsin Assessment Framework for Mathematics Objective: E. Statistics and Probability Subskill: Data Analysis and Statistics Descriptors: • Organize, display, compare and interpret data in a variety of ways in mathematical and real-world contexts e.g. histograms, line graphs, stem-and-leaf plots, scatter plots, box plots, bar graphs, Venn diagrams, tables, circle graphs. • Interpret, analyze and make predictions from organized and displayed data e.g. mean, median, mode, and measures of variation such as range. Objective: A. Mathematical Processes Descriptors: • Use reasoning and logic to perceive patterns, identify relationships, formulate questions, pose problems, make conjectures, justify strategies, and test reasonableness of results • Communicate mathematical ideas and reasoning using the vocabulary of mathematics in a variety of ways (e.g. using words, numbers, symbols, pictures, charts, tables, diagrams, graphs, and models). • Connect mathematics to the real world as well as within mathematics. • Create and use representations to organize, record, and communicate mathematical ideas. • Solve and analyze routine and non-routine problems. A survey was done to find out how many books students had read during the first semester. These are the responses from twenty students.
5, 11, 8, 1, 5, 3, 4, 1, 7, 9, 3, 5, 6, 2, 1, 10, 5, 6, 5, 12
Create a line plot to display the data.
Page 1 of 2

A. Identify the mean, median, mode, and range for this data. Mean: ________ Median: ________ Mode: ________ Range: ________
Developed by the Milwaukee Mathematics Partnership (MMP) with support by the National Science Foundation under Grant No. 0314898.
Page 2 of 2
B. What observations can you make about the distribution of this data?
C. Formulate a question that this data raises for you.
Name __________________________________________________________ Date _______________________
Mathematics Grade 8 Classroom Assessment Based on Standards
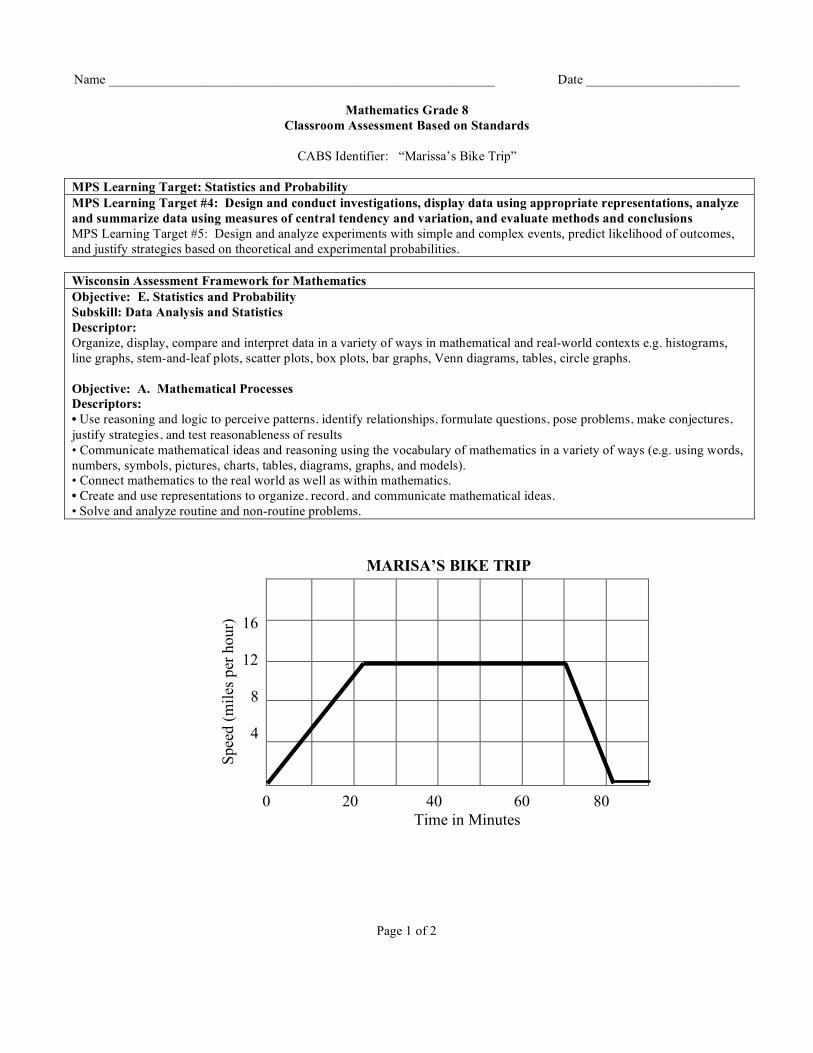
CABS Identifier: “Marissa’s Bike Trip”
MPS Learning Target: Statistics and Probability MPS Learning Target #4: Design and conduct investigations, display data using appropriate representations, analyze and summarize data using measures of central tendency and variation, and evaluate methods and conclusions MPS Learning Target #5: Design and analyze experiments with simple and complex events, predict likelihood of outcomes, and justify strategies based on theoretical and experimental probabilities.
Wisconsin Assessment Framework for Mathematics Objective: E. Statistics and Probability Subskill: Data Analysis and Statistics Descriptor: Organize, display, compare and interpret data in a variety of ways in mathematical and real-world contexts e.g. histograms, line graphs, stem-and-leaf plots, scatter plots, box plots, bar graphs, Venn diagrams, tables, circle graphs. Objective: A. Mathematical Processes Descriptors: • Use reasoning and logic to perceive patterns, identify relationships, formulate questions, pose problems, make conjectures, justify strategies, and test reasonableness of results • Communicate mathematical ideas and reasoning using the vocabulary of mathematics in a variety of ways (e.g. using words, numbers, symbols, pictures, charts, tables, diagrams, graphs, and models). • Connect mathematics to the real world as well as within mathematics. • Create and use representations to organize, record, and communicate mathematical ideas. • Solve and analyze routine and non-routine problems.
MARISA’S BIKE TRIP
Page 1 of 2
Spee
d (m
iles p
er h
our)
0 20 40 60 80 Time in Minutes
16 12 8 4
Developed by the Milwaukee Mathematics Partnership (MMP) with support by the National Science Foundation under Grant No. 0314898.
Page 2 of 2
Using the information in the graph, describe what could have happened during each of the four segments of the trip, including her speed throughout the trip.

Name __________________________________________________________ Date _______________________
Mathematics Grade 8 Classroom Assessment Based on Standards
Power CABS Identifier: “New Show Survey”
MPS Learning Target: Statistics and Probability MPS Learning Target #4: Design and conduct investigations, display data using appropriate representations, analyze and summarize data using measures of central tendency and variation, and evaluate methods and conclusions MPS Learning Target #5: Design and analyze experiments with simple and complex events, predict likelihood of outcomes, and justify strategies based on theoretical and experimental probabilities.
Wisconsin Assessment Framework for Mathematics Objective: E. Statistics and Probability Subskill: Data Analysis and Statistics Descriptors: • Organize, display, compare and interpret data in a variety of ways in mathematical and real-world contexts e.g. histograms, line graphs, stem-and-leaf plots, scatter plots, box plots, bar graphs, Venn diagrams, tables, circle graphs. • Interpret, analyze and make predictions from organized and displayed data e.g. mean, median, mode, and measures of variation such as range. Objective: A. Mathematical Processes Descriptors: • Use reasoning and logic to perceive patterns, identify relationships, formulate questions, pose problems, make conjectures, justify strategies, and test reasonableness of results • Communicate mathematical ideas and reasoning using the vocabulary of mathematics in a variety of ways (e.g. using words, numbers, symbols, pictures, charts, tables, diagrams, graphs, and models). • Connect mathematics to the real world as well as within mathematics. • Create and use representations to organize, record, and communicate mathematical ideas. • Solve and analyze routine and non-routine problems.
These are the results of a class survey on whether students liked a new television show:
25 students liked the new show. 15 students disliked the new show. 10 students had no opinion on the new show. A. Create a graph to display the data.
Page 1 of 2

Developed by the Milwaukee Mathematics Partnership (MMP) with support by the National Science Foundation under Grant No. 0314898.
Page 2 of 2
B. What do you think the future of this show will be? Use the data to support your answer.
Name __________________________________________________________ Date _______________________
Mathematics Grade 8 Classroom Assessment Based on Standards
CABS Identifier: “Cuddly Critters”
MPS Learning Target: Statistics and Probability MPS Learning Target #4: Design and conduct investigations, display data using appropriate representations, analyze and summarize data using measures of central tendency and variation, and evaluate methods and conclusions MPS Learning Target #5: Design and analyze experiments with simple and complex events, predict likelihood of outcomes, and justify strategies based on theoretical and experimental probabilities.
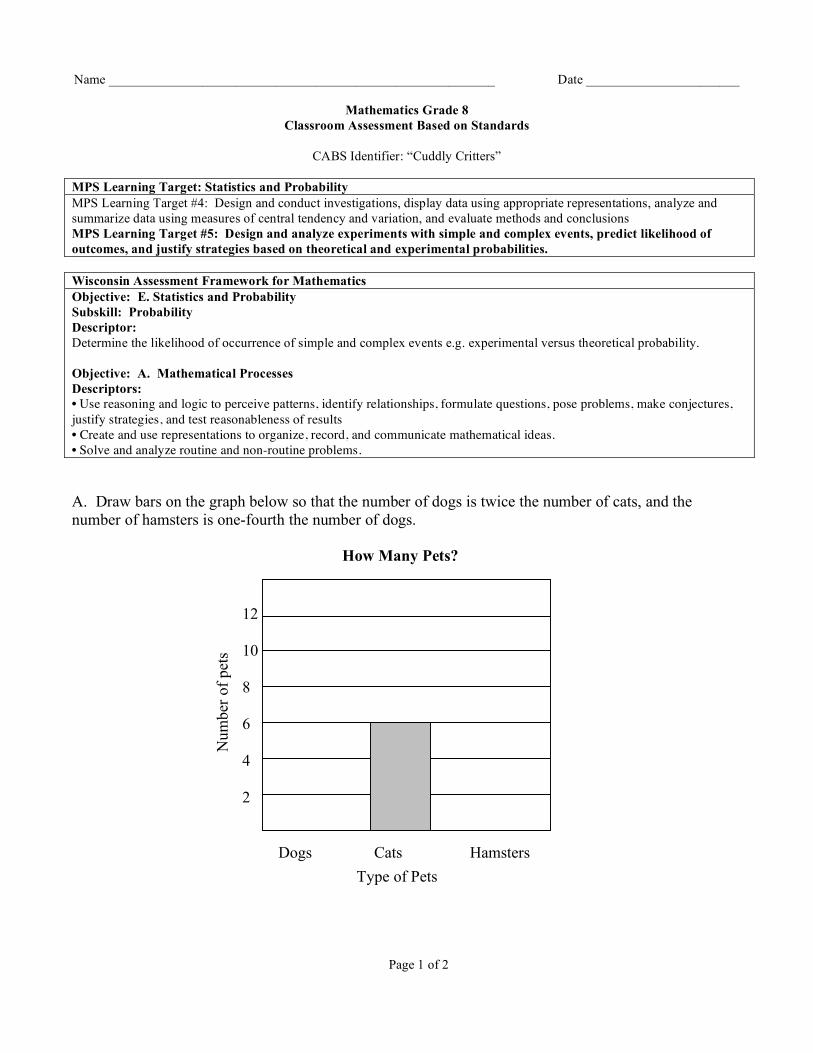
Wisconsin Assessment Framework for Mathematics Objective: E. Statistics and Probability Subskill: Probability Descriptor: Determine the likelihood of occurrence of simple and complex events e.g. experimental versus theoretical probability. Objective: A. Mathematical Processes Descriptors: • Use reasoning and logic to perceive patterns, identify relationships, formulate questions, pose problems, make conjectures, justify strategies, and test reasonableness of results • Create and use representations to organize, record, and communicate mathematical ideas. • Solve and analyze routine and non-routine problems. A. Draw bars on the graph below so that the number of dogs is twice the number of cats, and the number of hamsters is one-fourth the number of dogs.
Page 1 of 2
Num
ber o
f pet
s
How Many Pets? 12 10 8 6 4 2
Dogs Cats Hamsters Type of Pets

B. The data from the graph in Part A came from the animals that were for sale at the Cuddly Critter Pet Shop. Last night, Jerell got a pet from this shop. Use the data from Part A to find the probability that the pet he took home was a certain type. P (Hamster) = P (Cat) = P (Dog) =
Developed by the Milwaukee Mathematics Partnership (MMP) with support by the National Science Foundation under Grant No. 0314898.
Page 2 of 2
Name __________________________________________________________ Date _______________________
Mathematics Grade 8 Classroom Assessment Based on Standards
CABS Identifier: “Pat’s Pie Chart”
MPS Learning Target: Statistics and Probability MPS Learning Target #4: Design and conduct investigations, display data using appropriate representations, analyze and summarize data using measures of central tendency and variation, and evaluate methods and conclusions MPS Learning Target #5: Design and analyze experiments with simple and complex events, predict likelihood of outcomes, and justify strategies based on theoretical and experimental probabilities.
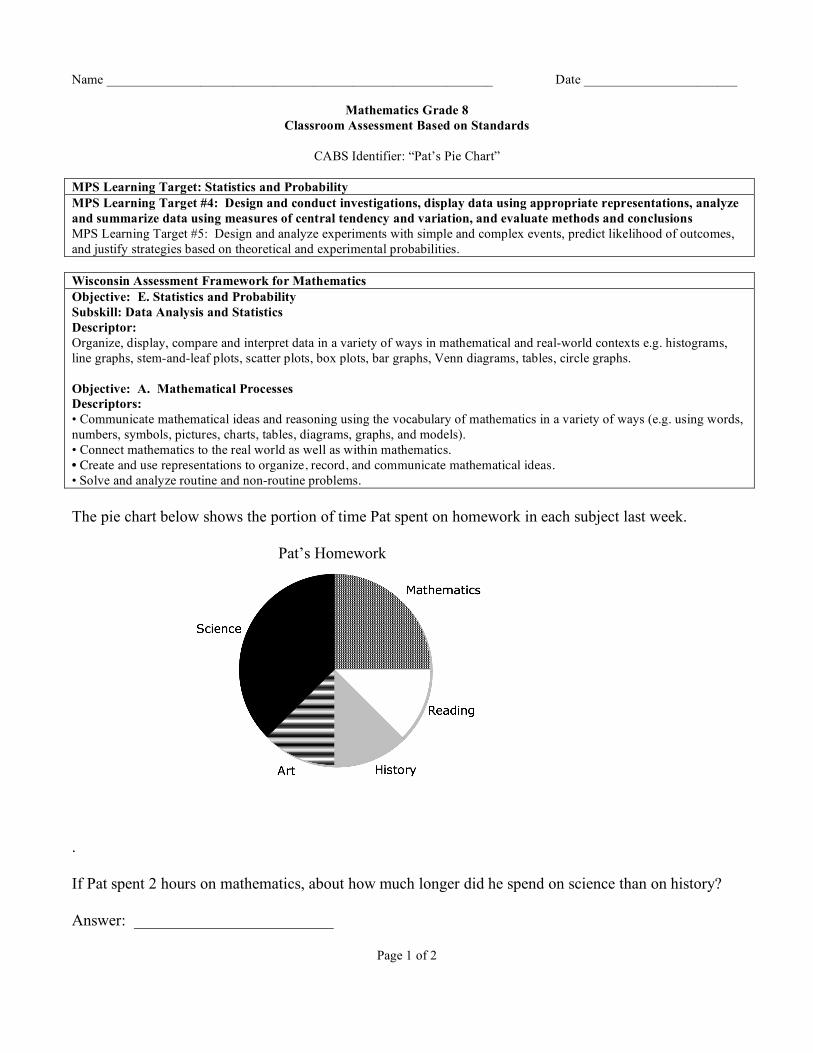
Wisconsin Assessment Framework for Mathematics Objective: E. Statistics and Probability Subskill: Data Analysis and Statistics Descriptor: Organize, display, compare and interpret data in a variety of ways in mathematical and real-world contexts e.g. histograms, line graphs, stem-and-leaf plots, scatter plots, box plots, bar graphs, Venn diagrams, tables, circle graphs. Objective: A. Mathematical Processes Descriptors: • Communicate mathematical ideas and reasoning using the vocabulary of mathematics in a variety of ways (e.g. using words, numbers, symbols, pictures, charts, tables, diagrams, graphs, and models). • Connect mathematics to the real world as well as within mathematics. • Create and use representations to organize, record, and communicate mathematical ideas. • Solve and analyze routine and non-routine problems. The pie chart below shows the portion of time Pat spent on homework in each subject last week. . If Pat spent 2 hours on mathematics, about how much longer did he spend on science than on history? Answer: _________________________
Page 1 of 2
Pat’s Homework
Developed by the Milwaukee Mathematics Partnership (MMP) with support by the National Science Foundation under Grant No. 0314898.
Page 2 of 2
Show all your work, and explain your thinking using words, numbers, symbols, and/or pictures.
Name __________________________________________________________ Date _______________________
Mathematics Grade 8 Classroom Assessment Based on Standards
Power CABS Identifier: “Venn Diagram”
MPS Learning Target: Statistics and Probability MPS Learning Target #4: Design and conduct investigations, display data using appropriate representations, analyze and summarize data using measures of central tendency and variation, and evaluate methods and conclusions MPS Learning Target #5: Design and analyze experiments with simple and complex events, predict likelihood of outcomes, and justify strategies based on theoretical and experimental probabilities.
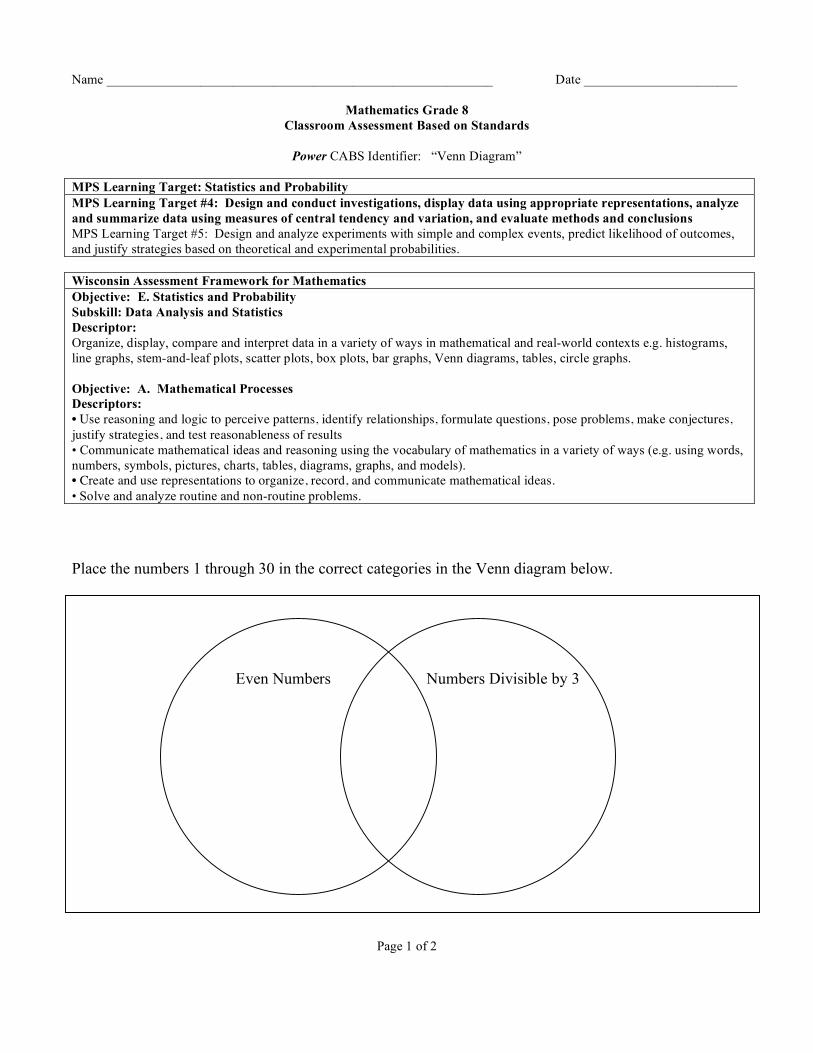
Wisconsin Assessment Framework for Mathematics Objective: E. Statistics and Probability Subskill: Data Analysis and Statistics Descriptor: Organize, display, compare and interpret data in a variety of ways in mathematical and real-world contexts e.g. histograms, line graphs, stem-and-leaf plots, scatter plots, box plots, bar graphs, Venn diagrams, tables, circle graphs. Objective: A. Mathematical Processes Descriptors: • Use reasoning and logic to perceive patterns, identify relationships, formulate questions, pose problems, make conjectures, justify strategies, and test reasonableness of results • Communicate mathematical ideas and reasoning using the vocabulary of mathematics in a variety of ways (e.g. using words, numbers, symbols, pictures, charts, tables, diagrams, graphs, and models). • Create and use representations to organize, record, and communicate mathematical ideas. • Solve and analyze routine and non-routine problems. Place the numbers 1 through 30 in the correct categories in the Venn diagram below. Even Numbers Numbers Divisible by 3
Page 1 of 2

Developed by the Milwaukee Mathematics Partnership (MMP) with support by the National Science Foundation under Grant No. 031489\
Page 2 of 2
Make two observations about your results.
Name __________________________________________________________ Date _______________________ Mathematics Grade 8
Classroom Assessment Based on Standards
CABS Identifier: “School Supplies”
MPS Learning Target: Statistics and Probability MPS Learning Target #4: Design and conduct investigations, display data using appropriate representations, analyze and summarize data using measures of central tendency and variation, and evaluate methods and conclusions MPS Learning Target #5: Design and analyze experiments with simple and complex events, predict likelihood of outcomes, and justify strategies based on theoretical and experimental probabilities.
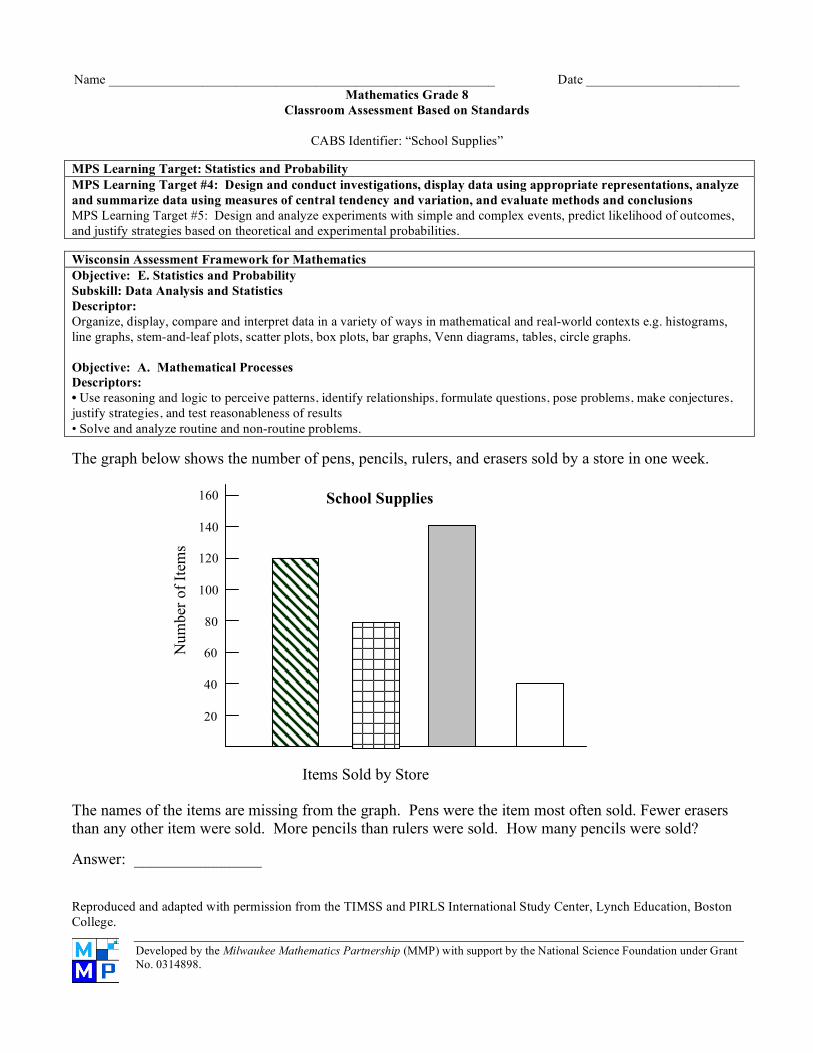
Wisconsin Assessment Framework for Mathematics Objective: E. Statistics and Probability Subskill: Data Analysis and Statistics Descriptor: Organize, display, compare and interpret data in a variety of ways in mathematical and real-world contexts e.g. histograms, line graphs, stem-and-leaf plots, scatter plots, box plots, bar graphs, Venn diagrams, tables, circle graphs. Objective: A. Mathematical Processes Descriptors: • Use reasoning and logic to perceive patterns, identify relationships, formulate questions, pose problems, make conjectures, justify strategies, and test reasonableness of results • Solve and analyze routine and non-routine problems. The graph below shows the number of pens, pencils, rulers, and erasers sold by a store in one week.
The names of the items are missing from the graph. Pens were the item most often sold. Fewer erasers than any other item were sold. More pencils than rulers were sold. How many pencils were sold? Answer: ________________ Reproduced and adapted with permission from the TIMSS and PIRLS International Study Center, Lynch Education, Boston College.
Developed by the Milwaukee Mathematics Partnership (MMP) with support by the National Science Foundation under Grant No. 0314898.
Items Sold by Store
Num
ber o
f Ite
ms
School Supplies 160
40
60
80
100
120
140
20

Name __________________________________________________________ Date _______________________
Mathematics Grade 8 Classroom Assessment Based on Standards
Power CABS Identifier: “Mary’s Mean”
MPS Learning Target: Statistics and Probability MPS Learning Target #4: Design and conduct investigations, display data using appropriate representations, analyze and summarize data using measures of central tendency and variation, and evaluate methods and conclusions MPS Learning Target #5: Design and analyze experiments with simple and complex events, predict likelihood of outcomes, and justify strategies based on theoretical and experimental probabilities.
Wisconsin Assessment Framework for Mathematics Objective: E. Statistics and Probability Subskill: Data Analysis and Statistics Descriptor: Interpret, analyze and make predictions from organized and displayed data e.g. mean, median, mode, and measures of variation such as range. Objective: A. Mathematical Processes Descriptors: • Use reasoning and logic to perceive patterns, identify relationships, formulate questions, pose problems, make conjectures, justify strategies, and test reasonableness of results • Communicate mathematical ideas and reasoning using the vocabulary of mathematics in a variety of ways (e.g. using words, numbers, symbols, pictures, charts, tables, diagrams, graphs, and models). • Connect mathematics to the real world as well as within mathematics. • Solve and analyze routine and non-routine problems. Joe had three test scores of 78, 76, and 74, while Mary had scores of 73, 83, and 75. What is the minimum score Joe would have needed on his third test to have a higher mean than Mary’s mean? ________________
Developed by the Milwaukee Mathematics Partnership (MMP) with support by the National Science Foundation under Grant No. 0314898.
How do you know?

Name __________________________________________________________ Date _______________________
Mathematics Grade 8 Classroom Assessment Based on Standards
Power CABS Identifier: “Representative?”
MPS Learning Target: Statistics and Probability MPS Learning Target #4: Design and conduct investigations, display data using appropriate representations, analyze and summarize data using measures of central tendency and variation, and evaluate methods and conclusions MPS Learning Target #5: Design and analyze experiments with simple and complex events, predict likelihood of outcomes, and justify strategies based on theoretical and experimental probabilities.
Wisconsin Assessment Framework for Mathematics Objective: E. Statistics and Probability Subskill: Data Analysis and Statistics Descriptor: Analyze, evaluate and critique methods and conclusions of statistical experiments e.g. randomness, sampling, techniques, surveys. Objective: A. Mathematical Processes Descriptors: • Communicate mathematical ideas and reasoning using the vocabulary of mathematics in a variety of ways (e.g. using words, numbers, symbols, pictures, charts, tables, diagrams, graphs, and models). • Connect mathematics to the real world as well as within mathematics. • Solve and analyze routine and non-routine problems. A poll is being taken at John Audubon Middle School to determine whether to change the school mascot. Which of the following would be the best place to find a sample of students to interview?
A. A school bus B. The cafeteria C. A foreign language class D. The faculty room E. Name another place: ____________________________________
Developed by the Milwaukee Mathematics Partnership (MMP) with support by the National Science Foundation under Grant No. 0314898.
Explain why your choice?

Name __________________________________________________________ Date _______________________
Mathematics Grade 8 Classroom Assessment Based on Standards
Power CABS Identifier: “Chip Pairs”
MPS Learning Target: Statistics and Probability MPS Learning Target #4: Design and conduct investigations, display data using appropriate representations, analyze and summarize data using measures of central tendency and variation, and evaluate methods and conclusions MPS Learning Target #5: Design and analyze experiments with simple and complex events, predict likelihood of outcomes, and justify strategies based on theoretical and experimental probabilities.
Wisconsin Assessment Framework for Mathematics Objective: E. Statistics and Probability Subskill: Probability Descriptor: Determine the likelihood of occurrence of simple and complex events e.g. experimental versus theoretical probability. Objective: A. Mathematical Processes Descriptors: • Communicate mathematical ideas and reasoning using the vocabulary of mathematics in a variety of ways (e.g. using words, numbers, symbols, pictures, charts, tables, diagrams, graphs, and models). • Create and use representations to organize, record, and communicate mathematical ideas. • Solve and analyze routine and non-routine problems. A box contains 3 chips numbered 1 through 3. One chip will be taken at random from the box and then put back into the box. Then a second chip will be taken from the box. In the space provided below, list all possible pairs of chips. Number on First Chip Number on Second Chip
Page 1 of 2
Adapted from the U.S. Department of Education, Institute of Education Sciences, National Center for Education Statistics, National Assessment of Educational Progress (NAEP)
Developed by the Milwaukee Mathematics Partnership (MMP) with support by the National Science Foundation under Grant No. 0314898
Page 2 of 2
How likely is it that the two chips will have the same number? Give your reasoning.

Name __________________________________________________________ Date _______________________
Mathematics Grade 8 Classroom Assessment Based on Standards
Power CABS Identifier: “Box Plot”
MPS Learning Target: Statistics and Probability MPS Learning Target #4: Design and conduct investigations, display data using appropriate representations, analyze and summarize data using measures of central tendency and variation, and evaluate methods and conclusions MPS Learning Target #5: Design and analyze experiments with simple and complex events, predict likelihood of outcomes, and justify strategies based on theoretical and experimental probabilities.
Wisconsin Assessment Framework for Mathematics Objective: E. Statistics and Probability Subskill: Data Analysis and Statistics Descriptors: • Organize, display, compare and interpret data in a variety of ways in mathematical and real-world contexts e.g. histograms, line graphs, stem-and-leaf plots, scatter plots, box plots, bar graphs, Venn diagrams, tables, circle graphs. • Interpret, analyze and make predictions from organized and displayed data e.g. mean, median, mode, and measures of variation such as range. Objective: A. Mathematical Processes Descriptors: • Communicate mathematical ideas and reasoning using the vocabulary of mathematics in a variety of ways (e.g. using words, numbers, symbols, pictures, charts, tables, diagrams, graphs, and models). • Connect mathematics to the real world as well as within mathematics. • Create and use representations to organize, record, and communicate mathematical ideas. • Solve and analyze routine and non-routine problems. Samples of seventh and eighth grade students were asked how much time they spent doing homework last Wednesday night. The results are show below. Time (in minutes) Spent on Wednesday Night Homework 8th Graders 7th Graders 0 10 20 30 40 50 60 70 80 90 100 110 Minutes
Page 1 of 2

Fill in the following data for the 7th graders based on the box plot on page 1: Use the following data to construct a box plot for the 8th graders on page 1:
Developed by the Milwaukee Mathematics Partnership (MMP) with support by the National Science Foundation under Grant No. 0314898.
Page 2 of 2
Range Median Lower quartile Upper quartile
Range 0 to 110 Median 40 Lower quartile 20 Upper quartile 70
Describe some similarities and differences between the distribution of study times for the 7th and 8th graders.

Name __________________________________________________________ Date _______________________
Mathematics Grade 8 Classroom Assessment Based on Standards
Power CABS Identifier: “Probability Candy”
MPS Learning Target: Statistics and Probability MPS Learning Target #4: Design and conduct investigations, display data using appropriate representations, analyze and summarize data using measures of central tendency and variation, and evaluate methods and conclusions. MPS Learning Target #5: Design and analyze experiments with simple and complex events, predict likelihood of outcomes, and justify strategies based on theoretical and experimental probabilities.
Wisconsin Assessment Framework for Mathematics Objective: E. Statistics and Probability Subskill: Probability Descriptor: Determine the likelihood of occurrence of simple and complex events e.g. experimental versus theoretical probability. Objective: A. Mathematical Processes Descriptors: • Communicate mathematical ideas and reasoning using the vocabulary of mathematics in a variety of ways (e.g. using words, numbers, symbols, pictures, charts, tables, diagrams, graphs, and models). • Connect mathematics to the real world as well as within mathematics. • Solve and analyze routine and non-routine problems. A package of candies contained 10 red candies, 10 blue candies, and 10 green candies. Bill shook up the package, opened it, took out one candy at a time and ate it. The first two candies he took out and ate were blue. Bill thinks the probability of getting a blue candy on his third try is
30
10 or3
1 .
Is Bill correct or incorrect? _________________________
U.S. Department of Education, Institute of Education Sciences, National Center for Education Statistics, National Assessment of Educational Progress (NAEP)
Developed by the Milwaukee Mathematics Partnership (MMP) with support by the National Science Foundation under Grant No. 0314898
Explain your answer using words, numbers, and/or pictures.

Name __________________________________________________________ Date _______________________
Mathematics Grade 8 Classroom Assessment Based on Standards
Power CABS Identifier: “Math Girls”
MPS Learning Target: Statistics and Probability MPS Learning Target #4: Design and conduct investigations, display data using appropriate representations, analyze and summarize data using measures of central tendency and variation, and evaluate methods and conclusions. MPS Learning Target #5: Design and analyze experiments with simple and complex events, predict likelihood of outcomes, and justify strategies based on theoretical and experimental probabilities.
Wisconsin Assessment Framework for Mathematics Objective: E. Statistics and Probability Subskill: Probability Descriptor: Determine the likelihood of occurrence of simple and complex events e.g. experimental versus theoretical probability. Objective: A. Mathematical Processes Descriptors: • Communicate mathematical ideas and reasoning using the vocabulary of mathematics in a variety of ways (e.g. using words, numbers, symbols, pictures, charts, tables, diagrams, graphs, and models). • Solve and analyze routine and non-routine problems. In a math class of 30 students, the probability that a student chosen at random will be a girl is
5
2 . How
many girls are in the class? Answer: __________ Reproduced and adapted with permission from the TIMSS and PIRLS International Study Center, Lynch Education, Boston College.
Developed by the Milwaukee Mathematics Partnership (MMP) with support by the National Science Foundation under Grant No. 0314898.
Show all your work.

Name __________________________________________________________ Date _______________________
Mathematics Grade 8 Classroom Assessment Based on Standards
Power CABS Identifier: “Scatter Plot”
MPS Learning Target: Statistics and Probability MPS Learning Target #4: Design and conduct investigations, display data using appropriate representations, analyze and summarize data using measures of central tendency and variation, and evaluate methods and conclusions MPS Learning Target #5: Design and analyze experiments with simple and complex events, predict likelihood of outcomes, and justify strategies based on theoretical and experimental probabilities.
Wisconsin Assessment Framework for Mathematics Objective: E. Statistics and Probability Subskill: Data Analysis and Statistics Descriptor: Organize, display, compare and interpret data in a variety of ways in mathematical and real-world contexts e.g. histograms, line graphs, stem-and-leaf plots, scatter plots, box plots, bar graphs, Venn diagrams, tables, circle graphs. Objective: A. Mathematical Processes Descriptors: • Use reasoning and logic to perceive patterns, identify relationships, formulate questions, pose problems, make conjectures, justify strategies, and test reasonableness of results • Communicate mathematical ideas and reasoning using the vocabulary of mathematics in a variety of ways (e.g. using words, numbers, symbols, pictures, charts, tables, diagrams, graphs, and models). • Connect mathematics to the real world as well as within mathematics. • Create and use representations to organize, record, and communicate mathematical ideas. • Solve and analyze routine and non-routine problems. Your teacher has asked everyone in the class to measure their heights and arm spans. That data is shown in the table below.
Page 1 of 2
Height (inches) Arm Span (inches) 67 65 61 60 68 69 61 63 63 60 66 64 62 59 64 64 69 70 72 70 68 66 71 72 66 65 60 59 65 66 63 64 67 67 65 63 64 65 66 67 67 68

Construct a scatter plot using the data from the table.
Developed by the Milwaukee Mathematics Partnership (MMP) with support by the National Science Foundation under Grant No. 0314898.
Page 2 of 2
Identify a relationship between the two variables.

Name __________________________________________________________ Date _______________________
Mathematics Grade 8 Classroom Assessment Based on Standards
Power CABS Identifier: “Histogram”
MPS Learning Target: Statistics and Probability MPS Learning Target #4: Design and conduct investigations, display data using appropriate representations, analyze and summarize data using measures of central tendency and variation, and evaluate methods and conclusions MPS Learning Target #5: Design and analyze experiments with simple and complex events, predict likelihood of outcomes, and justify strategies based on theoretical and experimental probabilities.
Wisconsin Assessment Framework for Mathematics Objective: E. Statistics and Probability Subskill: Data Analysis and Statistics Descriptor: Organize, display, compare and interpret data in a variety of ways in mathematical and real-world contexts e.g. histograms, line graphs, stem-and-leaf plots, scatter plots, box plots, bar graphs, Venn diagrams, tables, circle graphs. Objective: A. Mathematical Processes Descriptors: • Connect mathematics to the real world as well as within mathematics. • Create and use representations to organize, record, and communicate mathematical ideas. • Solve and analyze routine and non-routine problems. A survey was taken by Mary outside her town’s local movie theater on a Friday night. She asked the first 90 people going into the theater their ages and recorded their responses in a frequency table. Place the following 10 ages into the table below:
22 24 29 30 8 47 48 31 29 51
Age Group Frequency 0-9
10-19 20-29 30-39 40-49 50-59 60-69 70-79
Page 1 of 2

Using the information from the frequency table on page 1, construct a histogram.
Most of the movie goers are between what ages: _________________________
Developed by the Milwaukee Mathematics Partnership (MMP) with support by the National Science Foundation under Grant No. 0314898.
Page 2 of 2
How could this information be useful to the theater’s management to make a profit?