Embed Size (px)
Citation preview
1
Grass Seed Fertility
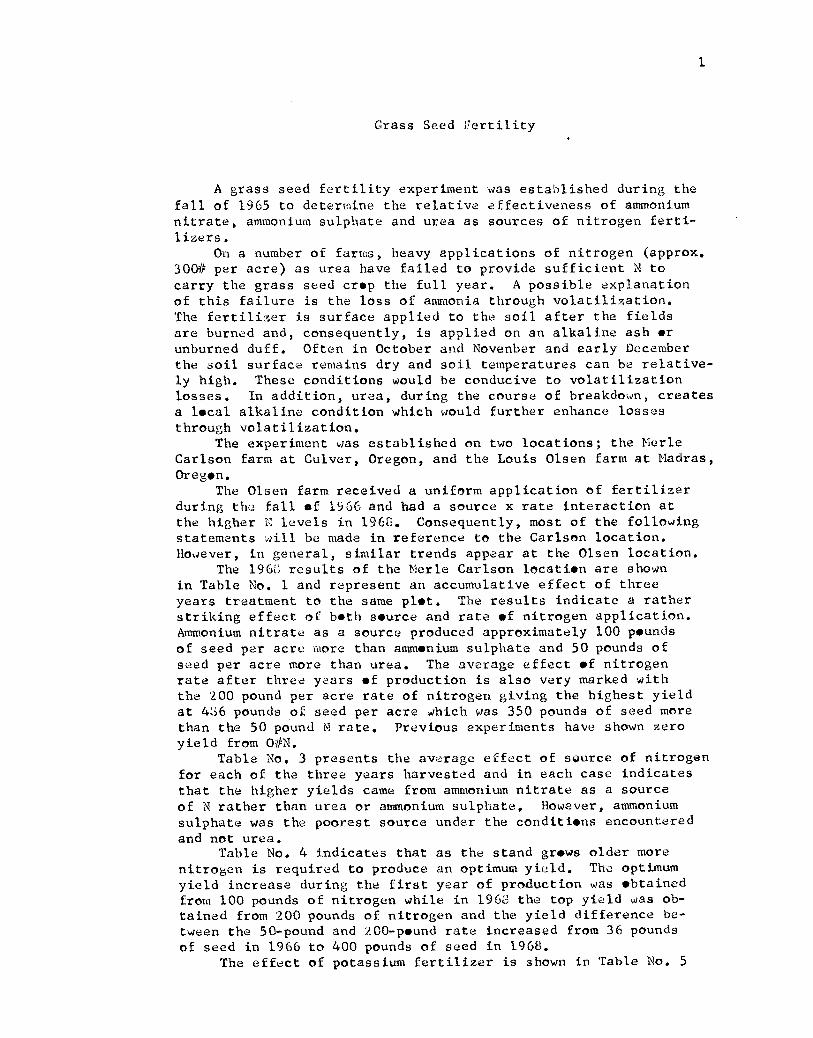
A grass seed fertility experiment was established during thefall of 1965 to determine the relative effectiveness of ammoniumnitrate, ammonium sulphate and urea as sources of nitrogen ferti-lizers.
On a number of farms, heavy applications of nitrogen (approx.300# per acre) as urea have failed to provide sufficient N tocarry the grass seed crop the full year. A possible explanationof this failure is the loss of ammonia through volatilization.The fertilizer is surface applied to the soil after the fieldsare burned and, consequently, is applied on an alkaline ash orunburned duff. Often in October and Novenber and early Decemberthe soil surface remains dry and soil temperatures can be relative-ly high. These conditions would be conducive to volatilizationlosses. In addition, urea, during the course of breakdown, createsa local alkaline condition which would further enhance lossesthrough volatilization.
The experiment was established on two locations; the MerleCarlson farm at Culver, Oregon, and the Louis Olsen farm at Madras,Oregon.
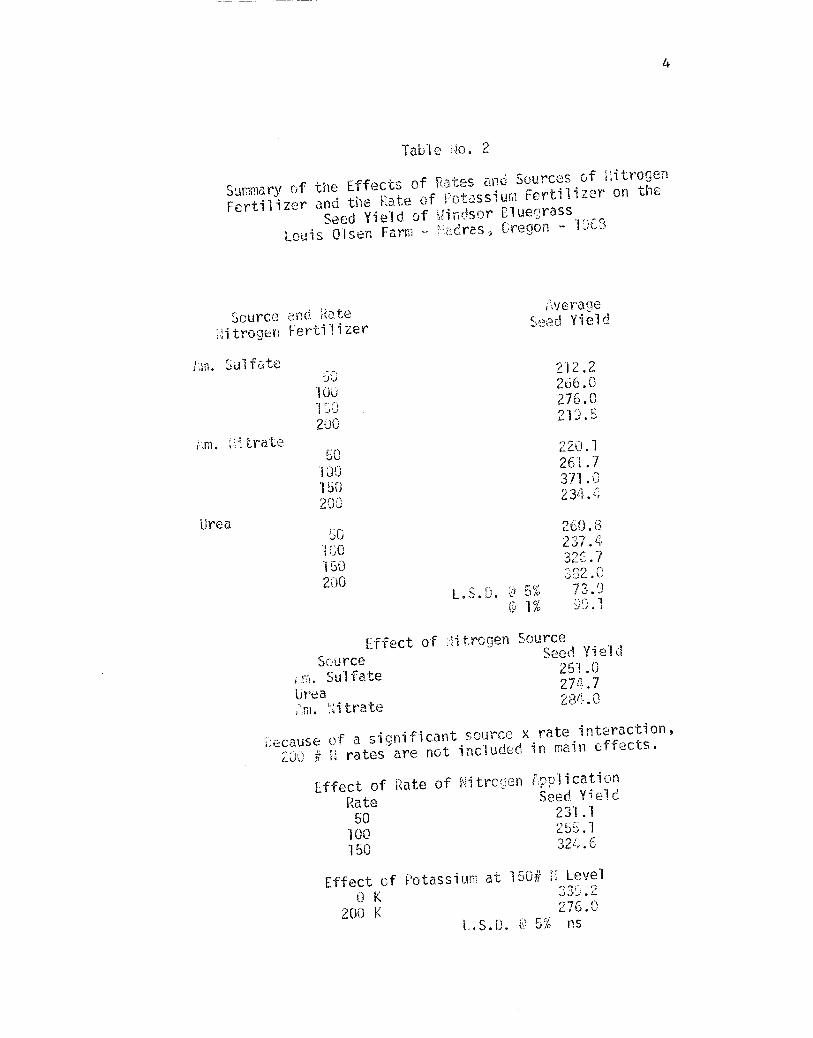
The Olsen farm received a uniform application of fertilizerduring the fall of 1966 and had a source x rate interaction atthe higher N levels in 196S. Consequently, most of the followingstatements will be made in reference to the Carlson location.However, in general, similar trends appear at the Olsen location.
The 1963 results of the Merle Carlson location are shownin Table No. 1 and represent an accumulative effect of threeyears treatment to the same plot. The results indicate a ratherstriking effect of both source and rate of nitrogen application.Ammonium nitrate as a source produced approximately 100 poundsof seed per acre more than ammonium sulphate and 50 pounds ofseed per acre more than urea. The average effect of nitrogenrate after three years of production is also very marked withthe 200 pound per acre rate of nitrogen giving the highest yieldat 466 pounds of seed per acre which was 350 pounds of seed morethan the 50 pound N rate. Previous experiments have shown zeroyield from 0#N.
Table No. 3 presents the average effect of source of nitrogenfor each of the three years harvested and in each case indicatesthat the higher yields came from ammonium nitrate as a sourceof N rather than urea or ammonium sulphate. However, ammoniumsulphate was the poorest source under the conditions encounteredand not urea.
Table No. 4 indicates that as the stand grows older morenitrogen is required to produce an optimum yield. The optimumyield increase during the first year of production was obtainedfrom 100 pounds of nitrogen while in 1963 the top yield was ob-tained from 200 pounds of nitrogen and the yield difference be-tween the 50-pound and 200-pound rate increased from 36 poundsof seed in 1966 to 400 pounds of seed in 1968.
The effect of potassium fertilizer is shown in Table No. 5
2
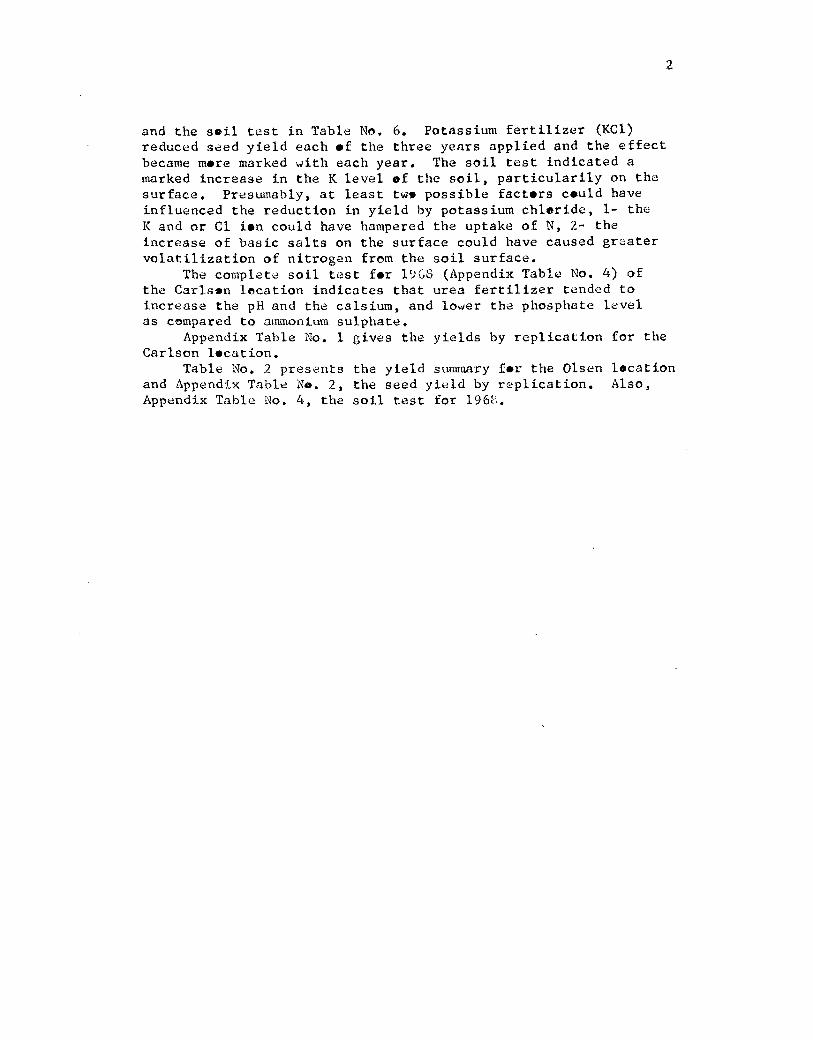
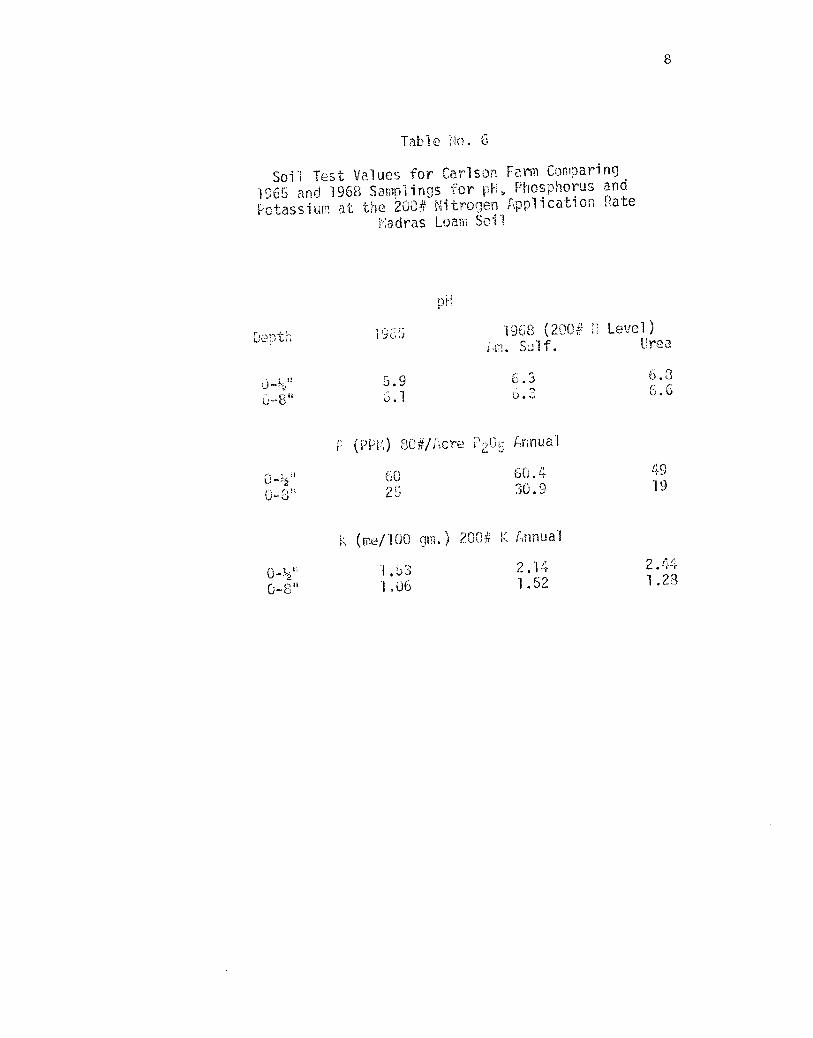
and the soil test in Table No. 6. Potassium fertilizer (KC1)reduced seed yield each of the three years applied and the effectbecame more marked with each year. The soil test indicated amarked increase in the K level of the soil, particularily on thesurface. Presumably, at least two possible factors could haveinfluenced the reduction in yield by potassium chloride, 1- theK and or Cl ion could have hampered the uptake of N, 2- theincrease of basic salts on the surface could have caused gratervolatilization of nitrogen from the soil surface.
The complete soil test for 1963 (Appendix Table No. 4) ofthe Carlson location indicates that urea fertilizer tended toincrease the pH and the calsium, and lower the phosphate levelas compared to ammonium sulphate.
Appendix Table No. 1 gives the yields by replication for theCarlson location.
Table No. 2 presents the yield summary for the Olsen locationand Appendix Table No. 2, the seed yield by replication. Also,Appendix Table No. 4, the soil test for 196;:'..
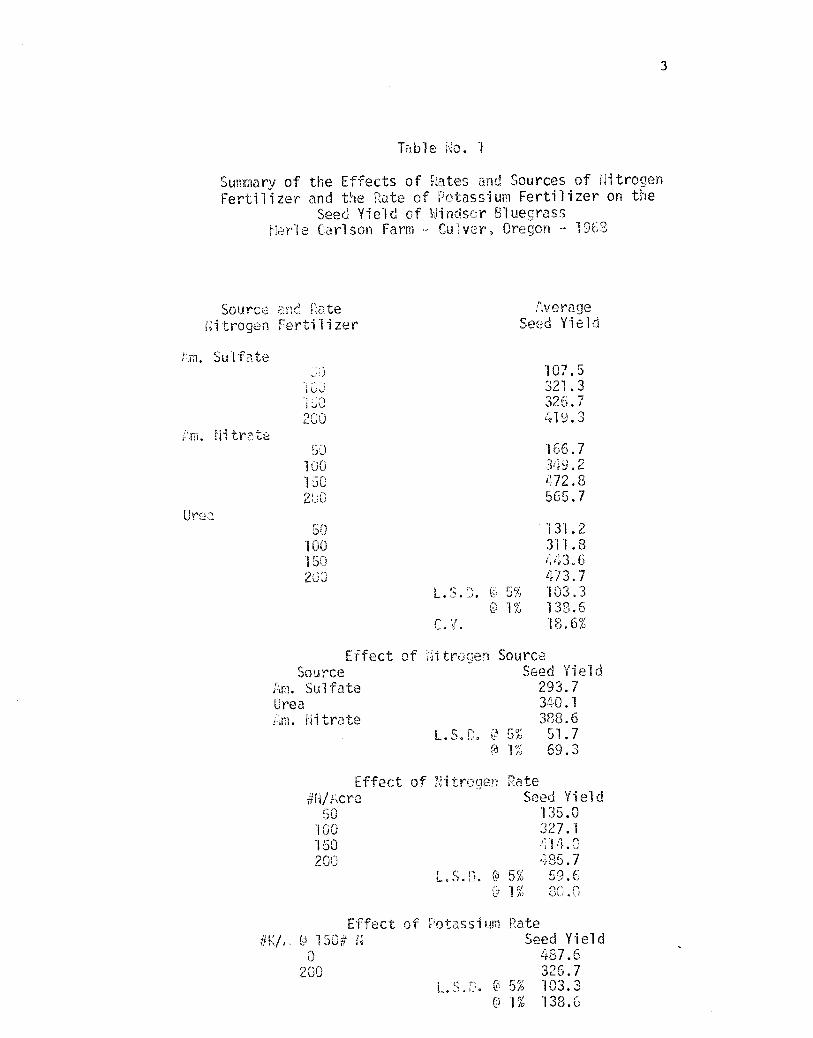
Table No. 1
Summary of the Effects of Rates and Sources of NitrogenFertilizer and the Rate of Potassium Fertilizer on the
Seed Yield of Windsor BluegrassMerle Carlson Farm - Culver, Oregon - 1963
Source and RateNitrogen Fertilizer
fra. Sulfate
AverageSeed Yield
107.516j 321.3
325.7200 119.3
Am. Nitrate50 166.7
100 349.2150 472.8200 565.7
Urea50 131.2
100 311.8150 443.6200 473.7
L.S.D. 0 5% 103.31% 135.6
C.V. 18.6%
Effect of ,:itrucen SourceSource Seed Yield
;,m. Sulfate 293.7Urea 340.1
tr.,. Nitrate 388.6
L.S.F. 0 5% 51.78 1% 69.3
Effect of Nitrogen Rate
#N/i,cre Seed Yield50 135.0
100 327.1150 414.0200 485.7
L.S.D. CO 5% 59.6
@ 1% 50.0
Effect of Potassium Rate
0 150# N Seed Yield487.6
200 326.7L.S.P. 0 5% 103.3
6 1% 138.6
3
4
Table No. 2
Summary of the Effects of Rates and Sources of 0itrogenFertilizer and the Rate of Potassium Fertilizer on the
Seed Yield of Windsor BluegrassLouis Olsen Farm - :3.dras, Oregon - 19E3
Source and RateNitrogen Fertilizer
fa. Sulfate60
vergeSeed Yield
212.2
100266.0
130276.0
m. itrate
200
50
213.6
220.1
100261.7
150371.0
200234.[„
Urea50
260.8,1-y-1,
160C.,Y1. --v
150326.7
200L.S.D. 0 5%
302.673.9
L I/O 90.1
Source
in. Sulfate 251.0274.7
Urea•
47'n. Nitrate 284.0
ecause of a significant source x rate interaction,
230 # 0 rates are not included in main effects.
Effect of Rate of Nitrogen i',oplication
Rate Seed Yield
50 231.1
100 255.1
150 32t.6
Effect of Potassium at 150# 0 Level
0 K 330.2
200 K 276.0L.S.D. 6 5% ns
Effect of Aitrogen SourceSeed Yield

Table o. 3
Sumary of the Effect of Nitrogen Source on theYield of Windsor Bluegrass Seed for the
Years 1936 - 1968 InclusiveMerle Carlson Farm - Culver, Oregon
1966
source of N Tvrage Seed Ylc, 11
M. SulfateUrean. itrate
1967
3323/23
+25
Tm. Sulfate 808
Urea812
Iv. Nitrate 822 +14
1952
Sulfate 291.
Um,aSm. Nitrate
340320 +95**
5
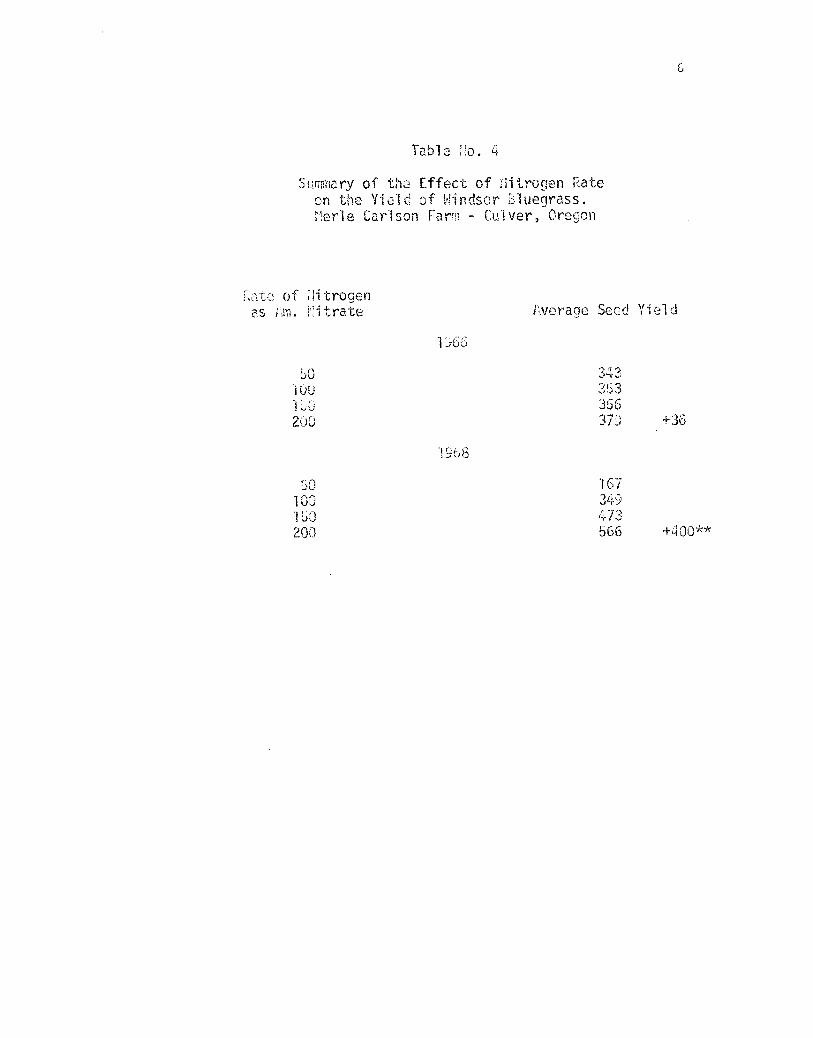
Table o. 4
Summary of the Effect of flitrogen Rateon the Yield of Windsor Eluegrass..e_rie Carlson Farm - Culver, Oregon
Tat2 of Jitrogenas Am. 'itrate fAierage Seed Yield
b0 343
10 13 3S3356
200 370 +36
UL 67
100 34)
150 473
200 566 +400**

Table Ho. 5
Summary of the Effect of Potassium Fertilizeron the Yield of Windsor Bluegrass Seed Yiel-
Merle Carlson Farm - Culver, Oregon
K #Vere
iveregeSulf.)
Seed Yield
1 966
0 3G320 339 -24
L S.D. 0 5% ns
1967
987913 -74
L.S.P. 0 5% ns
196E;
0200 327 -161**
L.S.E. 0 5% 103.30 1% 138.6
7
8
Table No. 6
Soil Test Values for Carlson Farm Comparing1565 and 1968 Samplings for pH. Phosphorus andPotassium at the 200# Nitrogen Application Pate
Madras Loam Soil
pH
Upth 1965 1960 200# fl Level)[T1. Sul . Urea
6-8"
5.96.1
6.3C.6
(PPM) so#/kre P 2 O 5 Annual
6025 60.4
49
30.9
19
K (m:::/100 gm.) 200# K Annual
1.53 2.14 2.44
0-8" 1.06 1.52 1.23
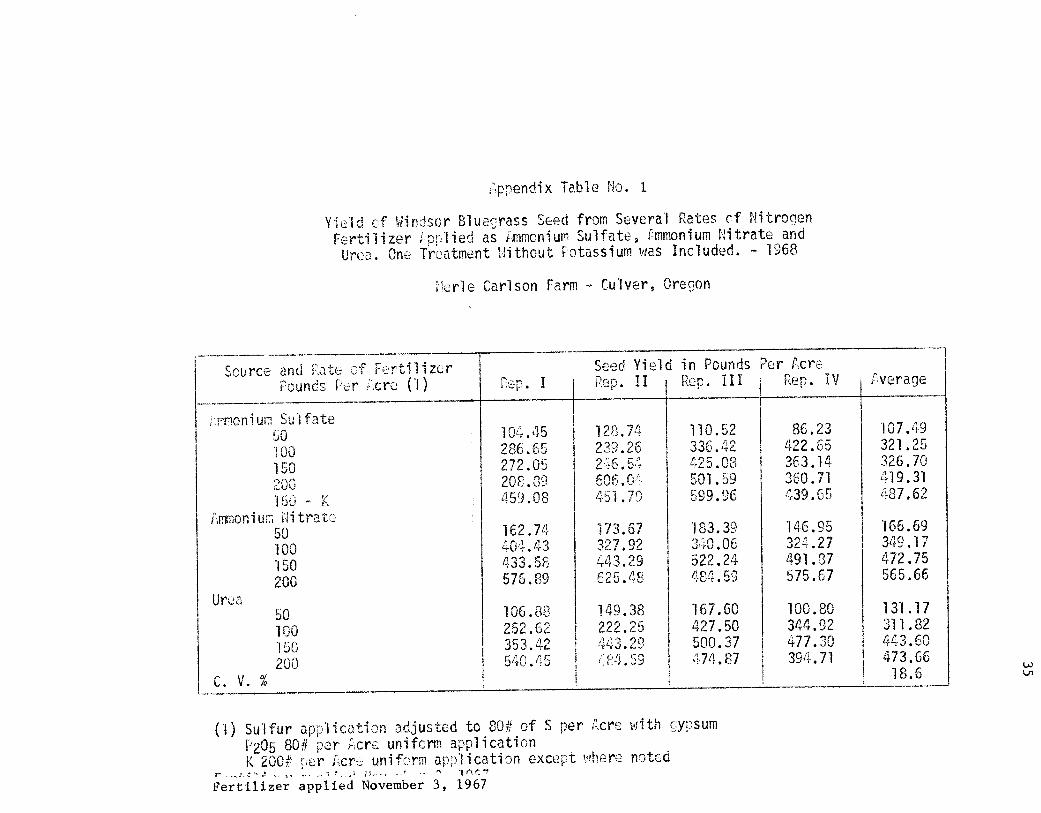
4pendix Table No.
Yield cf Windsor Bluegrass Seed from Several Rates of NitrorenFertilizer iprlied as immonium Sulfate, rmmonium Nitrate andUrea. One Treatment Without Potassium was Included. - 1968
Merle Carlson Farm - Culver, Oregon
Source and rate of FertilizerPounds Per Rcre (1) Pep. I
Seed YieldPep. II
in PoundsRep. III
Per kreRep. IV Tverage
. mnonium Sul fate50 104.45 122.74 110.52 86.23 107.49
100 286.55 239.26 336.42 422.65 321.25
150 272.05 2-6.54 425.03 363.14 326.70
200 203.83 606.04 501.59 360.71 419.31
150 - K 459.08 451.79 599.96 439.65 487.62
Lmnoniw-, Atrat:.-50 162.74 173.67 183.39 146.95 166.69
100 404.43 327.92 340.06 324.27 349.17
150 433.53 443.29 522.24 491.87 472.75
200 576.89 E25.48 124.59 575.67 565.66
Urea50 106.88 149.38 167.60 100.80 131.17
100 252.62 222.25 427.50 344.92 311.82
150 353.42 Afi ',01-..a.c..., 500.37 477.30 443.60
200 540.45 N.59 474.87 394.71 473.66
C . V. %18.6
(1) Sulfur application adjusted to 80# of S per r..cre with gypsumP205 80# per fcre uniform applicationK 200# per 1,cre uniform application except where noted
Fertilizer applied November 3, 1967
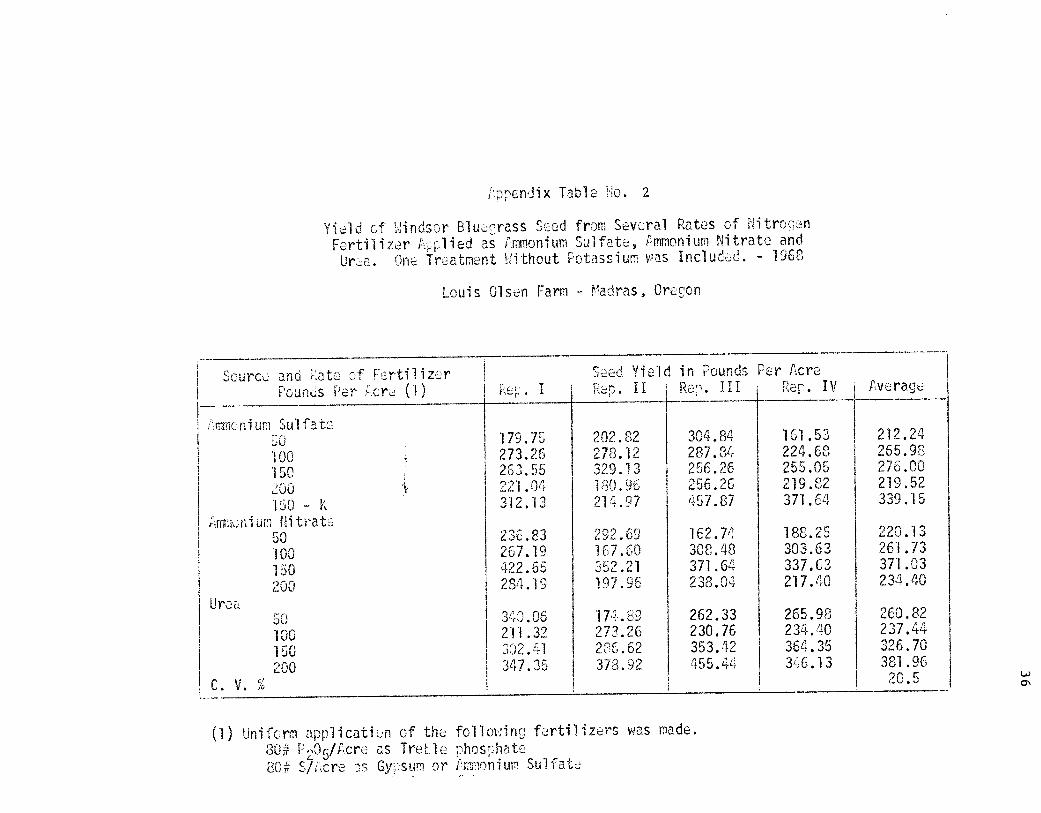
1ppendix Table No. 2
Yield of Windsor Bluerass Seed from Several Rates of NitroenFertilizer AliTlied as [Timonium Sulfate, [Timonium Nitrate andUrea. One Treatment Without Potassium was Included. - 1968
Louis Olsen Farm - Madras, Oredon
Source and P,ate of Fertilizer P oundsSeed Yield in rounes Per Acre Foams Per i cre (1) Ke, . I LLtn. li k'.:n. Ili re. IV hverci=je
mmcniun Sul fate50 179.75 202.82 304.84 161.53 212.24100 273.26 278.12 287.34 224.68 265.98150 263.55 329.13 256.26 255.05 273.00Zuti 221.04 190.9o' 256.26 219.82 219.52190 - K 312.13 214.37 457.87 371.64 339.15
Amrinium Nitrate50 236.83 292.69 162.74 188.25 220.13100 267.19 167.30 308.48 303.63 261.73150 422.66 352.21 371.64 337.63 371.03200 284.19 197.96 238.04 217.40 234.40
Urea90 340.06 17d.89 262.33 265.98 260.82100 211.32 273.26 230.76 234.40 237.44150 302.41 286.62 353.42 364.35 326.70200 347.35 373.92 455.44 3,6.13 381.96
C. V. % 20.5
(1) Uniform application of the following fertilizers was made.30# P 20 5/Acre as TreLle phosphate80# S/Acre os Gyosum or Ammonium Sulfate

37
Appendix Table No. 3
Soil Test Values from the Olsen Farm Takenin the Fall of 1968. Experimental Treatments
Applied During 1966 and 1968 Crop YearsMadras Loam Soil
200# N/Acre
pH P (PmDepth Am. Sulf. Urea fm. Sulf. Urea
6.0 6.6 98.2 87.00-8 5.9 6.3
me/100 gm.
30.9 19.7
K Ca MgDepth Am. Sulf. Urea 1.m. Sulf. Urea fm. Sulf. Ure a0-1/2" 2.48 2.44 6.6 9.1 --, r
..)...) ..::
0-3 1.41 1.03 7.5 9.4 4.8 5.3

38
Appendix Table Ho. 4
Soil Test Values from the Carlson Farm Takenin the Fall of 1968 After 3 Years of Experiment
Madras Loam Soil200# Wore
PH P (PPM)Depth ,fm. Sulf. Urea fm. Sulf. UreF
6.3 6.3 60.4 49. 104; u.3 6.6
me/100 gm.
30.9 19.6
K Ca MgDepth Am. Sulf. Urea Am. Sulf. Urea Am. Sulf. Urea0-1/2" 2.14 2.44 7.5 .10.4 3.8 I.(0-8 1.52 1.2E: 7.8 9.1 4.9 5.: