Embed Size (px)
Citation preview
Public Choice 54:3-18 (1987). © 1987 Martinus Nijhoff Publishers (Kluwer), Dordrecht. Printed in the Netherlands.
Government, special interest groups, and economic growth*
JOHN McCALLUM Department o f Economics, McGill University, 845 Sherbrooke St. W., Montreal, PQ, Canada, H3A 2T5
ANDRI~ BLAIS Department o f Political Science and Centre de Recherche et de Ddveloppement en Economie, Universitd de Montrdal
This study is concerned with the reasons why different countries have grown
at different rates over the past 25 years. The primary focus is on the role
of government and the role of special interest groups as emphasized by
Olson (1982). The paper is organized as follows. Part 1 sets out the basic
approach, Part 2 defines and discusses the variables, Part 3 presents empiri-
cal results, Part 4 attempts to reconcile the results with conflicting findings
of Weede (1984) and Landau (1985), Part 5 provides an interpretation of
the results, and Part 6 presents conclusions.
1. Basic approach
In discussing the reasons why growth rates have differed across countries,
it is useful to begin with a Denison-style growth accounting framework.
Taking the simplest form of production function, we may write:
= a + ~k + 3fi (1)
where jr is the growth rate of total output, / t is the rate of technical progress,
and 1~ and fl are respectively the growth rates of inputs of capital and labour.
Under constant returns to scale a and ~ sum to one. Hence the growth rate
depends on the growth rates of factor inputs and changes in technology or economic efficiency.
We consider three possible determinants of a + al~: (i) a catch-up variable
designed to capture a country's technological gap at the beginning of the
period in question (GAP); (ii) an Olson variable or variables (OLSON): and (iii) a set of variables representing the change or level of different
* We are grateful to David Conklin, David Laidler, Craig Riddell, John Sargent, and Dan Ush- er for their helpful comments and criticisms; to Philippe Laheurte for research assistance; and to FCAR and SSHRC for financial support. An earlier version of this paper was prepared as a study for Canada's Royal Commission on the Economic Union and Development Prospects for Canada (the Macdonald Commission).
categories of government spending or taxation (GOVT). The regressions are based on pooled time series cross-section data, and we include time and country dummy variables in cases where these play a statistically significant role. Under these procedures the equation to be estimated may be written in the general form:
= a0 + al GAP + a 2 0 L S O N + a3 GOVT + a4 fi + time and country intercept dummies
(2)
Two further considerations that are not incorporated in this equation will play an important role in our analysis. First, it is possible that the relation between government and economic growth is non-linear. Second, for rea- sons that will be discussed later in the paper, the size of the impact of GOVT on economic growth may depend on the power of special interest groups. This proposition can be tested by including the product of OLSON and GOVT as an additional explanatory variable.
Employment growth should not be treated as exogenous. In the first
place, government activities, which are the central concern of this paper, may influence labour supply and hence employment and output. Second, much of the growth literature (e.g. Cornwall, 1977) holds strongly to the view that employment growth depends largely on the growth process itself, with supply adjusting to demand through endogenous changes in immigra- tion, participation rates, and the sectoral composition of employment. For these reasons we began by estimating a two-equation system which included an employment growth equation as Well as the output growth equation (2). However, this effort was not very successful, and the results to be reported later in the paper are based on a more modest single-equation approach in which the growth rate of the working age population is used as an instru- ment for employment growth, with equation (2) estimated by two-stage least squares. This means that changes in participation rates and unemploy- ment rates are treated as endogenous, but variations in employment growth due to variations in the growth rate of the working age population are treat- ed as exogenous.
From the point of view of maximizing the number of observations, one might choose to estimate equation (2) using annual data for as many coun- tries as possible. It is our view, however, that results based on a sample that is dominated by third world countries tell us little or nothing about the role of government and special interest groups in industrial countries and that cyclical considerations are likely to dominate the results when the data are annual. 1 At the other extreme, a pure cross-section equation limited to in- dustrial countries cannot contain more than twenty or so observations, and the results are likely to be highly sensitive to the inclusion or exclusion of particular countries, notably Japan.

We adopt an intermediate approach, including 17 industrial countries and 4 time periods, for a total of 68 observations. We started with all of the
OECD countries and then excluded those which have not had democratic governments throughout the 1960s and 1970s (Greece, Portugal, Spain, Turkey, and Yugoslavia), as well as Iceland and Luxembourg which have populations of less than half a million people. New Zealand was excluded because much of the required data was not available for that country. This leaves us with Australia, Austria, Belgium, Canada, Denmark, Finland, France, F.R. Germany, Ireland, Italy, Japan, Netherlands, Norway, Sweden, Switzerland, United Kingdom, and United States. The four time periods are 1960-67, 1967-73, 1973-79, and 1979-83. The last of these periods may well be contaminated by cyclical elements, but it was forced on us by the fact that available data end in 1983. The sensitivity of the results to the inclusion of 1979-83 is tested below.
2. The variables
Unless otherwise stated, all data were taken from OECD, Historical Statis- tics, various issues. All data and sources are available from the authors on request. The dependent variable is the average annual percentage change of real gross domestic product or GDP. Initially the government variables in- cluded levels and changes of total government outlays, government final consumption expenditures, social security transfers, net lending of govern- ment, and total taxation. All of this data conforms to OECD definitions, and all government variables are measured as a percentage of GDP. Begin- ning of period values were used for levels of government variables.
In the course of the regression analysis, it rapidly became apparent that the only government variable whose level played any significant role was the social security payments variable (SS). However, because pensions are a large component of social security payments and because there are impor- tant cross-country differences in the age structure of the population, it is possible that cross-country differences in SS reflect largely demographic facts. For this reason we constructed an adjusted social security variable (SSA) that removes the influence of demographic factors on pension pay- ments. 2 The regression results to be reported below are based on this stan- dardized measure, although in fact the results based on SS and SSA were virtually identical.
Three different kinds of Olson variable were tried: (i) various measures, developed by Choi (1983), of the number of years since the first constitution or the 'consolidation of modernizing leadership', with adjustments for 'major disruptions'; (ii) estimates of the number of special interest groups calculated by Murrell (1984), with a population variable also included in the
6
equation; 3 and (iii) a unionization variable in combination with a variable indicating the degree to which wage bargaining is centralized.
This last measure is based on Olson's argument that the impact of interest groups varies according to their inclusiveness: centralized bargaining will reduce or even reverse the negative impact of strong unions on economic growth because centralized unions will be more likely to consider the macro- economic consequences of their actions. This composite variable, which is to be included in the output growth regressions, may be written as:
bOUNION(1 + bl CB)
where UNION is the percentage of the work force unionized and CB is an indicator of the degree to which wage bargaining is centralized (0_<CB_< 1). 4 The Olson theory implies that b0 and bl are both negative, and the above formulation implies that the impact of unionization on eco- nomic growth is positive or negative as CB is greater than or less than the absolute value of 1/bl.
The third and final variable to be defined is the catch-up or convergence indicator GAP. It is defined as the absolute value of the logarithm of the ratio of per capita GDP of country j to that of the United States, with data from Kravis et al. (1979). Hence GAP is always zero for the United States, and it is a negative function of per capita GDP.
3. Empirical results
Results for four regression equations are presented in Table 1. Beginning with the regression reported in the first Column, the period of estimation is 1960-1979 (i.e. the three sub-periods 1960-68, 1968-73, and 1973-79, with the fourth sub-period 1979-83 excluded). The explanatory variables include: the beginning of period social security variable adjusted for demog- raphy (SSA); Choi's preferred indicator (his adjusted index B), which is a non-linear function of the beginning year of 'consolidation of modernizing leadership', adjusted for years of 'major disruption' (OLSON); the begin- ning to end of period change in the ratio of total government outlays to GDP (DG); the growth rate of total employment (fi), with the growth rate of working age population used as the instrument for fl; and the gap variable as defined above (GAP). In addition, the equation includes dummy varia- bles for the period 1973-79 and for Japan. No other time or country dum- my variables approached statistical significance.
The second equation differs from the first only in the replacement of OL- SON with the composite variable UNION and CBxUNION. The third equa- tion covers the full period 1960-83 (all four sub-periods). This equation
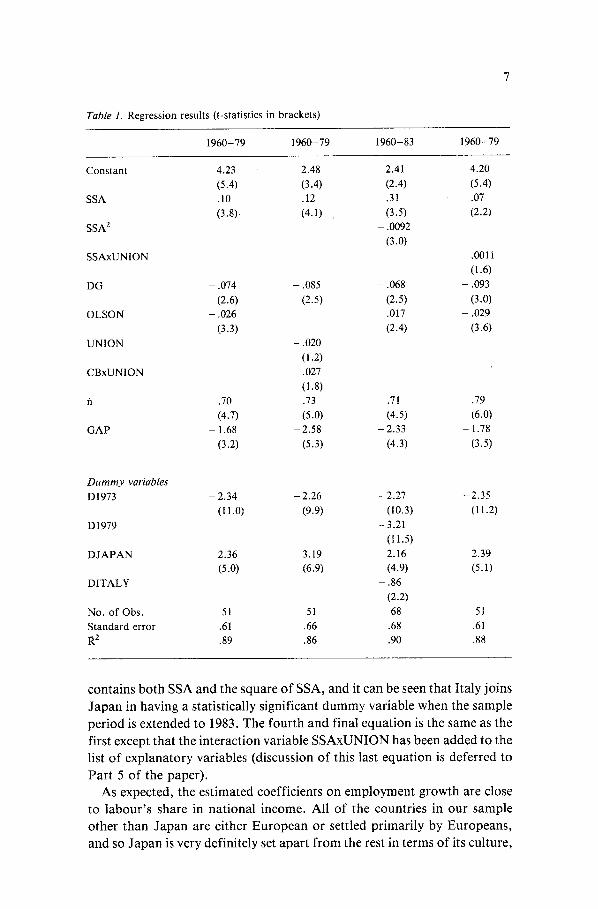
Table 1. R e g r e s s i o n resu l t s ( t - s ta t i s t i c s in b r a c k e t s )
1960-79 1960-79 1960-83 1960-79
C o n s t a n t
SSA
SSA 2
S S A x U N I O N
DG
O L S O N
U N I O N
C B x U N I O N
i¢1
G A P
4.23 2.48 2.41 4.20
(5.4) (3.4) (2.4) (5.4) .10 .12 .31 .07
(3 .8) (4.1) (3.5) (2.2)
- .0092
(3.0) .001I
(1.6)
- . 0 7 4 - . 0 8 5 - . 0 6 8 - . 0 9 3
(2.6) (2.5) (2.5) (3.0) - . 0 2 6 - . 0 1 7 - . 0 2 9
(3.3) (2.4) (3.6)
- .020
(1.2)
.027
(1.8) .70 .73 .71 .79
(4.7) (5.0) (4.5) (6.0)
- 1.68 - 2 . 5 8 - 2 . 3 3 - 1.78
(3.2) (5.3) (4.3) (3.5)
Dummy variables D1973 - 2.34 - 2.26 - 2.27 - 2.35
(11.0) (9.9) (10.3) (11.2)
D1979 - 3.21 (11.5)
D J A P A N 2.36 3.19 2.16 2.39 (5.0) (6,9) (4.9) (5.1)
D I T A L Y - .86 (2.2)
No. o f Obs . 51 51 68 51
S t a n d a r d error .61 .66 .68 .61 15. 2 .89 .86 .90 .88
contains both SSA and the square of SSA, and it can be seen that Italy joins Japan in having a statistically significant dummy variable when the sample period is extended to 1983. The fourth and final equation is the same as the first except that the interaction variable SSAxUNION has been added to the list of explanatory variables (discussion of this last equation is deferred to Part 5 of the paper).
As expected, the estimated coefficients on employment growth are close to labour's share in national income. All of the countries in our sample other than Japan are either European or settled primarily by Europeans, and so Japan is very definitely set apart from the rest in terms of its culture,
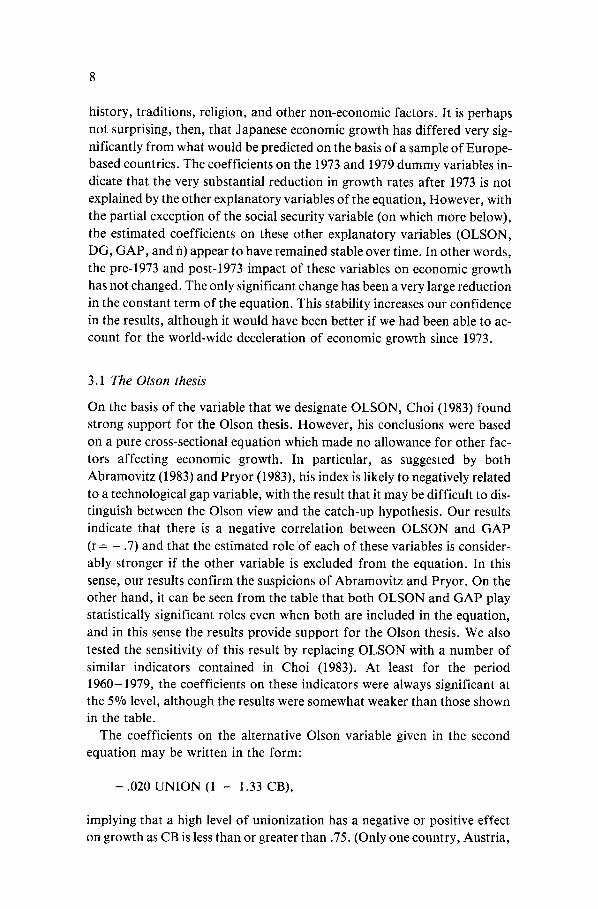
history, traditions, religion, and other non-economic factors. It is perhaps not surprising, then, that Japanese economic growth has differed very sig- nificantly from what would be predicted on the basis of a sample of Europe- based countries. The coefficients on the 1973 and 1979 dummy variables in- dicate that the very substantial reduction in growth rates after 1973 is not explained by the other explanatory variables of the equation, However, with the partial exception of the social security variable (on which more below), the estimated coefficients on these other explanatory variables (OLSON, DG, GAP, and fl) appear to have remained stable over time. In other words, the pre-1973 and post-1973 impact of these variables on economic growth has not changed. The only significant change has been a very large reduction in the constant term of the equation. This stability increases our confidence in the results, although it would have been better if we had been able to ac- count for the world-wide deceleration of economic growth since 1973.
3.1 The Olson thesis
On the basis of the variable that we designate OLSON, Choi (1983) found strong support for the Olson thesis. However, his conclusions were based on a pure cross-sectional equation which made no allowance for other fac- tors affecting economic growth. In particular, as suggested by both Abramovitz (1983) and Pryor (1983), his index is likely to negatively related to a technological gap variable, with the result that it may be difficult to dis- tinguish between the Olson view and the catch-up hypothesis. Our results indicate that there is a negative correlation between OLSON and GAP (r-- - .7) and that the estimated role o f each of these variables is consider- ably stronger if the other variable is excluded from the equation. In this sense, our results confirm the suspicions of Abramovitz and Pryor. On the other hand, it can be seen from the table that both OLSON and GAP play statistically significant roles even when both are included in the equation, and in this sense the results provide support for the Olson thesis. We also tested the sensitivity of this result by replacing OLSON with a number of similar indicators contained in Choi (1983). At least for the period 1960-1979, the coefficients on these indicators were always significant at the 5°70 level, although the results were somewhat weaker than those shown in the table.
The coefficients on the alternative Olson variable given in the second equation may be written in the form:
- . 0 2 0 UNION (1 - 1.33 CB),
implying that a high level of unionization has a negative or positive effect on growth as CB is less than or greater than .75. (Only one country, Austria,

satisfies the condition of CB > .75, although Sweden is right on the border- line with CB = .75 and Norway is very close with CB = .7.) This is certainly consistent with Olson's thesis regarding the inclusiveness of special interest groups. It may also be noted that UNION plays no role at all in explaining economic growth if the composite variable CBxUNION is omitted from the regression. However, it is also true that the explanatory power of this ap- proach to the Olson thesis is considerably weaker than the approach based on Choi's variable. While UNION and CBxUNION are jointly significant at the 5°70 level for the period 1960-79, this is not the case for the full period
1960-83. Our third and final test of the Olson thesis was based on the number of
special interest groups as calculated by Murrell (1984). This variable never played any significant role, whether it was entered as a logarithm or a natur- al number, with or without actual population or the log of population in- cluded in the regressions. One cannot be sure whether this negative result constitutes evidence against the Olson thesis or evidence against the Murrell proxy. We incline towards the latter view, partly because of the positive results produced by the two alternative indicators and partly because the im- pact of special interest groups is likely to depend more on the size and func- tions of those groups than on the number of groups. Austria and Switzerland, for example, stand out as countries having an exceptionally large number of special interest groups relative to population. It seems quite possible, however, that many or most of these groups are more involved in social or cultural activities at a local level than in activities such as govern- ment lobbying that might be classified as growth-inhibiting. Overall, we in- terpret our results as being quite supportive of the Olson thesis, certainly much more supportive than we expected.
3.2 The role of government
Table 1 indicates that the level of social security payments (SSA) has had a significant positive effect on economic growth, while the change in total
government outlays (DG) has had a much weaker negative effect. This last variable is treated as exogenous in the reported results. We also estimated equations in which beginning of period values of all of the different categories of government spending and taxation were used as instruments for DG, but under this formulation the estimated coefficient became very close to zero. For reasons that will be discussed below, the results for DG seem open to the charge of reverse causation, although conclusions regard- ing SSA may not be wholly immune from this possibility either.
Perhaps the most interesting finding of the paper concerns the role of the social security variable SSA. For the years to 1979, this variable had a con- sistently positive and apparently linear effect on economic growth. How-
10
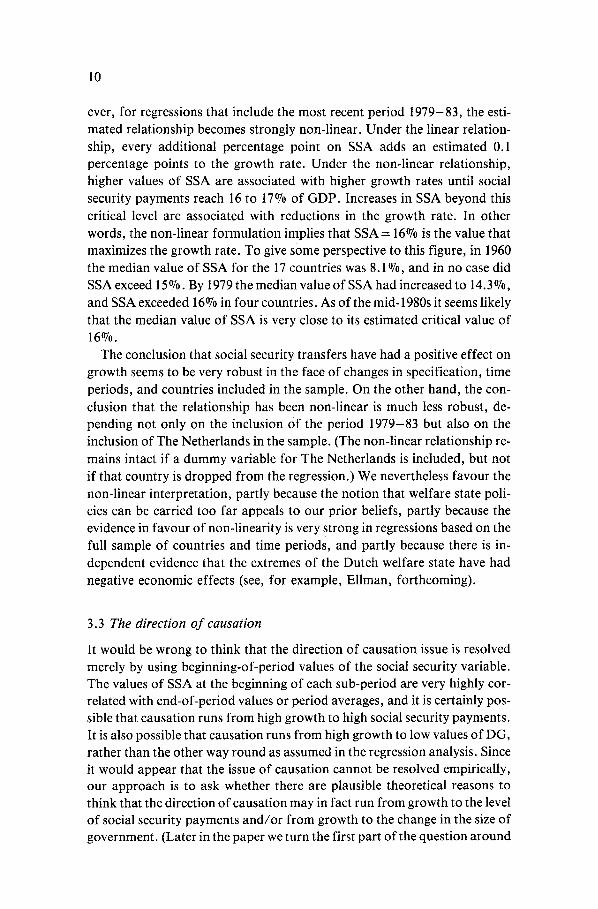
ever, for regressions that include the most recent period 1979-83, the esti- mated relationship becomes strongly non-linear. Under the linear relation- ship, every additional percentage point on SSA adds an estimated 0.1 percentage points to the growth rate. Under the non-linear relationship, higher values of SSA are associated with higher growth rates until social security payments reach 16 to 17°70 of GDP. Increases in SSA beyond this critical level are associated with reductions in the growth rate. In other words, the non-linear formulation implies that SSA = 16% is the value that maximizes the growth rate. To give some perspective to this figure, in 1960 the median value of SSA for the 17 countries was 8.1%, and in no case did SSA exceed 15%. By 1979 the median value of SSA had increased to 14.3%, and SSA exceeded 16% in four countries. As of the mid-1980s it seems likely that the median value of SSA is very close to its estimated critical value of 16%.
The conclusion that social security transfers have had a positive effect on growth seems to be very robust in the face of changes in specification, time periods, and countries included in the sample. On the other hand, the con-
clusion that the relationship has been non-linear is much less robust, de- pending not only on the inclusion Of the period 1979-83 but also on the inclusion of The Netherlands in the sample. (The non-linear relationship re-
mains intact if a dummy variable for The Netherlands is included, but not if that country is dropped from the regression.) We nevertheless favour the non-linear interpretation, partly because the notion that welfare state poli- cies can be carried too far appeals to our prior beliefs, partly because the evidence in favour of non-linearity is very strong in regressions based on the full sample of countries and time periods, and partly because there is in- dependent evidence that the extremes of the Dutch welfare state have had negative economic effects (see, for example, Ellman, forthcoming).
3.3 The direction of causation
It would be wrong to think that the direction of causation issue is resolved merely by using beginning-of-period values of the social security variable. The values of SSA at the beginning of each sub-period are very highly cor- related with end-of-period values or period averages, and it is certainly pos- sible that causation runs from high growth to high social security payments. It is also possible that causation runs from high growth to low values of DG, rather than the other way round as assumed in the regression analysis. Since it would appear that the issue of causation cannot be resolved empirically, our approach is to ask whether there are plausible theoretical reasons to think that the direction of causation may in fact run from growth to the level of social security payments and /or from growth to the change in the size of government. (Later in the paper we turn the first part of the question around
11
and ask whether there are plausible reasons to think that a large welfare
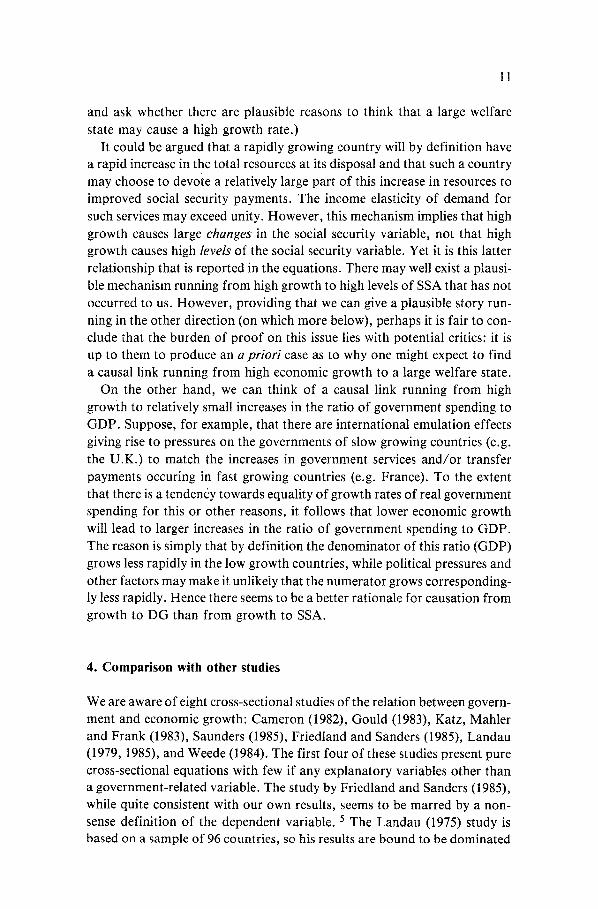
state may cause a high growth rate.) It could be argued that a rapidly growing country will by definition have
a rapid increase in the total resources at its disposal and that such a country may choose to devote a relatively large part of this increase in resources to improved social security payments. The income elasticity of demand for such services may exceed unity. However, this mechanism implies that high growth causes large changes in the social security variable, not that high growth causes high levels of the social security variable. Yet it is this latter relationship that is reported in the equations. There may well exist a plausi- ble mechanism running from high growth to high levels of SSA that has not occurred to us. However, providing that we can give a plausible story run- ning in the other direction (on which more below), perhaps it is fair to con- clude that the burden of proof on this issue lies with potential critics: it is up to them to produce an a priori case as to why one might expect to find a causal link running from high economic growth to a large welfare state.
On the other hand, we can think of a causal link running from high growth to relatively small increases in the ratio of government spending to GDP. Suppose, for example, that there are international emulation effects giving rise to pressures on the governments of slow growing countries (e.g. the U.K.) to match the increases in government services and /or transfer payments occuring in fast growing countries (e.g. France). To the extent that there is a tendency towards equality of growth rates of real government spending for this or other reasons, it follows that lower economic growth will lead to larger increases in the ratio of government spending to GDP. The reason is simply that by definition the denominator of this ratio (GDP) grows less rapidly in the low growth countries, while political pressures and other factors may make it unlikely that the numerator grows corresponding- ly less rapidly. Hence there seems to be a better rationale for causation from growth to DG than from growth to SSA.
4. Comparison with other studies
We are aware of eight cross-sectional studies of the relation between govern- ment and economic growth: Cameron (1982), Gould (1983), Katz, Mahler and Frank (1983), Saunders (1985), Friedland and Sanders (1985), Landau (1979, 1985), and Weede (1984). The first four of these studies present pure cross-sectional equations with few if any explanatory variables other than a government-related variable. The study by Friedland and Sanders (1985), while quite consistent with our own results, seems to be marred by a non- sense definition of the dependent variable. 5 The Landau (1975) study is based on a sample of 96 countries, so his results are bound to be dominated
12
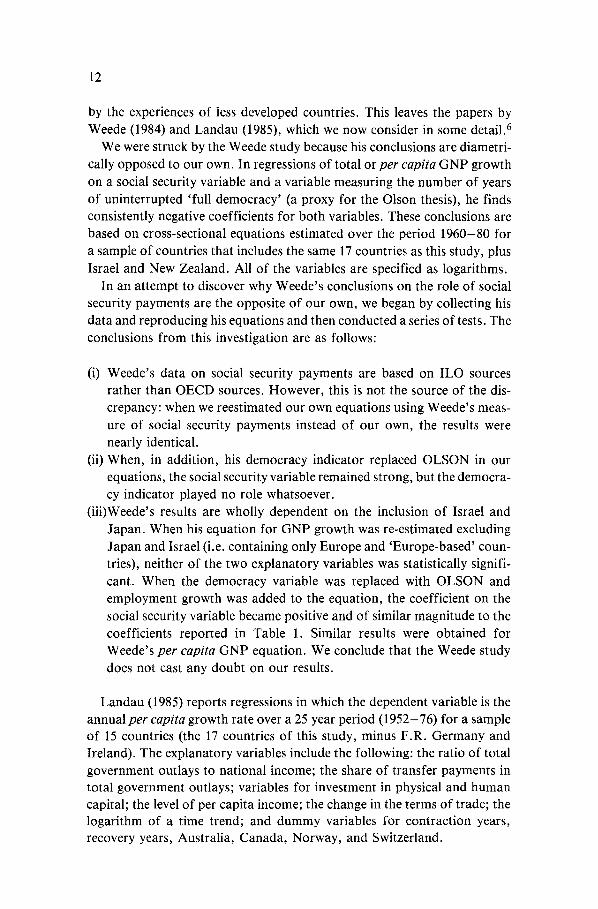
by the experiences of less developed countries. This leaves the papers by Weede (1984) and Landau (1985), which we now consider in some detail. 6
We were struck by the Weede study because his conclusions are diametri- cally opposed to our own. In regressions of total or per capita GNP growth on a social security variable and a variable measuring the number of years of uninterrupted 'full democracy' (a proxy for the Olson thesis), he finds consistently negative coefficients for both variables. These conclusions are based on cross-sectional equations estimated over the period 1960-80 for a sample of countries that includes the same 17 countries as this study, plus Israel and New Zealand. All of the variables are specified as logarithms.
In an attempt to discover why Weede's conclusions on the role of social security payments are the opposite of our own, we began by collecting his data and reproducing his equations and then conducted a series of tests. The conclusions from this investigation are as follows:
(i) Weede's data on social security payments are based on ILO sources rather than OECD sources. However, this is not the source of the dis- crepancy: when we reestimated our own equations using Weede's meas- ure of social security payments instead of our own, the results were nearly identical.
(ii) When, in addition, his democracy indicator replaced OLSON in our equations, the social security variable remained strong, but the democra- cy indicator played no role whatsoever.
(iii)Weede's results are wholly dependent on the inclusion of Israel and Japan. When his equation for GNP growth was re-estimated excluding Japan and Israel (i.e. containing only Europe and 'Europe-based' coun- tries), neither of the two explanatory variables was statistically signifi- cant. When the democracy variable was replaced with OLSON and employment growth was added to the equation, the coefficient on the social security variable became positive and of similar magnitude to the coefficients reported in Table 1. Similar results were obtained for Weede's per capita GNP equation. We conclude that the Weede study does not cast any doubt on our results.
Landau (1985) reports regressions in which the dependent variable is the annual per capita growth rate over a 25 year period (1952-76) for a sample of 15 countries (the 17 countries of this study, minus F.R. Germany and Ireland). The explanatory variables include the following: the ratio of total government outlays to national income; the share of transfer payments in total government outlays; variables for investment in physical and human capital; the level of per capita income; the change in the terms of trade; the logarithm of a time trend; and dummy variables for contraction years, recovery years, Australia, Canada, Norway, and Switzerland.
13
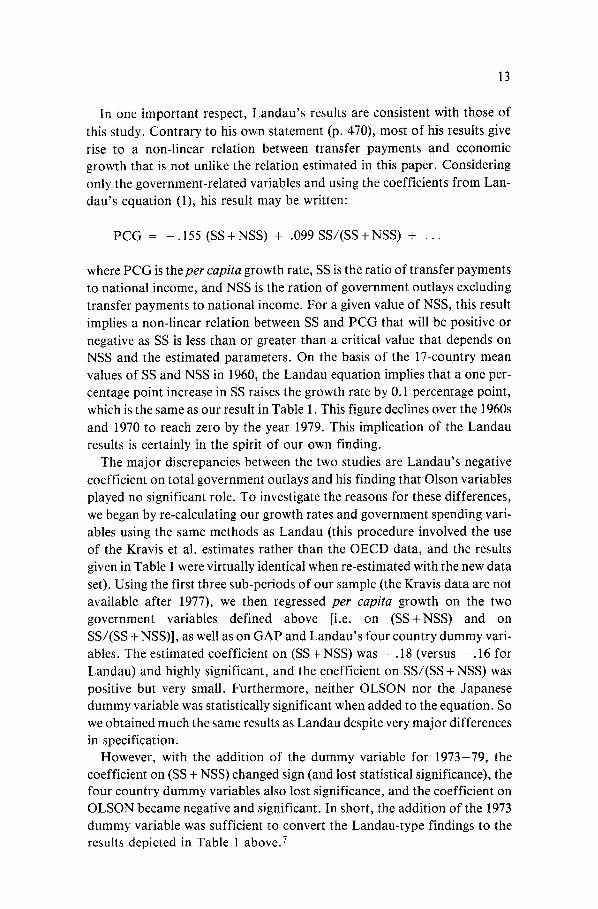
In one important respect, Landau's results are consistent with those of
this study. Contrary to his own statement (p. 470), most of his results give rise to a non-linear relation between transfer payments and economic growth that is not unlike the relation estimated in this paper. Considering only the government-related variables and using the coefficients from Lan- dau's equation (1), his result may be written:
PCG = - . 155 (SS+NSS) + .099SS/ (SS+NSS) + . . .
where PCG is the per capita growth rate, SS is the ratio of transfer payments to national income, and NSS is the ration of government outlays excluding transfer payments to national income. For a given value of NSS, this result implies a non-linear relation between SS and PCG that will be positive or negative as SS is less than or greater than a critical value that depends on NSS and the estimated parameters. On the basis of the 17-country mean values of SS and NSS in 1960, the Landau equation implies that a one per- centage point increase in SS raises the growth rate by 0.1 percentage point, which is the same as our result in Table 1. This figure declines over the 1960s
and 1970 to reach zero by the year 1979. This implication of the Landau results is certainly in the spirit of our own finding.
The major discrepancies between the two studies are Landau's negative coefficient on total government outlays and his finding that Olson variables played no significant role. To investigat e the reasons for these differences, we began by re-calculating our growth rates and government spending vari- ables using the same methods as Landau (this procedure involved the use of the Kravis et al. estimates rather than the OECD data, and the results given in Table 1 were virtually identical when re-estimated with the new data set). Using the first three sub-periods of our sample (the Kravis data are not available after 1977), we then regressed per capita growth on the two government variables defined above [i.e. on (SS+NSS) and on SS/(SS + NSS)], as well as on GAP and Landau's four country dummy vari- ables. The estimated coefficient on (SS + NSS) was - . 18 (versus - . 16 for Landau) and highly significant, and the coefficient on SS/(SS + NSS) was positive but very small. Furthermore, neither OLSON nor the Japanese dummy variable was statistically significant when added to the equation. So we obtained much the same results as Landau despite very major differences in specification.
However, with the addition of the dummy variable for 1973-79, the coefficient on (SS + NSS) changed sign (and lost statistical significance), the four country dummy variables also lost significance, and the coefficient on OLSON became negative and significant. In short, the addition of the 1973 dummy variable was sufficient to convert the Landau-type findings to the results depicted in Table 1 above. 7
14
We have devoted considerable effort to the task of reconciling our results
with other studies. As a result of this exercise we are convinced that the
results of this paper are robust, not only because the contrary findings seem to disappear with the inclusion of appropriate control variables, but also be-
cause our own results changed very little when we adapted our variables and sample periods to conform to the methods of these other studies.
5. Interpretation of results
Probably the conventional view is that while the welfare state may result in
greater equality and individual security, this is likely to come at the expense
of economic growth and efficiency. Our finding that the welfare state has in general been a positive factor in economic growth therefore comes as something of a surprise.
A first point to note is that if one applies the narrow calculus of tradition-
al microeconomics, it is difficult to see how a large welfare state could possi-
bly contribute to economic growth. Each and every aspect of the welfare state is likely to lead to inefficiencies of one kind or another in comparison with a Pareto optimal world of free markets and full information. But re-
cent thinking in economics suggests that the traditional scope of microeco-
nomics may be much too narrow. For example, in his study of institutional
change throughout history, North (1981) analyzes the costs and benefits of institutions in terms of their capacity to foster economic growth. Institu- tions that appear to be inefficient f rom a narrow economic standpoint are
shown to make a great deal of sense if one takes account of such factors as
the need to monitor the performance of employees, the need for a common
ideology, and the need to deal with the free rider problem. Our empirical results suggest that such broader considerations may also be applicable in
analyzing the impact of the welfare state, although the non-linear nature of the results suggests that the conventional distortions and disincentive effects
become increasingly important if the welfare state is permitted to absorb an
ever-increasing fraction of national income. In this section we consider two possible reasons why the welfare state may
have contributed to growth, the first relating to a climate of social consensus or social peace and the second to the welfare state as a mechanism for com- pensating those who would otherwise be the losers as a result of the continu- ous resource reallocations that economic growth demands.
The welfare state may assist in creating a climate of social consensus that results in better labour-management relations, greater political stability, a higher degree of cooperation among the social partners, and less alienation at the workplace. All of these factors may contribute to higher productivity and higher economic growth. Certainly a connection between the welfare

15
state and political stability was uppermost in the minds of the founders of the early welfare state when it was put in place in the late nineteenth century:
' T h e . . . proponents of the welfare state were thus moved b y . . . politi- cal considerations. The first was simply to maintain the stability of ex- isting political order. A hungry person, an unemployed person, a person suffering from a deep sense of injustice or insecurity was a danger to the state; social insurance was thought of as a suitable means of reconciling that person to the state' (King, 1983: 15).
Also, the idea that the welfare state may contribute to social consensus and that this in turn may foster economic growth is in the spirit of several recent studies which report a negative relation between the extent of deterio- ration in economic performance since 1973 and the degree of social consen- sus or 'corporatism' (e.g. Crouch, 1985; Bruno and Sachs, 1984; McCallum, 1983, 1986). Social consensus is measured by an indicator of long run strike rates, and corporatist countries are defined as those with highly centralized unions and employer federations, low shop floor autonomy, and wide- spread systems of works councils at the level of the firm. With the notable exceptions of Japan and Switzerland, high consensus/corporatist countries tend also to be the countries with highly developed welfare systems. Further- more, in the case of Japan, and perhaps also Switzerland, it could be argued that corporate paternalism is an effective substitute for the welfare state (on which more shortly).
5.1 Interaction between the welfare state and special interest groups
The second possible rationale for a positive relation between growth and the welfare state ties in with the role of special interest groups. Economic growth requires change, and perhaps the basic argument with respect to spe- cial interest groups is that they retard or prevent change by perpetuating the status quo. Given that special interest groups have accumulated significant power and influence over government policy, it is possible that the welfare state may help to facilitate growth and change by compensating those who would otherwise be losers in the growth process. If potential losers know that they will receive at least partial compensation for their losses, then they may offer less resistance to the resource reallocations that are required for economic growth. Unions, for example, are likely to provide less resistance to the introduction of new technology if they know that job losers will be well compensated and if there are effective job re-training programs and good job opportunities elsewhere in the economy. Public pensions may be seen as a socially acceptable way of forcing older workers to retire, thereby giving way to younger workers who will generally be more capable of
16
implementing new production methods. The essence of this hypothesis is an interaction between the power of spe-
cial interest groups to block change and the welfare state as a device to reduce the incentive to block change. One important advantage of the hypothesis is that it is consistent with both a positive role for the welfare state in the postwar western world and the fact that at other times and places growth rates were very high when there was no welfare state at all. In the heyday of nineteenth century capitalism, growth could proceed without the safety net provided by the welfare state because most of the losers from the
growth process had little or no power to resist change. Similarly, Japanese 'corporate paternalism' may be an effective substitute for the welfare state even though only the employees of large firms benefit from the system, since it is possible that it is only these employees that have the capacity to resist change. On pure efficiency grounds, it is not necessary to compensate losers who have no power to protect themselves. Nowadays, with the rise of special
interest groups and changing social norms, losers do have a measure of 19o- litical and economic power, and so policies that reduce these losses by 'buy- ing people off ' may be desirable not only on social and ethical grounds but also for reasons of efficiency and growth.
It is possible to test this hypothesis. Its logic suggests that the positive rela-
tion between growth and the welfare state should be stronger, the more powerful are special interest groups. If one assumes that the proportion of the work force unionized (UNION) is a satisfactory proxy for the power of special interest groups, the hypothesis can be tested by adding the interac- tion SSAxUNION to our regression equations. The coefficient on this new variable should be positive: the greater is the power of special interest groups to impede change (the larger is UNION), the greater will be the
potentially beneficial effect of the welfare state in reducing the incentive to impede that change. As can be seen from the last column of Table 1, the
estimated coefficient on SSAxUNION is positive as expected. As UNION varies between zero and 100°70, the estimated coefficient on SSA varies be- tween .07 and . 18. For our sample of 17 countries, the actual values of UN- ION range from 25% to 76070, implying coefficients on SSA in the range. 10 to .15. While the t-statistic associated with this coefficient is not terribly high (1.6), the coefficient is significantly greater than zero at a 5.7070 confi- dence level, which is only slightly larger than the conventional level of 5°70.
6. Conclusions
In descending order of robustness and strength, the four major conclusions are: (i) the experience of industrial countries in the postwar period indicates that a large welfare state has been associated with a high rate of economic
17
growth; (ii) the Olson thesis that powerful special interest groups impede growth receives empirical support; (iii) the relation between growth and the welfare state is non-linear, with increases in the size of the welfare state be- yond some critical level (one sixth of GDP according to our estimates) resulting in reductions rather than increases in the growth rates; and (iv) the strength of the growth-promoting properties of the welfare state is positive- ly related to the strength of special interest groups as proxied by the propor- tion of the work force unionized.
One possible interpretation of these results runs as follows. A large wel- fare state may retard economic growth by reducing the incentives to work, to save, to move, and to change. On the other hand, in a situation where special interest groups have aquired significant power to block change if they so desire, the welfare state, which offers assistance to those who are the victims of change, may play a growth-enhancing role in reducing the in- centive to block change. The fourth conclusion just stated supports this view. The welfare state may also foster economic growth through favour- able effects on social consensus, political stability, and labour-management relations. The results suggest that the growth-promoting forces predomi- nate as long as the welfare state is not too large, but beyond a certain point, which corresponds more or less to the median situation among developed countries today, the growth-retarding elements come to the fore.
NOTES
1. To illustrate this last point, it is interesting to compare the variance of the 20 annual growth rates of U.S. real GNP over the period 1960-79 with the variance of the 18 average growth rates of 18 industrial countries between 1960 and 1979. The U.S. time series variance exceeds
the cross-country variance by a factor of eleven if Japan is not one of the countries and by a factor of four when Japan is included. The data are f rom OECD, Historical Statistics, 1960-1981.
2. Specifically, SSA is defined as the sum of : (i) the pension component of SS multiplied by d/dj , where dj is the proport ion of the population aged 65 and over in country j and d is the mean value of dj for the seventeen countries; and (ii) the non-pension component of SS.
3. We are grateful to Professor Murrell for sending his data.
4. The union data are f rom Crouch (1985) and the centralized bargaining data f rom Blyth (1979).
5. The authors appear to convert each country 's nominal GNP into U.S. dollars at current ex-
change rates and then deflate the result by a U.S. price index. As a simple proof that this procedure is inappropriate, we note that the authors report that the average growth rate of real GDP for their 12 countries was + 17% for 1977 and - 16O7o for 1980 (their Table 1).
6. We have since come across a ninth study, that of Ram (1986). He finds a positive relation
between economic growth and government expenditures on goods and services, but he does not consider the impact of government transfer payments.
7. It might also be noted that the logarithm of a time trend, which Landau includes in his equa- tions, will be unable to capture a slowdown in growth in the latter part of his sample period, since the movement of the logarithm of time will be concentrated in the early years of the sample period.
18
REFERENCES
Abramovitz, M. (1983). Notes on international differences in productivity growth rates. In Mueller (1983).
Blyth, C.A. (1979). The interaction between collective bargaining and government policies in selected member countries. Collective bargaining and government policies. Paris: OECD.
Bruno, M., and Sachs, J. (1984). The economics o f worldwide stagflation. Cambridge: MIT Press.
Cameron, D. (1982). On the limits of the public economy. Annals o f the American Academy o f Political Science. (January): 46-63.
Choi, K. (1983). A statistical test of Olson's model. In Mueller (1983). Cornwall, J. (1977). Modern capitalism. New York: Sharpe+ Crouch, C. (1985). The conditions for trade union wage restraint. In L. Lindberg and C. Maier
(Eds.), The po6tics and sociology o f worm inflation. Washington: Brookings Institution. Ellman, M. (forthcoming). The crisis of the welfare state: The Dutch experience. In K. Bould-
ing (Ed.), The economics o f human betterment. Friedland, R., and Sanders, J. (1985). The public economy and economic growth in western
market economies. American Sociological Review 50 (August): 421-437. Gould, F. (1983). The development of public expenditures in western industrialized countries:
A comparative analysis. Public Finance. pp. 38-69. Katz, C., Mahler, V.A., and Franz, M.G. (1983). The impact of taxes on growth and distribu-
tion in developed capitalist countries: A cross-national study. American Political Science Review 77 (December).
King, A. (1983). The political consequences of the welfare state. In S.E. Spiro and E. Yuchtman-Yaar (Eds.). Evaluating the welfare state: Social and political perspectives. New York: Academic Press.
Kravis, I.P., Summers, R., and Heston, A. (1979). International comparisons of real product and its composition, 1950-1977. Review o f Income and Wealth, pp. 19-66.
Landau, D. (1983). Government expenditure and economic growth: A cross-country study. Southern Ffconomic Journal (January): 783-792.
Landau, D. (1985). Government expenditure and economic growth in the developed countries: 1952-76. Public Choice 447: 459-477.
McCallum, J. (1983). Inflation and social consensus in the seventies. Economic Journal (De- cember).
McCallum, J. (1986), Unemployment in OECD countries in the 1980s. Economic Journal (De- cember).
Mueller, D.C., Ed. (1983). The political economy of growth. New Haven: Yale University Press.
Murrell, P. (1984). An examination of the factors affecting the formation of interest groups in OECD countries. Public Choice 43. 151-171.
North, D.C. (1981). Structure and change in economic history. New York: Norton. Olson, M. (1982). The rise and decline o f nations. New Haven: Yale University Press. Pryor, F.L. (1983). A quasi-test of Olson's hypotheses. In Mueller (1983). Ram, R. (1986). Government size and economic growth: A new framework and some evidence
from cross-section and time-series data. American Economic Review 76 (March): 191-203. Saunders, P. (1985). Public expenditure and economic performance in OECD countries. Jour-
nal o f Public Policy 5: 1-21. Weede, E. (1984). Democracy, creeping socialism, and ideological socialism in rent-seeking so-
cieties. Public Choice 44: 349-366.